 |
| |
| |
| |
| |
| |
| |
|

| TissGeneSummary for AGMAT |
 Gene summary Gene summary |
| Basic gene information | Gene symbol | AGMAT |
| Gene name | agmatine ureohydrolase (agmatinase) | |
| Synonyms | - | |
| Cytomap | UCSC genome browser: 1p36.21 | |
| Type of gene | protein-coding | |
| RefGenes | NM_024758.4, | |
| Description | AUHagmatinase, mitochondrial | |
| Modification date | 20141207 | |
| dbXrefs | HGNC : HGNC | |
| HPRD : 12436 | ||
| Protein | UniProt: go to UniProt's Cross Reference DB Table | |
| Expression | CleanEX: HS_AGMAT | |
| BioGPS: 79814 | ||
| Pathway | NCI Pathway Interaction Database: AGMAT | |
| KEGG: AGMAT | ||
| REACTOME: AGMAT | ||
| Pathway Commons: AGMAT | ||
| Context | iHOP: AGMAT | |
| ligand binding site mutation search in PubMed: AGMAT | ||
| UCL Cancer Institute: AGMAT | ||
| Assigned class in TissGDB* | C | |
| Included tissue-specific gene expression resources | TiGER,GTEx | |
| Specific-tissues in normal samples (assigned by TissGDB using HPA, TiGER, and GTEx) | Kidney | |
| Cancer types related to the specific-tissues in cancer samples (assigned by TissGDB using TCGA) | KIRC,KIRP,KICH | |
| Reference showing the relevant tissue of AGMAT | ||
| Description by TissGene annotations | ||
| * Class A consists of genes with literature evidence and is part of the cTissGenes. Class B consists of only cTissGenes without additional evidence. The remaining genes belong to Class C. |
| Gene ontology having evidence of Inferred from Direct Assay (IDA) from Entrez |
| GO ID | GO term | PubMed ID |
| Top |
| TissGeneExp for AGMAT |
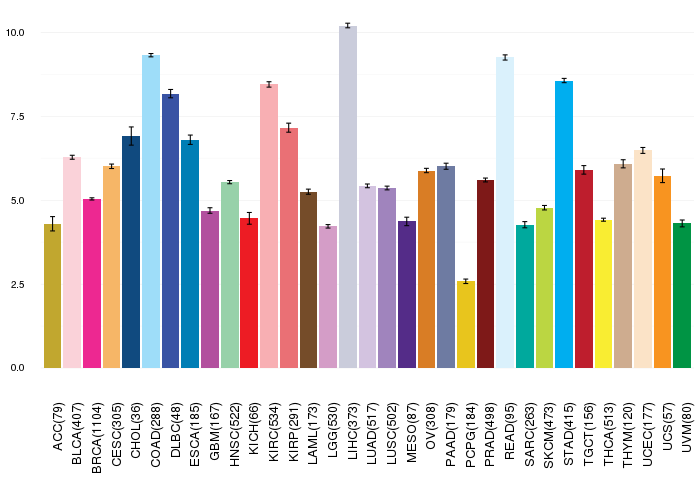
| Gene expressions across 28 cancer types (X-axis: cancer type and Y-axis: log2(norm_counts+1)) (TCGA IlluminaHiSeq_RNASeqV2, pan-cancer normalized log2(norm_counts+1) data, version 2016-08-16) |
 |
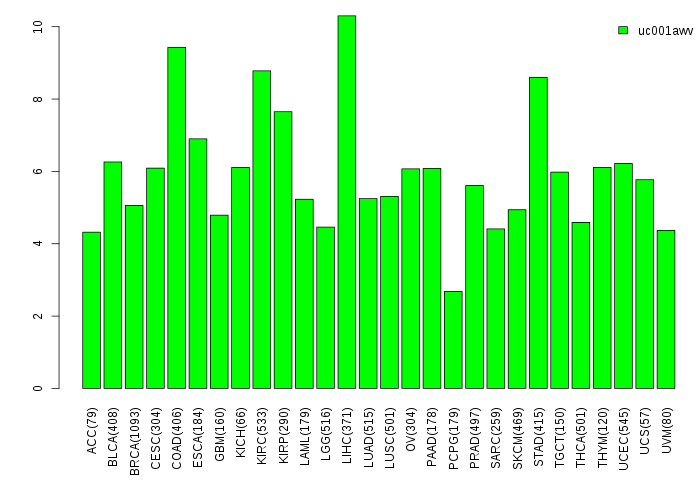
| Gene isoform expressions across 28 cancer types (X-axis: cancer type and Y-axis: log2(norm_counts+1)) (TCGA pan-cancer tcga_rsem_isoform_tpm, version 2016-09-01) |
 |
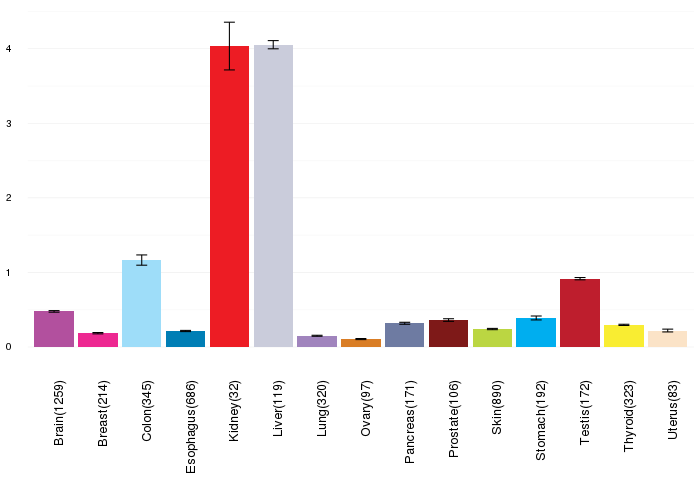
| Gene expressions across normal tissues of GTEx data (GTEx GTEx_Analysis_v6_RNA-seq_RNA-SeQCv1.1.8_gene_rpkm.gct) - Here, we shows the matched tissue types only among our 28 cancer types. |
 |
| Different expressions across 14 cancer types with more than 10 samples between matched tumors and normals (X-axis: cancer type and Y-axis: log2(norm_counts+1)) (TCGA IlluminaHiSeq_RNASeqV2, pan-cancer normalized log2(norm_counts+1) data, version 2016-08-16) |
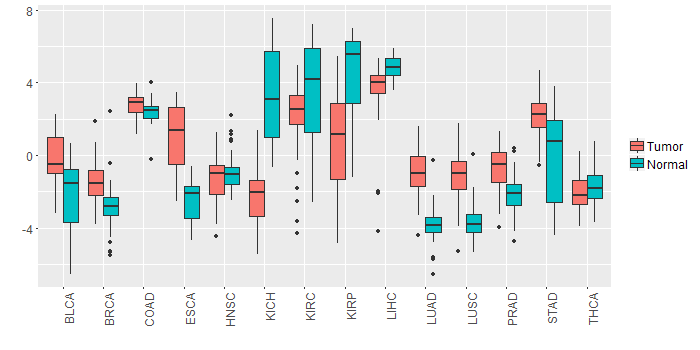 |
| - Significantly differentially expressed cancer types and information. (|Fold change|>1 and FDR<0.05) |
| Cancer type | Mean(exp) in tumor | Mean(exp) in matched normal | Log2FC | P-val. | FDR |
| LUSC | -1.163687341 | -3.667904988 | 2.504217647 | 5.66E-20 | 6.71E-19 |
| LIHC | 3.543345561 | 4.819047561 | -1.275702 | 1.29E-05 | 5.28E-05 |
| KIRP | 0.619295686 | 4.613405061 | -3.994109375 | 3.18E-08 | 2.19E-07 |
| BRCA | -1.49373507 | -2.833677175 | 1.339942105 | 3.19E-19 | 2.15E-18 |
| PRAD | -0.681786285 | -2.1002959 | 1.418509615 | 1.28E-09 | 1.95E-08 |
| LUAD | -0.980556576 | -3.812992783 | 2.832436207 | 3.28E-25 | 1.39E-23 |
| KICH | -2.303640439 | 3.269855561 | -5.573496 | 1.11E-11 | 1.05E-10 |
| BLCA | -0.141442965 | -2.195690333 | 2.054247368 | 0.00151 | 0.010024597 |
| ESCA | 0.979903925 | -2.401523348 | 3.381427273 | 0.000479 | 0.008952067 |
| KIRC | 2.172387006 | 3.484716173 | -1.312329167 | 0.00116 | 0.002169917 |
| STAD | 2.128223811 | -0.102179314 | 2.230403125 | 0.000121 | 0.000913185 |
| Top |
| TissGene-miRNA for AGMAT |
| Significantly anti-correlated miRNAs of TissGene across 28 cancer types (Gene-miRNA relations from TargetScanHuman Relsease 7.1, Conserved_Site_Context_Scores.txt.zip, 06.01.2016) (TCGA IlluminaHiSeq_miRNASeq, log2(RPM+1) data, version 2016-11-21) (TCGA IlluminaHiSeq_RNASeqV2, log2(normalized_count+1) data, version 2016-08-16) (Spearman’s Rank Correlation (p-value<0.05 and coefficient<-0.25)) |
| Cancer type | miRNA id | miRNA accession | P-val. | Coeff. | # samples |
| LUAD | hsa-miR-320b | MIMAT0005792 | 0.037 | -0.27 | 60 |
| Top |
| TissGeneMut for AGMAT |
| TissGeneSNV for AGMAT |
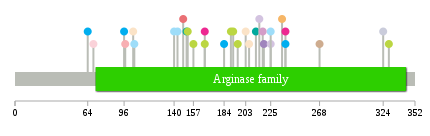
| nsSNV counts per each loci. Different colors of circles represent different cancer types. Circle size denotes number of samples. (TCGA somatic mutation (SNPs and small INDELs) data, version 2016-04-25) * Click on the image to enlarge it in a new window. |
 |
 |
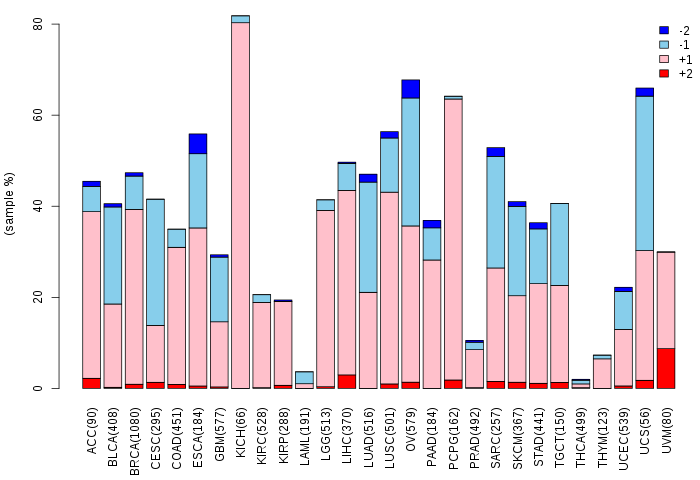
| Somatic nucleotide variants of TissGene across 28 cancer types (X-axis: cancer type and Y-axis: % of mutated samples) The numbers in parentheses are numbers of samples with mutation (nsSNVs). (TCGA somatic mutation (SNPs and small INDELs) data, version 2016-04-25) |
 |
| - nsSNVs sorted by frequency. |
| AAchange | Cancer type | # samples |
| p.E143D | COAD | 1 |
| p.G196E | SKCM | 1 |
| p.P324Q | LIHC | 1 |
| p.R238W | BRCA | 1 |
| p.R235K | CESC | 1 |
| p.V219M | LUSC | 1 |
| p.T190M | SKCM | 1 |
| p.L104F | UCEC | 1 |
| p.A150V | HNSC | 1 |
| p.I97T | KIRC | 1 |
| p.G212D | SARC | 1 |
| p.R238Q | STAD | 1 |
| p.R218H | LGG | 1 |
| p.R206H | UCEC | 1 |
| p.G152A | SKCM | 1 |
| p.E69K | BLCA | 1 |
| p.R140Q | COAD | 1 |
| p.D192N | SKCM | 1 |
| p.A203V | UCEC | 1 |
| p.T157I | SKCM | 1 |
| p.H201Q | DLBC | 1 |
| p.G268D | THYM | 1 |
| p.P167L | SKCM | 1 |
| p.P167L | BRCA | 1 |
| p.R96H | STAD | 1 |
| p.D126N | READ | 1 |
| p.G329R | SKCM | 1 |
| p.R225Q | LUAD | 1 |
| p.E248K | HNSC | 1 |
| p.D215Y | LUAD | 1 |
| p.R225W | COAD | 1 |
| p.V64L | STAD | 1 |
| p.V184M | STAD | 1 |
| p.A151D | SARC | 1 |
| p.G105R | COAD | 1 |
| p.I148F | KIRP | 1 |
| Top |
| TissGeneCNV for AGMAT |
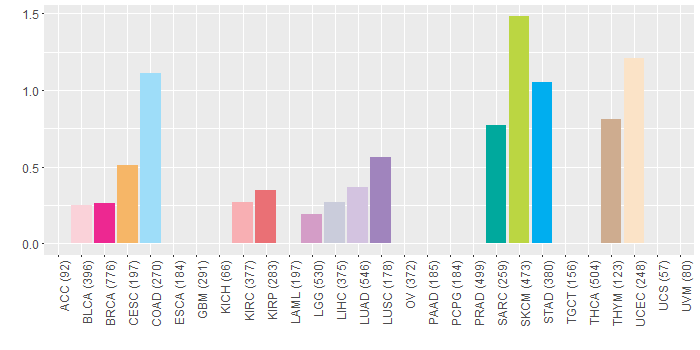
| Copy number variations of TissGene across 28 cancer types (X-axis: cancer type and Y-axis: % of CNV samples) (TCGA Gistic2_CopyNumber_Gistic2_all_data_by_genes, Gistic2 copy number data, version 2016-08-16) |
 |
| Top |
| TissGeneFusions for AGMAT |
| Fusion genes including TissGene (ChimerDB 3.0, 2016-12-01 and TCGA fusion Portal 2015-12-01) |
| Database | Src | Cancer type | Sample | Fusion gene | ORF | 5'-gene BP | 3'-gene BP |
| Top |
| TissGeneNet for AGMAT |
| Co-expressed gene networks based on protein-protein interaction data (CePIN) (TCGA IlluminaHiSeq_RNASeqV2, pan-cancer normalized log2(norm_counts+1) data, version 2016-08-16) (PINA2 ppi data) |
| Top |
| TissGeneProg for AGMAT |
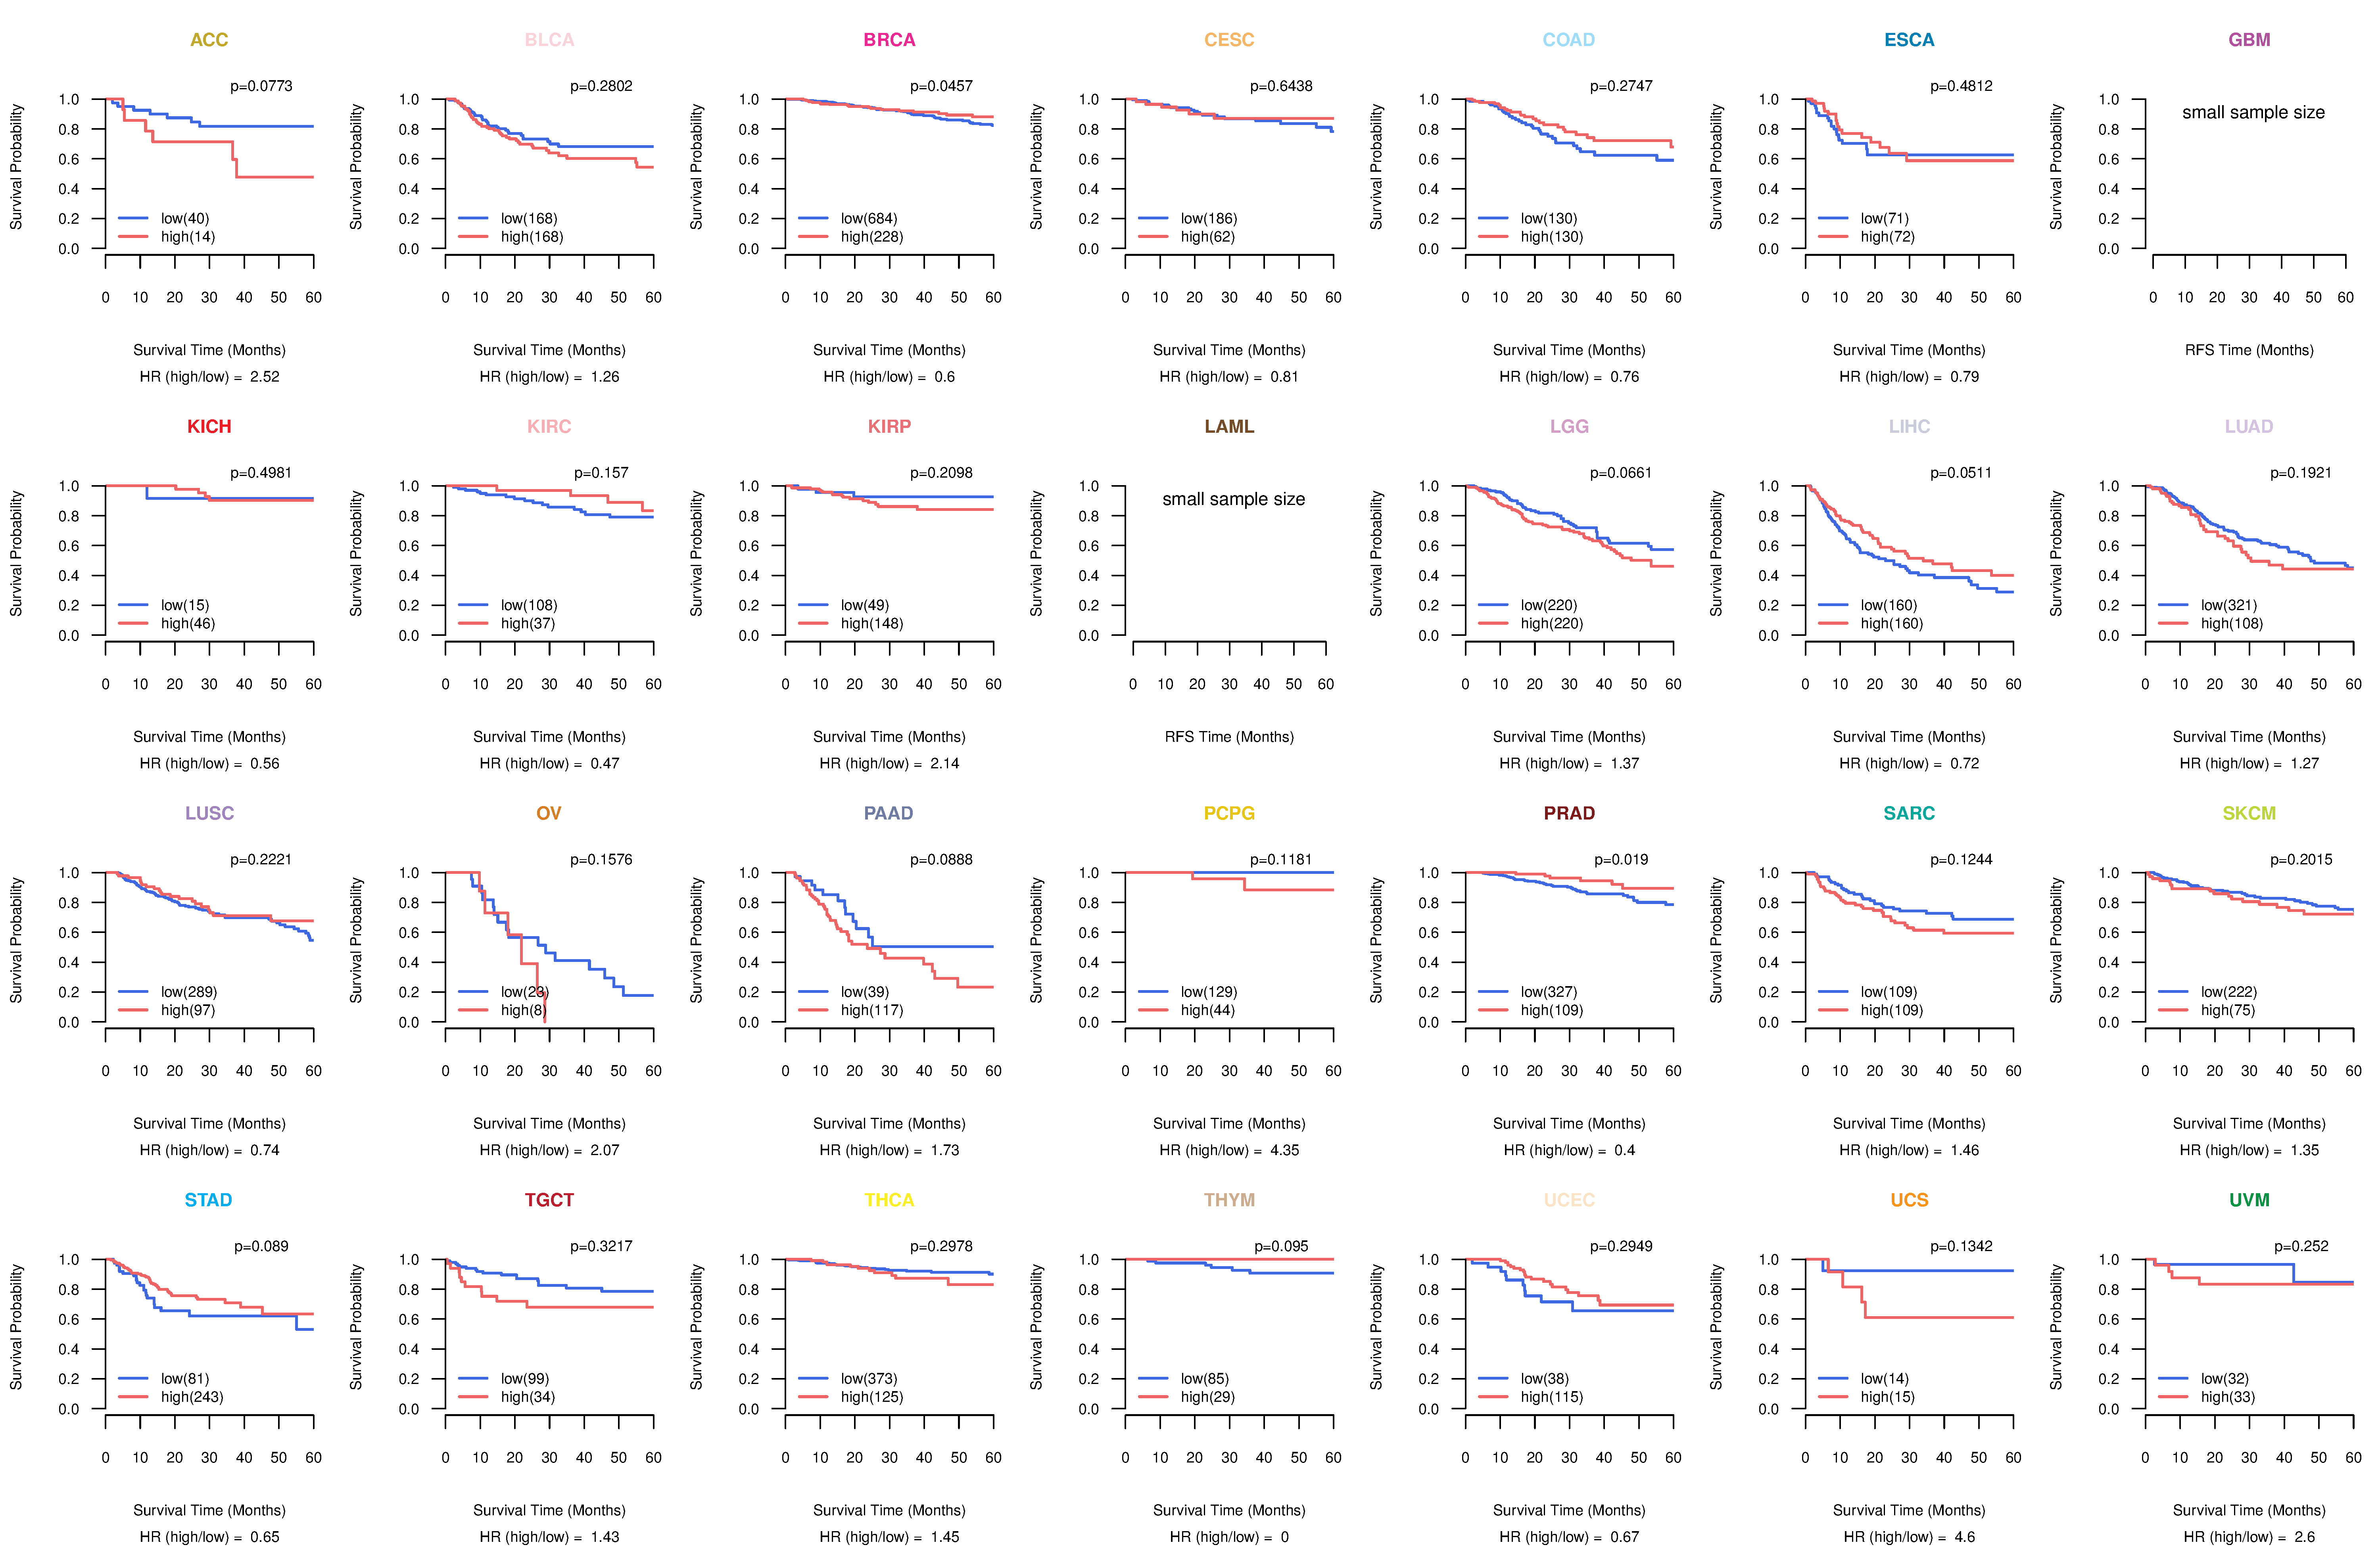
| Kaplan-Meier plots with logrank tests of overall survival (OS) using 28 cancer types (TCGA IlluminaHiSeq_RNASeqV2, pan-cancer normalized log2(norm_counts+1) data, version 2016-08-16) (TCGA clinicalMatrix, phenotype data, version 2016-04-27) * Click on the image to enlarge it in a new window. |
 |
| Kaplan-Meier plots with logrank test of relapse free survival (RFS) using 28 cancer types (TCGA IlluminaHiSeq_RNASeqV2, pan-cancer normalized log2(norm_counts+1) data, version 2016-08-16) (TCGA clinicalMatrix, phenotype data, version 2016-04-27) * Click on the image enlarge it in a new window. |
 |
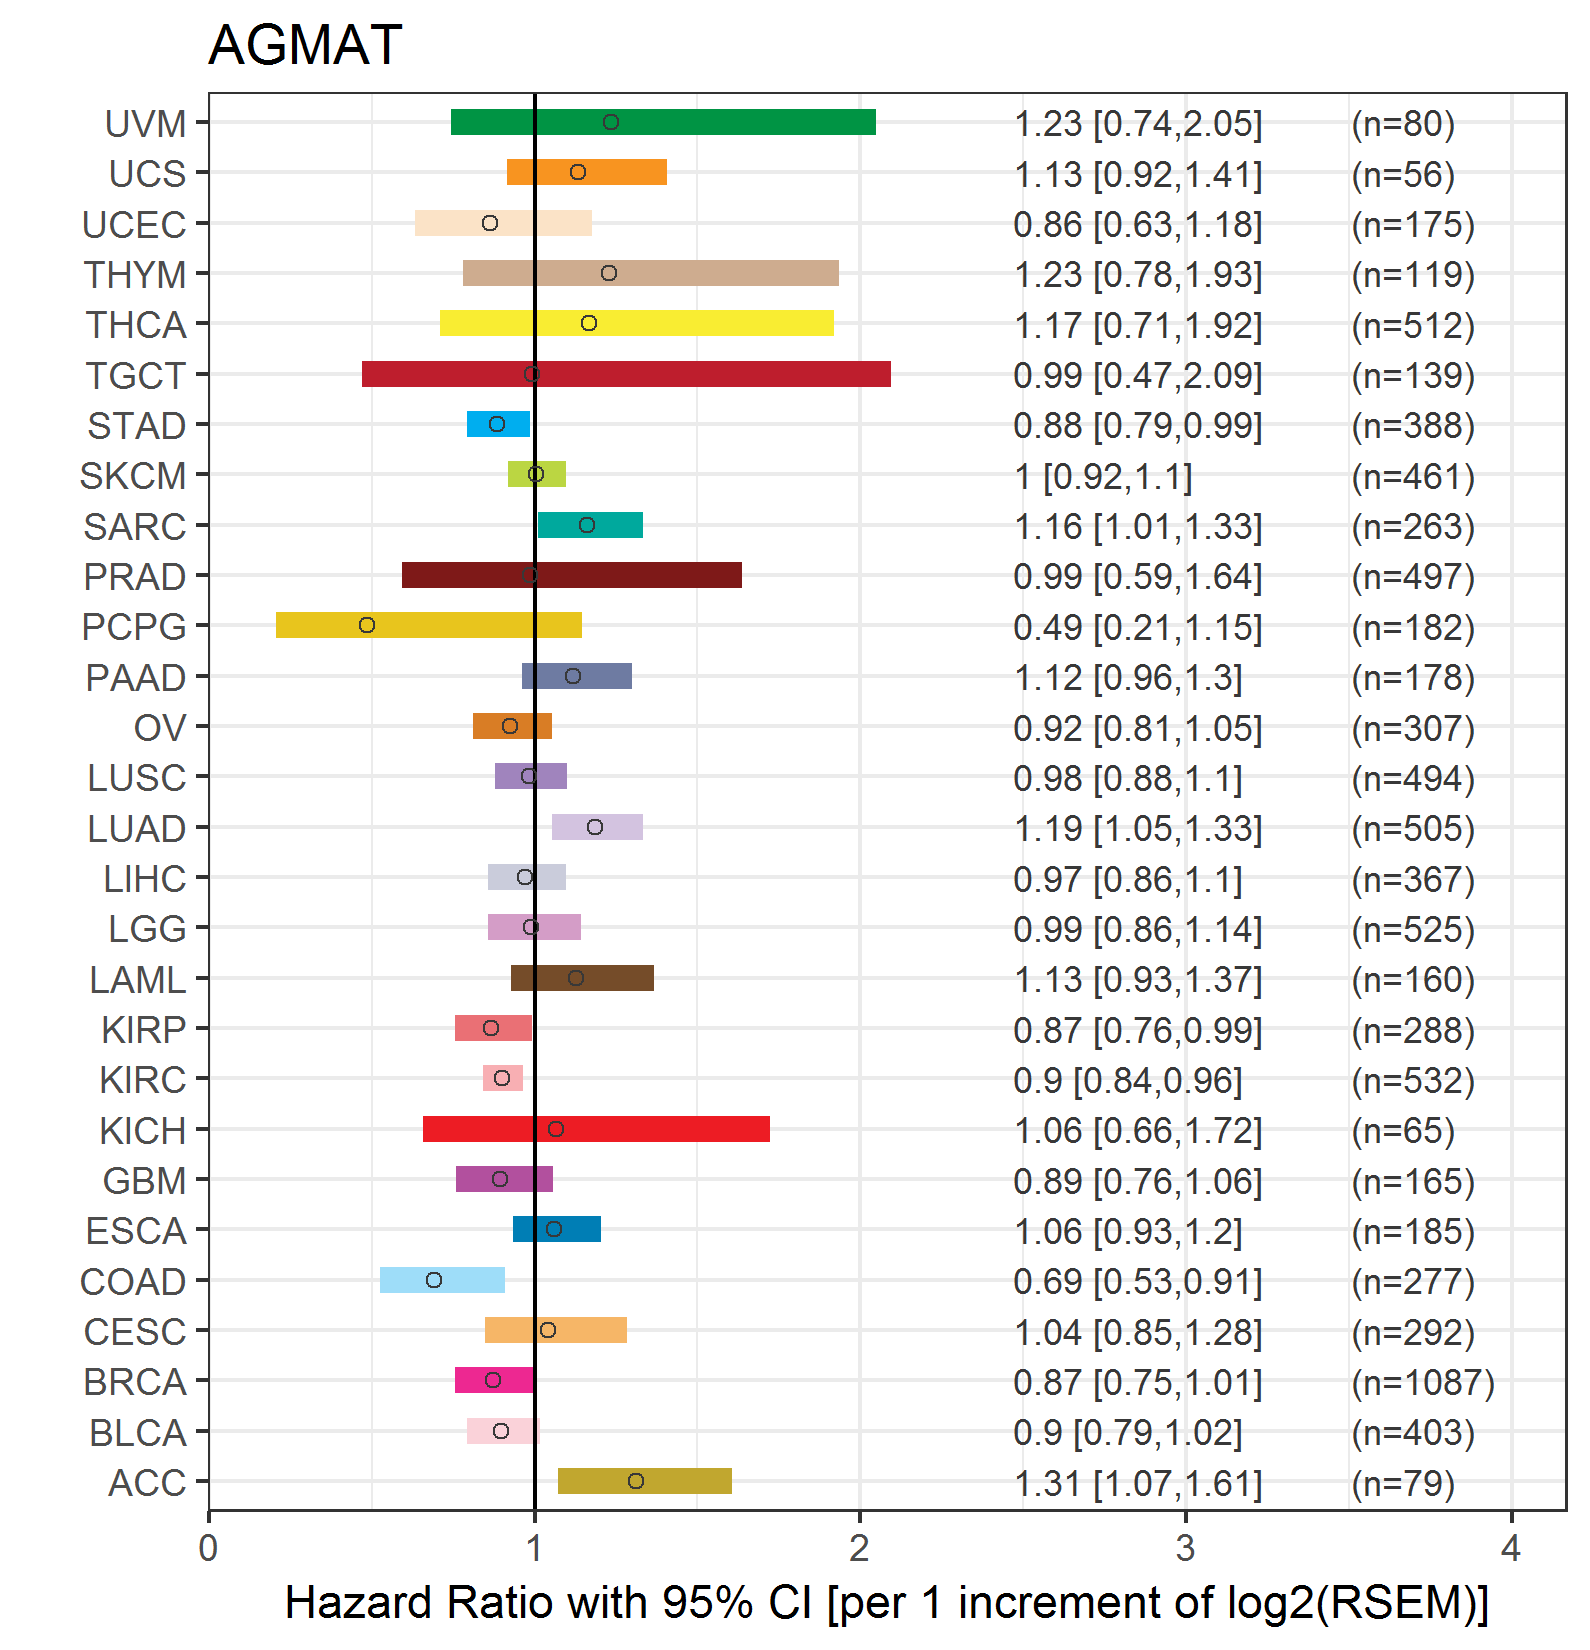
| Forest plot of Cox proportional hazard ratio (HR) and 95% CI of overall survival (OS) using 28 cancer types (TCGA IlluminaHiSeq_RNASeqV2, pan-cancer normalized log2(norm_counts+1) data, version 2016-08-16) (TCGA clinicalMatrix, phenotype data, version 2016-04-27) * Click on the image enlarge it in a new window. |
 |
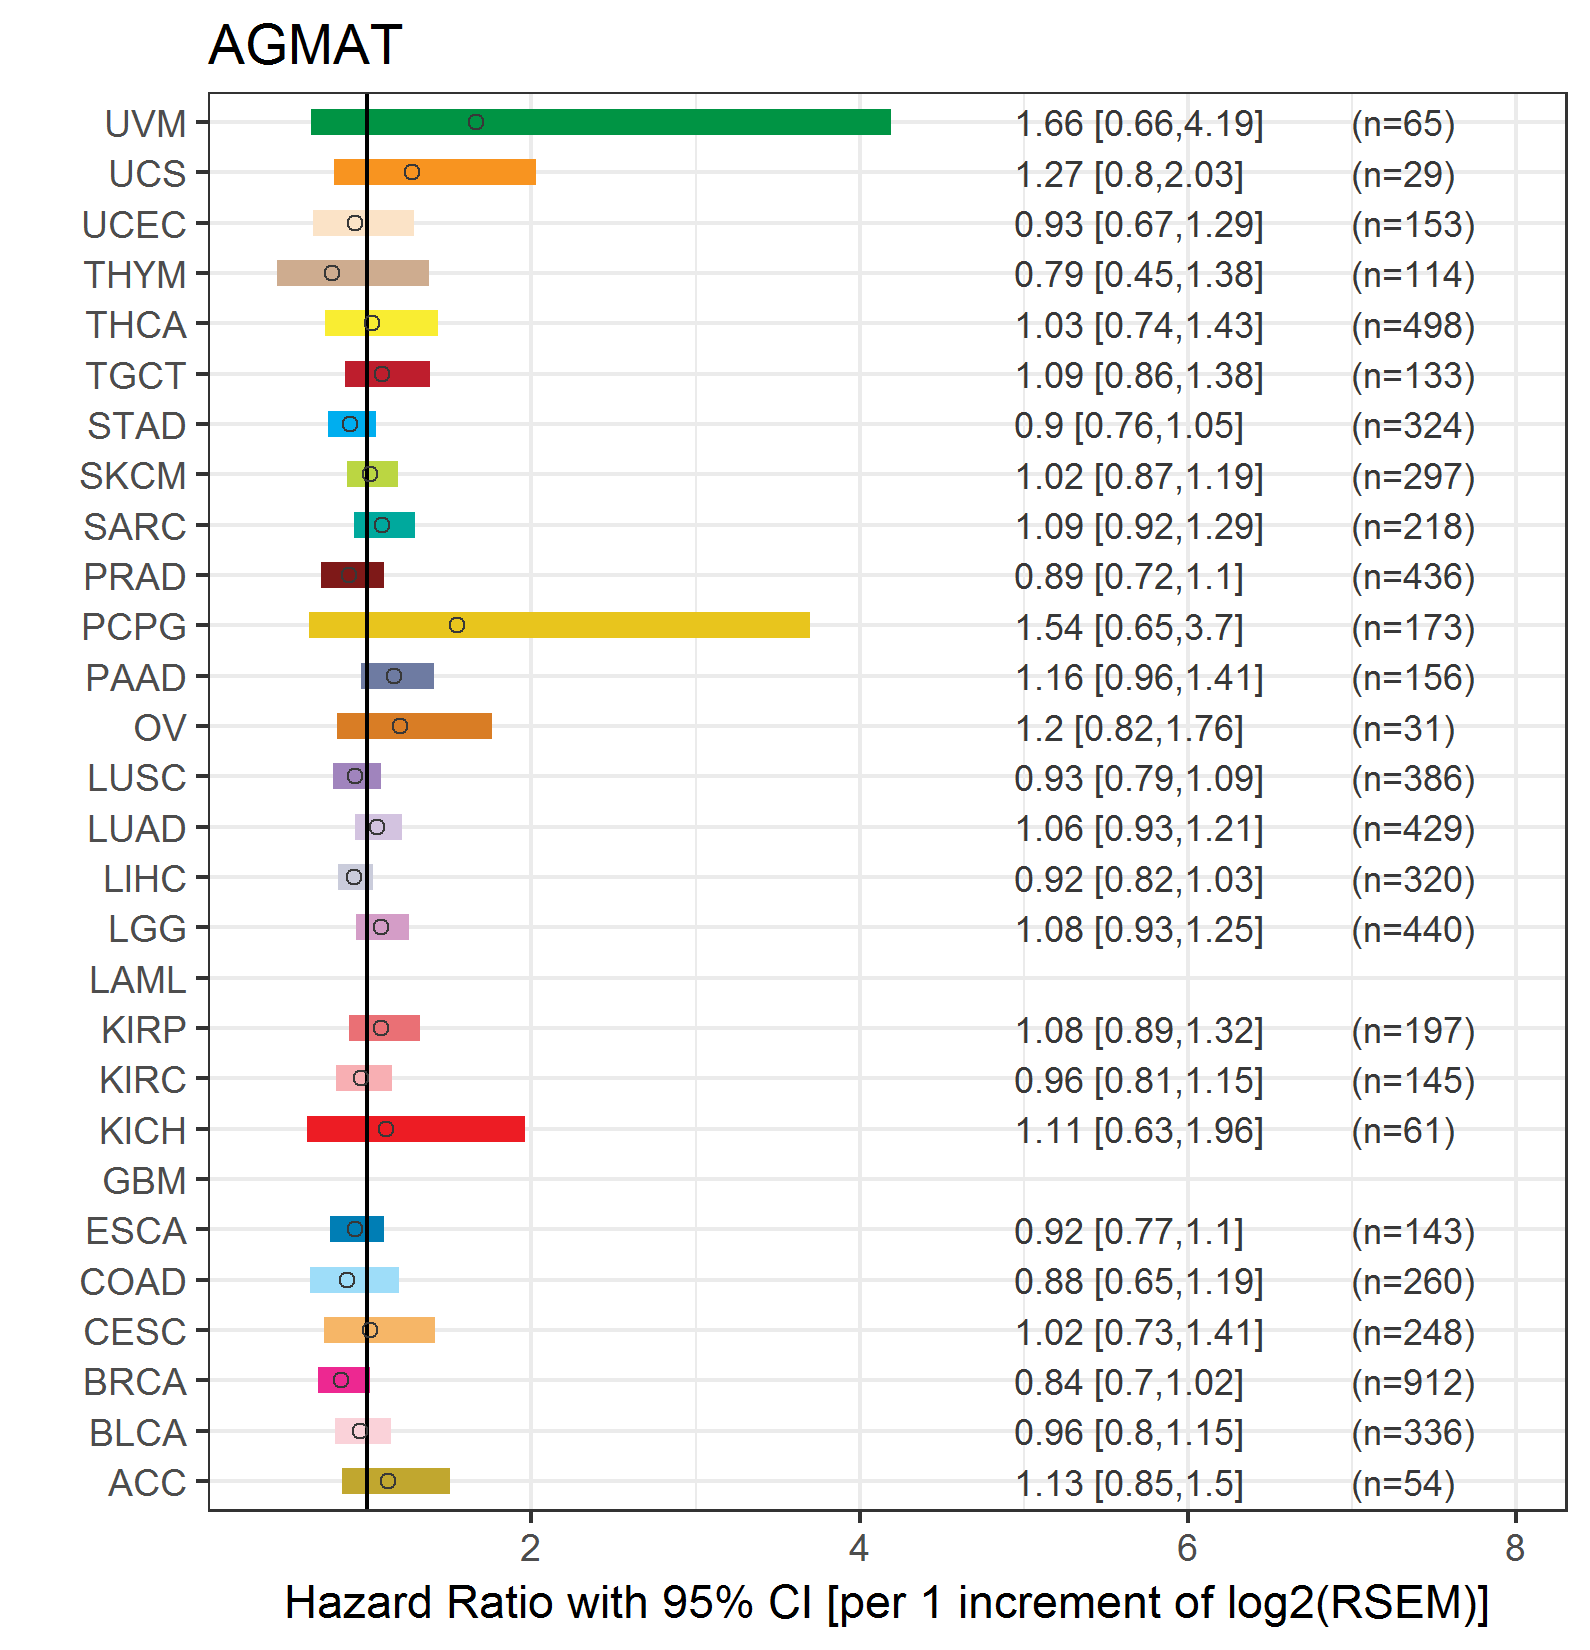
| Forest plot of Cox proportional hazard ratio (HR) and 95% CI of relapse free survival (RFS) using 28 cancer types (TCGA IlluminaHiSeq_RNASeqV2, pan-cancer normalized log2(norm_counts+1) data, version 2016-08-16) (TCGA clinicalMatrix, phenotype data, version 2016-04-27) * Click on the image enlarge it in a new window. |
 |
| Top |
| TissGeneClin for AGMAT |
| TissGeneDrug for AGMAT |
| Drug information targeting TissGene (DrugBank Version 5.0.6, 2017-04-01) |
| DrugBank ID | Drug name | Drug activity | Drug type | Drug status |
| Top |
| TissGeneDisease for AGMAT |
| Disease information associated with TissGene (DisGeNet, 2016-06-01) |
| Disease ID | Disease name | # pubmeds | Source |
| umls:C0342727 | 3-@METHYLGLUTACONIC ACIDURIA, TYPE I | 4 | BeFree |
| umls:C0007134 | Renal Cell Carcinoma | 1 | LHGDN |
| umls:C0040336 | Tobacco Use Disorder | 1 | GAD |
| umls:C1306856 | Megaloblastic anemia due to inborn errors of metabolism | 1 | BeFree |
|
Copyright 2016-Present - The University of Texas Health Science Center at Houston (UTHealth) Web File Viewing | How to Report, Fraud, Waste and Abuse | State of Texas | Statewide Search | Texas Homeland Security | Site Policies |