 |
| |
| |
| |
| |
| |
| |
|

| TissGeneSummary for PAQR6 |
 Gene summary Gene summary |
| Basic gene information | Gene symbol | PAQR6 |
| Gene name | progestin and adipoQ receptor family member VI | |
| Synonyms | - | |
| Cytomap | UCSC genome browser: 1q22 | |
| Type of gene | protein-coding | |
| RefGenes | NM_001272104.1, NM_001272105.1,NM_001272106.1,NM_001272107.1,NM_001272108.1, NM_001272109.1,NM_001272110.1,NM_001272111.1,NM_001272112.1, NM_001272113.1,NM_024897.3,NM_198406.2,NR_073610.1, | |
| Description | progestin and adipoQ receptor family member 6progestin and adipoQ receptor family member VI variant 3progestin and adipoQ receptor family member VI variant 4progestin and adipoQ receptor family member VI variant 5 | |
| Modification date | 20141207 | |
| dbXrefs | MIM : 614579 | |
| HGNC : HGNC | ||
| Ensembl : ENSG00000160781 | ||
| HPRD : 17820 | ||
| Vega : OTTHUMG00000017490 | ||
| Protein | UniProt: go to UniProt's Cross Reference DB Table | |
| Expression | CleanEX: HS_PAQR6 | |
| BioGPS: 79957 | ||
| Pathway | NCI Pathway Interaction Database: PAQR6 | |
| KEGG: PAQR6 | ||
| REACTOME: PAQR6 | ||
| Pathway Commons: PAQR6 | ||
| Context | iHOP: PAQR6 | |
| ligand binding site mutation search in PubMed: PAQR6 | ||
| UCL Cancer Institute: PAQR6 | ||
| Assigned class in TissGDB* | C | |
| Included tissue-specific gene expression resources | HPA,TiGER | |
| Specific-tissues in normal samples (assigned by TissGDB using HPA, TiGER, and GTEx) | Brain | |
| Cancer types related to the specific-tissues in cancer samples (assigned by TissGDB using TCGA) | GBM,LGG | |
| Reference showing the relevant tissue of PAQR6 | ||
| Description by TissGene annotations | Protective TissGene in OS | |
| * Class A consists of genes with literature evidence and is part of the cTissGenes. Class B consists of only cTissGenes without additional evidence. The remaining genes belong to Class C. |
| Gene ontology having evidence of Inferred from Direct Assay (IDA) from Entrez |
| GO ID | GO term | PubMed ID |
| Top |
| TissGeneExp for PAQR6 |
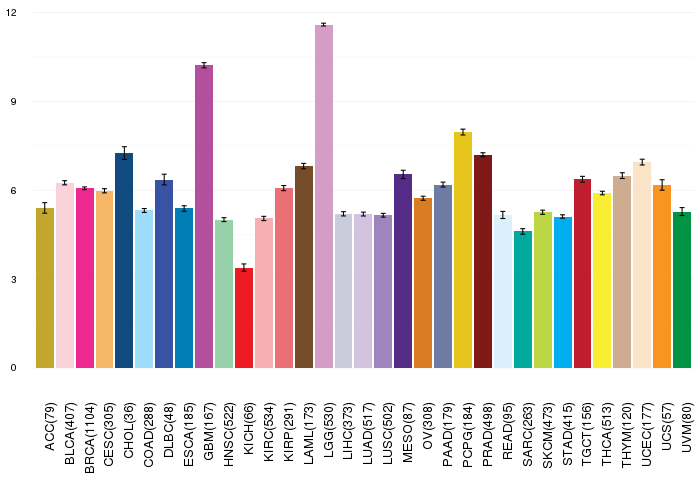
| Gene expressions across 28 cancer types (X-axis: cancer type and Y-axis: log2(norm_counts+1)) (TCGA IlluminaHiSeq_RNASeqV2, pan-cancer normalized log2(norm_counts+1) data, version 2016-08-16) |
 |
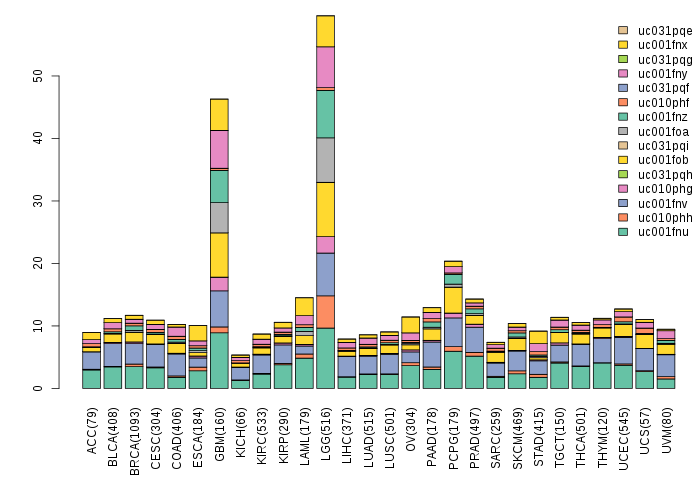
| Gene isoform expressions across 28 cancer types (X-axis: cancer type and Y-axis: log2(norm_counts+1)) (TCGA pan-cancer tcga_rsem_isoform_tpm, version 2016-09-01) |
 |
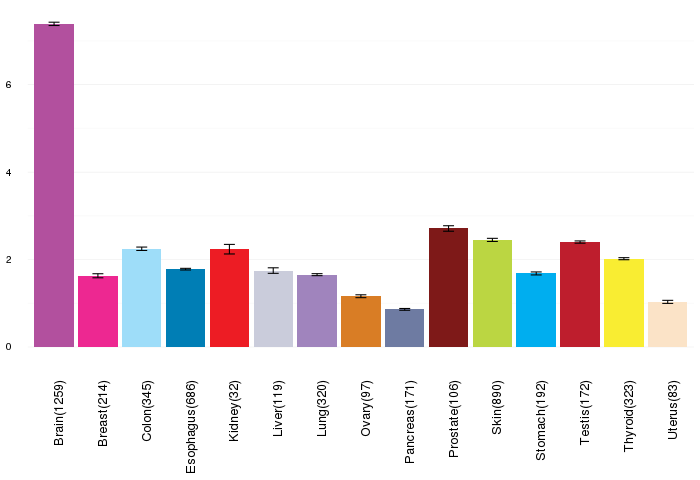
| Gene expressions across normal tissues of GTEx data (GTEx GTEx_Analysis_v6_RNA-seq_RNA-SeQCv1.1.8_gene_rpkm.gct) - Here, we shows the matched tissue types only among our 28 cancer types. |
 |
| Different expressions across 14 cancer types with more than 10 samples between matched tumors and normals (X-axis: cancer type and Y-axis: log2(norm_counts+1)) (TCGA IlluminaHiSeq_RNASeqV2, pan-cancer normalized log2(norm_counts+1) data, version 2016-08-16) |
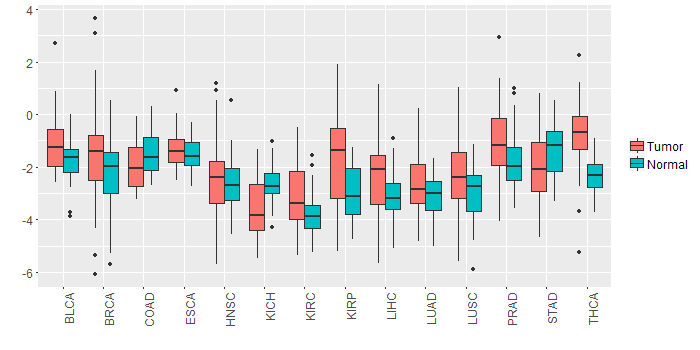 |
| - Significantly differentially expressed cancer types and information. (|Fold change|>1 and FDR<0.05) |
| Cancer type | Mean(exp) in tumor | Mean(exp) in matched normal | Log2FC | P-val. | FDR |
| THCA | -0.801523416 | -2.308711551 | 1.507188136 | 6.42E-13 | 6.02E-12 |
| KIRP | -1.650063035 | -3.00360991 | 1.353546875 | 0.000389 | 0.001169086 |
| Top |
| TissGene-miRNA for PAQR6 |
| Significantly anti-correlated miRNAs of TissGene across 28 cancer types (Gene-miRNA relations from TargetScanHuman Relsease 7.1, Conserved_Site_Context_Scores.txt.zip, 06.01.2016) (TCGA IlluminaHiSeq_miRNASeq, log2(RPM+1) data, version 2016-11-21) (TCGA IlluminaHiSeq_RNASeqV2, log2(normalized_count+1) data, version 2016-08-16) (Spearman’s Rank Correlation (p-value<0.05 and coefficient<-0.25)) |
| Cancer type | miRNA id | miRNA accession | P-val. | Coeff. | # samples |
| Top |
| TissGeneMut for PAQR6 |
| TissGeneSNV for PAQR6 |
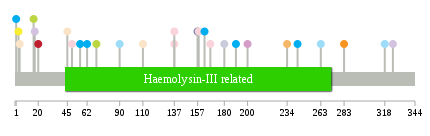
| nsSNV counts per each loci. Different colors of circles represent different cancer types. Circle size denotes number of samples. (TCGA somatic mutation (SNPs and small INDELs) data, version 2016-04-25) * Click on the image to enlarge it in a new window. |
 |
 |
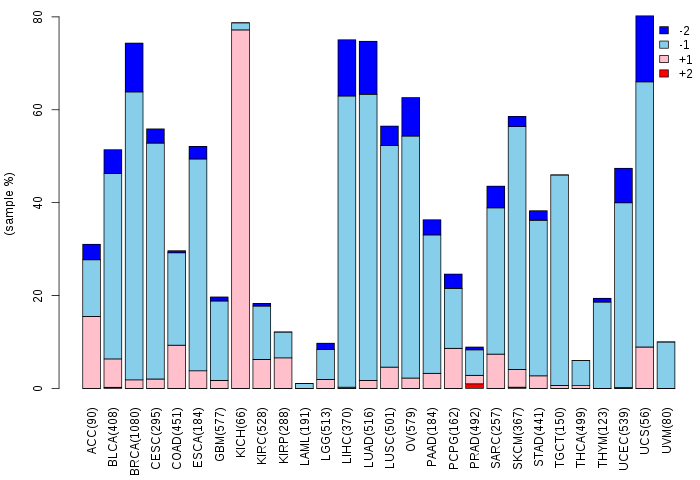
| Somatic nucleotide variants of TissGene across 28 cancer types (X-axis: cancer type and Y-axis: % of mutated samples) The numbers in parentheses are numbers of samples with mutation (nsSNVs). (TCGA somatic mutation (SNPs and small INDELs) data, version 2016-04-25) |
 |
| - nsSNVs sorted by frequency. |
| AAchange | Cancer type | # samples |
| p.E243K | STAD | 1 |
| p.R305K | HNSC | 1 |
| p.D90N | COAD | 1 |
| p.E283K | UCS | 1 |
| p.E137K | BLCA | 1 |
| p.A238D | HNSC | 1 |
| p.P3H | THCA | 1 |
| p.M1V | STAD | 1 |
| p.Q110* | UCEC | 1 |
| p.P16S | SKCM | 1 |
| p.R168K | BLCA | 1 |
| p.T49M | BLCA | 1 |
| p.A318T | COAD | 1 |
| p.E137* | BLCA | 1 |
| p.F45L | UCEC | 1 |
| p.S234L | CESC | 1 |
| p.R17W | LUAD | 1 |
| p.A200T | LGG | 1 |
| p.E325Q | LUAD | 1 |
| p.W20C | TGCT | 1 |
| p.E158Q | BLCA | 1 |
| p.A190T | STAD | 1 |
| p.G70E | SKCM | 1 |
| p.E263K | COAD | 1 |
| p.A132D | HNSC | 1 |
| p.R143H | READ | 1 |
| p.S62L | STAD | 1 |
| p.F239S | MESO | 1 |
| p.S180Y | LIHC | 1 |
| p.A157T | PAAD | 1 |
| p.S56L | STAD | 1 |
| p.A163T | STAD | 1 |
| p.L342V | HNSC | 1 |
| p.L4I | UCEC | 1 |
| Top |
| TissGeneCNV for PAQR6 |
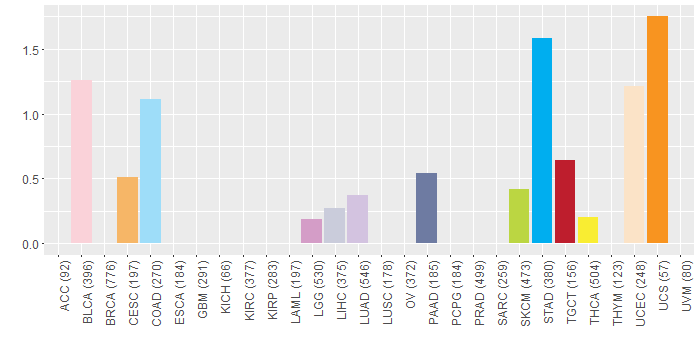
| Copy number variations of TissGene across 28 cancer types (X-axis: cancer type and Y-axis: % of CNV samples) (TCGA Gistic2_CopyNumber_Gistic2_all_data_by_genes, Gistic2 copy number data, version 2016-08-16) |
 |
| Top |
| TissGeneFusions for PAQR6 |
| Fusion genes including TissGene (ChimerDB 3.0, 2016-12-01 and TCGA fusion Portal 2015-12-01) |
| Database | Src | Cancer type | Sample | Fusion gene | ORF | 5'-gene BP | 3'-gene BP |
| Chimerdb3.0 | ChiTaRs | NA | DC337041 | WDR74-PAQR6 | chr11:62609281 | chr1:156215712 | |
| Chimerdb3.0 | ChiTaRs | NA | BF933691 | PAQR6-PAQR6 | chr1:156215238 | chr1:156214947 | |
| Chimerdb3.0 | FusionScan | UCEC | TCGA-5B-A90C-01A | ARHGEF2-PAQR6 | In-Frame | chr1:155935093 | chr1:156214194 |
| Chimerdb3.0 | TopHat-Fusion | UCEC | TCGA-5B-A90C-01A | ARHGEF2-PAQR6 | Out-of-Frame | chr1:155934796 | chr1:156214586 |
| Chimerdb3.0 | TopHat-Fusion | UCEC | TCGA-5B-A90C-01A | ARHGEF2-PAQR6 | In-Frame | chr1:155935093 | chr1:156214193 |
| Top |
| TissGeneNet for PAQR6 |
| Co-expressed gene networks based on protein-protein interaction data (CePIN) (TCGA IlluminaHiSeq_RNASeqV2, pan-cancer normalized log2(norm_counts+1) data, version 2016-08-16) (PINA2 ppi data) |
| Top |
| TissGeneProg for PAQR6 |
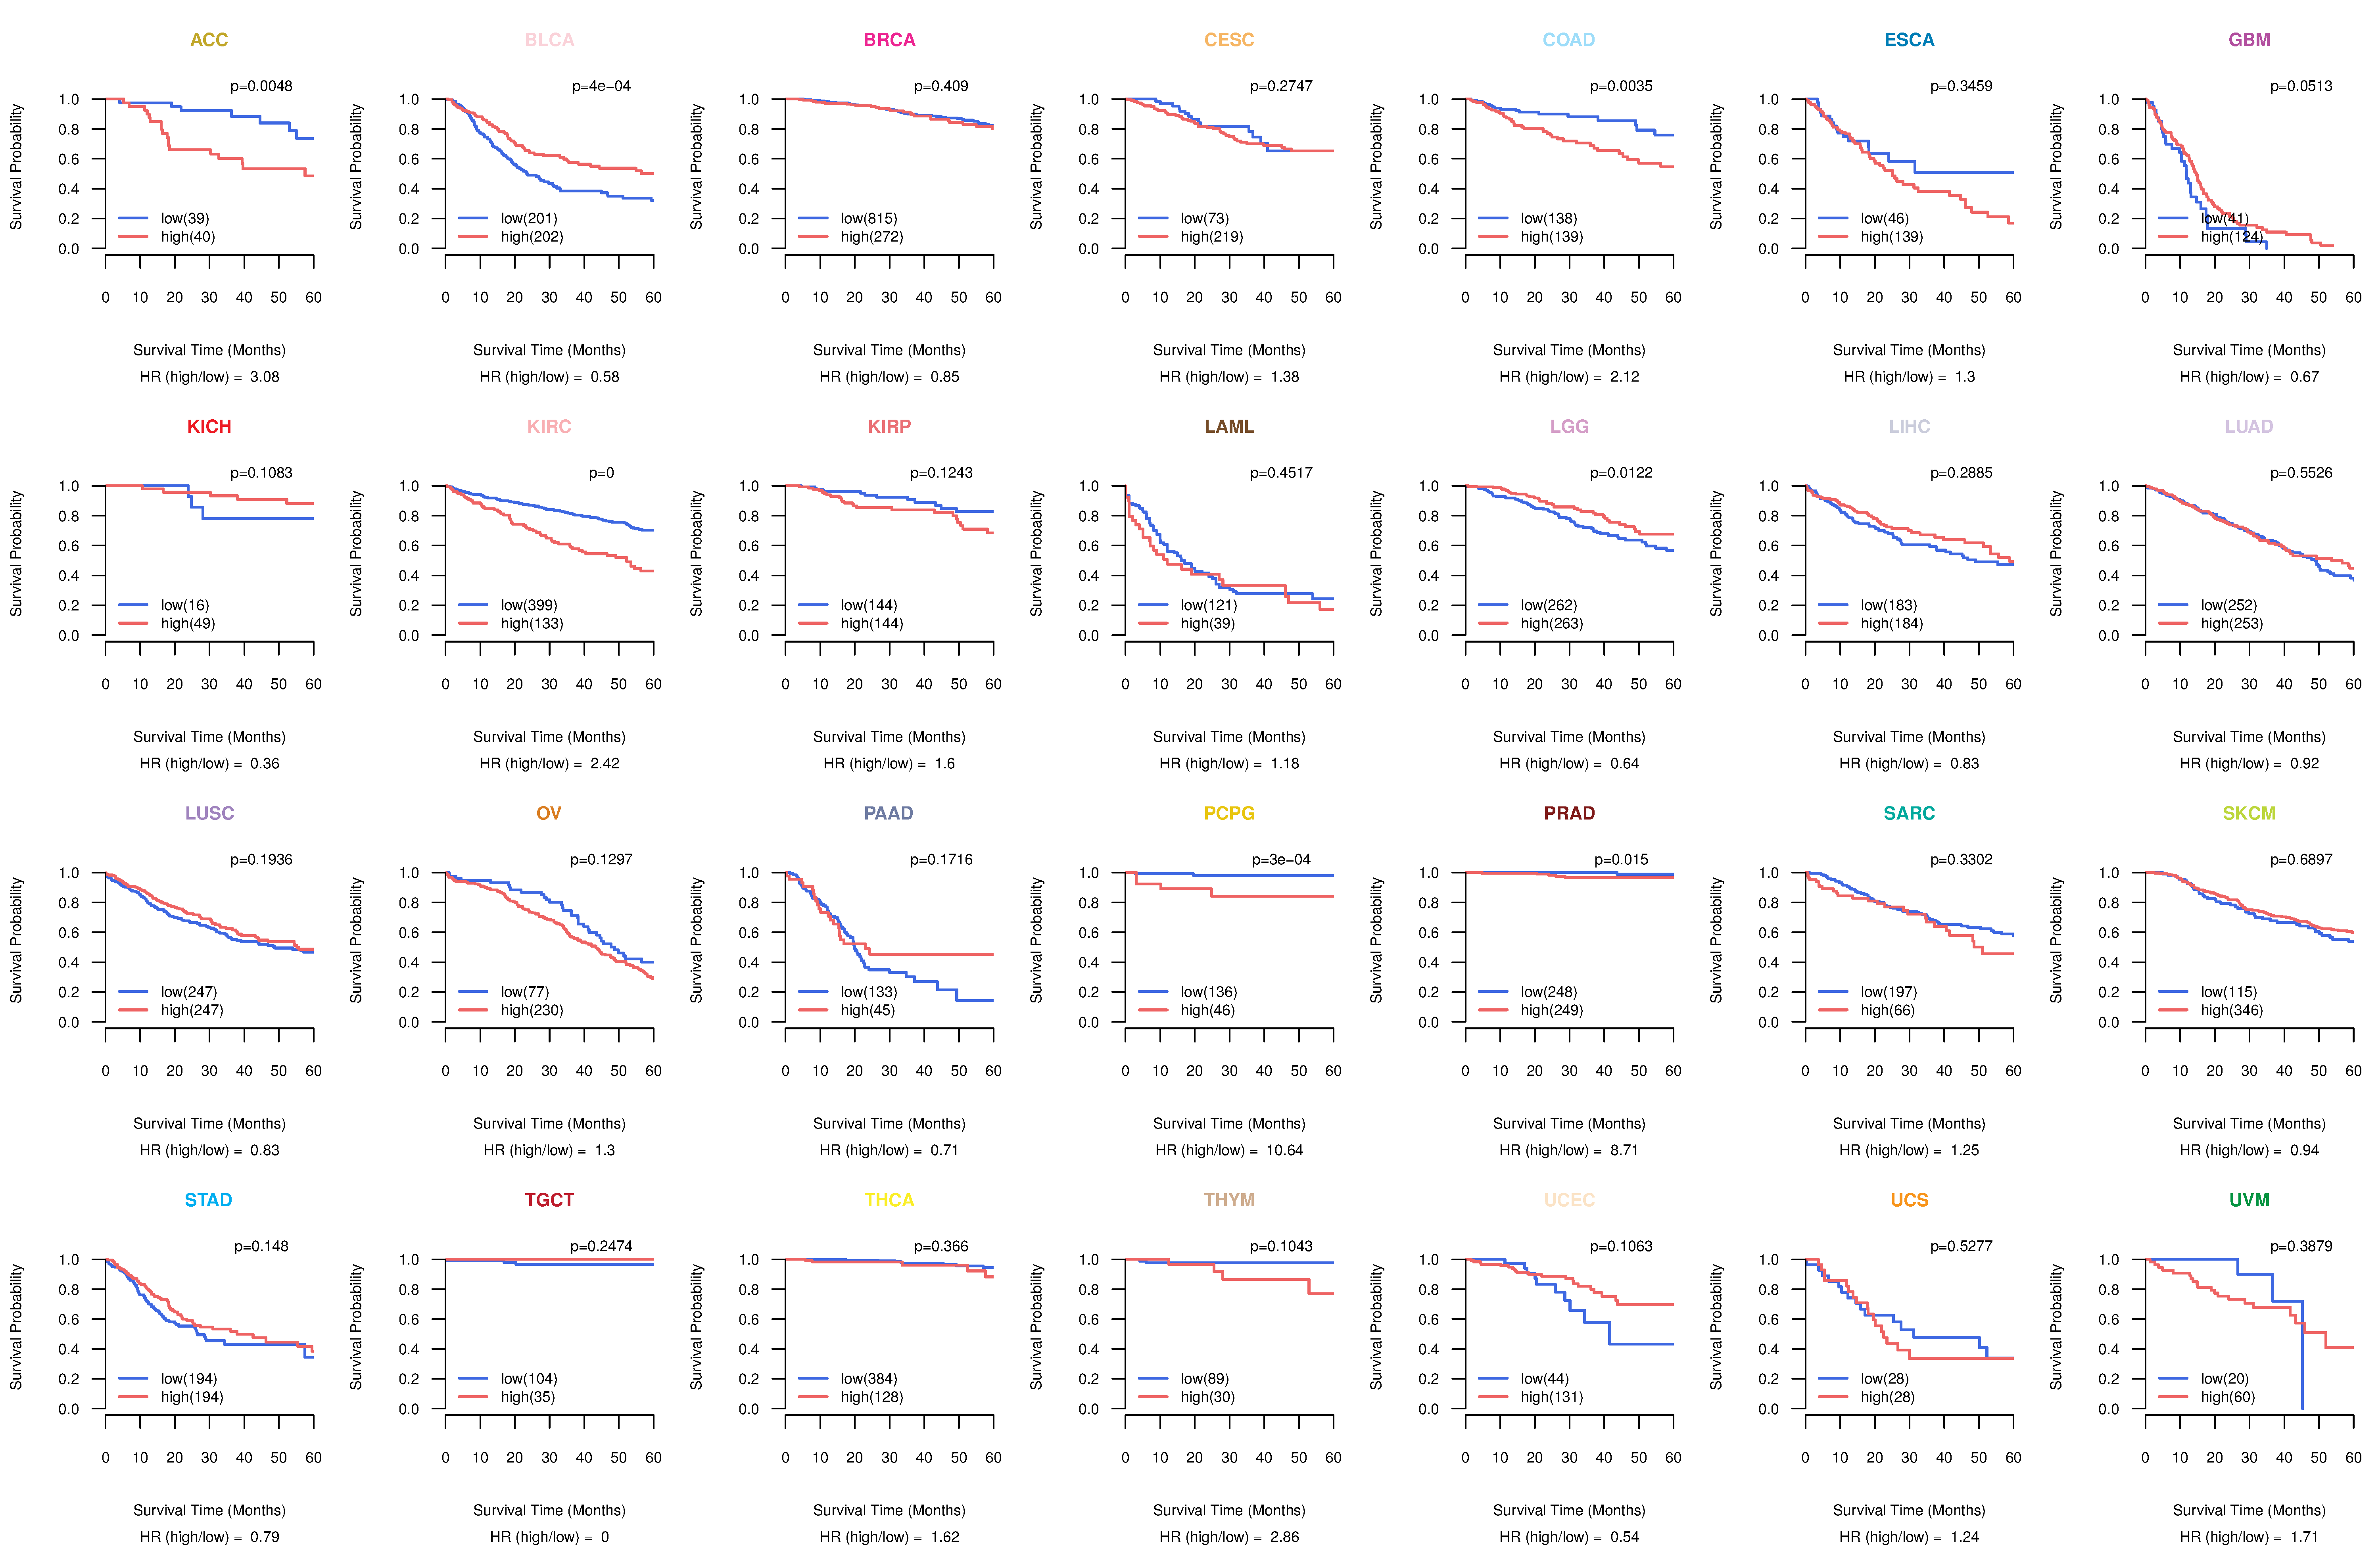
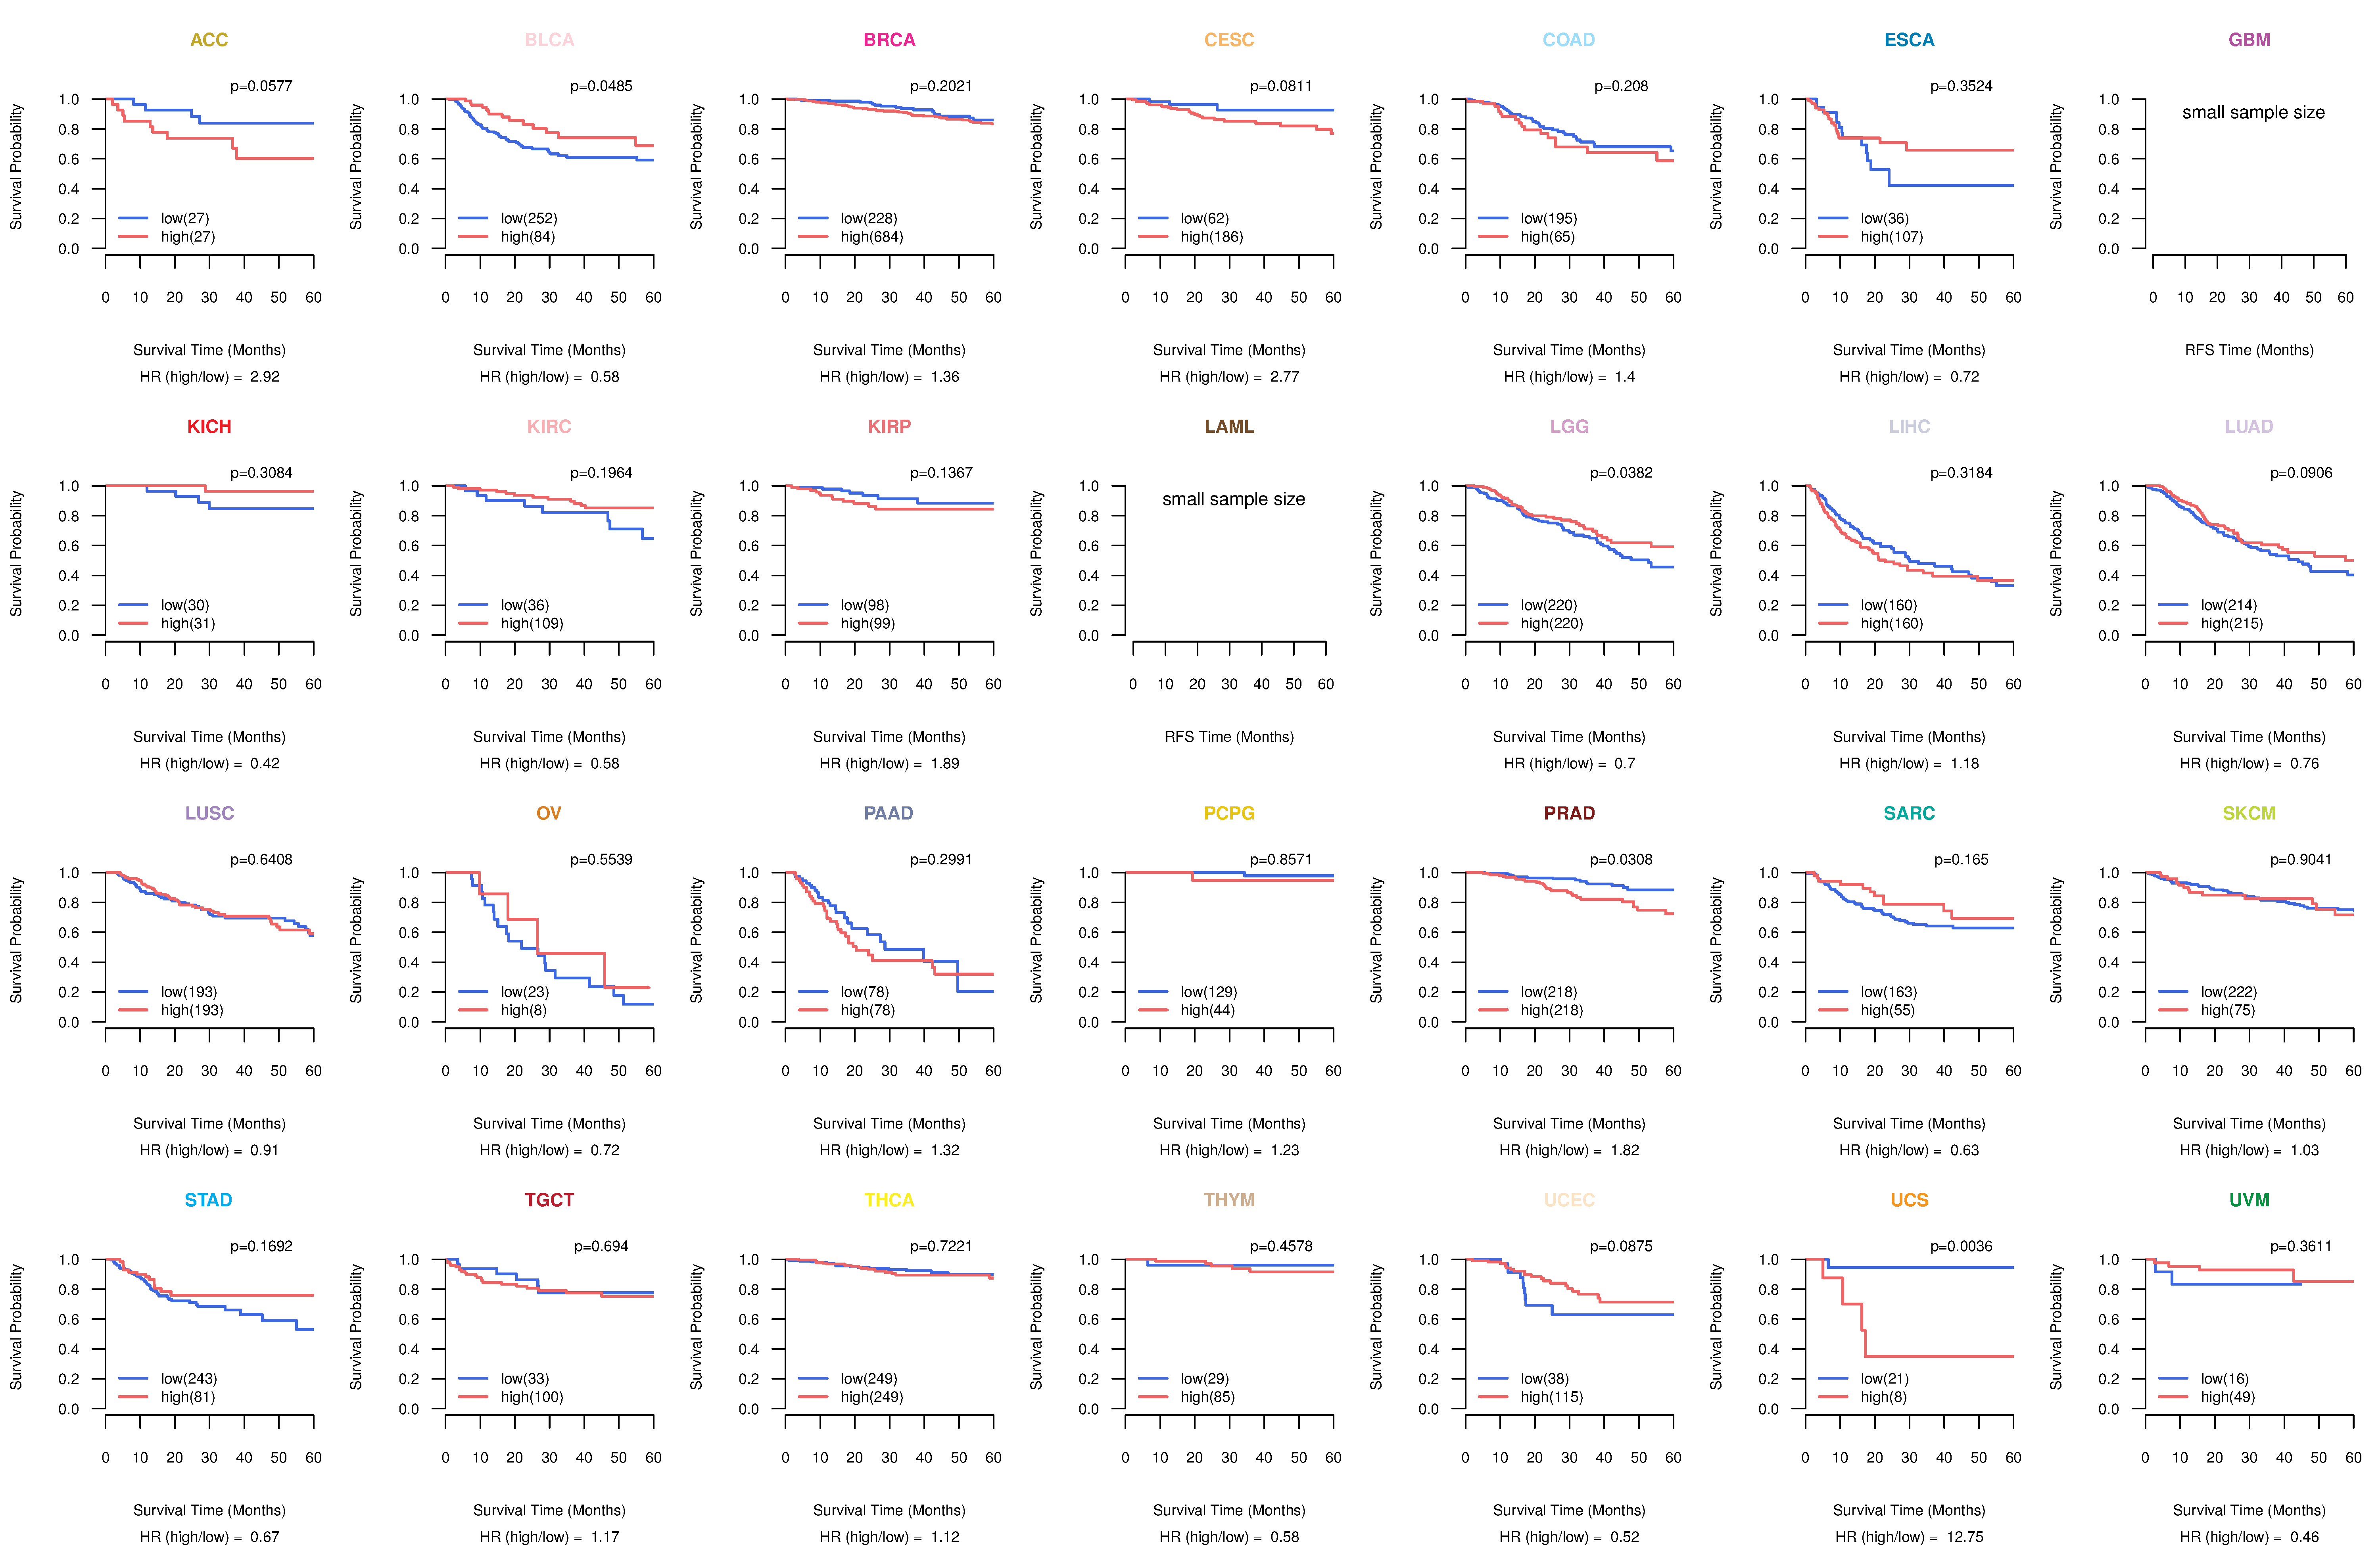
| Kaplan-Meier plots with logrank tests of overall survival (OS) using 28 cancer types (TCGA IlluminaHiSeq_RNASeqV2, pan-cancer normalized log2(norm_counts+1) data, version 2016-08-16) (TCGA clinicalMatrix, phenotype data, version 2016-04-27) * Click on the image to enlarge it in a new window. |
 |
| Kaplan-Meier plots with logrank test of relapse free survival (RFS) using 28 cancer types (TCGA IlluminaHiSeq_RNASeqV2, pan-cancer normalized log2(norm_counts+1) data, version 2016-08-16) (TCGA clinicalMatrix, phenotype data, version 2016-04-27) * Click on the image enlarge it in a new window. |
 |
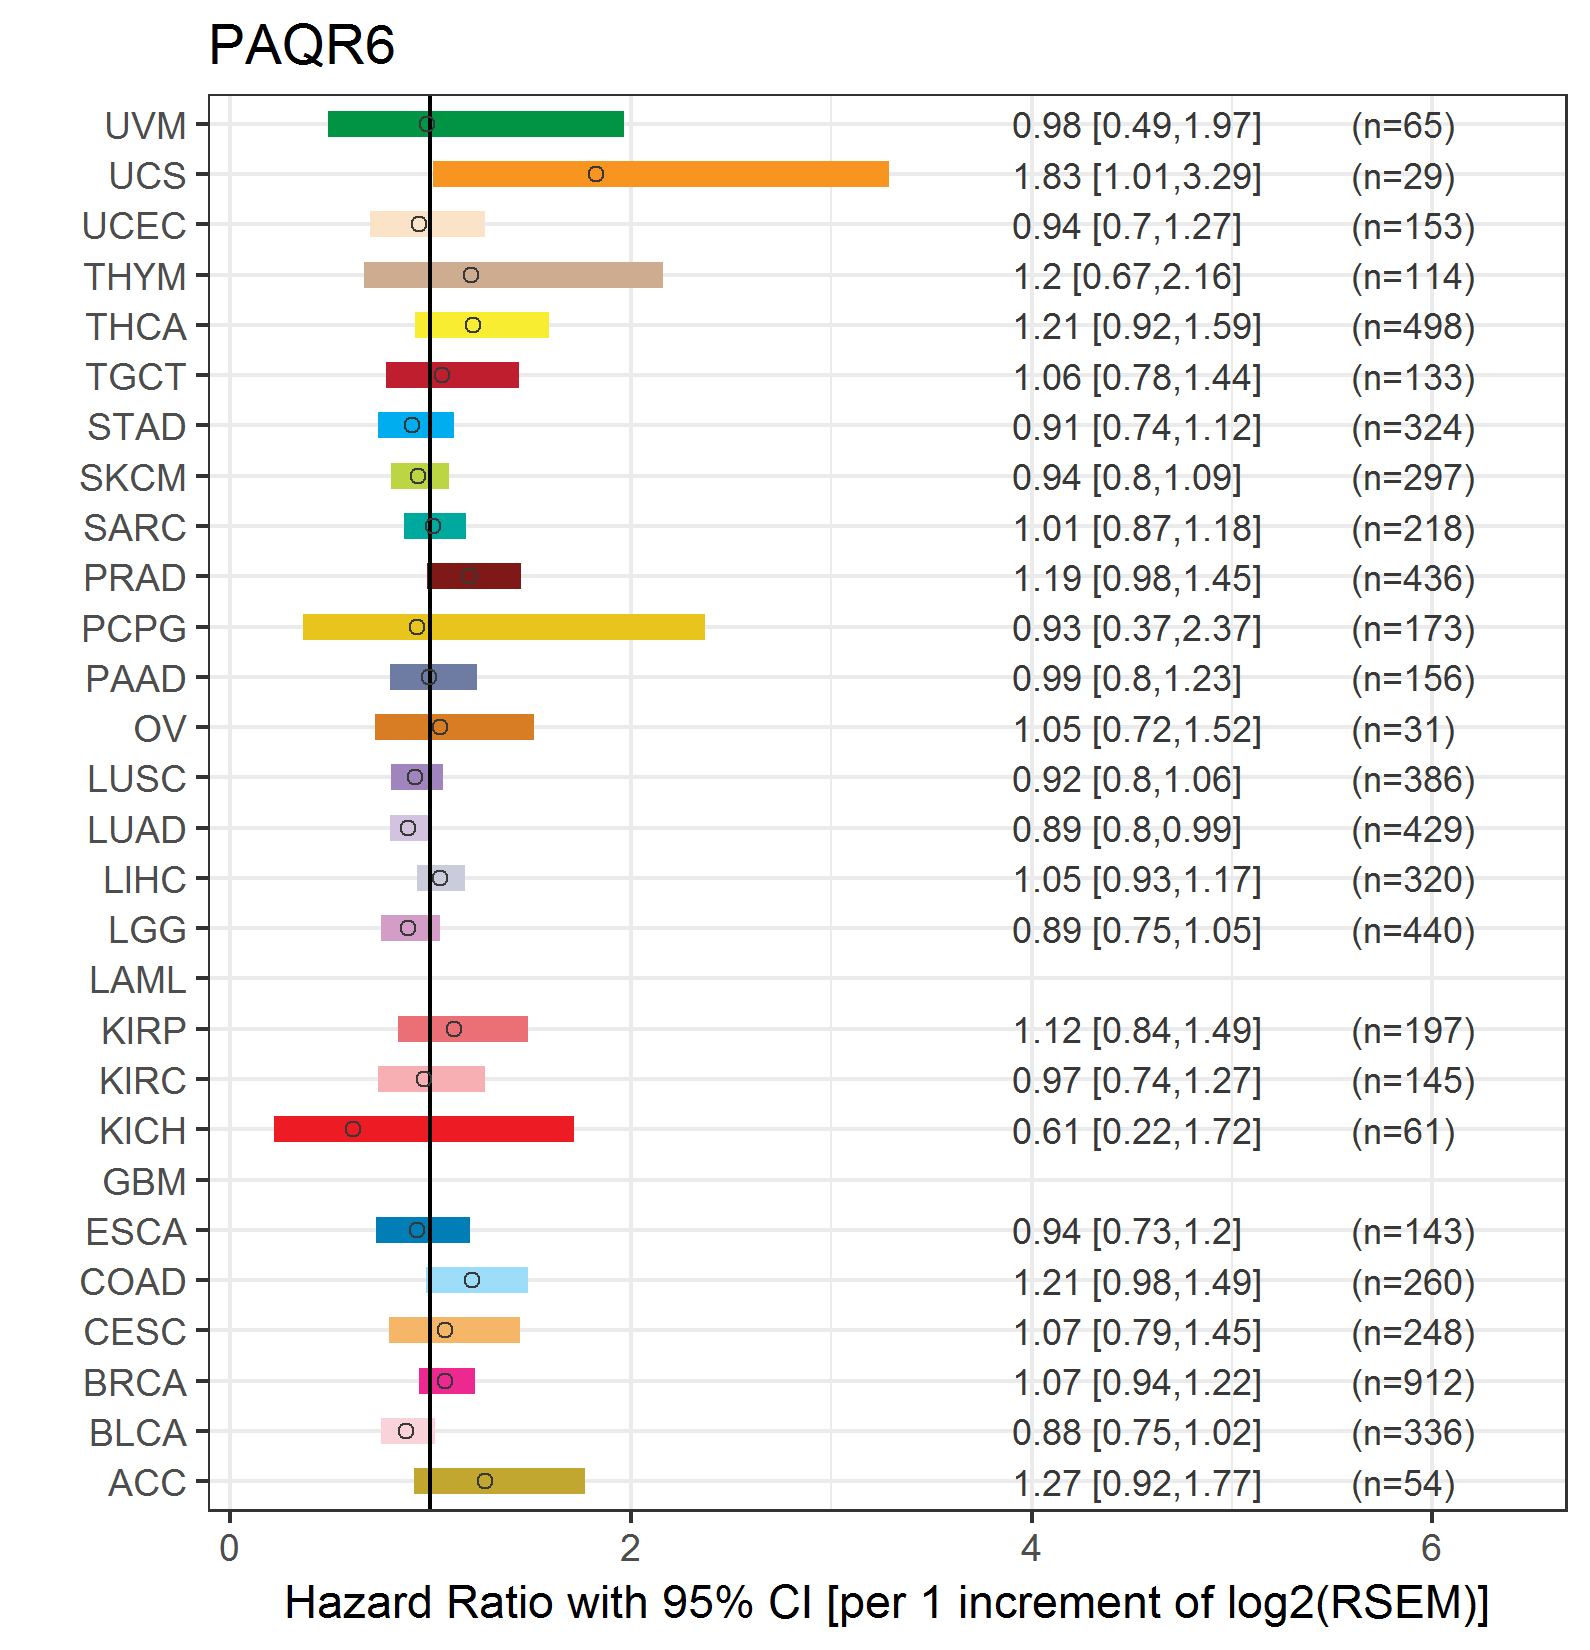
| Forest plot of Cox proportional hazard ratio (HR) and 95% CI of overall survival (OS) using 28 cancer types (TCGA IlluminaHiSeq_RNASeqV2, pan-cancer normalized log2(norm_counts+1) data, version 2016-08-16) (TCGA clinicalMatrix, phenotype data, version 2016-04-27) * Click on the image enlarge it in a new window. |
 |
| Forest plot of Cox proportional hazard ratio (HR) and 95% CI of relapse free survival (RFS) using 28 cancer types (TCGA IlluminaHiSeq_RNASeqV2, pan-cancer normalized log2(norm_counts+1) data, version 2016-08-16) (TCGA clinicalMatrix, phenotype data, version 2016-04-27) * Click on the image enlarge it in a new window. |
 |
| Top |
| TissGeneClin for PAQR6 |
| TissGeneDrug for PAQR6 |
| Drug information targeting TissGene (DrugBank Version 5.0.6, 2017-04-01) |
| DrugBank ID | Drug name | Drug activity | Drug type | Drug status |
| Top |
| TissGeneDisease for PAQR6 |
| Disease information associated with TissGene (DisGeNet, 2016-06-01) |
| Disease ID | Disease name | # pubmeds | Source |
|
Copyright 2016-Present - The University of Texas Health Science Center at Houston (UTHealth) Web File Viewing | How to Report, Fraud, Waste and Abuse | State of Texas | Statewide Search | Texas Homeland Security | Site Policies |