 |
| |
| |
| |
| |
| |
| |
|

| TissGeneSummary for DNAJC22 |
 Gene summary Gene summary |
| Basic gene information | Gene symbol | DNAJC22 |
| Gene name | DnaJ (Hsp40) homolog, subfamily C, member 22 | |
| Synonyms | wus | |
| Cytomap | UCSC genome browser: 12q13.12 | |
| Type of gene | protein-coding | |
| RefGenes | NM_024902.2, | |
| Description | dnaJ homolog subfamily C member 22wurst homolog | |
| Modification date | 20141207 | |
| dbXrefs | HGNC : HGNC | |
| Ensembl : ENSG00000178401 | ||
| HPRD : 08580 | ||
| Vega : OTTHUMG00000169487 | ||
| Protein | UniProt: go to UniProt's Cross Reference DB Table | |
| Expression | CleanEX: HS_DNAJC22 | |
| BioGPS: 79962 | ||
| Pathway | NCI Pathway Interaction Database: DNAJC22 | |
| KEGG: DNAJC22 | ||
| REACTOME: DNAJC22 | ||
| Pathway Commons: DNAJC22 | ||
| Context | iHOP: DNAJC22 | |
| ligand binding site mutation search in PubMed: DNAJC22 | ||
| UCL Cancer Institute: DNAJC22 | ||
| Assigned class in TissGDB* | C | |
| Included tissue-specific gene expression resources | TiGER,GTEx | |
| Specific-tissues in normal samples (assigned by TissGDB using HPA, TiGER, and GTEx) | ColonLiver | |
| Cancer types related to the specific-tissues in cancer samples (assigned by TissGDB using TCGA) | COADLIHC | |
| Reference showing the relevant tissue of DNAJC22 | ||
| Description by TissGene annotations | ||
| * Class A consists of genes with literature evidence and is part of the cTissGenes. Class B consists of only cTissGenes without additional evidence. The remaining genes belong to Class C. |
| Gene ontology having evidence of Inferred from Direct Assay (IDA) from Entrez |
| GO ID | GO term | PubMed ID |
| Top |
| TissGeneExp for DNAJC22 |
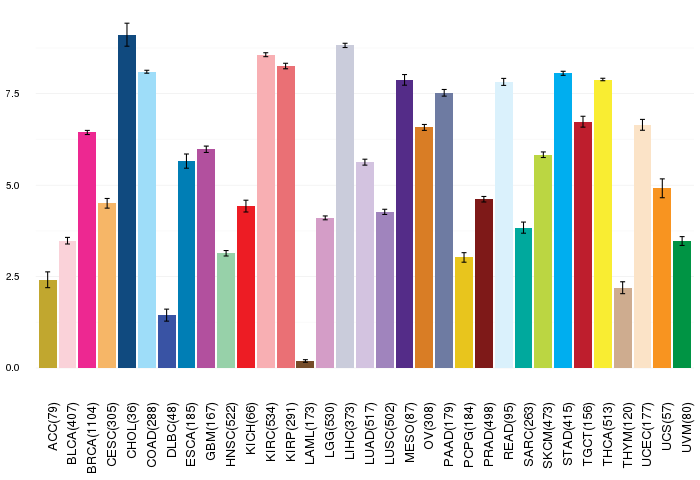
| Gene expressions across 28 cancer types (X-axis: cancer type and Y-axis: log2(norm_counts+1)) (TCGA IlluminaHiSeq_RNASeqV2, pan-cancer normalized log2(norm_counts+1) data, version 2016-08-16) |
 |
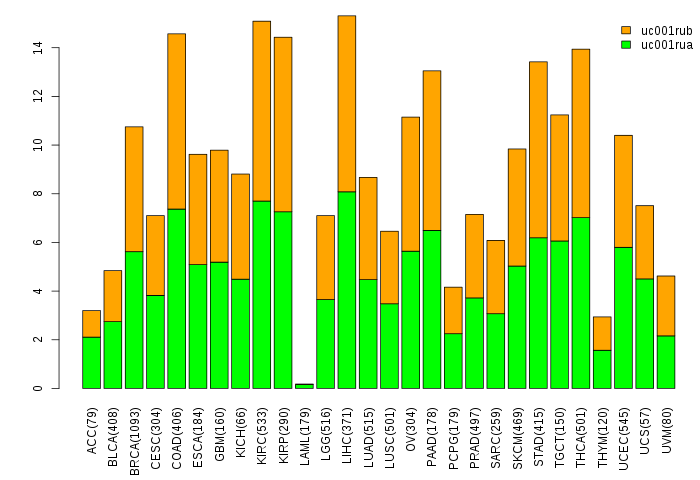
| Gene isoform expressions across 28 cancer types (X-axis: cancer type and Y-axis: log2(norm_counts+1)) (TCGA pan-cancer tcga_rsem_isoform_tpm, version 2016-09-01) |
 |
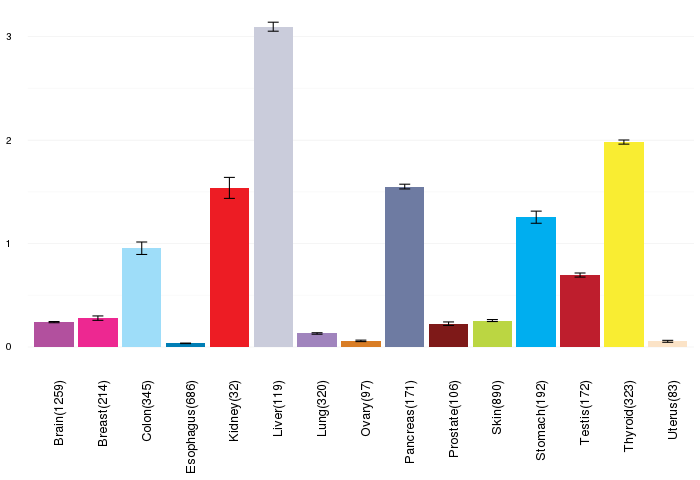
| Gene expressions across normal tissues of GTEx data (GTEx GTEx_Analysis_v6_RNA-seq_RNA-SeQCv1.1.8_gene_rpkm.gct) - Here, we shows the matched tissue types only among our 28 cancer types. |
 |
| Different expressions across 14 cancer types with more than 10 samples between matched tumors and normals (X-axis: cancer type and Y-axis: log2(norm_counts+1)) (TCGA IlluminaHiSeq_RNASeqV2, pan-cancer normalized log2(norm_counts+1) data, version 2016-08-16) |
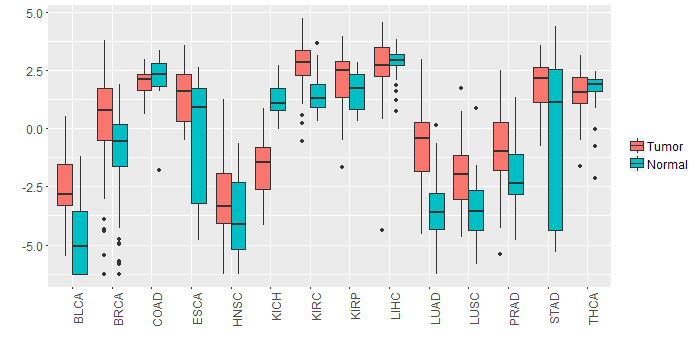 |
| - Significantly differentially expressed cancer types and information. (|Fold change|>1 and FDR<0.05) |
| Cancer type | Mean(exp) in tumor | Mean(exp) in matched normal | Log2FC | P-val. | FDR |
| LUAD | -0.772721753 | -3.590735546 | 2.818013793 | 5.50E-19 | 9.07E-18 |
| KIRC | 2.747985814 | 1.44061498 | 1.307370833 | 9.89E-17 | 5.71E-16 |
| BRCA | 0.372781574 | -1.168541233 | 1.541322807 | 1.06E-08 | 3.48E-08 |
| LUSC | -2.012723173 | -3.427172193 | 1.41444902 | 9.78E-07 | 2.46E-06 |
| KICH | -1.707519409 | 1.269252591 | -2.976772 | 1.57E-11 | 1.44E-10 |
| STAD | 1.838547966 | -0.466427034 | 2.304975 | 0.000961 | 0.005139045 |
| BLCA | -2.471721935 | -4.640211409 | 2.168489474 | 0.000345 | 0.003020787 |
| Top |
| TissGene-miRNA for DNAJC22 |
| Significantly anti-correlated miRNAs of TissGene across 28 cancer types (Gene-miRNA relations from TargetScanHuman Relsease 7.1, Conserved_Site_Context_Scores.txt.zip, 06.01.2016) (TCGA IlluminaHiSeq_miRNASeq, log2(RPM+1) data, version 2016-11-21) (TCGA IlluminaHiSeq_RNASeqV2, log2(normalized_count+1) data, version 2016-08-16) (Spearman’s Rank Correlation (p-value<0.05 and coefficient<-0.25)) |
| Cancer type | miRNA id | miRNA accession | P-val. | Coeff. | # samples |
| Top |
| TissGeneMut for DNAJC22 |
| TissGeneSNV for DNAJC22 |
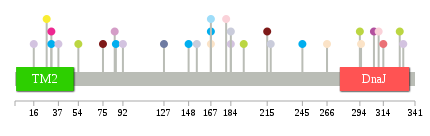
| nsSNV counts per each loci. Different colors of circles represent different cancer types. Circle size denotes number of samples. (TCGA somatic mutation (SNPs and small INDELs) data, version 2016-04-25) * Click on the image to enlarge it in a new window. |
 |
 |
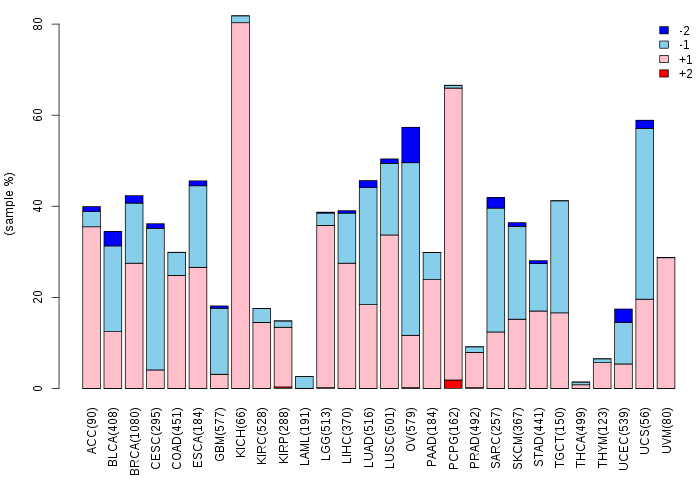
| Somatic nucleotide variants of TissGene across 28 cancer types (X-axis: cancer type and Y-axis: % of mutated samples) The numbers in parentheses are numbers of samples with mutation (nsSNVs). (TCGA somatic mutation (SNPs and small INDELs) data, version 2016-04-25) |
 |
| - nsSNVs sorted by frequency. |
| AAchange | Cancer type | # samples |
| p.E292K | HNSC | 1 |
| p.E328K | SKCM | 1 |
| p.E314D | KIRP | 1 |
| p.I155V | LIHC | 1 |
| p.V180E | BLCA | 1 |
| p.Q127H | PAAD | 1 |
| p.R167H | COAD | 1 |
| p.V85M | LGG | 1 |
| p.L245P | STAD | 1 |
| p.P75H | PRAD | 1 |
| p.R167C | UCEC | 1 |
| p.A31T | BRCA | 1 |
| p.G16S | LUAD | 1 |
| p.R148H | STAD | 1 |
| p.H294L | SKCM | 1 |
| p.F266S | UCEC | 1 |
| p.R184G | LIHC | 1 |
| p.G125S | HNSC | 1 |
| p.P306S | GBM | 1 |
| p.T37N | LUAD | 1 |
| p.A31T | STAD | 1 |
| p.L76V | HNSC | 1 |
| p.R167H | STAD | 1 |
| p.P195L | SKCM | 1 |
| p.G92C | LUAD | 1 |
| p.L310M | BLCA | 1 |
| p.R295Q | UCEC | 1 |
| p.F218Y | LIHC | 1 |
| p.S331R | LUAD | 1 |
| p.F215S | PRAD | 1 |
| p.R27K | THCA | 1 |
| p.I86M | STAD | 1 |
| p.R184C | LUAD | 1 |
| p.S54N | SKCM | 1 |
| Top |
| TissGeneCNV for DNAJC22 |
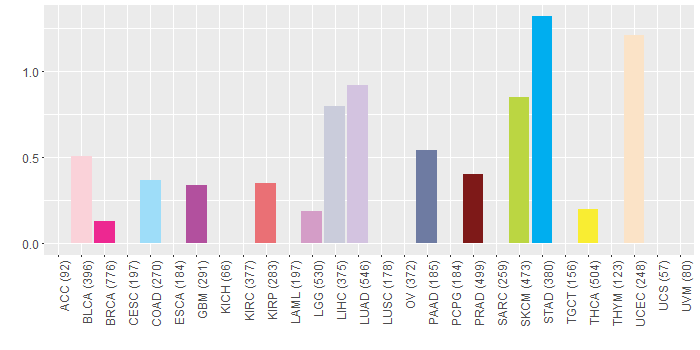
| Copy number variations of TissGene across 28 cancer types (X-axis: cancer type and Y-axis: % of CNV samples) (TCGA Gistic2_CopyNumber_Gistic2_all_data_by_genes, Gistic2 copy number data, version 2016-08-16) |
 |
| Top |
| TissGeneFusions for DNAJC22 |
| Fusion genes including TissGene (ChimerDB 3.0, 2016-12-01 and TCGA fusion Portal 2015-12-01) |
| Database | Src | Cancer type | Sample | Fusion gene | ORF | 5'-gene BP | 3'-gene BP |
| Chimerdb3.0 | ChiTaRs | NA | AK023298 | MUC16-DNAJC22 | chr19:9056241 | chr12:49742766 | |
| Chimerdb3.0 | ChiTaRs | NA | BG978182 | DNAJC22-DNAJC22 | chr12:49745182 | chr12:49744817 | |
| TCGAfusionPortal | PRADA | BRCA | TCGA-AR-A1AV-01A | DNAJC22-NTN4 | 5UTR-CDS | Chr12:49741334 | Chr12:96131922 |
| Top |
| TissGeneNet for DNAJC22 |
| Co-expressed gene networks based on protein-protein interaction data (CePIN) (TCGA IlluminaHiSeq_RNASeqV2, pan-cancer normalized log2(norm_counts+1) data, version 2016-08-16) (PINA2 ppi data) |
| Top |
| TissGeneProg for DNAJC22 |
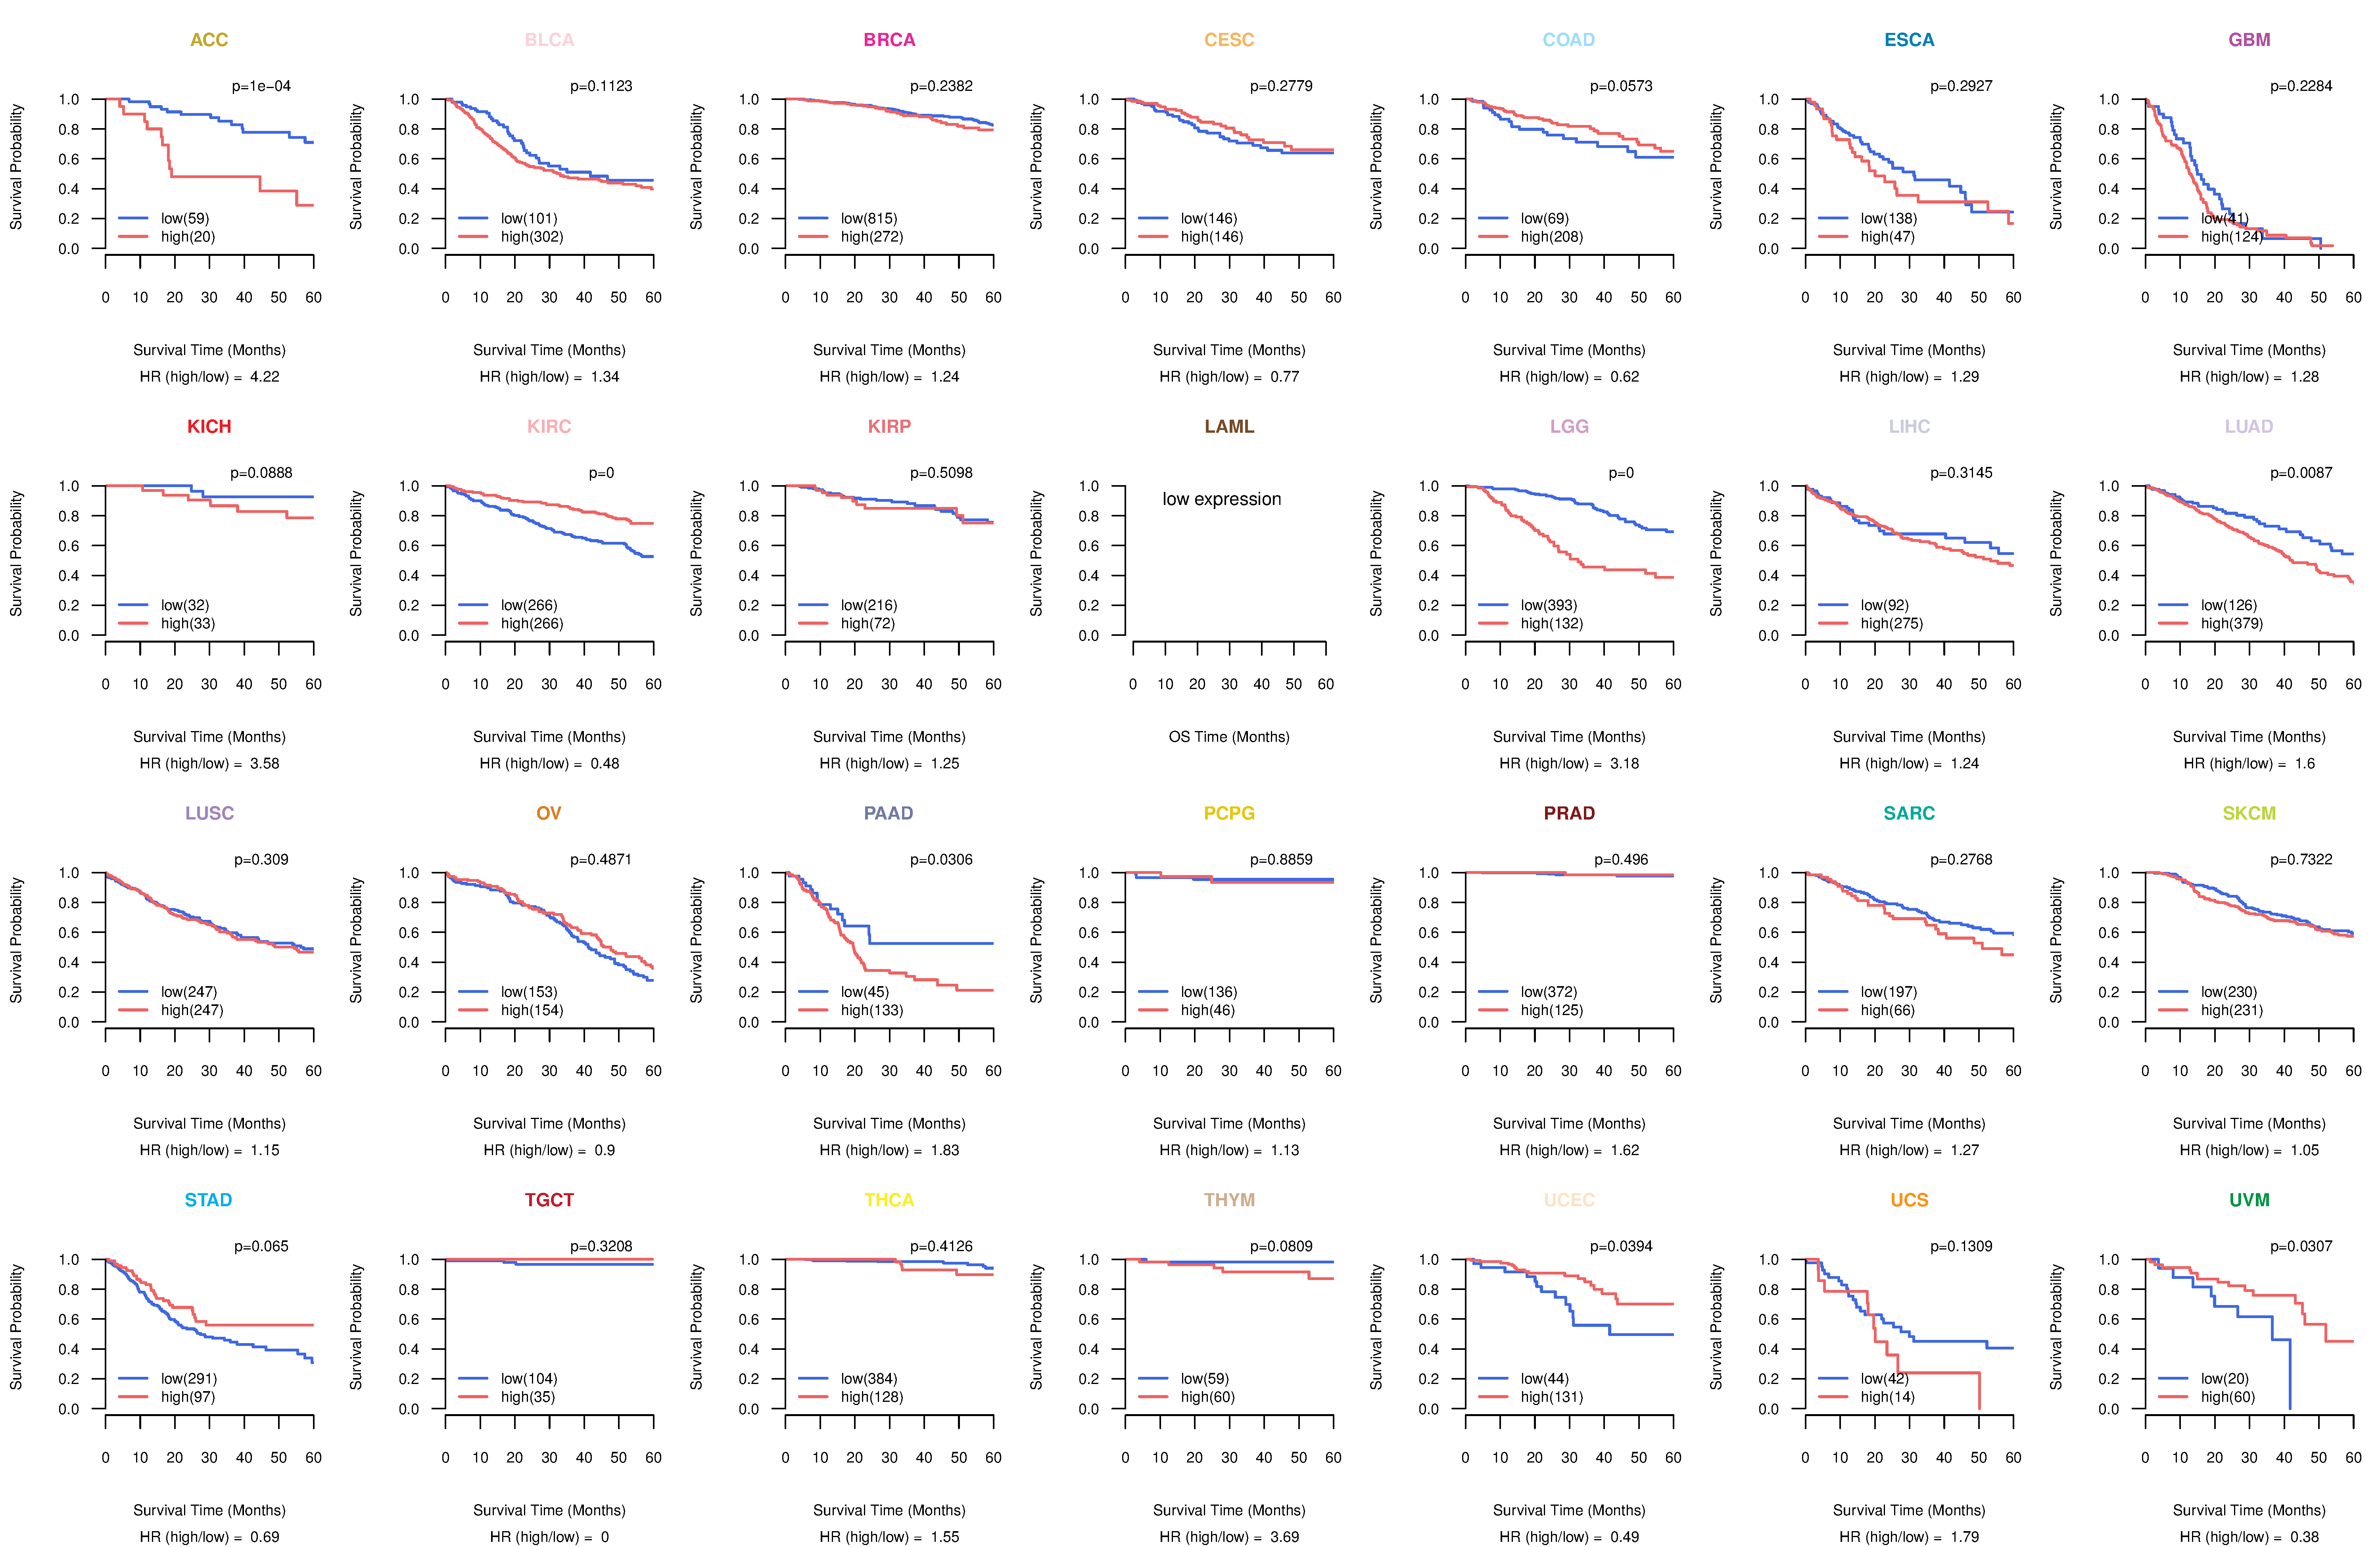
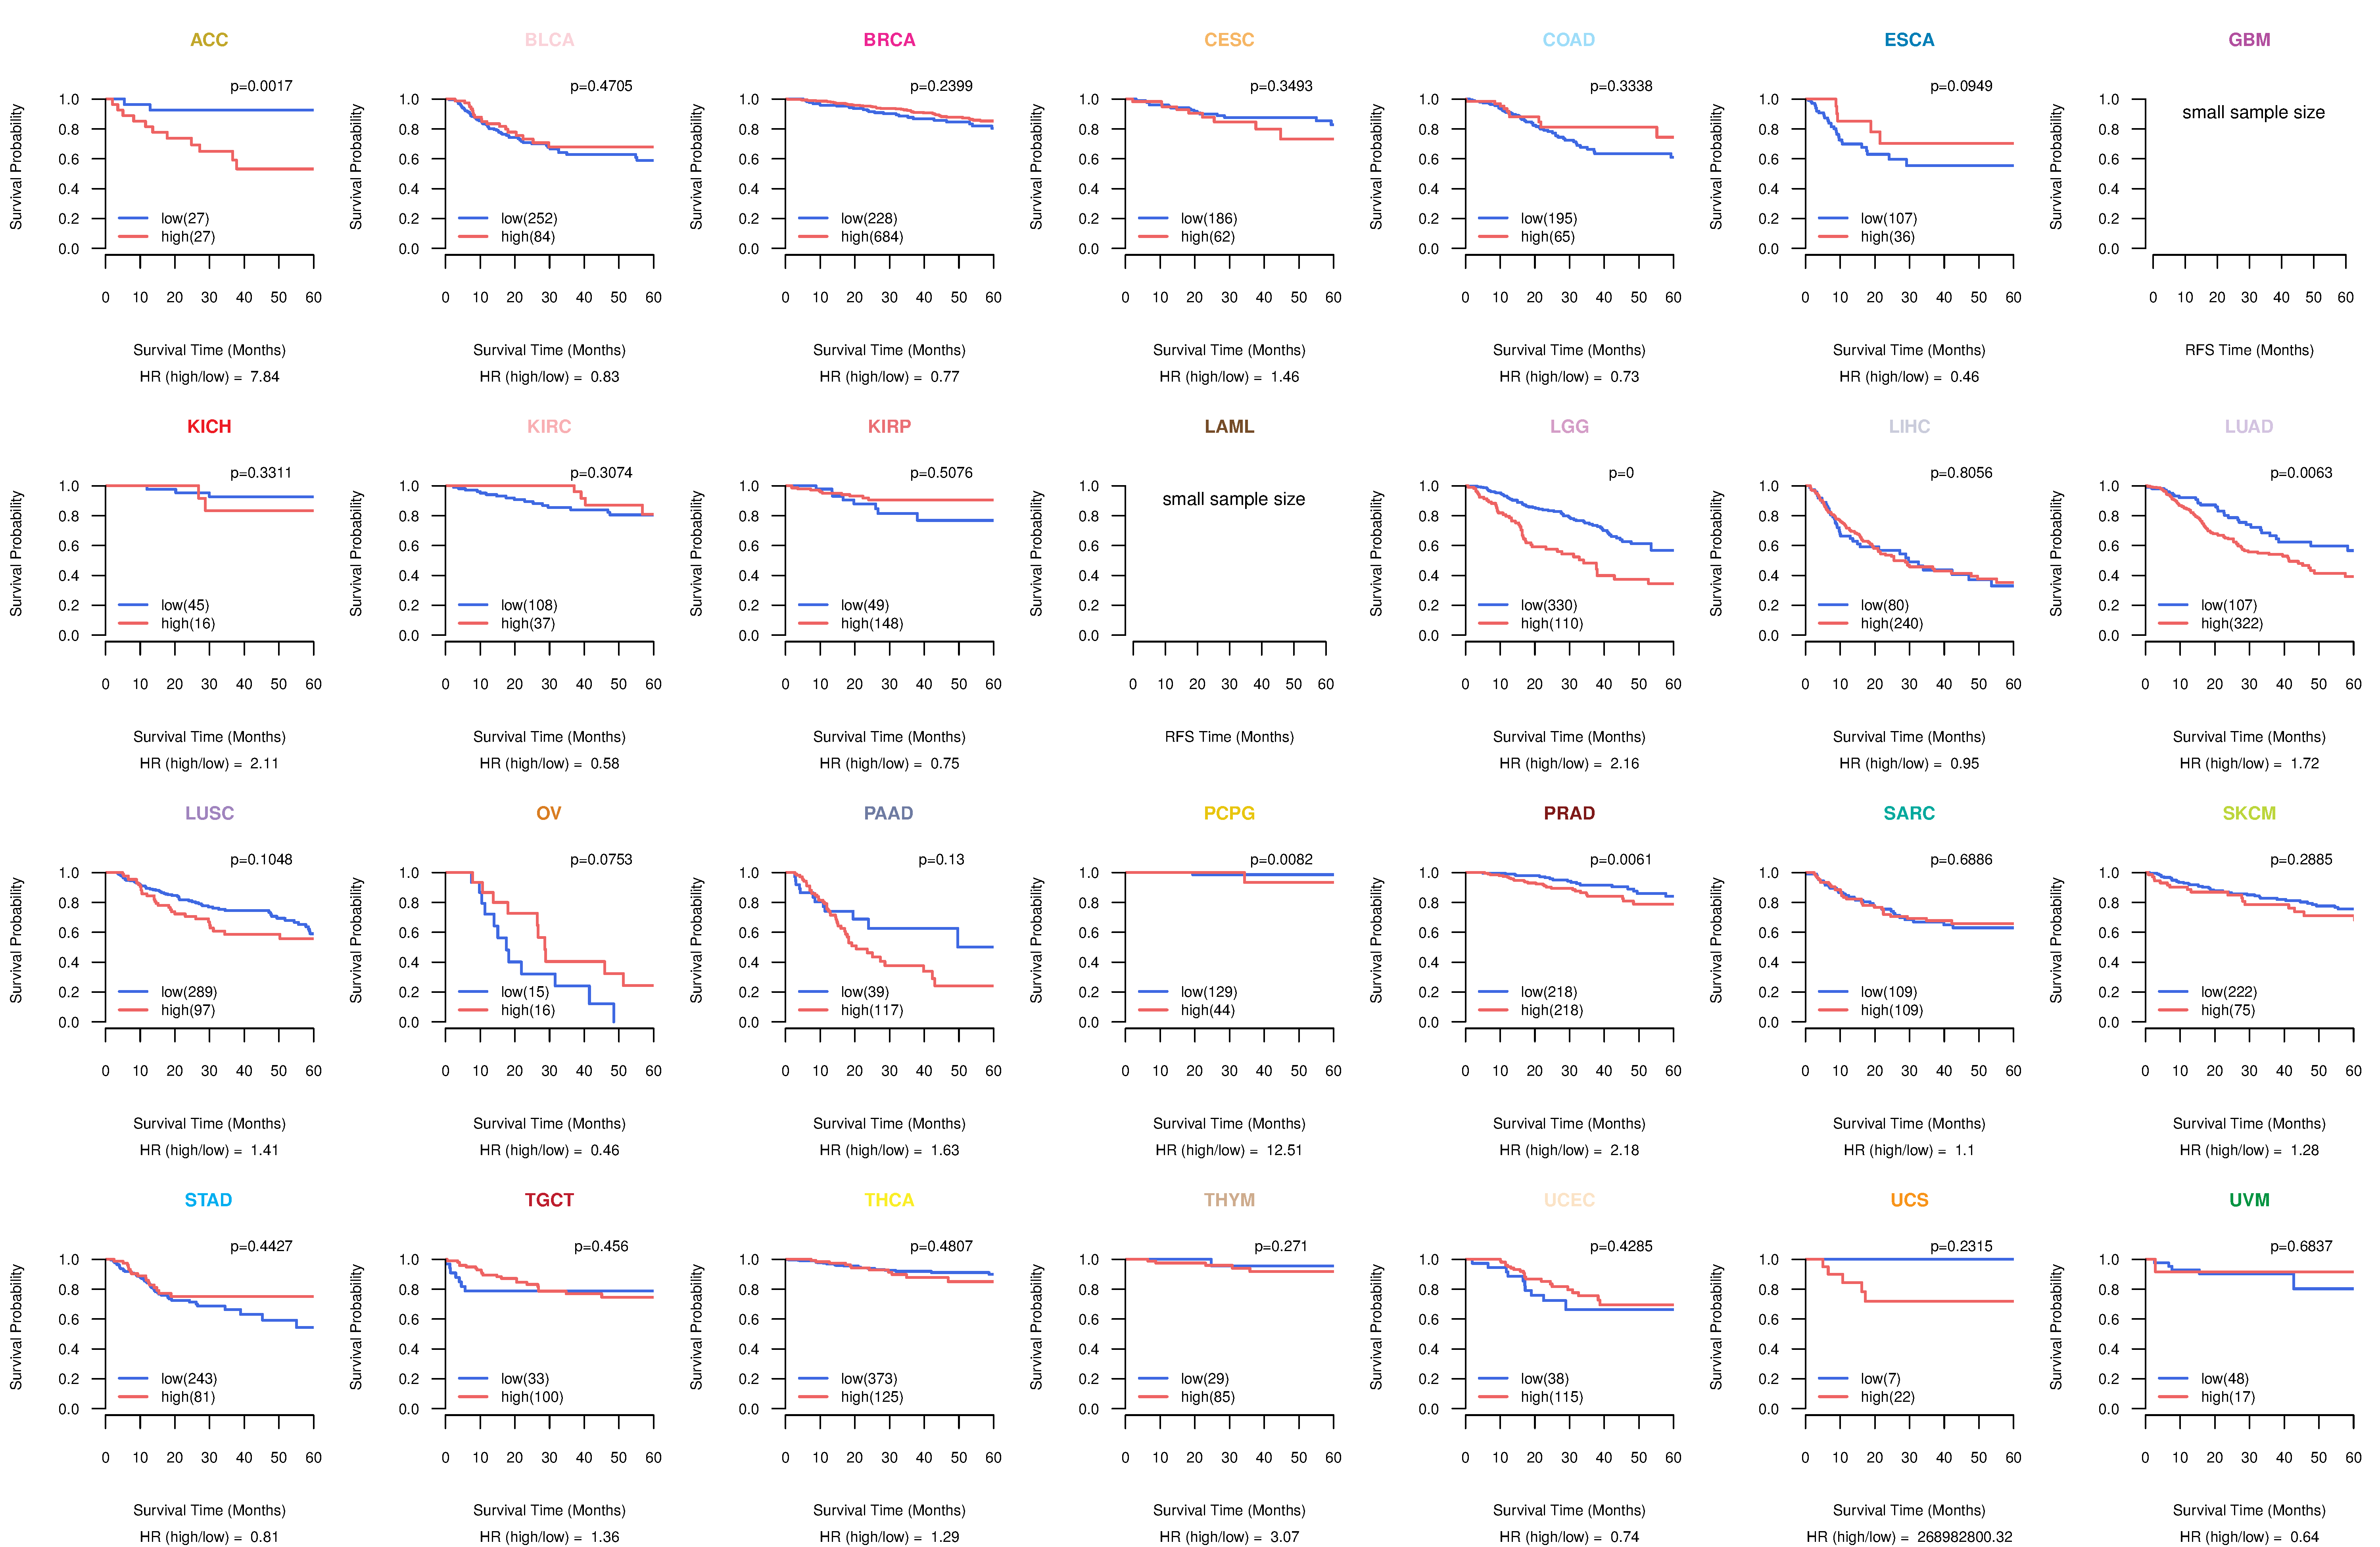
| Kaplan-Meier plots with logrank tests of overall survival (OS) using 28 cancer types (TCGA IlluminaHiSeq_RNASeqV2, pan-cancer normalized log2(norm_counts+1) data, version 2016-08-16) (TCGA clinicalMatrix, phenotype data, version 2016-04-27) * Click on the image to enlarge it in a new window. |
 |
| Kaplan-Meier plots with logrank test of relapse free survival (RFS) using 28 cancer types (TCGA IlluminaHiSeq_RNASeqV2, pan-cancer normalized log2(norm_counts+1) data, version 2016-08-16) (TCGA clinicalMatrix, phenotype data, version 2016-04-27) * Click on the image enlarge it in a new window. |
 |
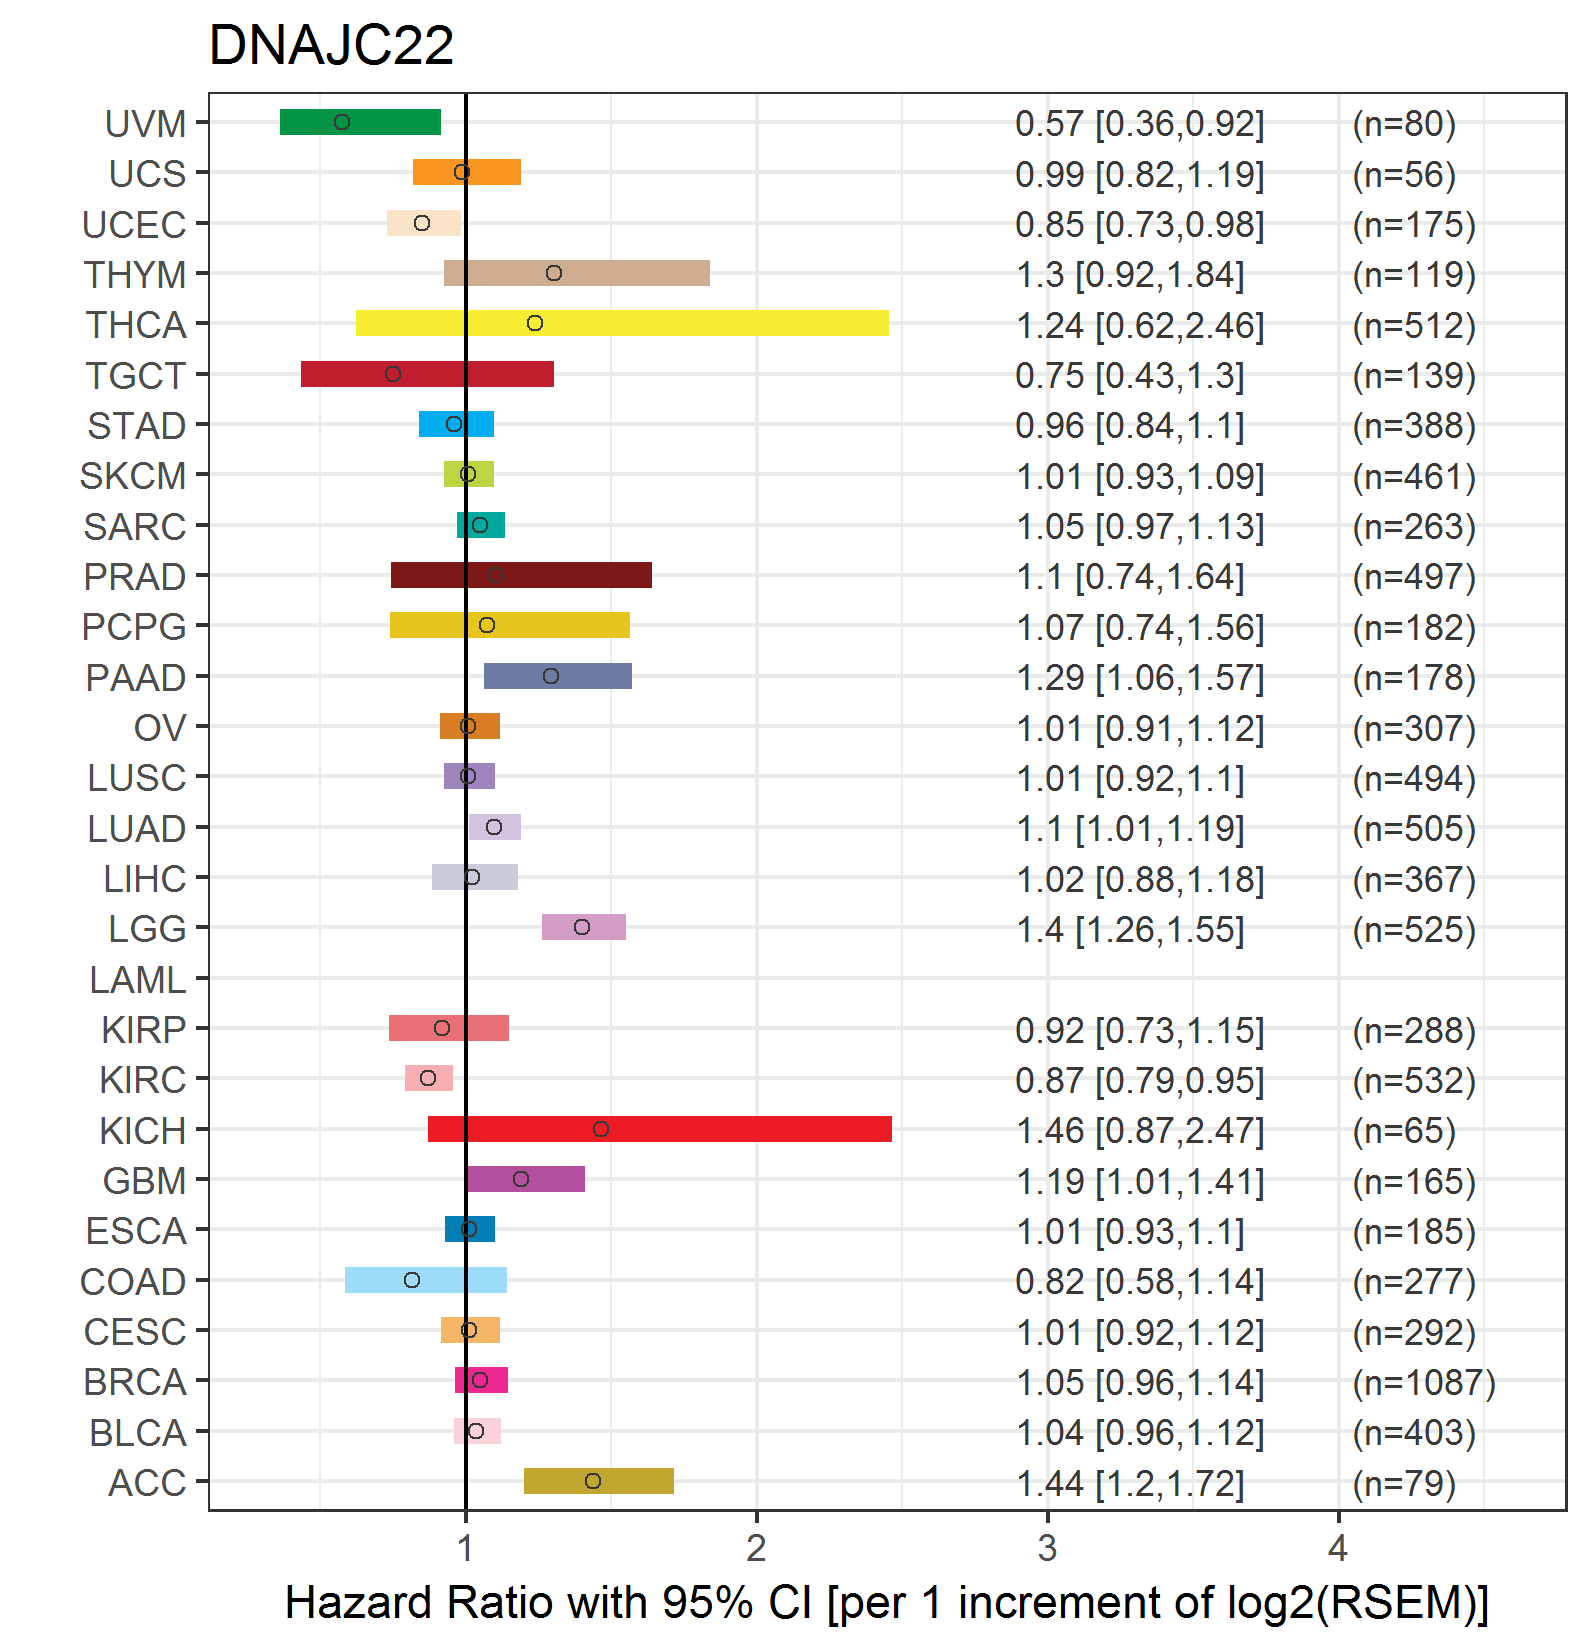
| Forest plot of Cox proportional hazard ratio (HR) and 95% CI of overall survival (OS) using 28 cancer types (TCGA IlluminaHiSeq_RNASeqV2, pan-cancer normalized log2(norm_counts+1) data, version 2016-08-16) (TCGA clinicalMatrix, phenotype data, version 2016-04-27) * Click on the image enlarge it in a new window. |
 |
| Forest plot of Cox proportional hazard ratio (HR) and 95% CI of relapse free survival (RFS) using 28 cancer types (TCGA IlluminaHiSeq_RNASeqV2, pan-cancer normalized log2(norm_counts+1) data, version 2016-08-16) (TCGA clinicalMatrix, phenotype data, version 2016-04-27) * Click on the image enlarge it in a new window. |
 |
| Top |
| TissGeneClin for DNAJC22 |
| TissGeneDrug for DNAJC22 |
| Drug information targeting TissGene (DrugBank Version 5.0.6, 2017-04-01) |
| DrugBank ID | Drug name | Drug activity | Drug type | Drug status |
| Top |
| TissGeneDisease for DNAJC22 |
| Disease information associated with TissGene (DisGeNet, 2016-06-01) |
| Disease ID | Disease name | # pubmeds | Source |
|
Copyright 2016-Present - The University of Texas Health Science Center at Houston (UTHealth) Web File Viewing | How to Report, Fraud, Waste and Abuse | State of Texas | Statewide Search | Texas Homeland Security | Site Policies |