 |
| |
| |
| |
| |
| |
| |
|

| TissGeneSummary for RMI1 |
 Gene summary Gene summary |
| Basic gene information | Gene symbol | RMI1 |
| Gene name | RecQ mediated genome instability 1 | |
| Synonyms | BLAP75|C9orf76|FAAP75 | |
| Cytomap | UCSC genome browser: 9q21.32 | |
| Type of gene | protein-coding | |
| RefGenes | NM_024945.2, | |
| Description | BLM-associated polypeptide, 75 kDaBLM-associated protein 75 kDaRMI1, RecQ mediated genome instability 1, homologhomolog of yeast RecQ-mediated genome instability 1 (RMI1)recQ-mediated genome instability protein 1 | |
| Modification date | 20141207 | |
| dbXrefs | MIM : 610404 | |
| HGNC : HGNC | ||
| Ensembl : ENSG00000178966 | ||
| HPRD : 09867 | ||
| Vega : OTTHUMG00000020113 | ||
| Protein | UniProt: go to UniProt's Cross Reference DB Table | |
| Expression | CleanEX: HS_RMI1 | |
| BioGPS: 80010 | ||
| Pathway | NCI Pathway Interaction Database: RMI1 | |
| KEGG: RMI1 | ||
| REACTOME: RMI1 | ||
| Pathway Commons: RMI1 | ||
| Context | iHOP: RMI1 | |
| ligand binding site mutation search in PubMed: RMI1 | ||
| UCL Cancer Institute: RMI1 | ||
| Assigned class in TissGDB* | C | |
| Included tissue-specific gene expression resources | TiGER,GTEx | |
| Specific-tissues in normal samples (assigned by TissGDB using HPA, TiGER, and GTEx) | LiverTestis | |
| Cancer types related to the specific-tissues in cancer samples (assigned by TissGDB using TCGA) | LIHCTGCT | |
| Reference showing the relevant tissue of RMI1 | ||
| Description by TissGene annotations | TissgsLTS | |
| * Class A consists of genes with literature evidence and is part of the cTissGenes. Class B consists of only cTissGenes without additional evidence. The remaining genes belong to Class C. |
| Gene ontology having evidence of Inferred from Direct Assay (IDA) from Entrez |
| GO ID | GO term | PubMed ID |
| Top |
| TissGeneExp for RMI1 |
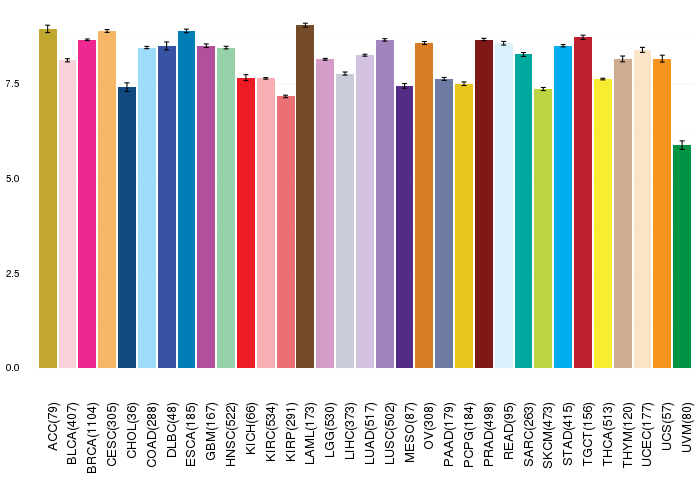
| Gene expressions across 28 cancer types (X-axis: cancer type and Y-axis: log2(norm_counts+1)) (TCGA IlluminaHiSeq_RNASeqV2, pan-cancer normalized log2(norm_counts+1) data, version 2016-08-16) |
 |
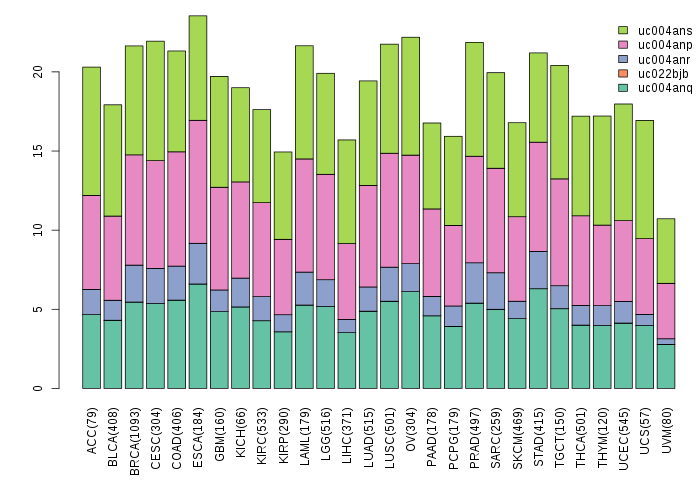
| Gene isoform expressions across 28 cancer types (X-axis: cancer type and Y-axis: log2(norm_counts+1)) (TCGA pan-cancer tcga_rsem_isoform_tpm, version 2016-09-01) |
 |
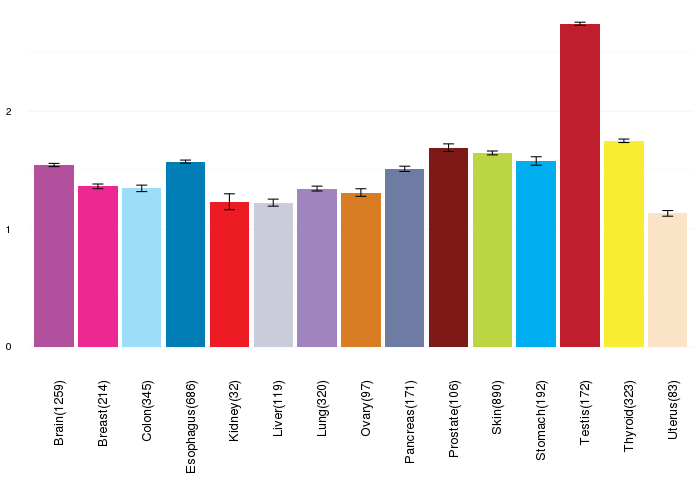
| Gene expressions across normal tissues of GTEx data (GTEx GTEx_Analysis_v6_RNA-seq_RNA-SeQCv1.1.8_gene_rpkm.gct) - Here, we shows the matched tissue types only among our 28 cancer types. |
 |
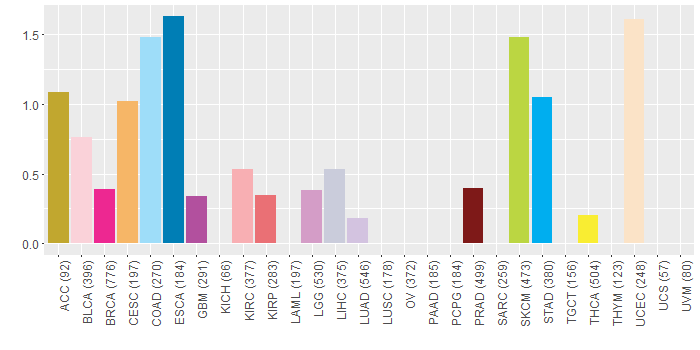
| Different expressions across 14 cancer types with more than 10 samples between matched tumors and normals (X-axis: cancer type and Y-axis: log2(norm_counts+1)) (TCGA IlluminaHiSeq_RNASeqV2, pan-cancer normalized log2(norm_counts+1) data, version 2016-08-16) |
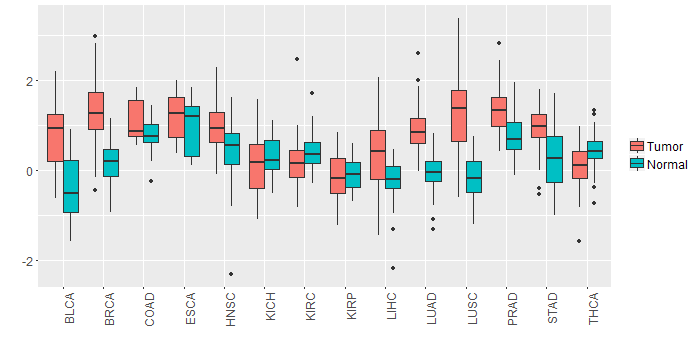 |
| - Significantly differentially expressed cancer types and information. (|Fold change|>1 and FDR<0.05) |
| Cancer type | Mean(exp) in tumor | Mean(exp) in matched normal | Log2FC | P-val. | FDR |
| BRCA | 1.320901141 | 0.167353773 | 1.153547368 | 1.14E-36 | 2.31E-35 |
| LUSC | 1.209843195 | -0.190247001 | 1.400090196 | 1.79E-15 | 1.18E-14 |
| BLCA | 0.78542658 | -0.405520789 | 1.190947368 | 1.35E-05 | 0.00024375 |
| Top |
| TissGene-miRNA for RMI1 |
| Significantly anti-correlated miRNAs of TissGene across 28 cancer types (Gene-miRNA relations from TargetScanHuman Relsease 7.1, Conserved_Site_Context_Scores.txt.zip, 06.01.2016) (TCGA IlluminaHiSeq_miRNASeq, log2(RPM+1) data, version 2016-11-21) (TCGA IlluminaHiSeq_RNASeqV2, log2(normalized_count+1) data, version 2016-08-16) (Spearman’s Rank Correlation (p-value<0.05 and coefficient<-0.25)) |
| Cancer type | miRNA id | miRNA accession | P-val. | Coeff. | # samples |
| Top |
| TissGeneMut for RMI1 |
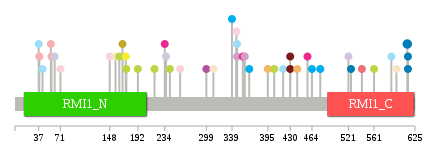
| TissGeneSNV for RMI1 |
| nsSNV counts per each loci. Different colors of circles represent different cancer types. Circle size denotes number of samples. (TCGA somatic mutation (SNPs and small INDELs) data, version 2016-04-25) * Click on the image to enlarge it in a new window. |
 |
 |
| Somatic nucleotide variants of TissGene across 28 cancer types (X-axis: cancer type and Y-axis: % of mutated samples) The numbers in parentheses are numbers of samples with mutation (nsSNVs). (TCGA somatic mutation (SNPs and small INDELs) data, version 2016-04-25) |
 |
| - nsSNVs sorted by frequency. |
| AAchange | Cancer type | # samples |
| p.M613I | ESCA | 2 |
| p.K166N | READ | 1 |
| p.G525V | ESCA | 1 |
| p.E614* | ESCA | 1 |
| p.R347Q | COAD | 1 |
| p.R62W | LIHC | 1 |
| p.P242S | SKCM | 1 |
| p.G148E | BLCA | 1 |
| p.T359M | LGG | 1 |
| p.P299T | GBM | 1 |
| p.E310* | UCEC | 1 |
| p.P163S | SKCM | 1 |
| p.T430A | PRAD | 1 |
| p.W56L | KIRC | 1 |
| p.D587H | READ | 1 |
| p.L168F | ACC | 1 |
| p.Q457R | BRCA | 1 |
| p.T258I | BLCA | 1 |
| p.C366W | STAD | 1 |
| p.D542Y | KIRP | 1 |
| p.D71N | BLCA | 1 |
| p.S601Y | READ | 1 |
| p.K625T | READ | 1 |
| p.D234N | BRCA | 1 |
| p.S174F | SKCM | 1 |
| p.L588V | COAD | 1 |
| p.T430I | PRAD | 1 |
| p.L157I | UCEC | 1 |
| p.R395T | CESC | 1 |
| p.I173M | THCA | 1 |
| p.V218I | SKCM | 1 |
| p.S477N | STAD | 1 |
| p.D346N | UCEC | 1 |
| p.M561I | SKCM | 1 |
| p.L521V | LUAD | 1 |
| p.K419N | COAD | 1 |
| p.G192S | SKCM | 1 |
| p.E37X | COAD | 1 |
| p.N38K | KIRC | 1 |
| p.R347G | LGG | 1 |
| p.L236R | LIHC | 1 |
| p.K441R | CESC | 1 |
| p.D346N | BLCA | 1 |
| p.E614X | ESCA | 1 |
| p.P356T | BRCA | 1 |
| p.H405Y | SKCM | 1 |
| p.C464W | STAD | 1 |
| p.L57F | KIRC | 1 |
| p.L339W | STAD | 1 |
| p.F596C | UCEC | 1 |
| p.L43S | COAD | 1 |
| p.A259T | READ | 1 |
| Top |
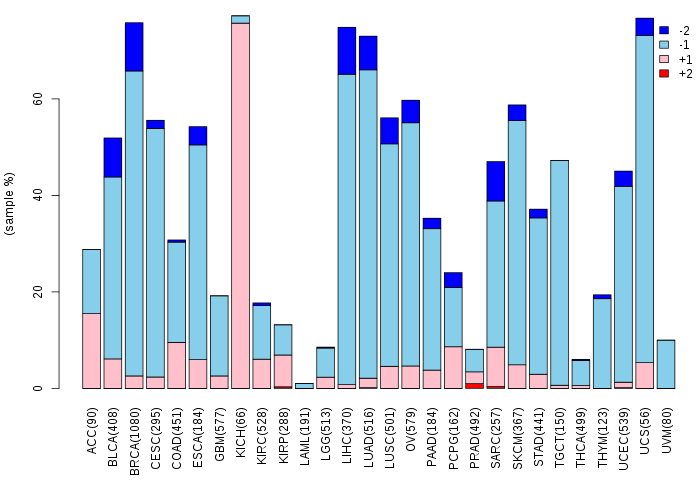
| TissGeneCNV for RMI1 |
| Copy number variations of TissGene across 28 cancer types (X-axis: cancer type and Y-axis: % of CNV samples) (TCGA Gistic2_CopyNumber_Gistic2_all_data_by_genes, Gistic2 copy number data, version 2016-08-16) |
 |
| Top |
| TissGeneFusions for RMI1 |
| Fusion genes including TissGene (ChimerDB 3.0, 2016-12-01 and TCGA fusion Portal 2015-12-01) |
| Database | Src | Cancer type | Sample | Fusion gene | ORF | 5'-gene BP | 3'-gene BP |
| TCGAfusionPortal | PRADA | GBM | TCGA-06-0744-01A | RMI1-STX17 | NA | Chr9:86595806 | Chr9:102691060 |
| Top |
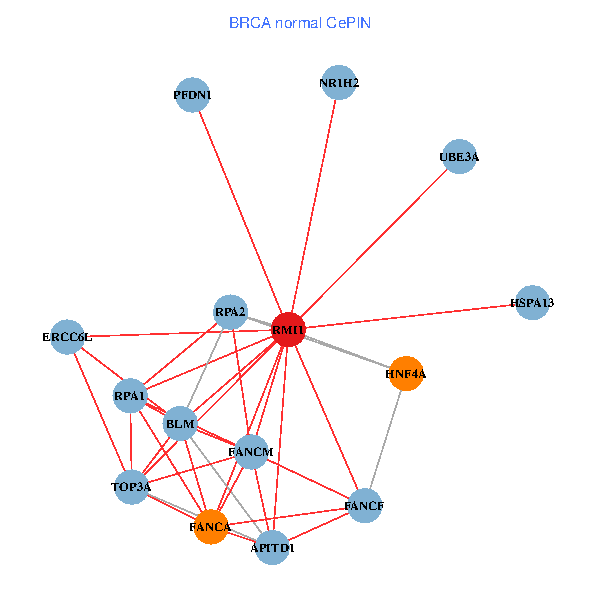
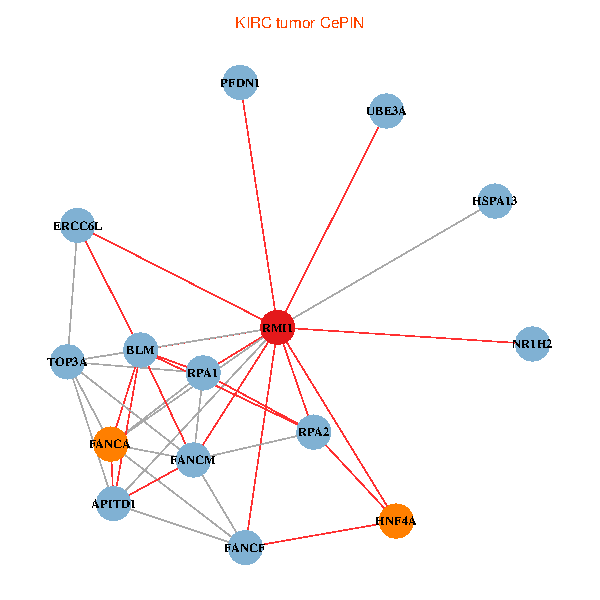
| TissGeneNet for RMI1 |
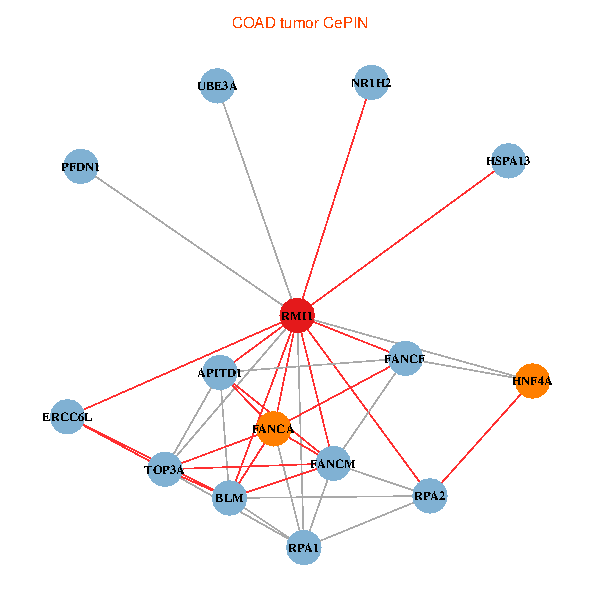
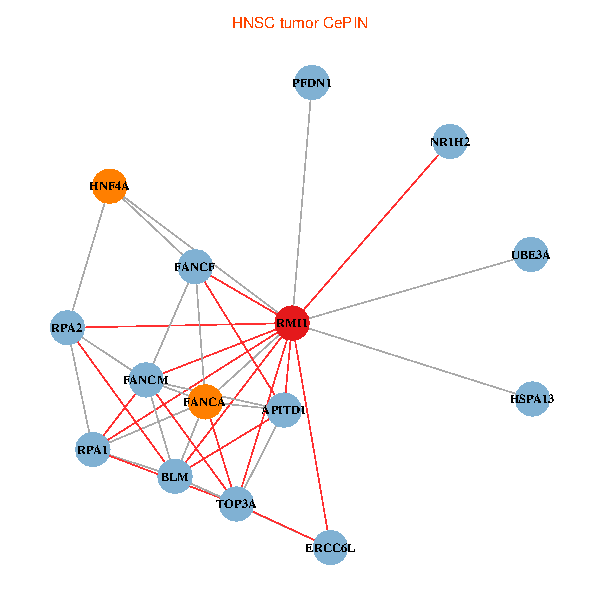
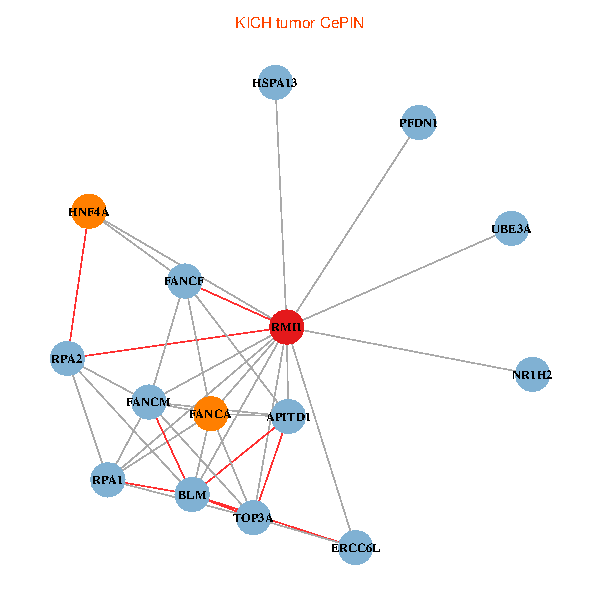
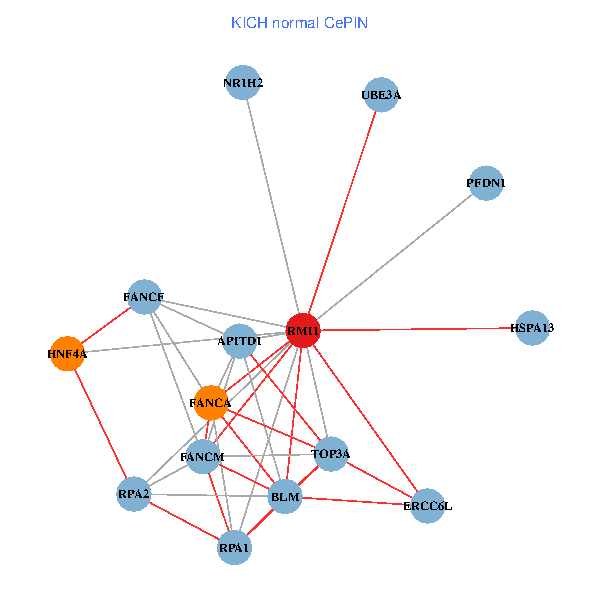
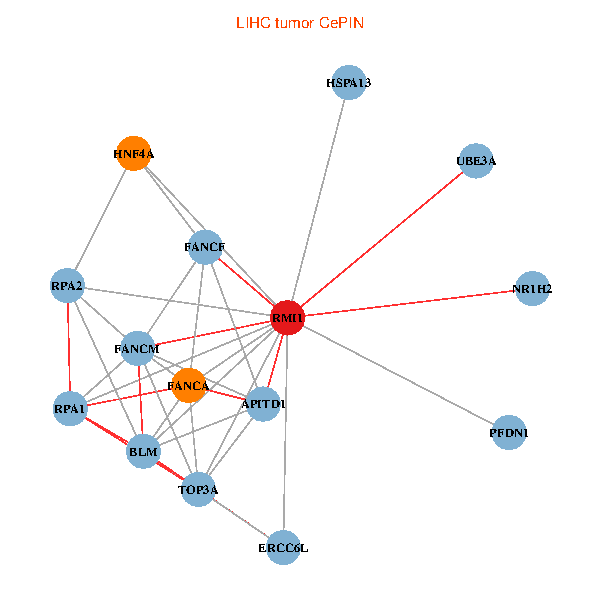
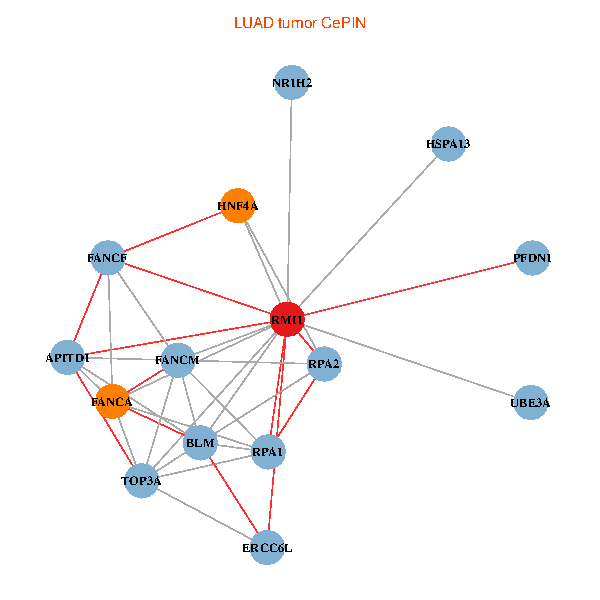
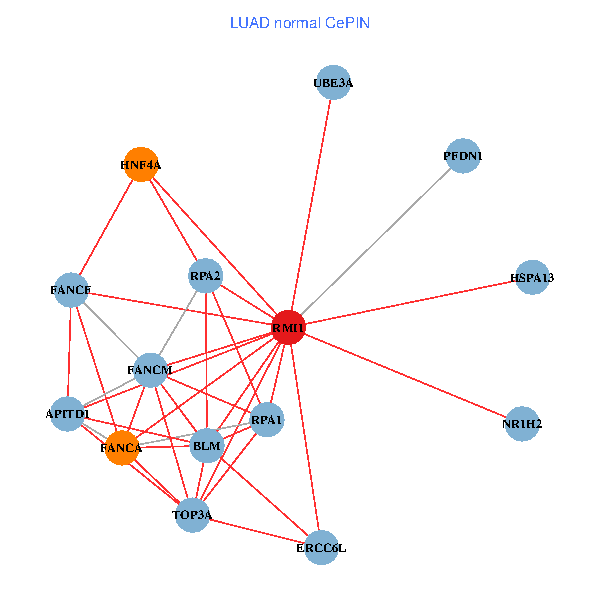
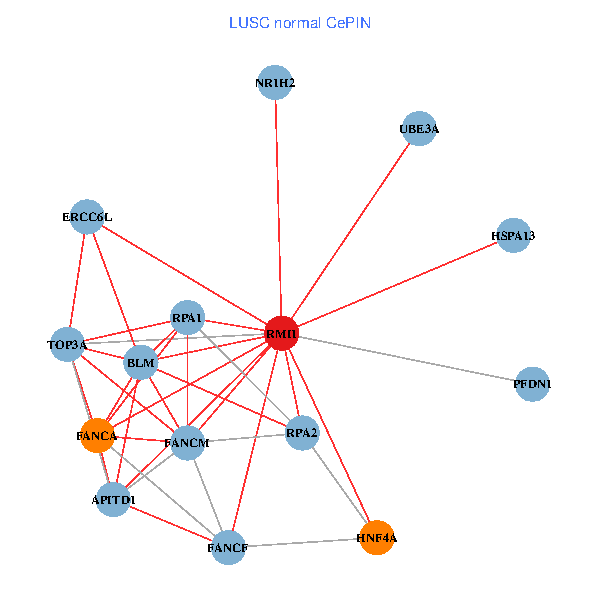
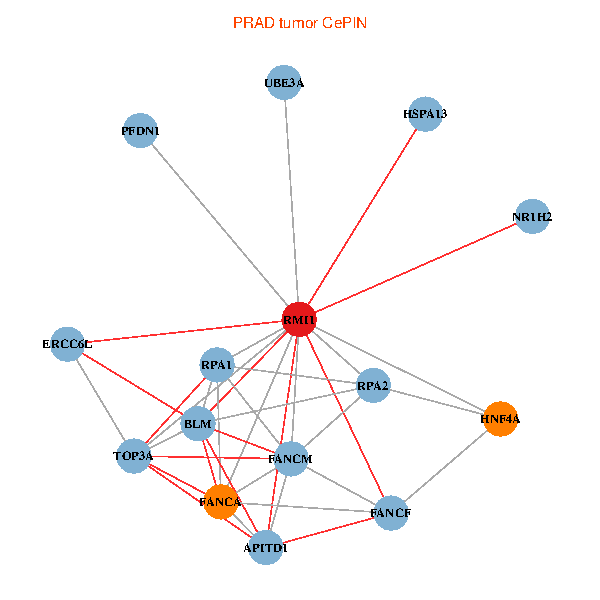
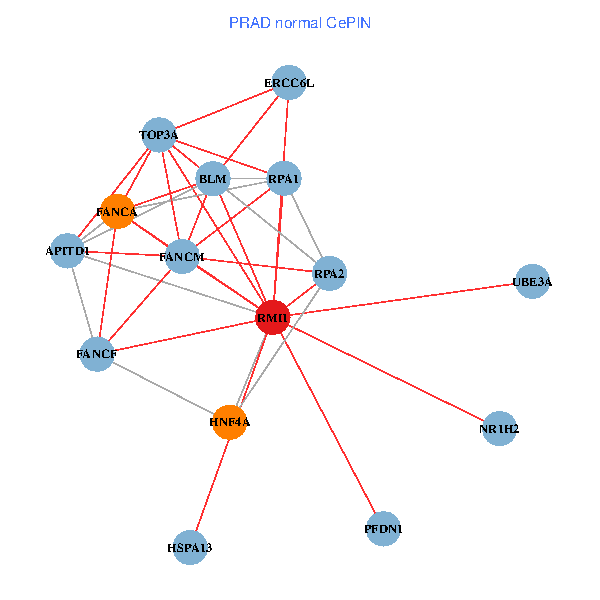
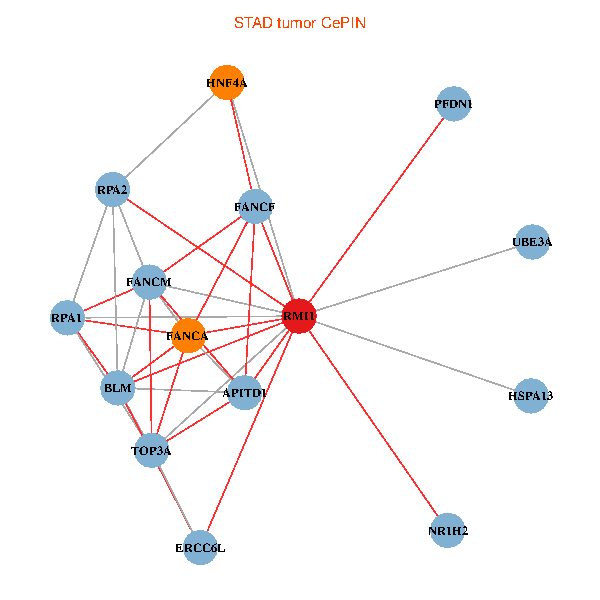
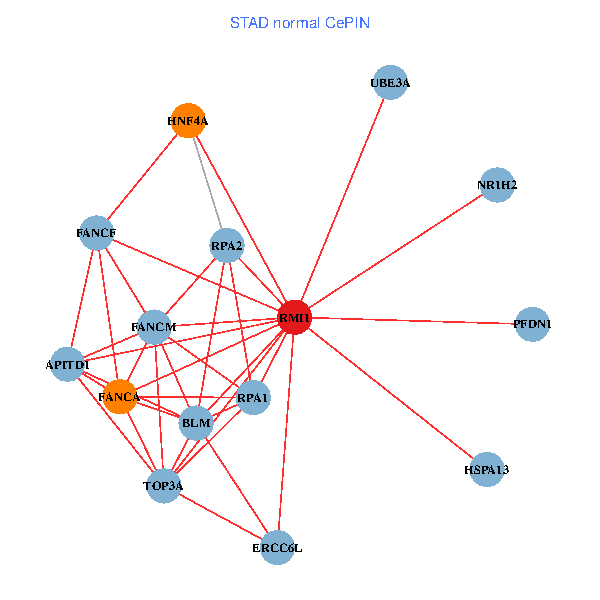
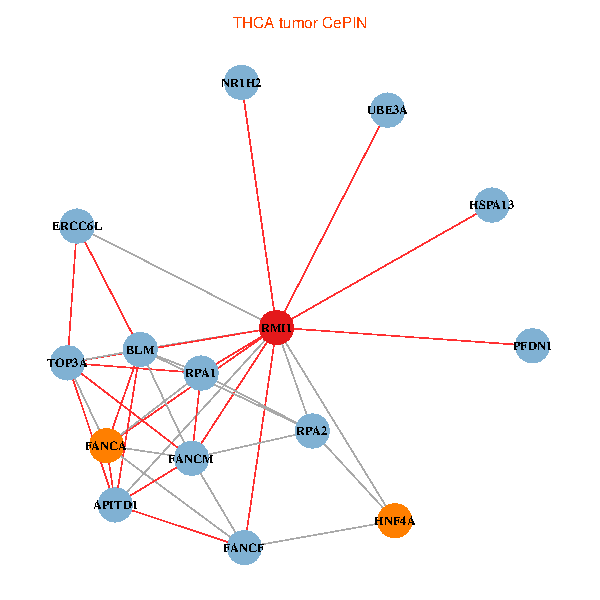
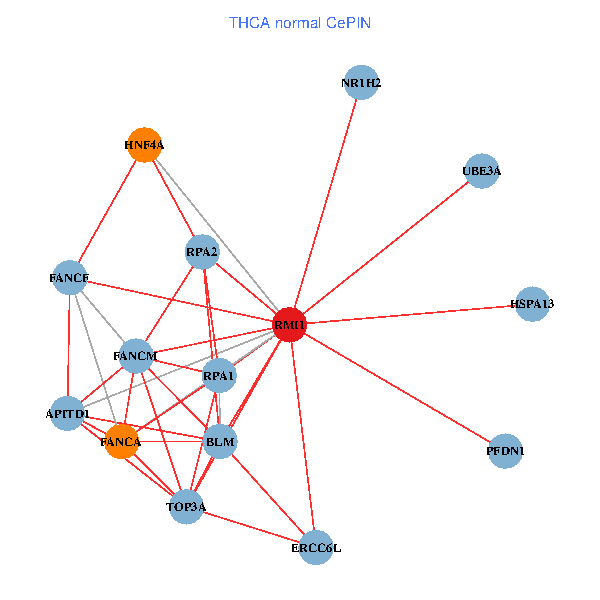
| Co-expressed gene networks based on protein-protein interaction data (CePIN) (TCGA IlluminaHiSeq_RNASeqV2, pan-cancer normalized log2(norm_counts+1) data, version 2016-08-16) (PINA2 ppi data) |
| BRCA (tumor) | BRCA (normal) |
| RMI1, HNF4A, PFDN1, UBE3A, RPA1, BLM, FANCF, RPA2, FANCA, TOP3A, FANCM, NR1H2, APITD1, ERCC6L, HSPA13 (tumor) | RMI1, HNF4A, PFDN1, UBE3A, RPA1, BLM, FANCF, RPA2, FANCA, TOP3A, FANCM, NR1H2, APITD1, ERCC6L, HSPA13 (normal) |
 |  |
| COAD (tumor) | COAD (normal) |
| RMI1, HNF4A, PFDN1, UBE3A, RPA1, BLM, FANCF, RPA2, FANCA, TOP3A, FANCM, NR1H2, APITD1, ERCC6L, HSPA13 (tumor) | RMI1, HNF4A, PFDN1, UBE3A, RPA1, BLM, FANCF, RPA2, FANCA, TOP3A, FANCM, NR1H2, APITD1, ERCC6L, HSPA13 (normal) |
 |  |
| HNSC (tumor) | HNSC (normal) |
| RMI1, HNF4A, PFDN1, UBE3A, RPA1, BLM, FANCF, RPA2, FANCA, TOP3A, FANCM, NR1H2, APITD1, ERCC6L, HSPA13 (tumor) | RMI1, HNF4A, PFDN1, UBE3A, RPA1, BLM, FANCF, RPA2, FANCA, TOP3A, FANCM, NR1H2, APITD1, ERCC6L, HSPA13 (normal) |
 |  |
| KICH (tumor) | KICH (normal) |
| RMI1, HNF4A, PFDN1, UBE3A, RPA1, BLM, FANCF, RPA2, FANCA, TOP3A, FANCM, NR1H2, APITD1, ERCC6L, HSPA13 (tumor) | RMI1, HNF4A, PFDN1, UBE3A, RPA1, BLM, FANCF, RPA2, FANCA, TOP3A, FANCM, NR1H2, APITD1, ERCC6L, HSPA13 (normal) |
 |  |
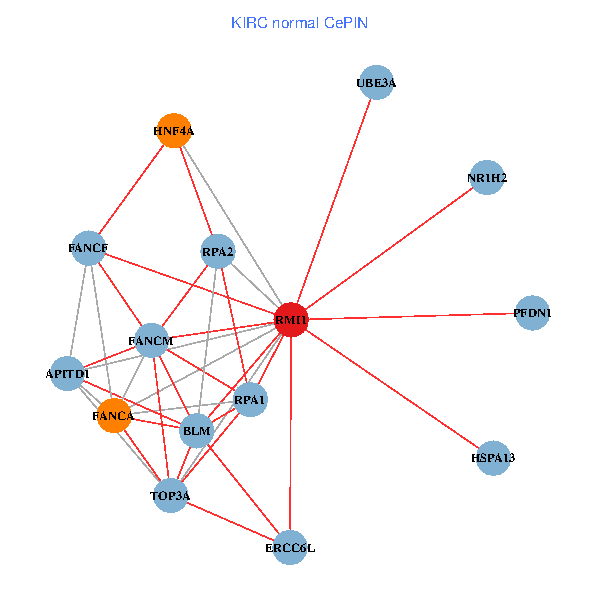
| KIRC (tumor) | KIRC (normal) |
| RMI1, HNF4A, PFDN1, UBE3A, RPA1, BLM, FANCF, RPA2, FANCA, TOP3A, FANCM, NR1H2, APITD1, ERCC6L, HSPA13 (tumor) | RMI1, HNF4A, PFDN1, UBE3A, RPA1, BLM, FANCF, RPA2, FANCA, TOP3A, FANCM, NR1H2, APITD1, ERCC6L, HSPA13 (normal) |
 |  |
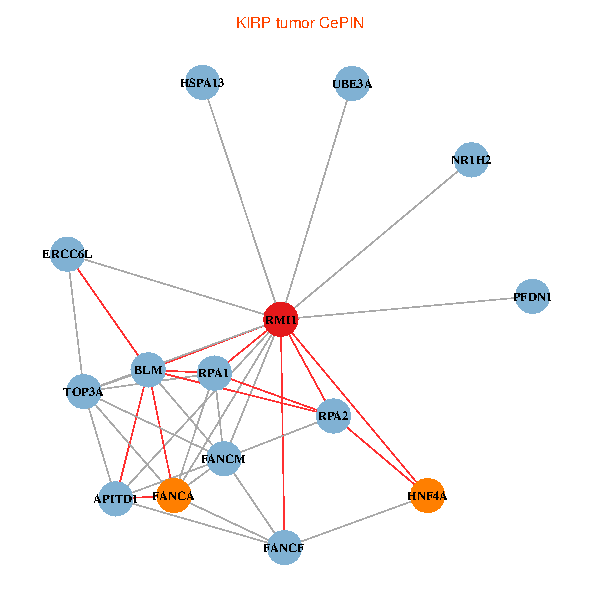
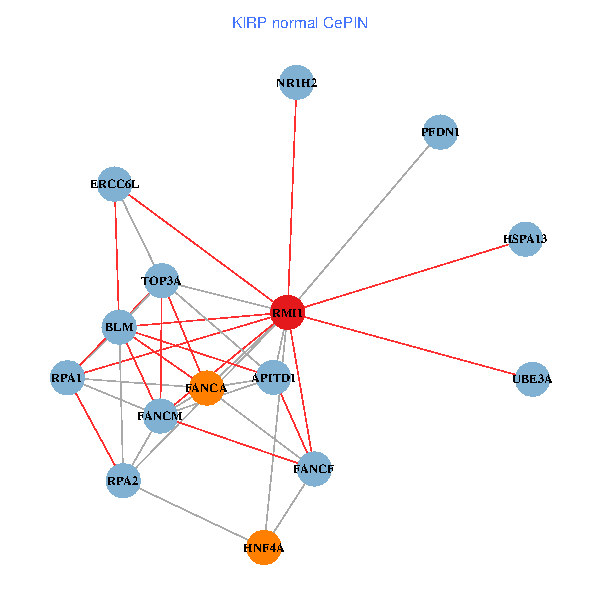
| KIRP (tumor) | KIRP (normal) |
| RMI1, HNF4A, PFDN1, UBE3A, RPA1, BLM, FANCF, RPA2, FANCA, TOP3A, FANCM, NR1H2, APITD1, ERCC6L, HSPA13 (tumor) | RMI1, HNF4A, PFDN1, UBE3A, RPA1, BLM, FANCF, RPA2, FANCA, TOP3A, FANCM, NR1H2, APITD1, ERCC6L, HSPA13 (normal) |
 |  |
| LIHC (tumor) | LIHC (normal) |
| RMI1, HNF4A, PFDN1, UBE3A, RPA1, BLM, FANCF, RPA2, FANCA, TOP3A, FANCM, NR1H2, APITD1, ERCC6L, HSPA13 (tumor) | RMI1, HNF4A, PFDN1, UBE3A, RPA1, BLM, FANCF, RPA2, FANCA, TOP3A, FANCM, NR1H2, APITD1, ERCC6L, HSPA13 (normal) |
 |  |
| LUAD (tumor) | LUAD (normal) |
| RMI1, HNF4A, PFDN1, UBE3A, RPA1, BLM, FANCF, RPA2, FANCA, TOP3A, FANCM, NR1H2, APITD1, ERCC6L, HSPA13 (tumor) | RMI1, HNF4A, PFDN1, UBE3A, RPA1, BLM, FANCF, RPA2, FANCA, TOP3A, FANCM, NR1H2, APITD1, ERCC6L, HSPA13 (normal) |
 |  |
| LUSC (tumor) | LUSC (normal) |
| RMI1, HNF4A, PFDN1, UBE3A, RPA1, BLM, FANCF, RPA2, FANCA, TOP3A, FANCM, NR1H2, APITD1, ERCC6L, HSPA13 (tumor) | RMI1, HNF4A, PFDN1, UBE3A, RPA1, BLM, FANCF, RPA2, FANCA, TOP3A, FANCM, NR1H2, APITD1, ERCC6L, HSPA13 (normal) |
 |  |
| PRAD (tumor) | PRAD (normal) |
| RMI1, HNF4A, PFDN1, UBE3A, RPA1, BLM, FANCF, RPA2, FANCA, TOP3A, FANCM, NR1H2, APITD1, ERCC6L, HSPA13 (tumor) | RMI1, HNF4A, PFDN1, UBE3A, RPA1, BLM, FANCF, RPA2, FANCA, TOP3A, FANCM, NR1H2, APITD1, ERCC6L, HSPA13 (normal) |
 |  |
| STAD (tumor) | STAD (normal) |
| RMI1, HNF4A, PFDN1, UBE3A, RPA1, BLM, FANCF, RPA2, FANCA, TOP3A, FANCM, NR1H2, APITD1, ERCC6L, HSPA13 (tumor) | RMI1, HNF4A, PFDN1, UBE3A, RPA1, BLM, FANCF, RPA2, FANCA, TOP3A, FANCM, NR1H2, APITD1, ERCC6L, HSPA13 (normal) |
 |  |
| THCA (tumor) | THCA (normal) |
| RMI1, HNF4A, PFDN1, UBE3A, RPA1, BLM, FANCF, RPA2, FANCA, TOP3A, FANCM, NR1H2, APITD1, ERCC6L, HSPA13 (tumor) | RMI1, HNF4A, PFDN1, UBE3A, RPA1, BLM, FANCF, RPA2, FANCA, TOP3A, FANCM, NR1H2, APITD1, ERCC6L, HSPA13 (normal) |
 |  |
| Top |
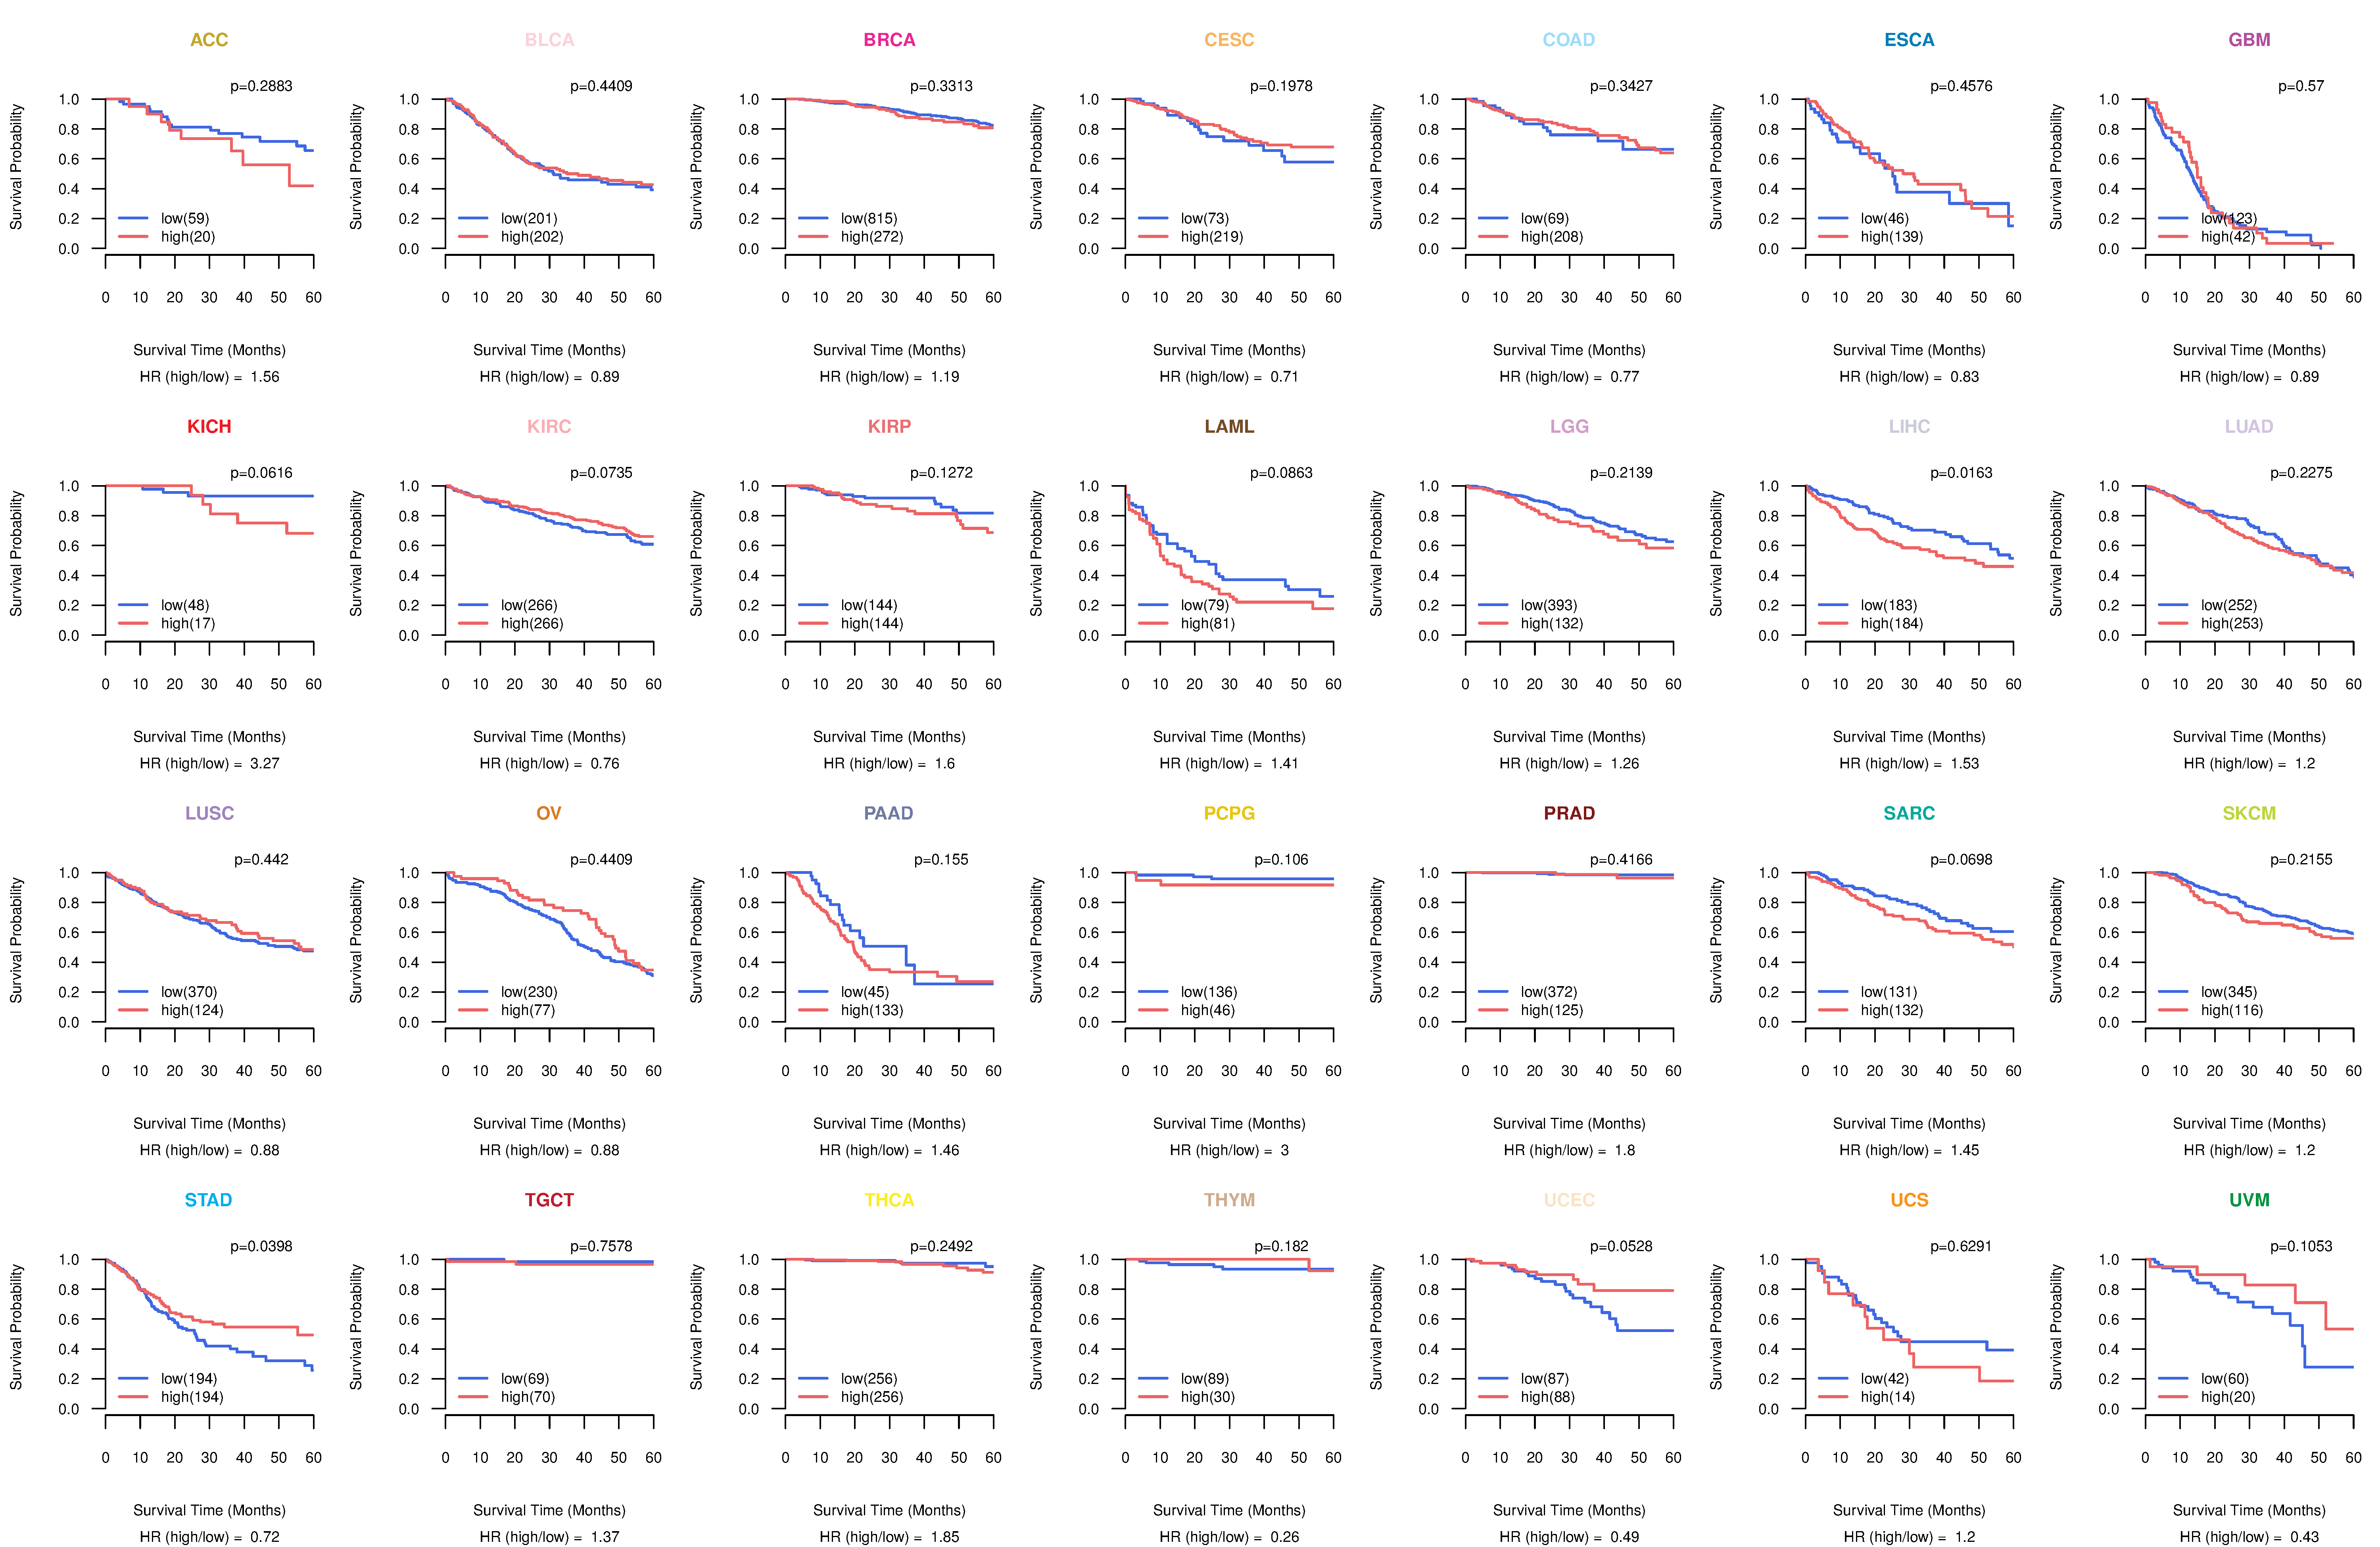
| TissGeneProg for RMI1 |
| Kaplan-Meier plots with logrank tests of overall survival (OS) using 28 cancer types (TCGA IlluminaHiSeq_RNASeqV2, pan-cancer normalized log2(norm_counts+1) data, version 2016-08-16) (TCGA clinicalMatrix, phenotype data, version 2016-04-27) * Click on the image to enlarge it in a new window. |
 |
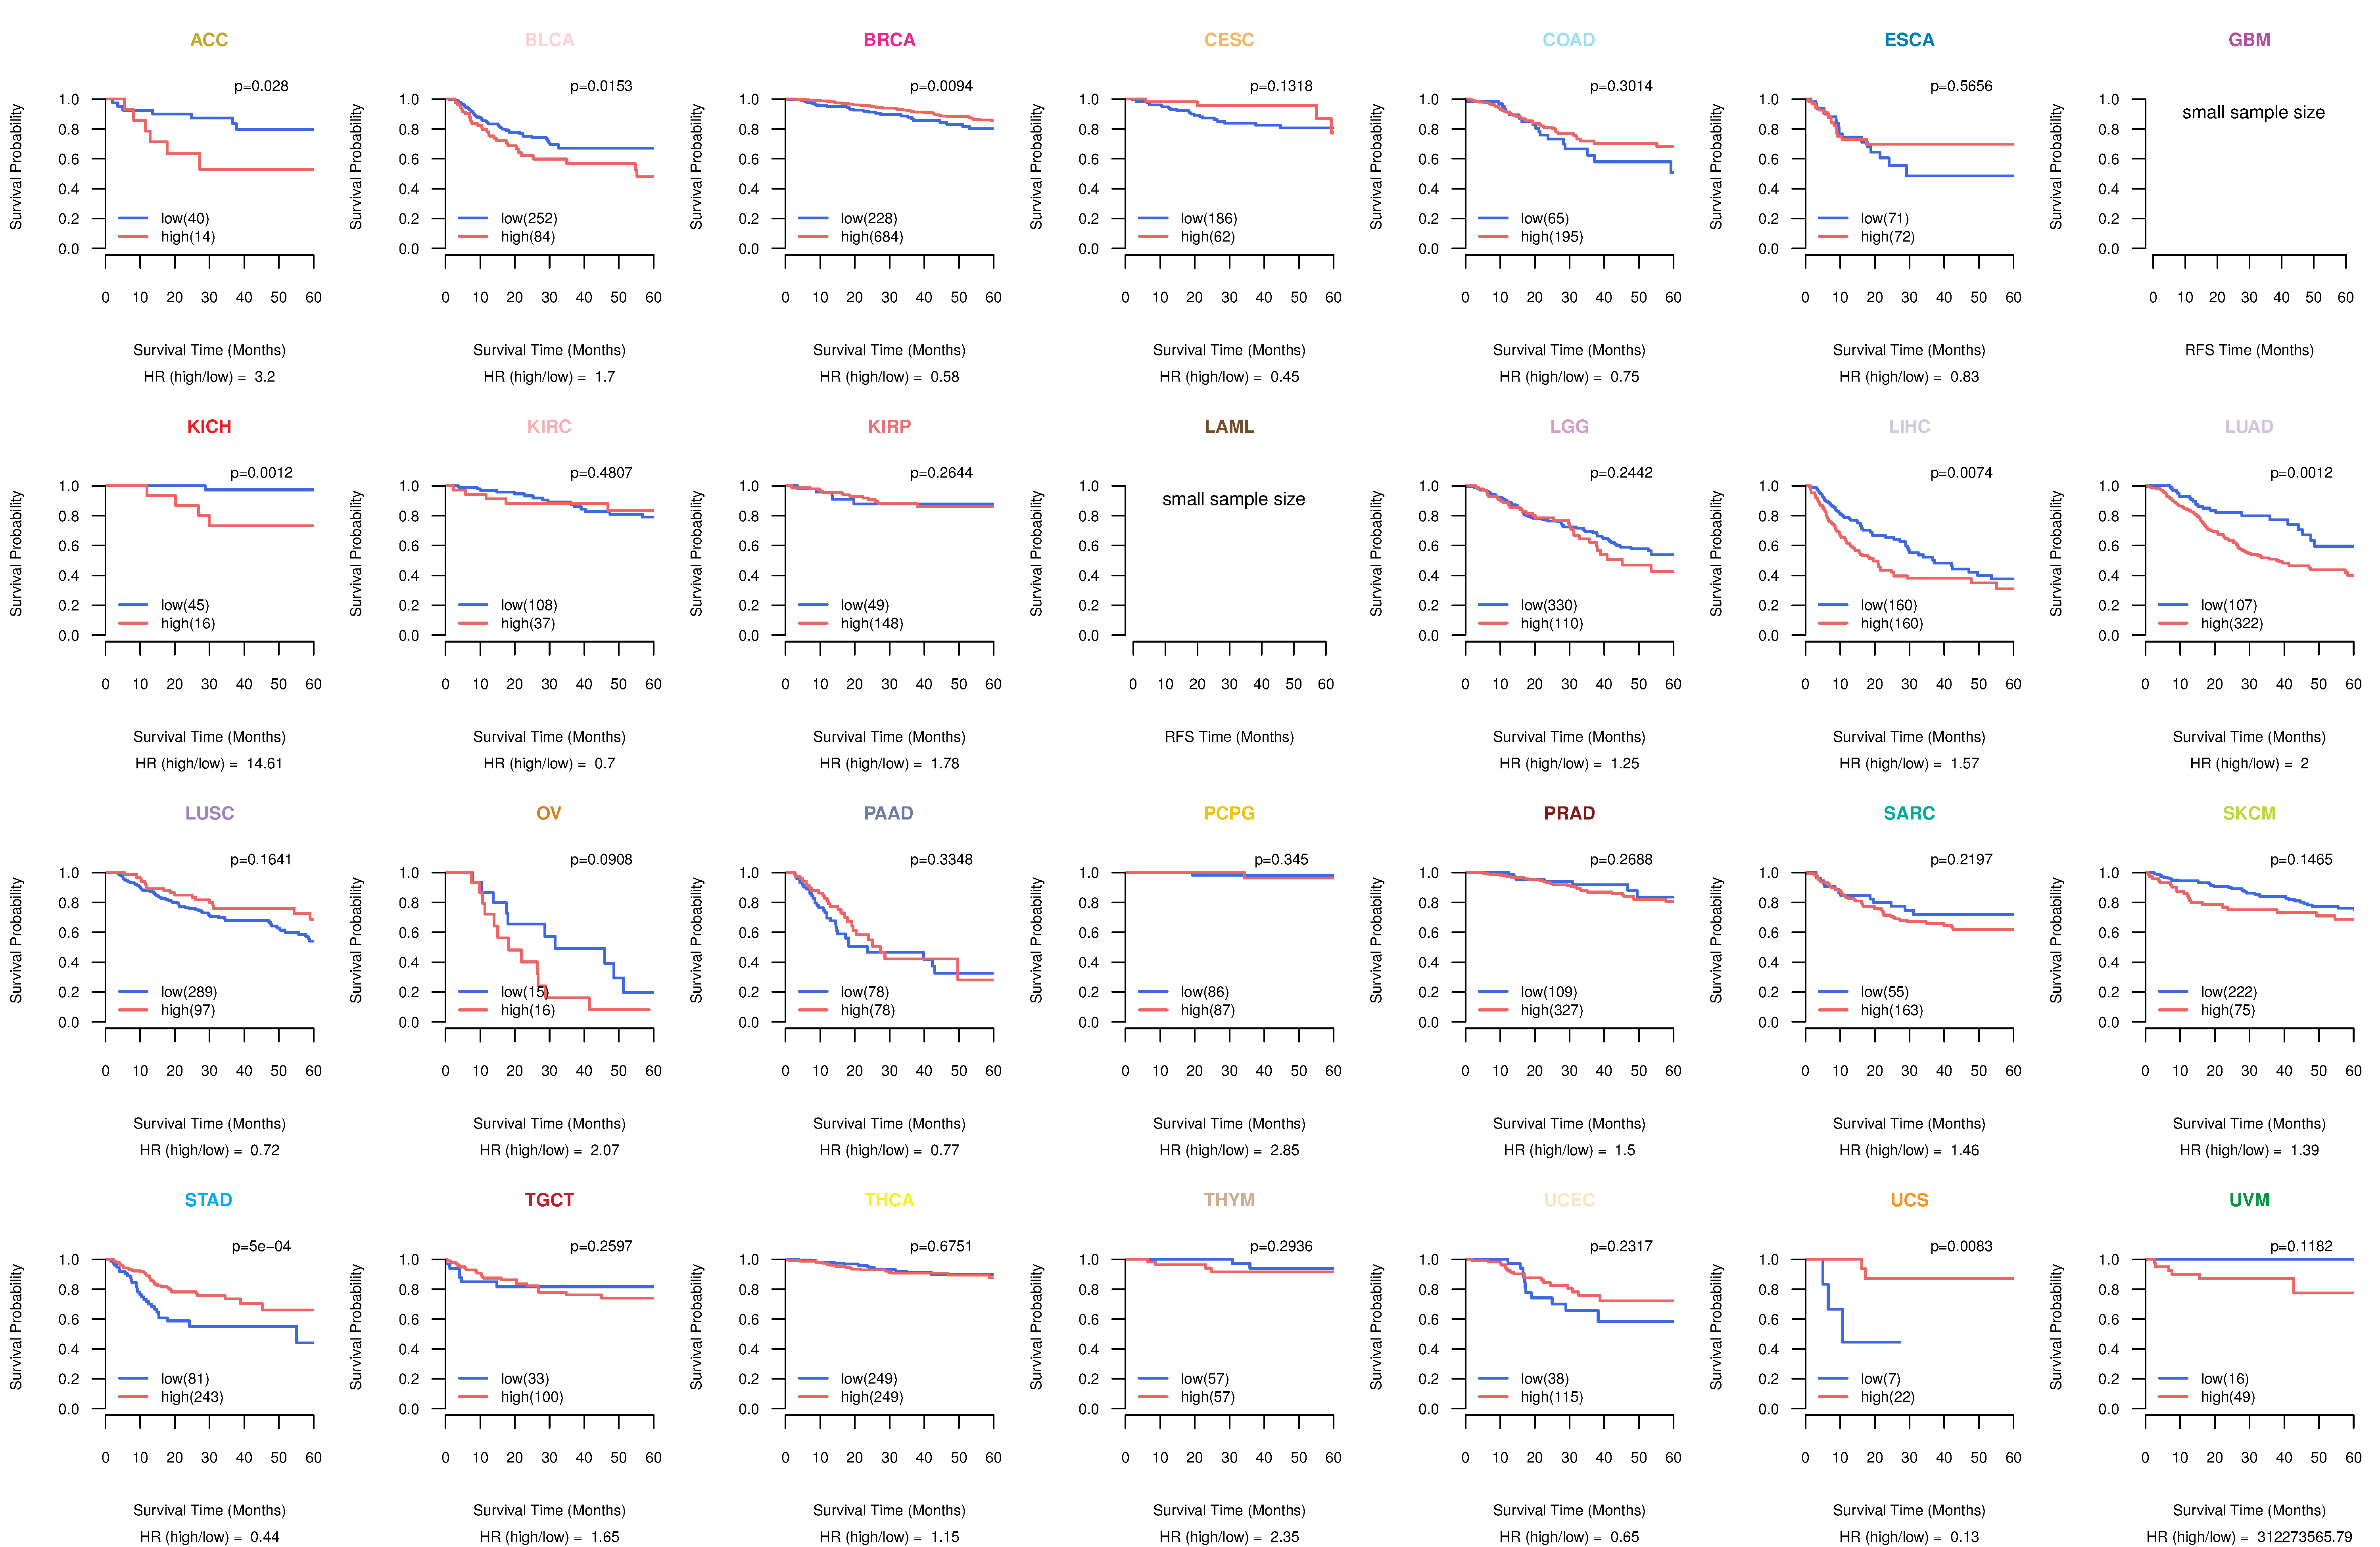
| Kaplan-Meier plots with logrank test of relapse free survival (RFS) using 28 cancer types (TCGA IlluminaHiSeq_RNASeqV2, pan-cancer normalized log2(norm_counts+1) data, version 2016-08-16) (TCGA clinicalMatrix, phenotype data, version 2016-04-27) * Click on the image enlarge it in a new window. |
 |
| Forest plot of Cox proportional hazard ratio (HR) and 95% CI of overall survival (OS) using 28 cancer types (TCGA IlluminaHiSeq_RNASeqV2, pan-cancer normalized log2(norm_counts+1) data, version 2016-08-16) (TCGA clinicalMatrix, phenotype data, version 2016-04-27) * Click on the image enlarge it in a new window. |
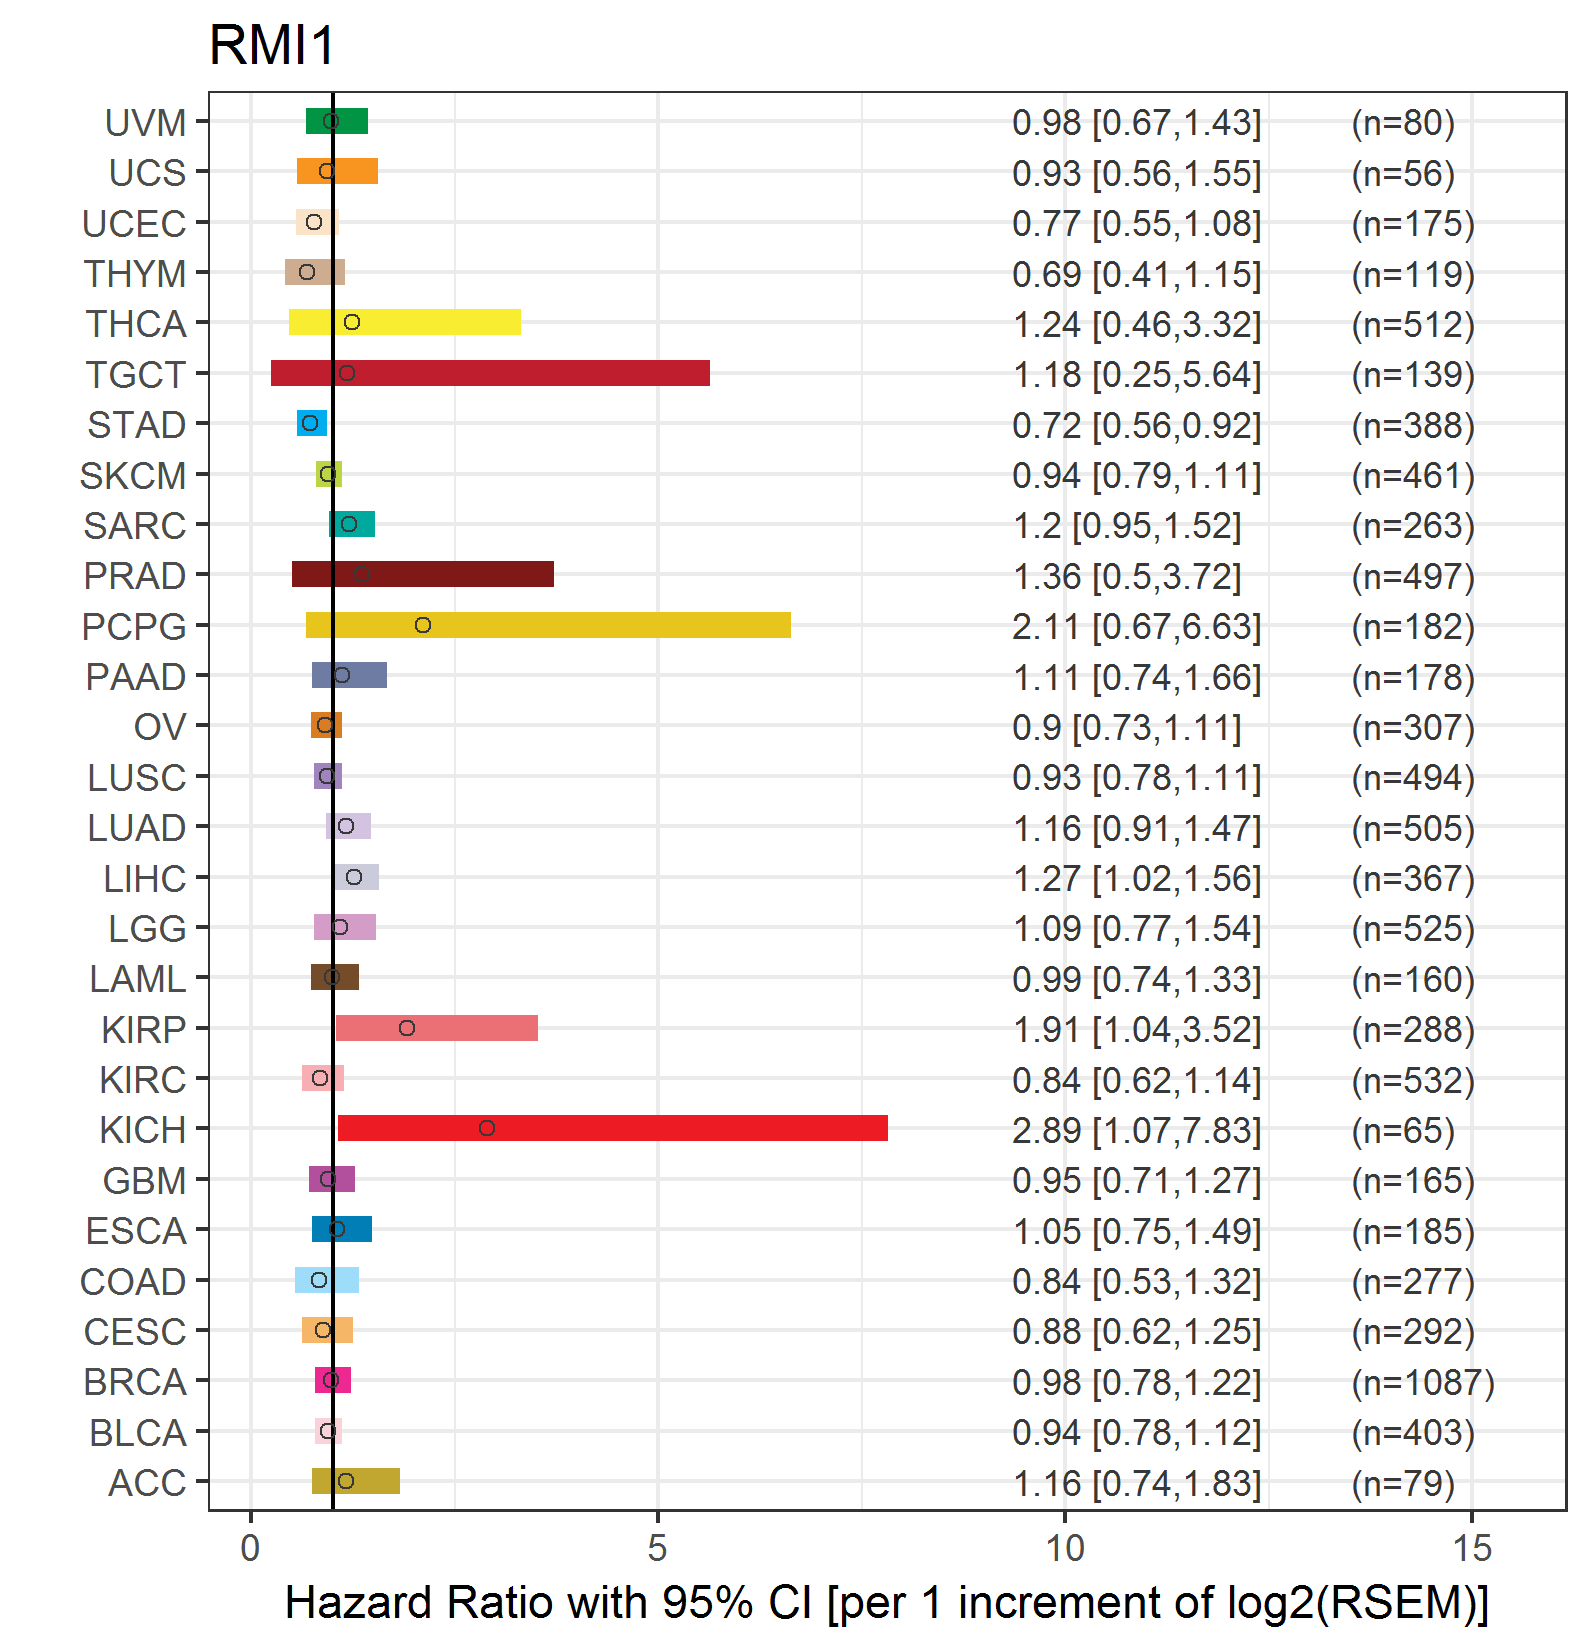 |
| Forest plot of Cox proportional hazard ratio (HR) and 95% CI of relapse free survival (RFS) using 28 cancer types (TCGA IlluminaHiSeq_RNASeqV2, pan-cancer normalized log2(norm_counts+1) data, version 2016-08-16) (TCGA clinicalMatrix, phenotype data, version 2016-04-27) * Click on the image enlarge it in a new window. |
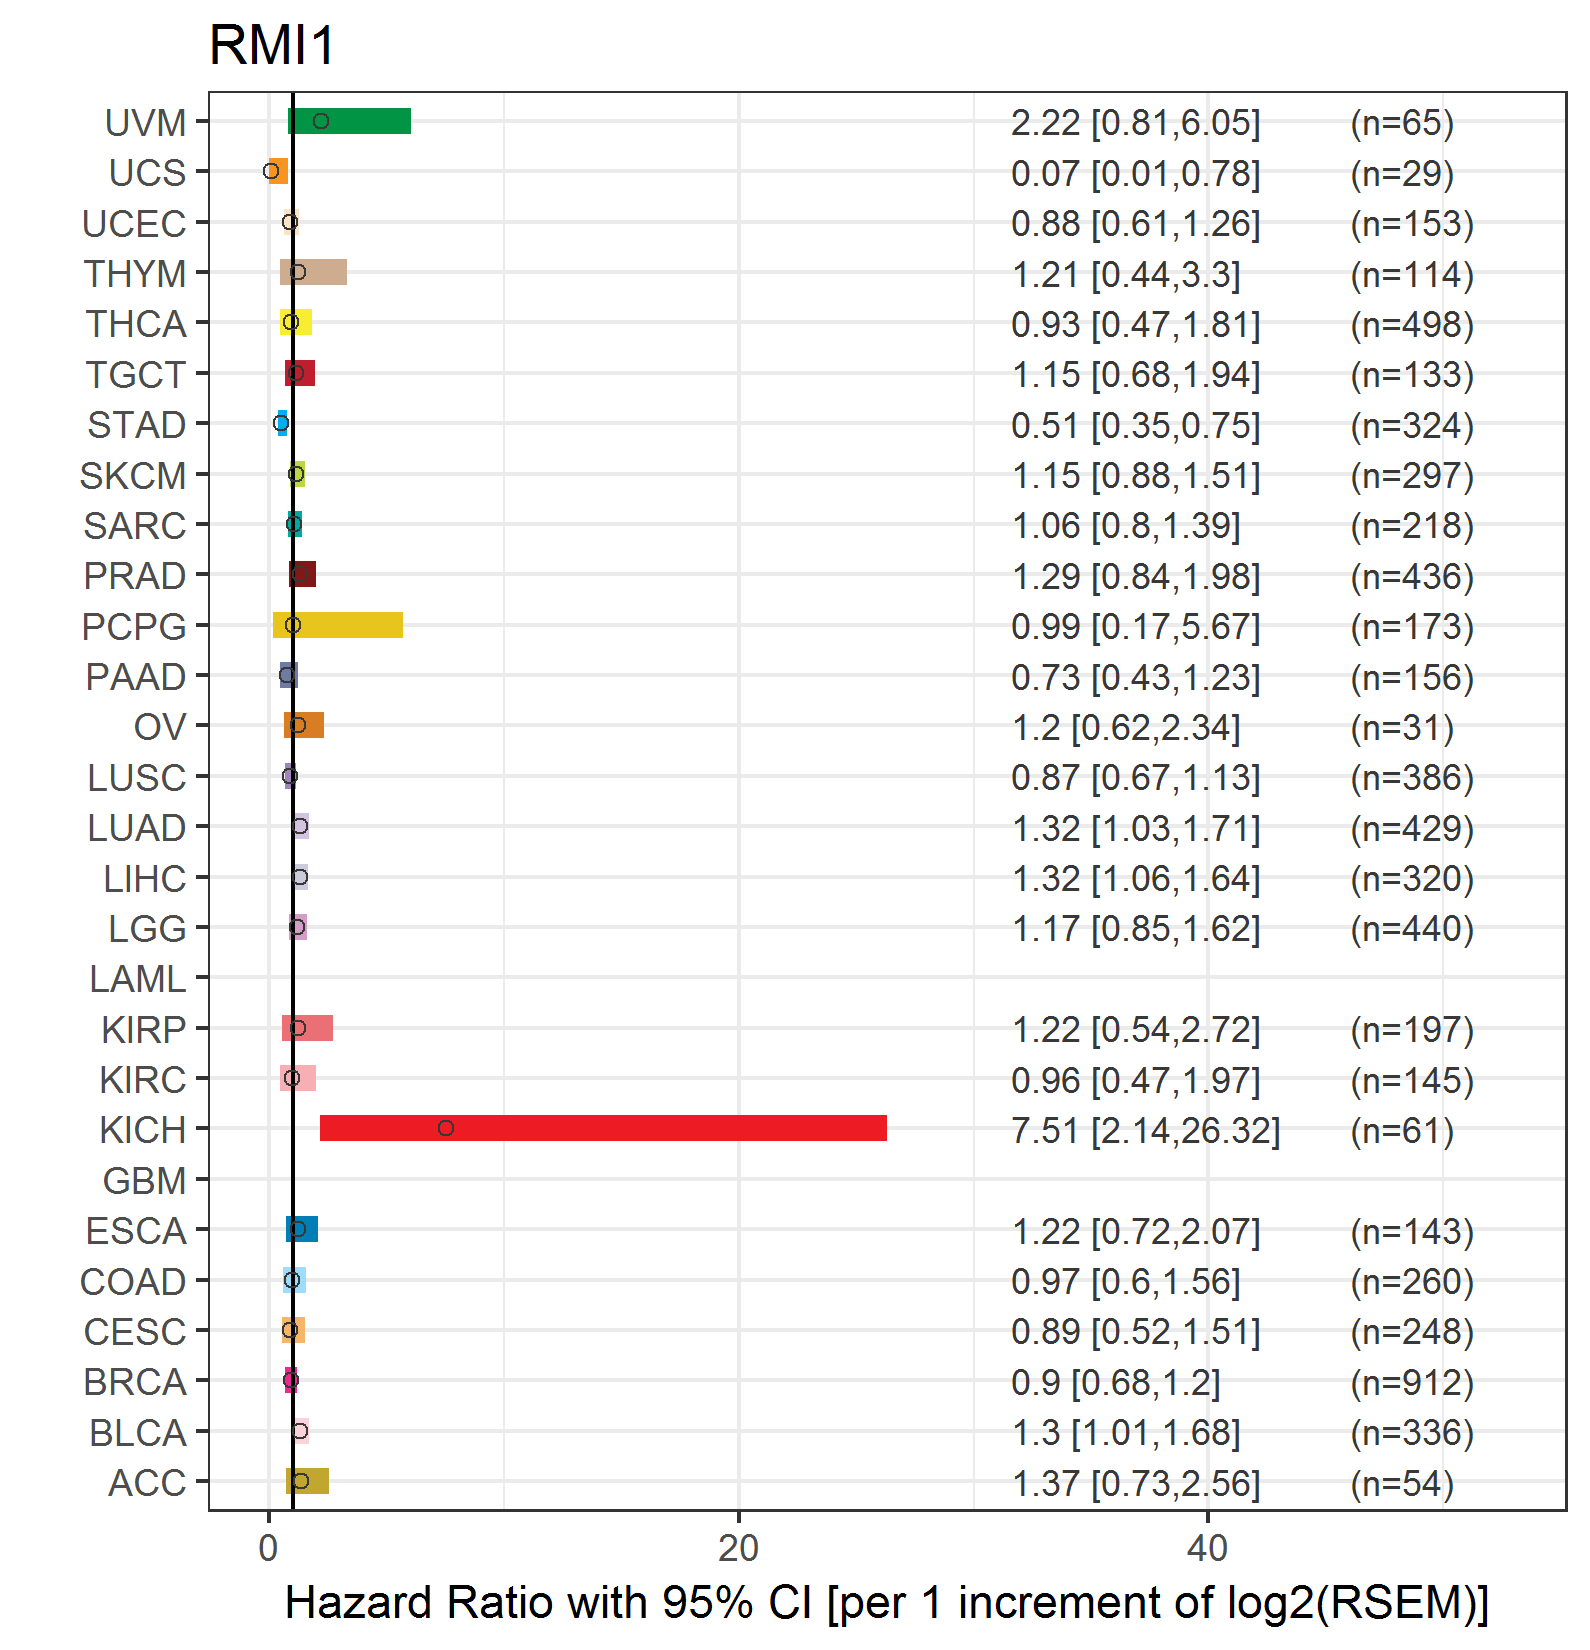 |
| Top |
| TissGeneClin for RMI1 |
| TissGeneDrug for RMI1 |
| Drug information targeting TissGene (DrugBank Version 5.0.6, 2017-04-01) |
| DrugBank ID | Drug name | Drug activity | Drug type | Drug status |
| Top |
| TissGeneDisease for RMI1 |
| Disease information associated with TissGene (DisGeNet, 2016-06-01) |
| Disease ID | Disease name | # pubmeds | Source |
| umls:C0005859 | Bloom Syndrome | 1 | GAD |
| umls:C0009402 | Colorectal Carcinoma | 1 | BeFree |
| umls:C0023467 | Leukemia, Myelocytic, Acute | 1 | BeFree,GAD,LHGDN |
| umls:C0025202 | melanoma | 1 | BeFree,GAD,LHGDN |
| umls:C0033027 | Preleukemia | 1 | GAD |
| umls:C0037286 | Skin Neoplasms | 1 | GAD |
| umls:C0376358 | Malignant neoplasm of prostate | 1 | GAD |
| umls:C0596263 | Carcinogenesis | 1 | BeFree |
| umls:C1332153 | Acute Myeloid Leukemia Arising from Previous Myelodysplastic Syndrome | 1 | BeFree |
| umls:C1527249 | Colorectal Cancer | 1 | BeFree,GAD |
| umls:C3463824 | MYELODYSPLASTIC SYNDROME | 1 | GAD |
|
Copyright 2016-Present - The University of Texas Health Science Center at Houston (UTHealth) Web File Viewing | How to Report, Fraud, Waste and Abuse | State of Texas | Statewide Search | Texas Homeland Security | Site Policies |