 |
| |
| |
| |
| |
| |
| |
|

| TissGeneSummary for EDC3 |
 Gene summary Gene summary |
| Basic gene information | Gene symbol | EDC3 |
| Gene name | enhancer of mRNA decapping 3 | |
| Synonyms | LSM16|YJDC|YJEFN2 | |
| Cytomap | UCSC genome browser: 15q24.1 | |
| Type of gene | protein-coding | |
| RefGenes | NM_001142443.1, NM_001142444.1,NM_025083.3, | |
| Description | LSM16 homolog (EDC3, S. cerevisiae)enhancer of mRNA decapping 3 homologenhancer of mRNA-decapping protein 3hYjeF_N2hYjeF_N2-15q23yjeF N-terminal domain-containing protein 2yjeF domain containingyjeF domain-containing protein 1yjeF_N2 | |
| Modification date | 20141207 | |
| dbXrefs | MIM : 609842 | |
| HGNC : HGNC | ||
| Ensembl : ENSG00000179151 | ||
| HPRD : 07954 | ||
| Vega : OTTHUMG00000142815 | ||
| Protein | UniProt: go to UniProt's Cross Reference DB Table | |
| Expression | CleanEX: HS_EDC3 | |
| BioGPS: 80153 | ||
| Pathway | NCI Pathway Interaction Database: EDC3 | |
| KEGG: EDC3 | ||
| REACTOME: EDC3 | ||
| Pathway Commons: EDC3 | ||
| Context | iHOP: EDC3 | |
| ligand binding site mutation search in PubMed: EDC3 | ||
| UCL Cancer Institute: EDC3 | ||
| Assigned class in TissGDB* | C | |
| Included tissue-specific gene expression resources | TiGER,GTEx | |
| Specific-tissues in normal samples (assigned by TissGDB using HPA, TiGER, and GTEx) | ProstateTestis | |
| Cancer types related to the specific-tissues in cancer samples (assigned by TissGDB using TCGA) | PRADTGCT | |
| Reference showing the relevant tissue of EDC3 | ||
| Description by TissGene annotations | Have significant anti-correlated miRNA TissgsLTS | |
| * Class A consists of genes with literature evidence and is part of the cTissGenes. Class B consists of only cTissGenes without additional evidence. The remaining genes belong to Class C. |
| Gene ontology having evidence of Inferred from Direct Assay (IDA) from Entrez |
| GO ID | GO term | PubMed ID |
| Top |
| TissGeneExp for EDC3 |
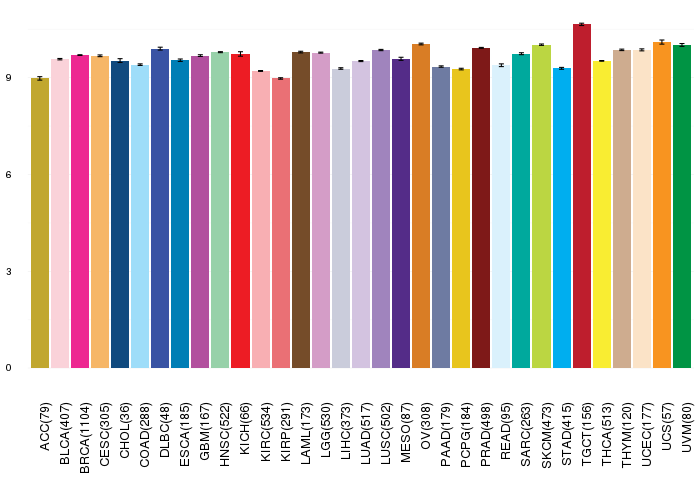
| Gene expressions across 28 cancer types (X-axis: cancer type and Y-axis: log2(norm_counts+1)) (TCGA IlluminaHiSeq_RNASeqV2, pan-cancer normalized log2(norm_counts+1) data, version 2016-08-16) |
 |
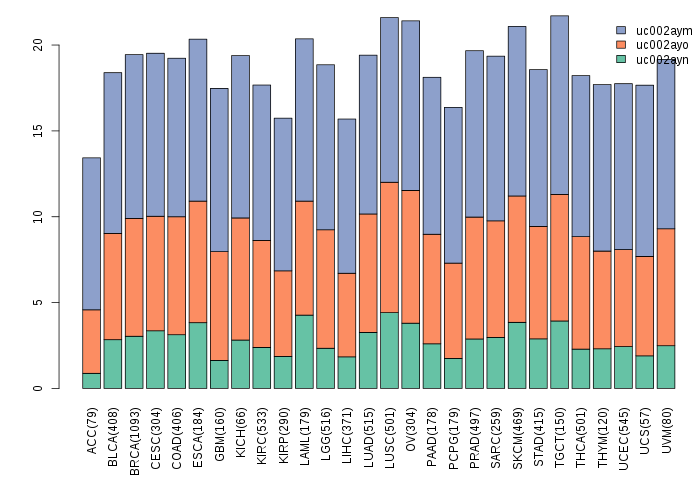
| Gene isoform expressions across 28 cancer types (X-axis: cancer type and Y-axis: log2(norm_counts+1)) (TCGA pan-cancer tcga_rsem_isoform_tpm, version 2016-09-01) |
 |
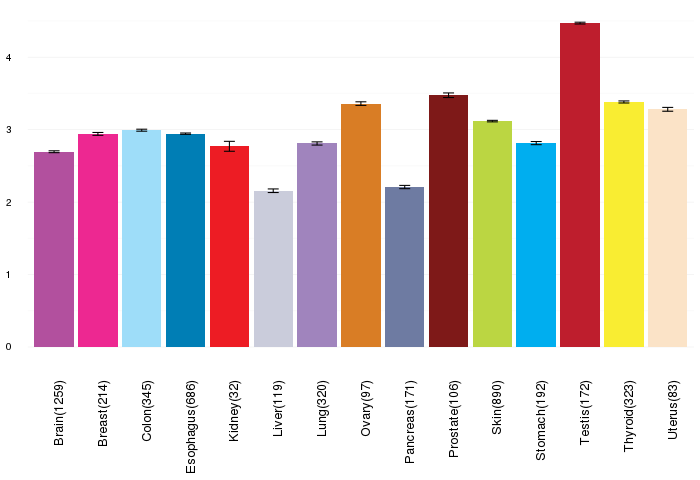
| Gene expressions across normal tissues of GTEx data (GTEx GTEx_Analysis_v6_RNA-seq_RNA-SeQCv1.1.8_gene_rpkm.gct) - Here, we shows the matched tissue types only among our 28 cancer types. |
 |
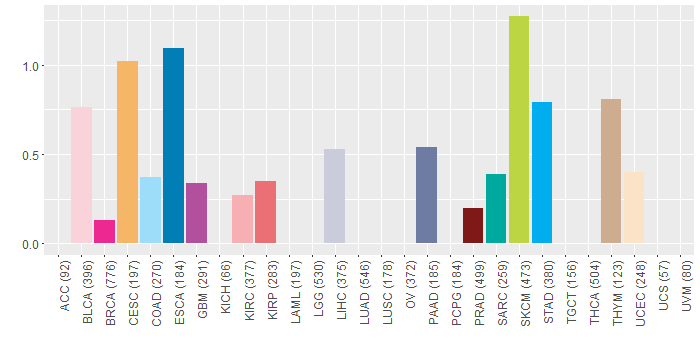
| Different expressions across 14 cancer types with more than 10 samples between matched tumors and normals (X-axis: cancer type and Y-axis: log2(norm_counts+1)) (TCGA IlluminaHiSeq_RNASeqV2, pan-cancer normalized log2(norm_counts+1) data, version 2016-08-16) |
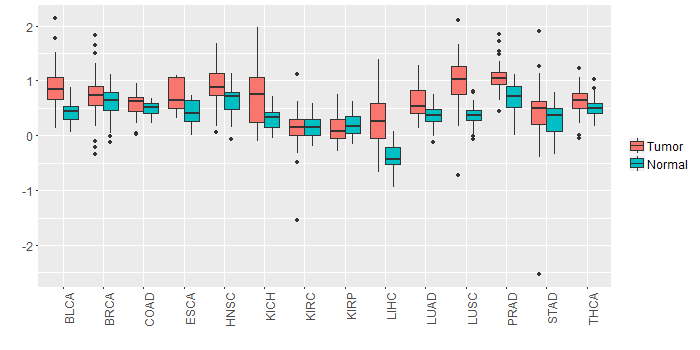 |
| - Significantly differentially expressed cancer types and information. (|Fold change|>1 and FDR<0.05) |
| Cancer type | Mean(exp) in tumor | Mean(exp) in matched normal | Log2FC | P-val. | FDR |
| Top |
| TissGene-miRNA for EDC3 |
| Significantly anti-correlated miRNAs of TissGene across 28 cancer types (Gene-miRNA relations from TargetScanHuman Relsease 7.1, Conserved_Site_Context_Scores.txt.zip, 06.01.2016) (TCGA IlluminaHiSeq_miRNASeq, log2(RPM+1) data, version 2016-11-21) (TCGA IlluminaHiSeq_RNASeqV2, log2(normalized_count+1) data, version 2016-08-16) (Spearman’s Rank Correlation (p-value<0.05 and coefficient<-0.25)) |
| Cancer type | miRNA id | miRNA accession | P-val. | Coeff. | # samples |
| UCS | hsa-miR-653-5p | MIMAT0003328 | 0.048 | -0.27 | 56 |
| LUAD | hsa-miR-22-3p | MIMAT0000077 | 0.0023 | -0.39 | 60 |
| Top |
| TissGeneMut for EDC3 |
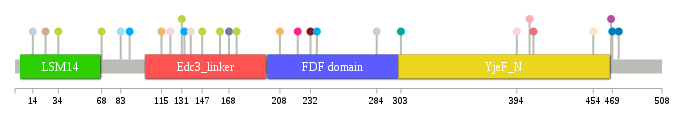
| TissGeneSNV for EDC3 |
| nsSNV counts per each loci. Different colors of circles represent different cancer types. Circle size denotes number of samples. (TCGA somatic mutation (SNPs and small INDELs) data, version 2016-04-25) * Click on the image to enlarge it in a new window. |
 |
 |
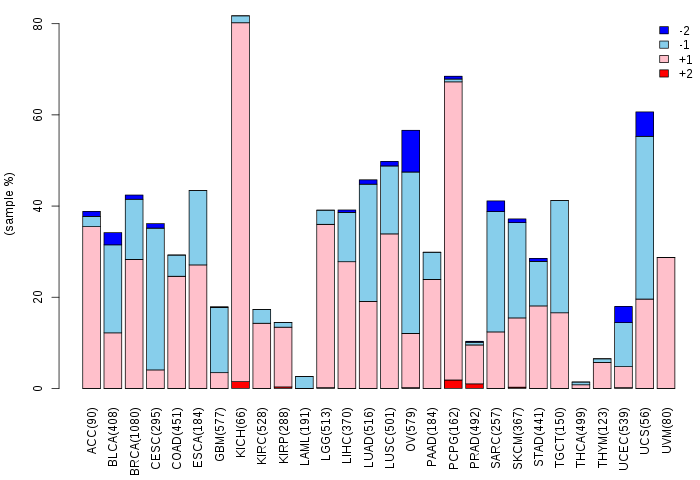
| Somatic nucleotide variants of TissGene across 28 cancer types (X-axis: cancer type and Y-axis: % of mutated samples) The numbers in parentheses are numbers of samples with mutation (nsSNVs). (TCGA somatic mutation (SNPs and small INDELs) data, version 2016-04-25) |
 |
| - nsSNVs sorted by frequency. |
| AAchange | Cancer type | # samples |
| p.S161F | SKCM | 1 |
| p.S131F | SKCM | 1 |
| p.Q133R | STAD | 1 |
| p.G468W | GBM | 1 |
| p.R24S | THYM | 1 |
| p.G90D | STAD | 1 |
| p.E147K | SKCM | 1 |
| p.S138* | BLCA | 1 |
| p.P237R | STAD | 1 |
| p.T34I | SKCM | 1 |
| p.E248K | HNSC | 1 |
| p.Q115E | CESC | 1 |
| p.E83X | COAD | 1 |
| p.V407A | KIRP | 1 |
| p.R303Q | SARC | 1 |
| p.P174L | SKCM | 1 |
| p.I222V | BRCA | 1 |
| p.V404E | KIRC | 1 |
| p.R232H | PRAD | 1 |
| p.D454G | UCEC | 1 |
| p.K63N | READ | 1 |
| p.G208R | CESC | 1 |
| p.H168Y | PAAD | 1 |
| p.Y284H | LIHC | 1 |
| p.I474M | ESCA | 1 |
| p.S394F | BLCA | 1 |
| p.C14Y | LIHC | 1 |
| p.E469K | ESCA | 1 |
| p.P68S | SKCM | 1 |
| p.D122A | BLCA | 1 |
| Top |
| TissGeneCNV for EDC3 |
| Copy number variations of TissGene across 28 cancer types (X-axis: cancer type and Y-axis: % of CNV samples) (TCGA Gistic2_CopyNumber_Gistic2_all_data_by_genes, Gistic2 copy number data, version 2016-08-16) |
 |
| Top |
| TissGeneFusions for EDC3 |
| Fusion genes including TissGene (ChimerDB 3.0, 2016-12-01 and TCGA fusion Portal 2015-12-01) |
| Database | Src | Cancer type | Sample | Fusion gene | ORF | 5'-gene BP | 3'-gene BP |
| Chimerdb3.0 | ChiTaRs | NA | BE095213 | EDC3-EDC3 | chr15:74925601 | chr15:74925607 | |
| TCGAfusionPortal | PRADA | BRCA | TCGA-B6-A0IM-01A | EDC3-SNX29 | 5UTR-CDS | Chr15:74988221 | Chr16:12293458 |
| Top |
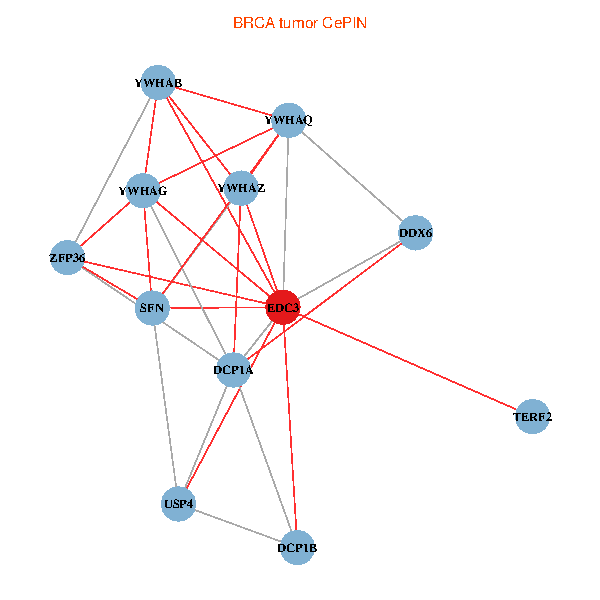
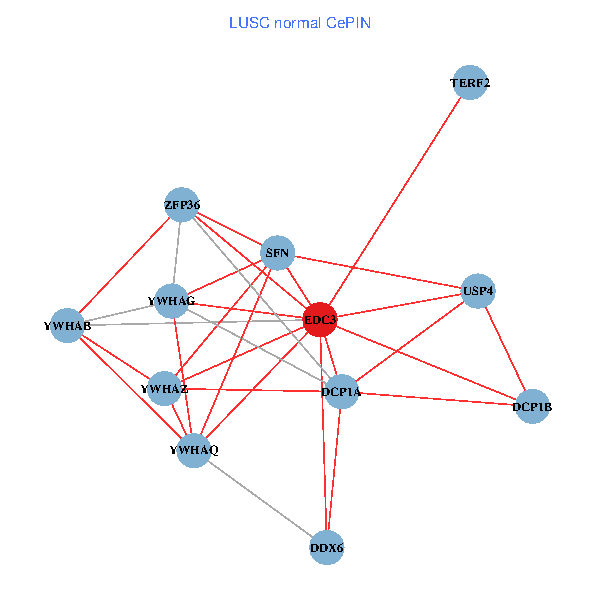
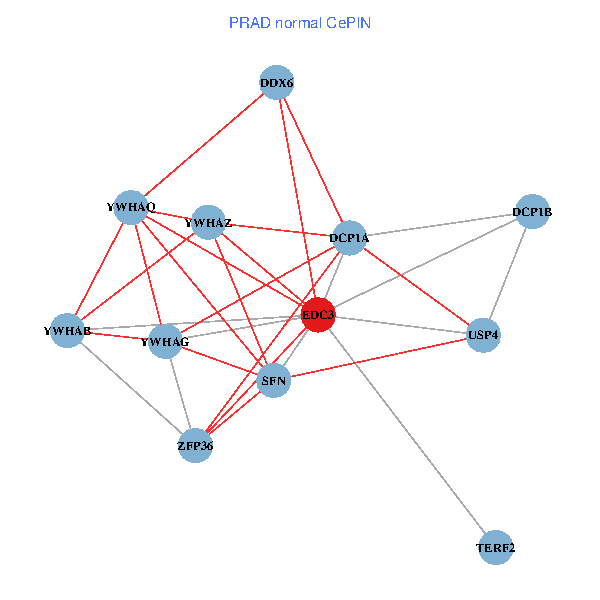
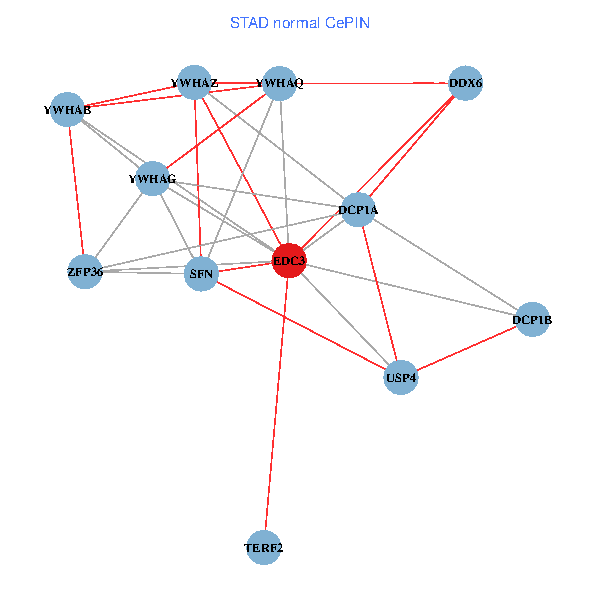
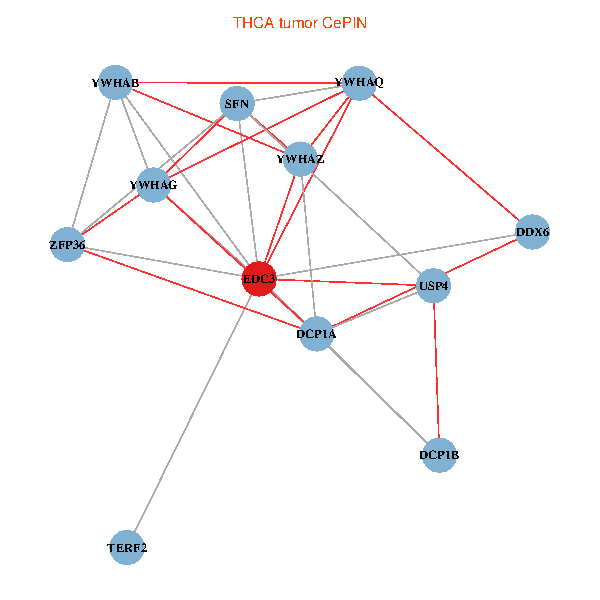
| TissGeneNet for EDC3 |
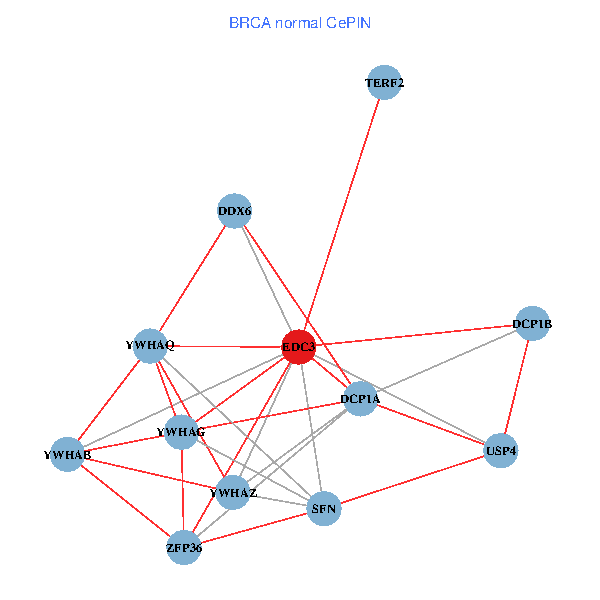
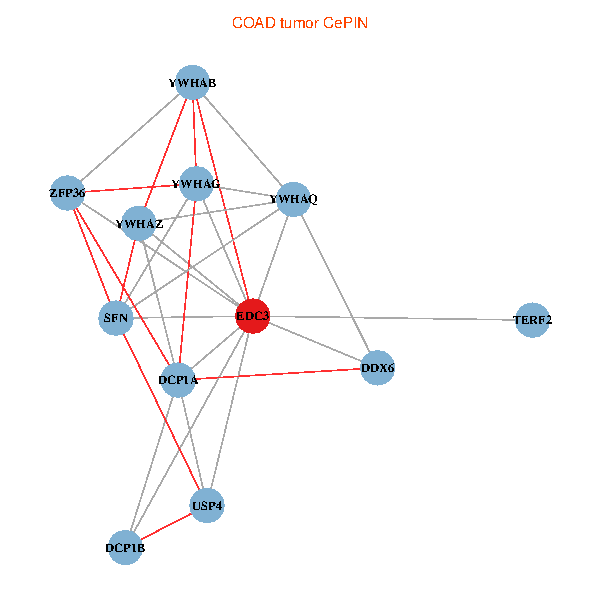
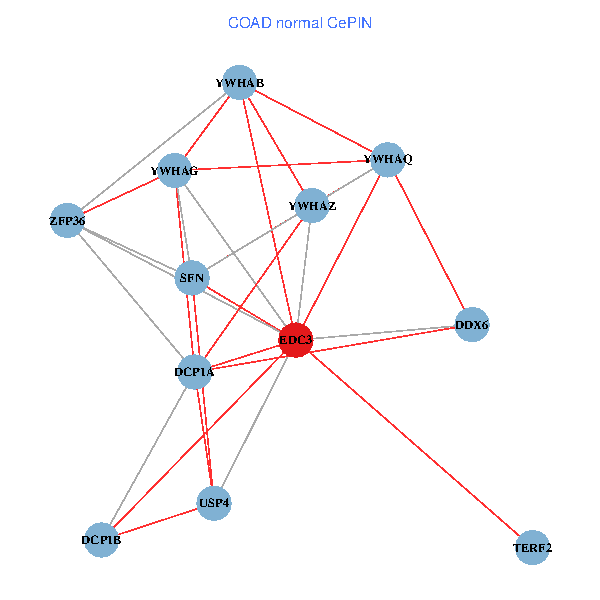
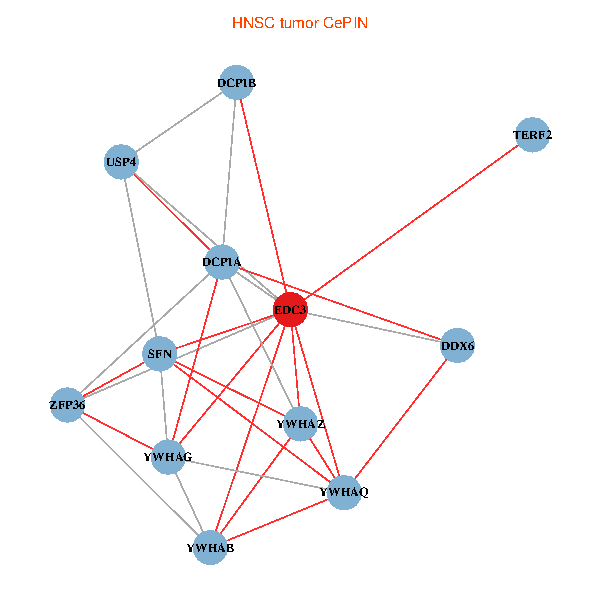
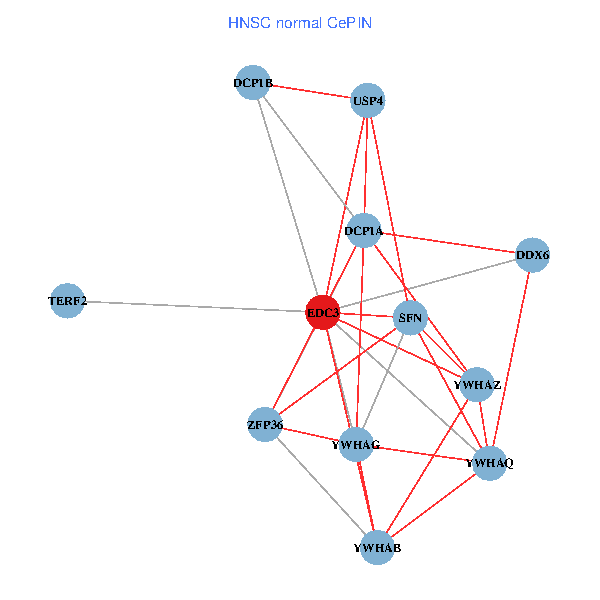
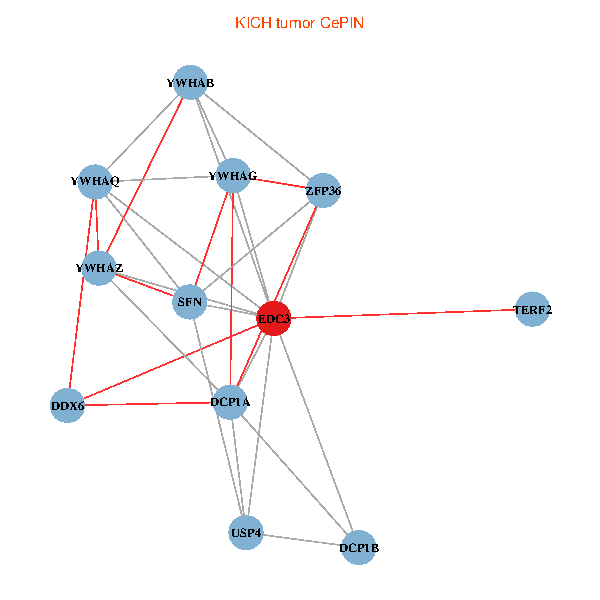
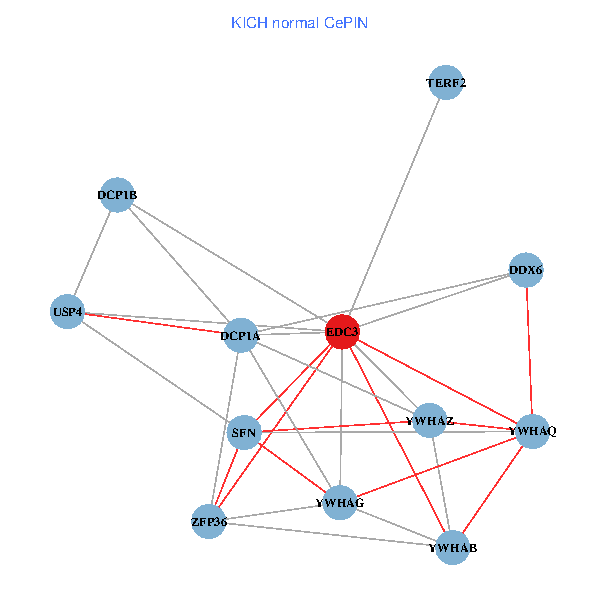
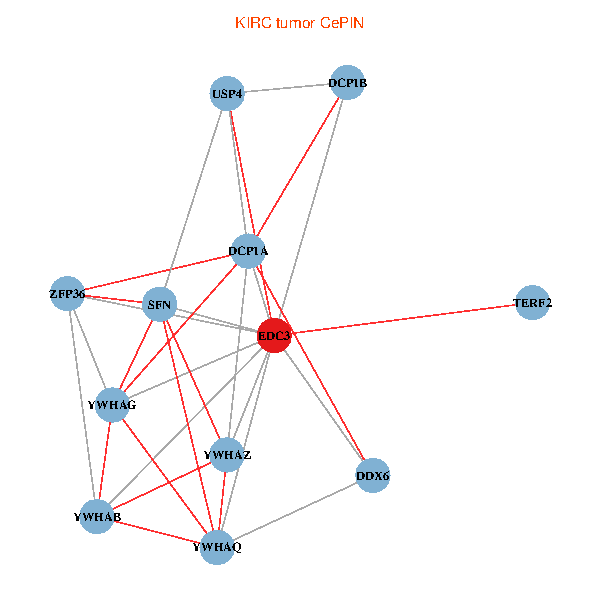
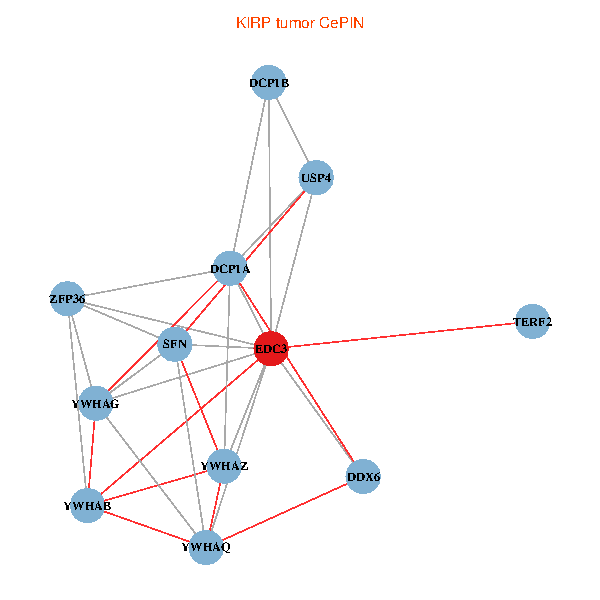
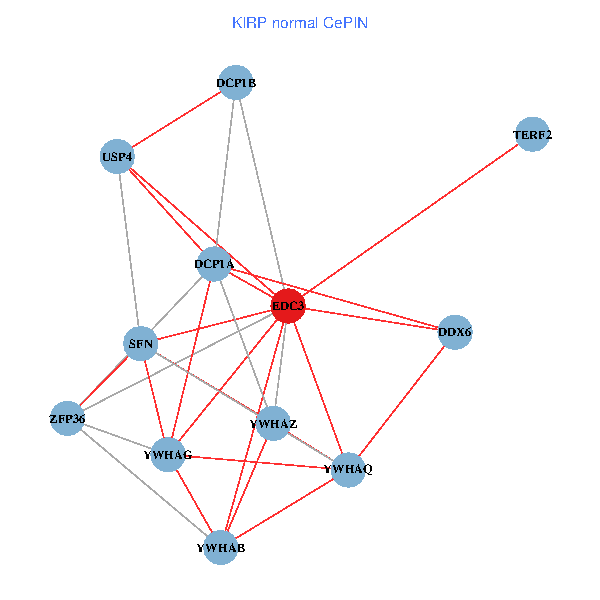
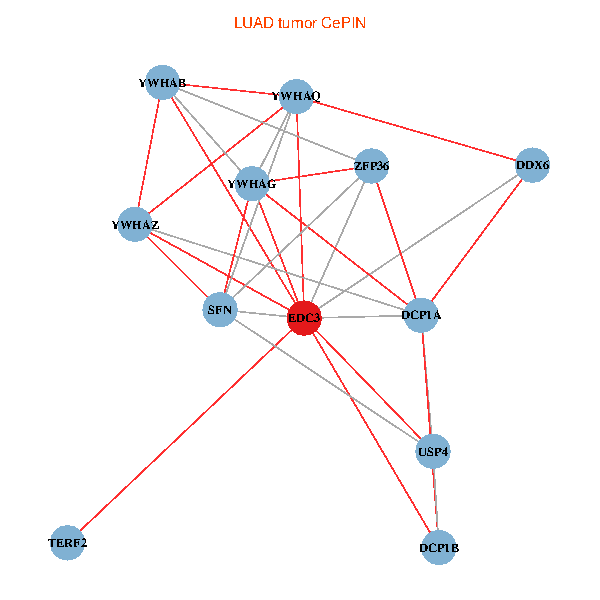
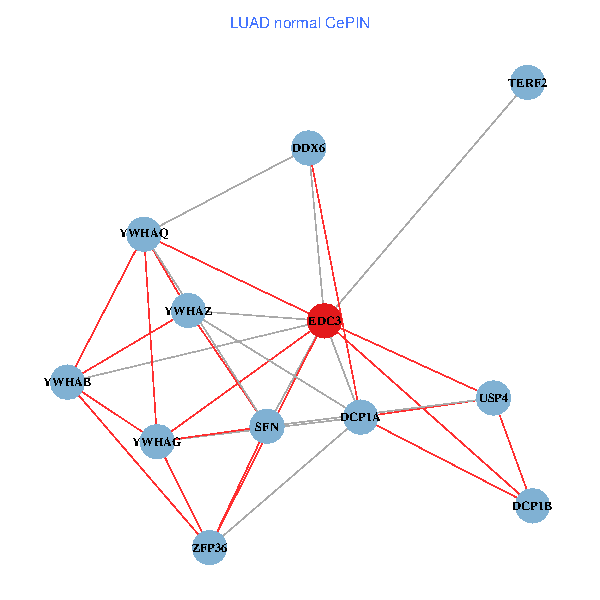
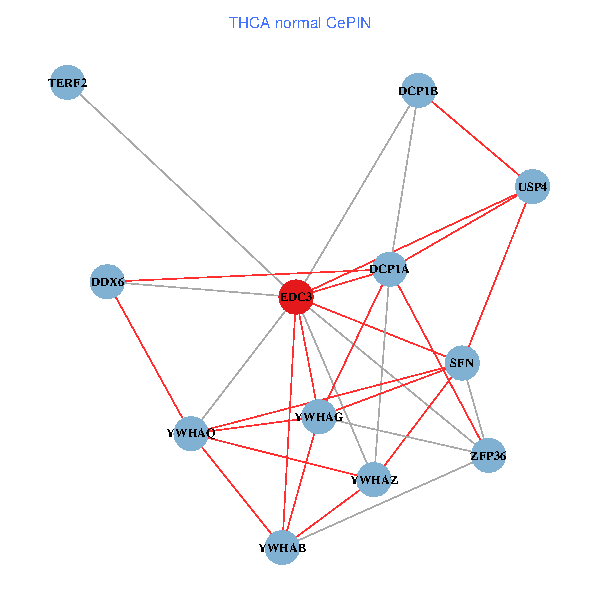
| Co-expressed gene networks based on protein-protein interaction data (CePIN) (TCGA IlluminaHiSeq_RNASeqV2, pan-cancer normalized log2(norm_counts+1) data, version 2016-08-16) (PINA2 ppi data) |
| BRCA (tumor) | BRCA (normal) |
| EDC3, YWHAZ, TERF2, YWHAG, DDX6, YWHAQ, YWHAB, DCP1A, SFN, USP4, DCP1B, ZFP36 (tumor) | EDC3, YWHAZ, TERF2, YWHAG, DDX6, YWHAQ, YWHAB, DCP1A, SFN, USP4, DCP1B, ZFP36 (normal) |
 |  |
| COAD (tumor) | COAD (normal) |
| EDC3, YWHAZ, TERF2, YWHAG, DDX6, YWHAQ, YWHAB, DCP1A, SFN, USP4, DCP1B, ZFP36 (tumor) | EDC3, YWHAZ, TERF2, YWHAG, DDX6, YWHAQ, YWHAB, DCP1A, SFN, USP4, DCP1B, ZFP36 (normal) |
 |  |
| HNSC (tumor) | HNSC (normal) |
| EDC3, YWHAZ, TERF2, YWHAG, DDX6, YWHAQ, YWHAB, DCP1A, SFN, USP4, DCP1B, ZFP36 (tumor) | EDC3, YWHAZ, TERF2, YWHAG, DDX6, YWHAQ, YWHAB, DCP1A, SFN, USP4, DCP1B, ZFP36 (normal) |
 |  |
| KICH (tumor) | KICH (normal) |
| EDC3, YWHAZ, TERF2, YWHAG, DDX6, YWHAQ, YWHAB, DCP1A, SFN, USP4, DCP1B, ZFP36 (tumor) | EDC3, YWHAZ, TERF2, YWHAG, DDX6, YWHAQ, YWHAB, DCP1A, SFN, USP4, DCP1B, ZFP36 (normal) |
 |  |
| KIRC (tumor) | KIRC (normal) |
| EDC3, YWHAZ, TERF2, YWHAG, DDX6, YWHAQ, YWHAB, DCP1A, SFN, USP4, DCP1B, ZFP36 (tumor) | EDC3, YWHAZ, TERF2, YWHAG, DDX6, YWHAQ, YWHAB, DCP1A, SFN, USP4, DCP1B, ZFP36 (normal) |
 |  |
| KIRP (tumor) | KIRP (normal) |
| EDC3, YWHAZ, TERF2, YWHAG, DDX6, YWHAQ, YWHAB, DCP1A, SFN, USP4, DCP1B, ZFP36 (tumor) | EDC3, YWHAZ, TERF2, YWHAG, DDX6, YWHAQ, YWHAB, DCP1A, SFN, USP4, DCP1B, ZFP36 (normal) |
 |  |
| LIHC (tumor) | LIHC (normal) |
| EDC3, YWHAZ, TERF2, YWHAG, DDX6, YWHAQ, YWHAB, DCP1A, SFN, USP4, DCP1B, ZFP36 (tumor) | EDC3, YWHAZ, TERF2, YWHAG, DDX6, YWHAQ, YWHAB, DCP1A, SFN, USP4, DCP1B, ZFP36 (normal) |
 |  |
| LUAD (tumor) | LUAD (normal) |
| EDC3, YWHAZ, TERF2, YWHAG, DDX6, YWHAQ, YWHAB, DCP1A, SFN, USP4, DCP1B, ZFP36 (tumor) | EDC3, YWHAZ, TERF2, YWHAG, DDX6, YWHAQ, YWHAB, DCP1A, SFN, USP4, DCP1B, ZFP36 (normal) |
 |  |
| LUSC (tumor) | LUSC (normal) |
| EDC3, YWHAZ, TERF2, YWHAG, DDX6, YWHAQ, YWHAB, DCP1A, SFN, USP4, DCP1B, ZFP36 (tumor) | EDC3, YWHAZ, TERF2, YWHAG, DDX6, YWHAQ, YWHAB, DCP1A, SFN, USP4, DCP1B, ZFP36 (normal) |
 |  |
| PRAD (tumor) | PRAD (normal) |
| EDC3, YWHAZ, TERF2, YWHAG, DDX6, YWHAQ, YWHAB, DCP1A, SFN, USP4, DCP1B, ZFP36 (tumor) | EDC3, YWHAZ, TERF2, YWHAG, DDX6, YWHAQ, YWHAB, DCP1A, SFN, USP4, DCP1B, ZFP36 (normal) |
 |  |
| STAD (tumor) | STAD (normal) |
| EDC3, YWHAZ, TERF2, YWHAG, DDX6, YWHAQ, YWHAB, DCP1A, SFN, USP4, DCP1B, ZFP36 (tumor) | EDC3, YWHAZ, TERF2, YWHAG, DDX6, YWHAQ, YWHAB, DCP1A, SFN, USP4, DCP1B, ZFP36 (normal) |
 |  |
| THCA (tumor) | THCA (normal) |
| EDC3, YWHAZ, TERF2, YWHAG, DDX6, YWHAQ, YWHAB, DCP1A, SFN, USP4, DCP1B, ZFP36 (tumor) | EDC3, YWHAZ, TERF2, YWHAG, DDX6, YWHAQ, YWHAB, DCP1A, SFN, USP4, DCP1B, ZFP36 (normal) |
 |  |
| Top |
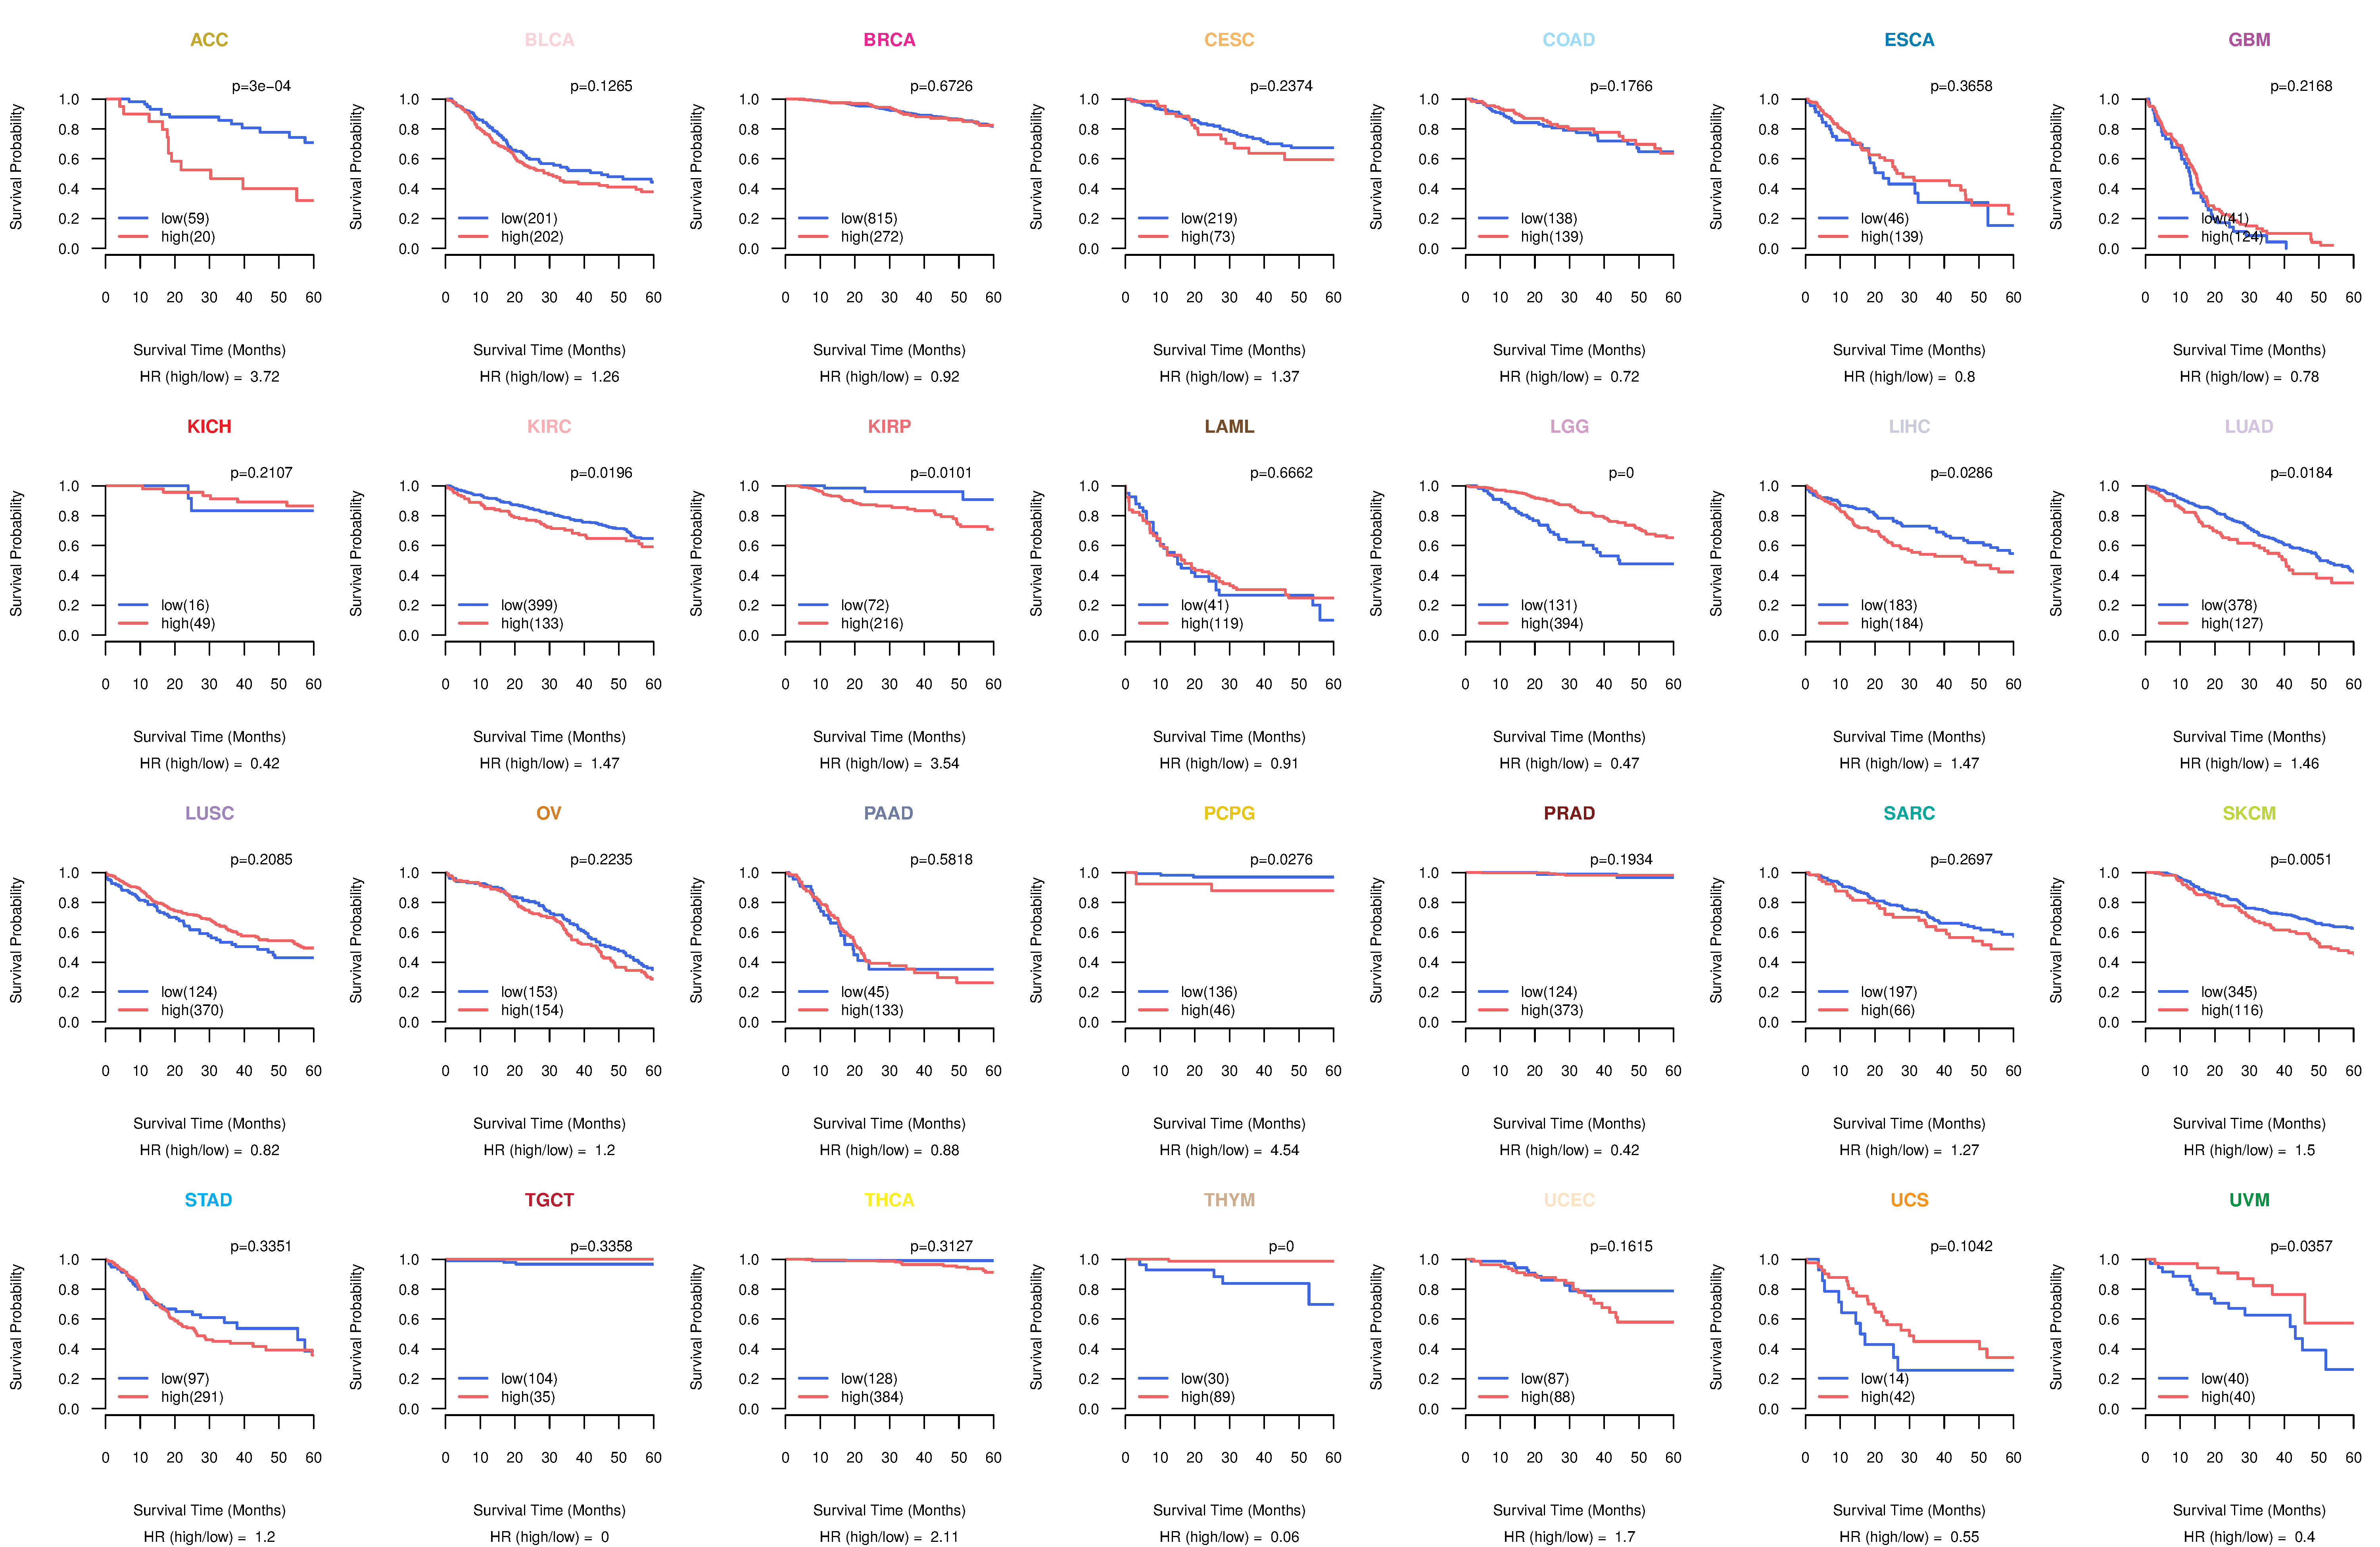
| TissGeneProg for EDC3 |
| Kaplan-Meier plots with logrank tests of overall survival (OS) using 28 cancer types (TCGA IlluminaHiSeq_RNASeqV2, pan-cancer normalized log2(norm_counts+1) data, version 2016-08-16) (TCGA clinicalMatrix, phenotype data, version 2016-04-27) * Click on the image to enlarge it in a new window. |
 |
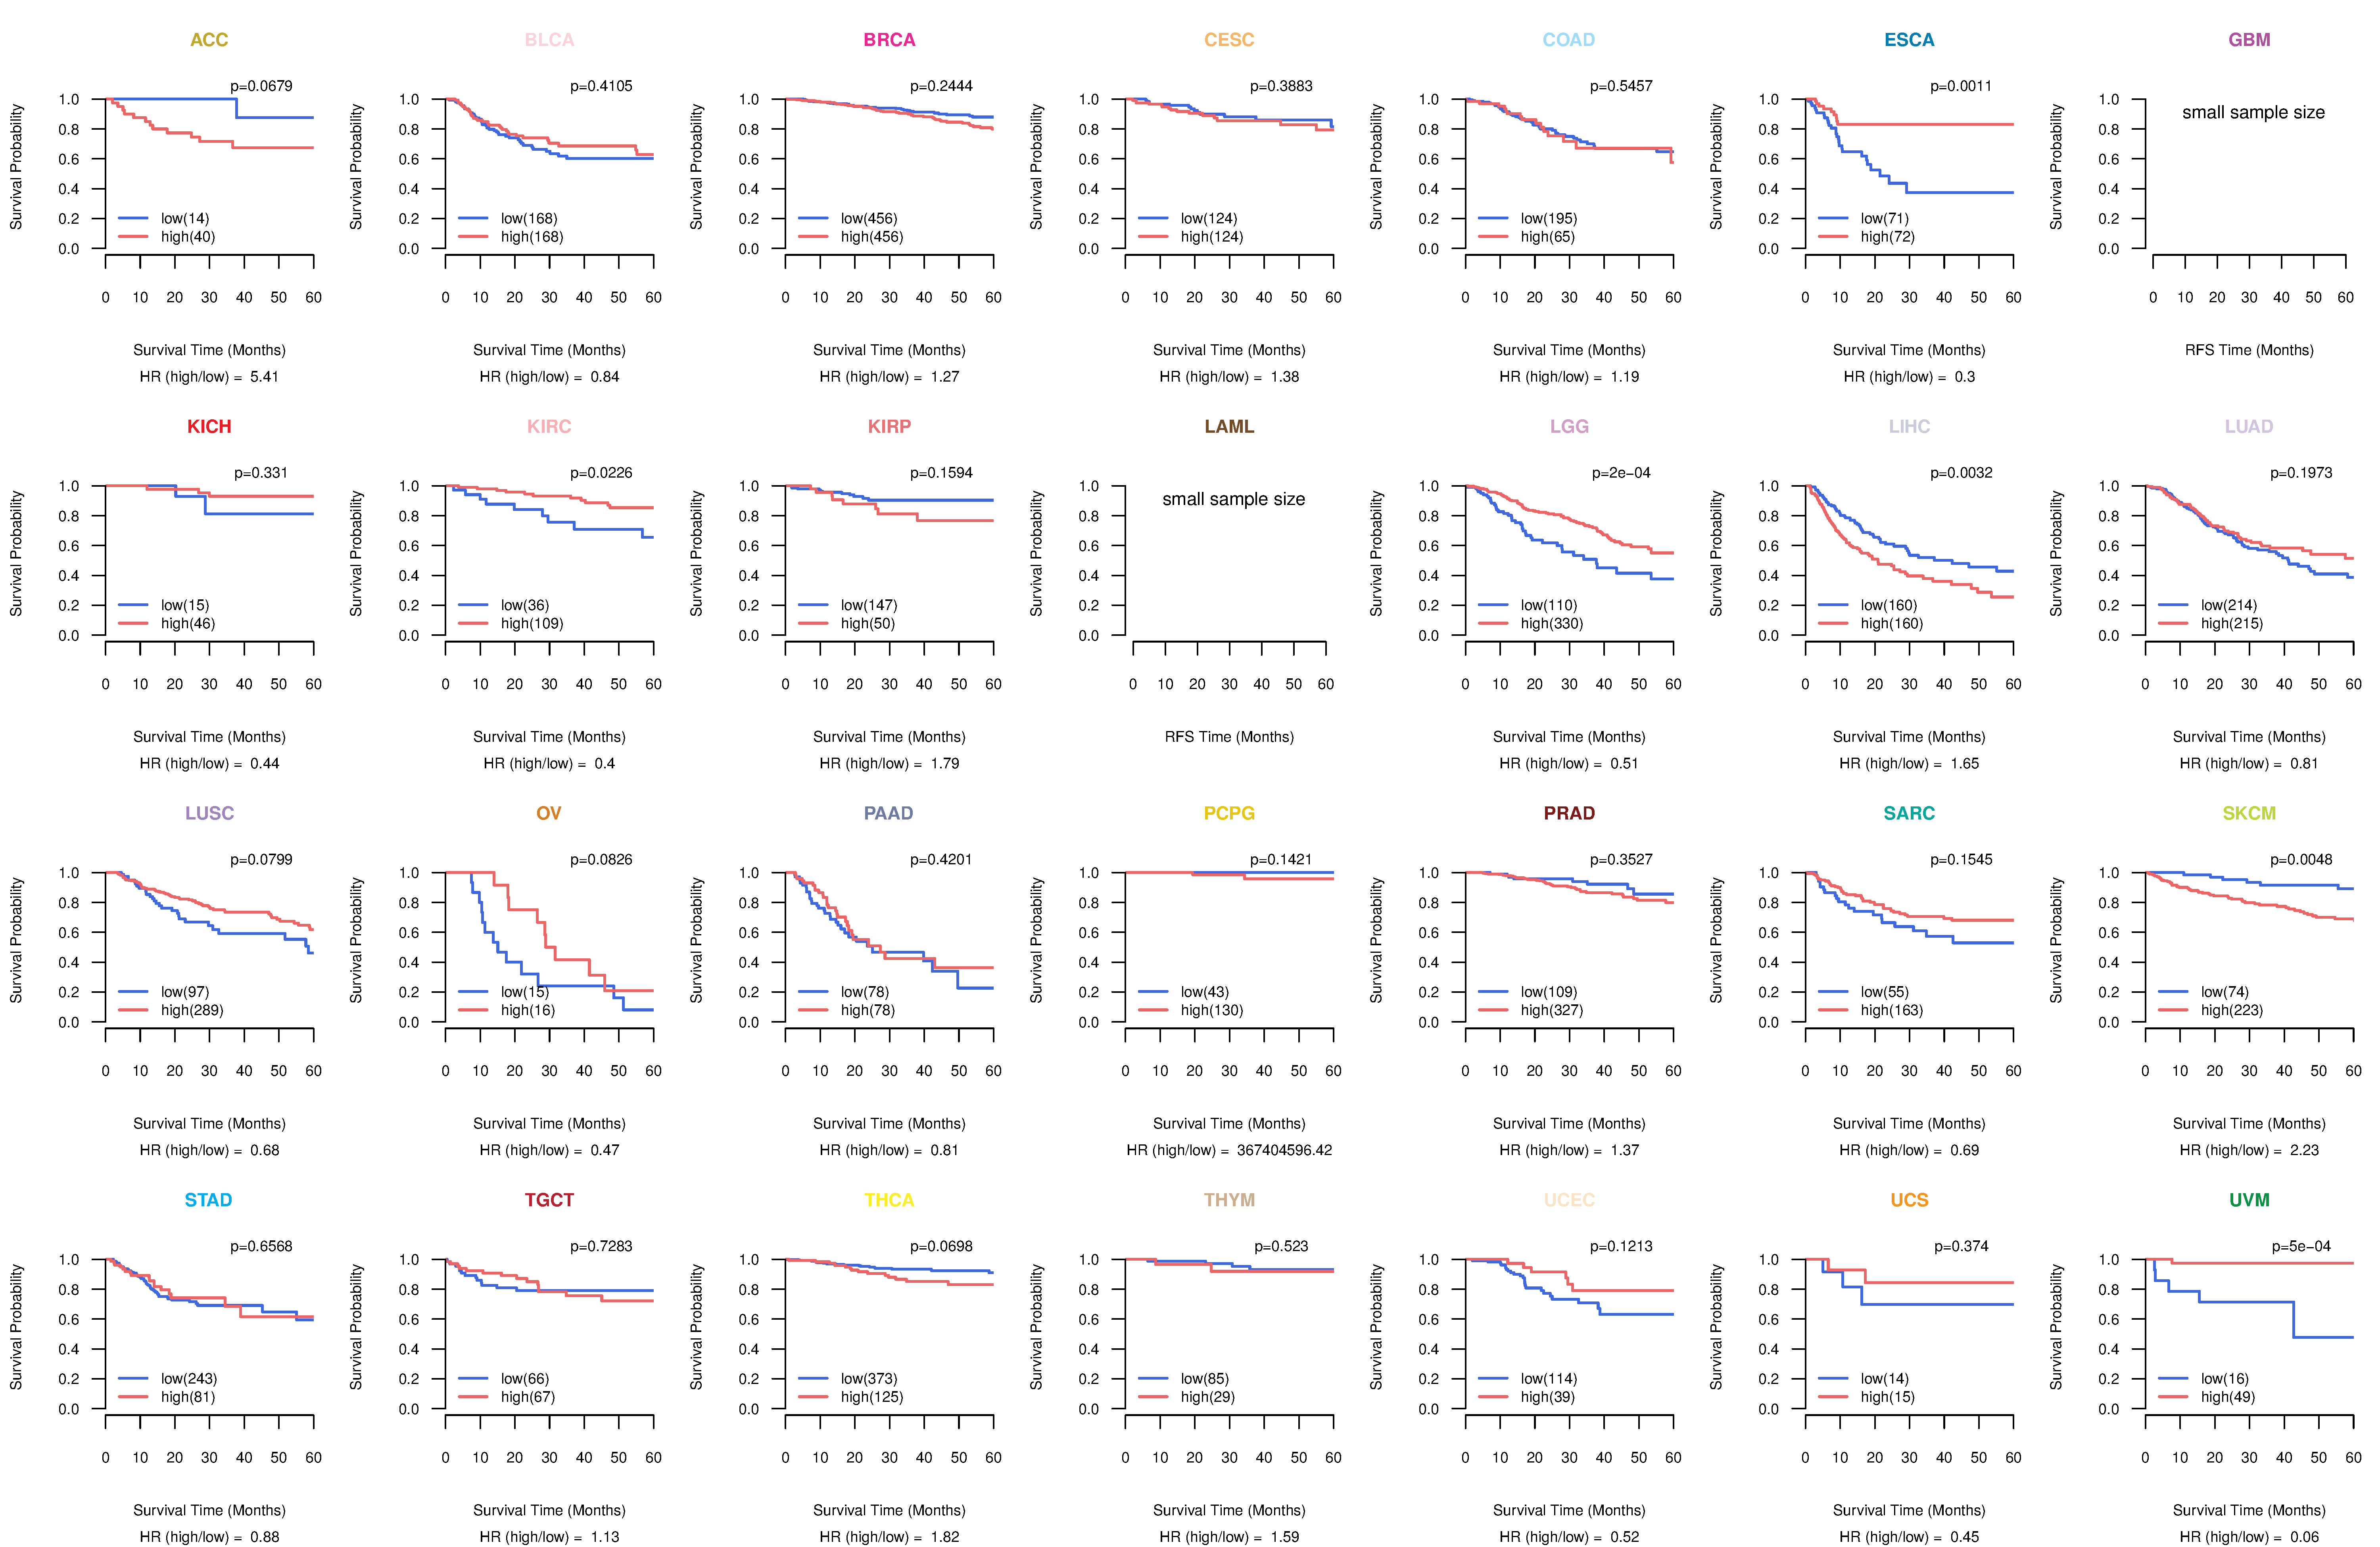
| Kaplan-Meier plots with logrank test of relapse free survival (RFS) using 28 cancer types (TCGA IlluminaHiSeq_RNASeqV2, pan-cancer normalized log2(norm_counts+1) data, version 2016-08-16) (TCGA clinicalMatrix, phenotype data, version 2016-04-27) * Click on the image enlarge it in a new window. |
 |
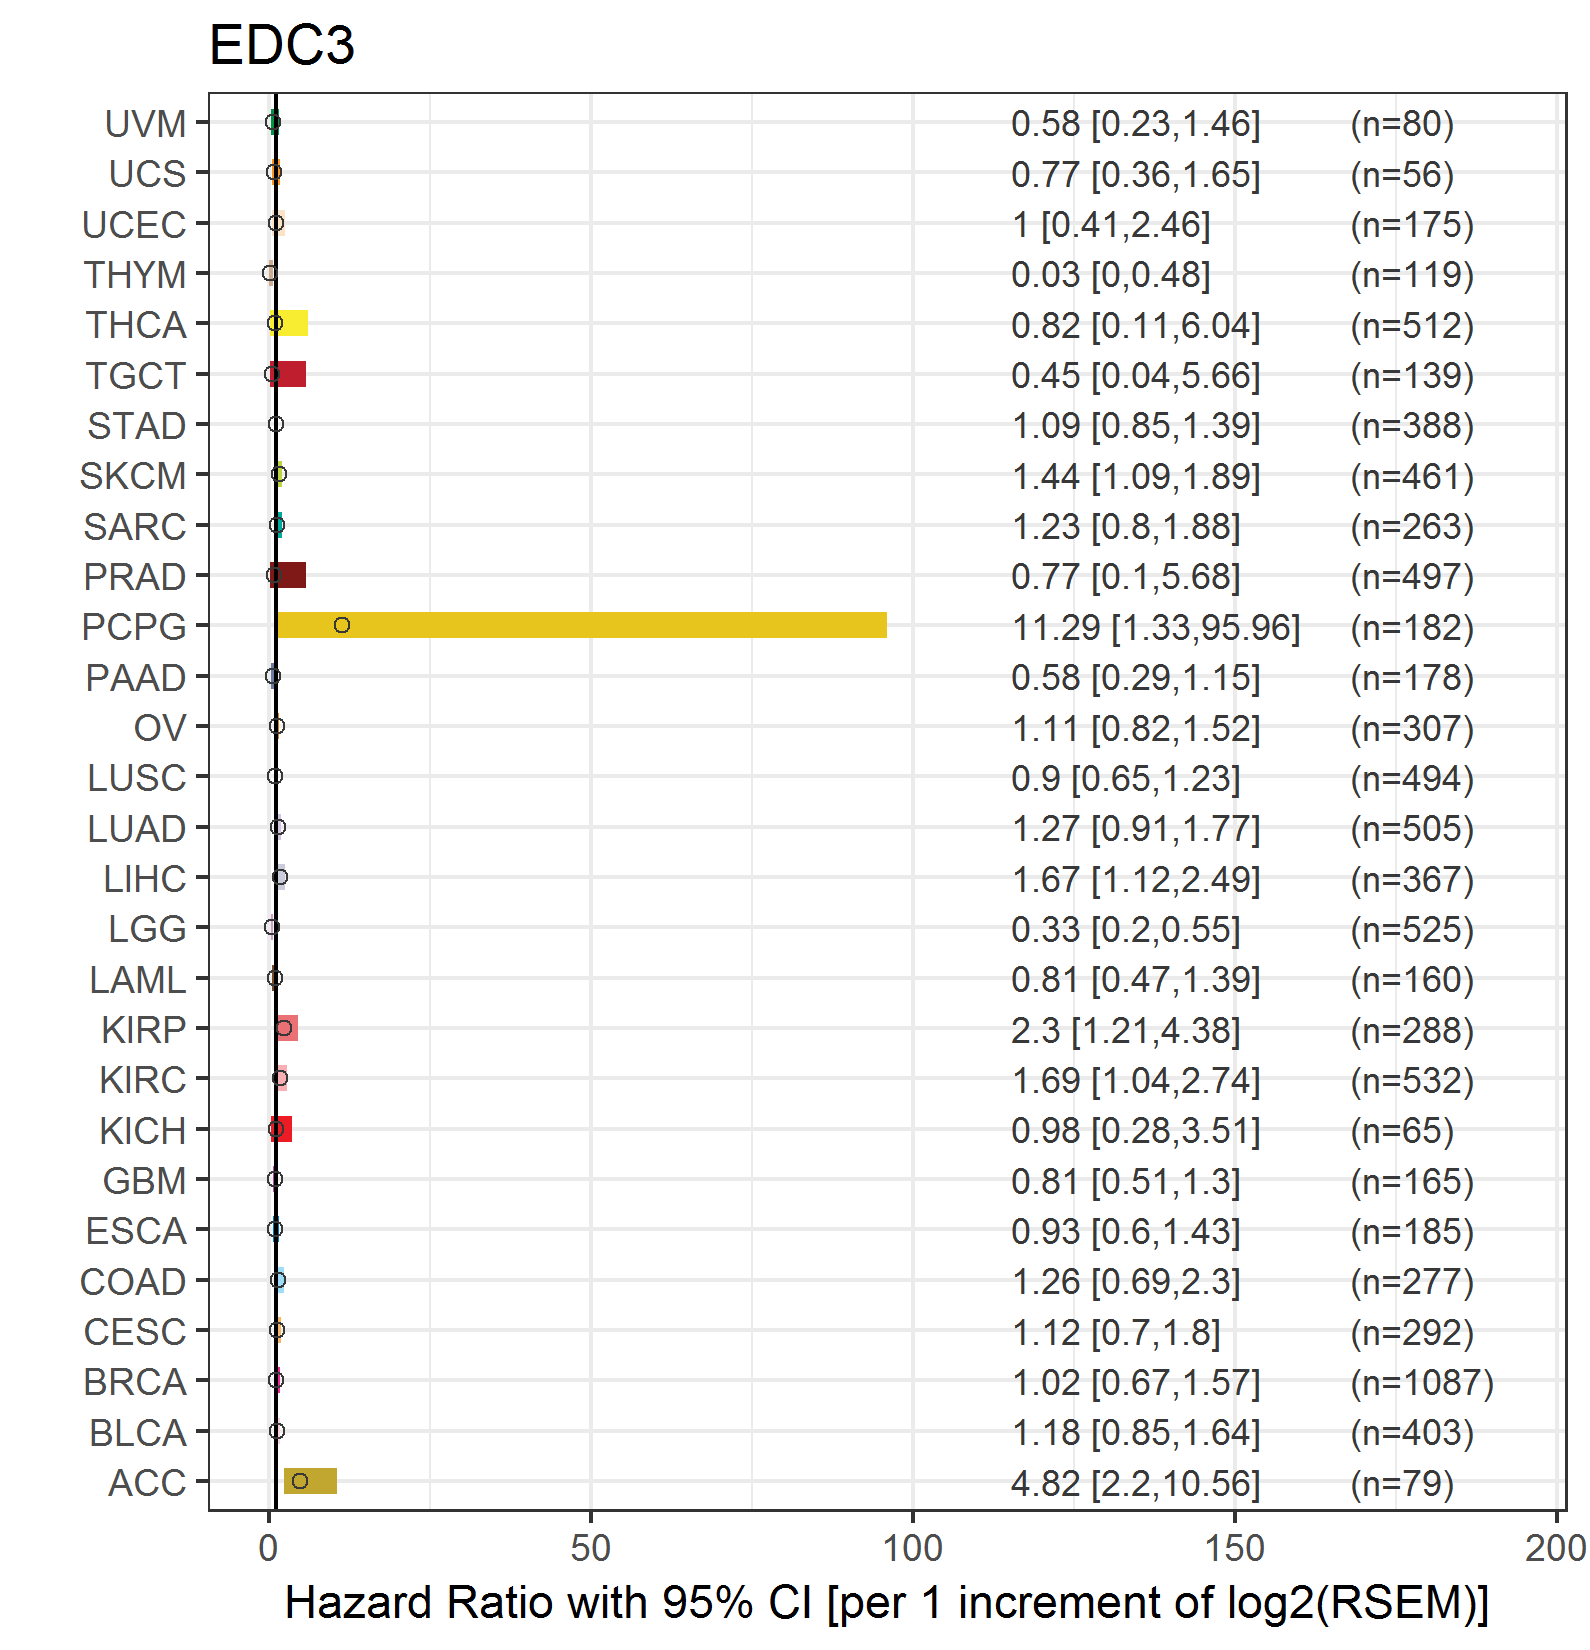
| Forest plot of Cox proportional hazard ratio (HR) and 95% CI of overall survival (OS) using 28 cancer types (TCGA IlluminaHiSeq_RNASeqV2, pan-cancer normalized log2(norm_counts+1) data, version 2016-08-16) (TCGA clinicalMatrix, phenotype data, version 2016-04-27) * Click on the image enlarge it in a new window. |
 |
| Forest plot of Cox proportional hazard ratio (HR) and 95% CI of relapse free survival (RFS) using 28 cancer types (TCGA IlluminaHiSeq_RNASeqV2, pan-cancer normalized log2(norm_counts+1) data, version 2016-08-16) (TCGA clinicalMatrix, phenotype data, version 2016-04-27) * Click on the image enlarge it in a new window. |
 |
| Top |
| TissGeneClin for EDC3 |
| TissGeneDrug for EDC3 |
| Drug information targeting TissGene (DrugBank Version 5.0.6, 2017-04-01) |
| DrugBank ID | Drug name | Drug activity | Drug type | Drug status |
| Top |
| TissGeneDisease for EDC3 |
| Disease information associated with TissGene (DisGeNet, 2016-06-01) |
| Disease ID | Disease name | # pubmeds | Source |
| umls:C3714756 | Intellectual Disability | 1 | BeFree |
|
Copyright 2016-Present - The University of Texas Health Science Center at Houston (UTHealth) Web File Viewing | How to Report, Fraud, Waste and Abuse | State of Texas | Statewide Search | Texas Homeland Security | Site Policies |