 |
| |
| |
| |
| |
| |
| |
|

| TissGeneSummary for PNPLA3 |
 Gene summary Gene summary |
| Basic gene information | Gene symbol | PNPLA3 |
| Gene name | patatin-like phospholipase domain containing 3 | |
| Synonyms | ADPN|C22orf20|iPLA(2)epsilon | |
| Cytomap | UCSC genome browser: 22q13.31 | |
| Type of gene | protein-coding | |
| RefGenes | NM_025225.2, | |
| Description | acylglycerol O-acyltransferaseadiponutrincalcium-independent phospholipase A2-epsiloniPLA2-epsiloniPLA2epsilonpatatin-like phospholipase domain-containing protein 3 | |
| Modification date | 20141222 | |
| dbXrefs | MIM : 609567 | |
| HGNC : HGNC | ||
| Ensembl : ENSG00000100344 | ||
| HPRD : 12430 | ||
| Vega : OTTHUMG00000150555 | ||
| Protein | UniProt: go to UniProt's Cross Reference DB Table | |
| Expression | CleanEX: HS_PNPLA3 | |
| BioGPS: 80339 | ||
| Pathway | NCI Pathway Interaction Database: PNPLA3 | |
| KEGG: PNPLA3 | ||
| REACTOME: PNPLA3 | ||
| Pathway Commons: PNPLA3 | ||
| Context | iHOP: PNPLA3 | |
| ligand binding site mutation search in PubMed: PNPLA3 | ||
| UCL Cancer Institute: PNPLA3 | ||
| Assigned class in TissGDB* | C | |
| Included tissue-specific gene expression resources | TiGER,GTEx | |
| Specific-tissues in normal samples (assigned by TissGDB using HPA, TiGER, and GTEx) | ColonLiverSkin | |
| Cancer types related to the specific-tissues in cancer samples (assigned by TissGDB using TCGA) | COADLIHCSKCM | |
| Reference showing the relevant tissue of PNPLA3 | ||
| Description by TissGene annotations | ||
| * Class A consists of genes with literature evidence and is part of the cTissGenes. Class B consists of only cTissGenes without additional evidence. The remaining genes belong to Class C. |
| Gene ontology having evidence of Inferred from Direct Assay (IDA) from Entrez |
| GO ID | GO term | PubMed ID | GO:0019432 | triglyceride biosynthetic process | 15364929 | GO:0019433 | triglyceride catabolic process | 15364929 | GO:0019432 | triglyceride biosynthetic process | 15364929 | GO:0019433 | triglyceride catabolic process | 15364929 |
| Top |
| TissGeneExp for PNPLA3 |
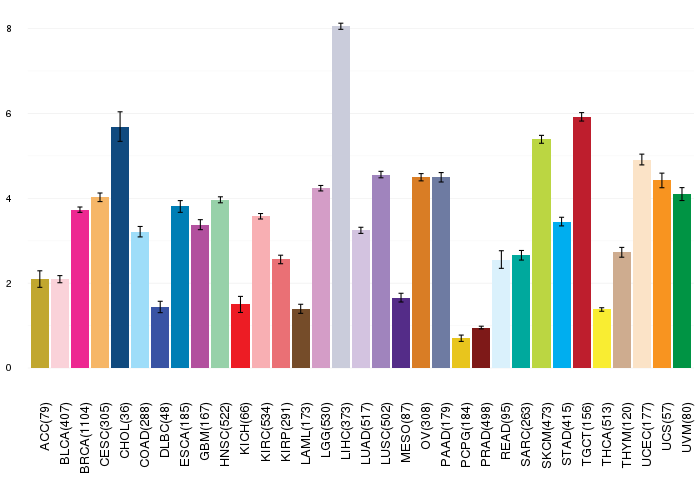
| Gene expressions across 28 cancer types (X-axis: cancer type and Y-axis: log2(norm_counts+1)) (TCGA IlluminaHiSeq_RNASeqV2, pan-cancer normalized log2(norm_counts+1) data, version 2016-08-16) |
 |
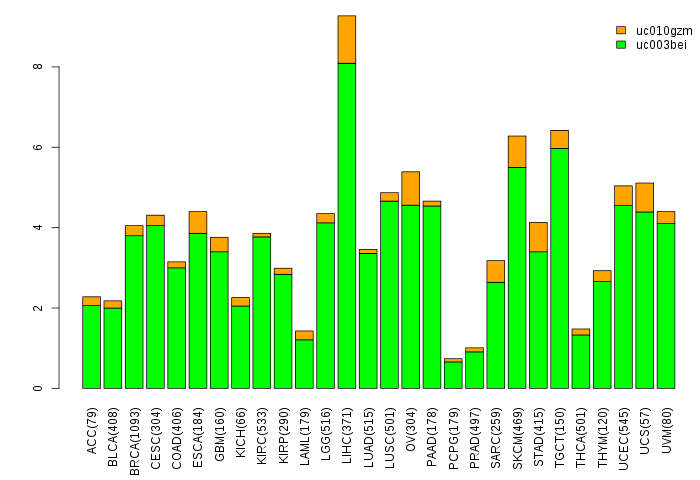
| Gene isoform expressions across 28 cancer types (X-axis: cancer type and Y-axis: log2(norm_counts+1)) (TCGA pan-cancer tcga_rsem_isoform_tpm, version 2016-09-01) |
 |
| Gene expressions across normal tissues of GTEx data (GTEx GTEx_Analysis_v6_RNA-seq_RNA-SeQCv1.1.8_gene_rpkm.gct) - Here, we shows the matched tissue types only among our 28 cancer types. |
 |
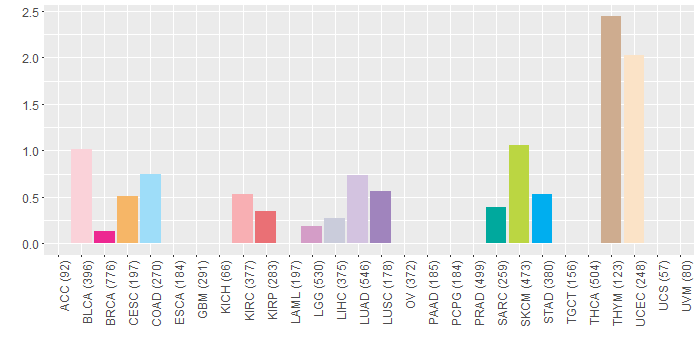
| Different expressions across 14 cancer types with more than 10 samples between matched tumors and normals (X-axis: cancer type and Y-axis: log2(norm_counts+1)) (TCGA IlluminaHiSeq_RNASeqV2, pan-cancer normalized log2(norm_counts+1) data, version 2016-08-16) |
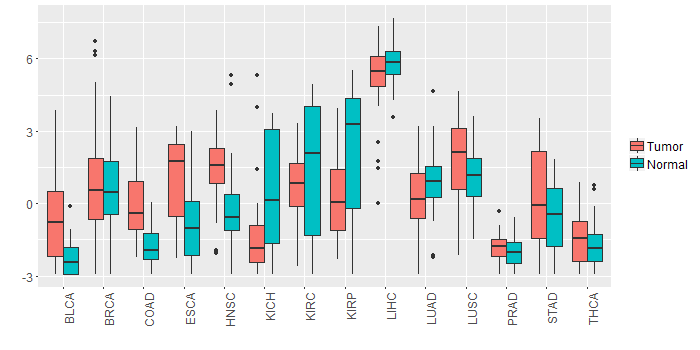 |
| - Significantly differentially expressed cancer types and information. (|Fold change|>1 and FDR<0.05) |
| Cancer type | Mean(exp) in tumor | Mean(exp) in matched normal | Log2FC | P-val. | FDR |
| HNSC | 1.381605008 | -0.206206619 | 1.587811628 | 4.45E-06 | 2.82E-05 |
| COAD | -0.04567102 | -1.783951789 | 1.738280769 | 5.25E-06 | 2.56E-05 |
| BLCA | -0.717383976 | -2.238268186 | 1.520884211 | 0.00421 | 0.0234076 |
| KICH | -1.224130712 | 0.541989288 | -1.76612 | 0.00727 | 0.013419665 |
| KIRP | 0.167871288 | 2.282746288 | -2.114875 | 0.000362 | 0.001098246 |
| Top |
| TissGene-miRNA for PNPLA3 |
| Significantly anti-correlated miRNAs of TissGene across 28 cancer types (Gene-miRNA relations from TargetScanHuman Relsease 7.1, Conserved_Site_Context_Scores.txt.zip, 06.01.2016) (TCGA IlluminaHiSeq_miRNASeq, log2(RPM+1) data, version 2016-11-21) (TCGA IlluminaHiSeq_RNASeqV2, log2(normalized_count+1) data, version 2016-08-16) (Spearman’s Rank Correlation (p-value<0.05 and coefficient<-0.25)) |
| Cancer type | miRNA id | miRNA accession | P-val. | Coeff. | # samples |
| Top |
| TissGeneMut for PNPLA3 |
| TissGeneSNV for PNPLA3 |
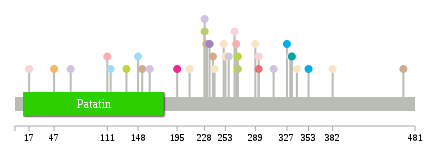
| nsSNV counts per each loci. Different colors of circles represent different cancer types. Circle size denotes number of samples. (TCGA somatic mutation (SNPs and small INDELs) data, version 2016-04-25) * Click on the image to enlarge it in a new window. |
 |
 |
| Somatic nucleotide variants of TissGene across 28 cancer types (X-axis: cancer type and Y-axis: % of mutated samples) The numbers in parentheses are numbers of samples with mutation (nsSNVs). (TCGA somatic mutation (SNPs and small INDELs) data, version 2016-04-25) |
 |
| - nsSNVs sorted by frequency. |
| AAchange | Cancer type | # samples |
| p.K333* | SARC | 1 |
| p.Q67L | LUAD | 1 |
| p.V162M | LUAD | 1 |
| p.E331Q | BLCA | 1 |
| p.P311S | LUAD | 1 |
| p.S134C | SKCM | 1 |
| p.L210F | UCEC | 1 |
| p.G115C | COAD | 1 |
| p.R257W | LIHC | 1 |
| p.G268E | SKCM | 1 |
| p.A327V | STAD | 1 |
| p.G253D | UCEC | 1 |
| p.S289L | UCEC | 1 |
| p.R240X | READ | 1 |
| p.S111Y | KIRC | 1 |
| p.E251D | UCEC | 1 |
| p.S266L | KIRC | 1 |
| p.D230G | SKCM | 1 |
| p.T359I | MESO | 1 |
| p.C238X | THYM | 1 |
| p.L234P | LUSC | 1 |
| p.G268R | SKCM | 1 |
| p.I148M | COAD | 1 |
| p.F17L | BLCA | 1 |
| p.E467D | THYM | 1 |
| p.S264L | BLCA | 1 |
| p.D382N | UCEC | 1 |
| p.R240Q | UCEC | 1 |
| p.Y353C | STAD | 1 |
| p.P228L | SKCM | 1 |
| p.S47L | CESC | 1 |
| p.L231I | LGG | 1 |
| p.M339L | UCEC | 1 |
| p.P228S | LUAD | 1 |
| p.G153V | THYM | 1 |
| p.A293T | KIRP | 1 |
| p.A293P | BLCA | 1 |
| p.P195L | BRCA | 1 |
| Top |
| TissGeneCNV for PNPLA3 |
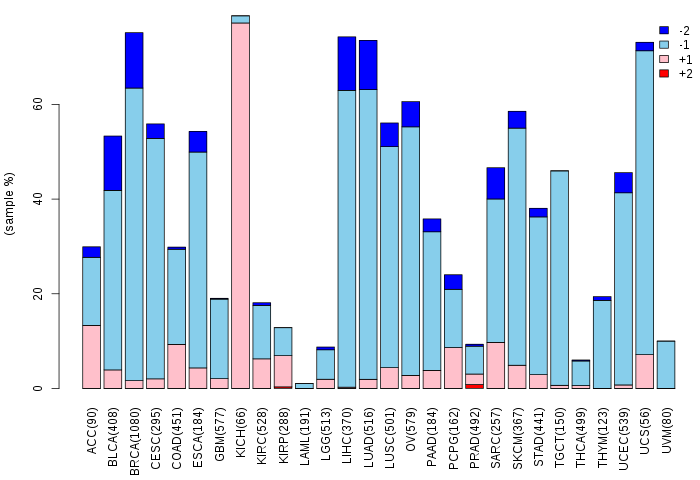
| Copy number variations of TissGene across 28 cancer types (X-axis: cancer type and Y-axis: % of CNV samples) (TCGA Gistic2_CopyNumber_Gistic2_all_data_by_genes, Gistic2 copy number data, version 2016-08-16) |
 |
| Top |
| TissGeneFusions for PNPLA3 |
| Fusion genes including TissGene (ChimerDB 3.0, 2016-12-01 and TCGA fusion Portal 2015-12-01) |
| Database | Src | Cancer type | Sample | Fusion gene | ORF | 5'-gene BP | 3'-gene BP |
| Top |
| TissGeneNet for PNPLA3 |
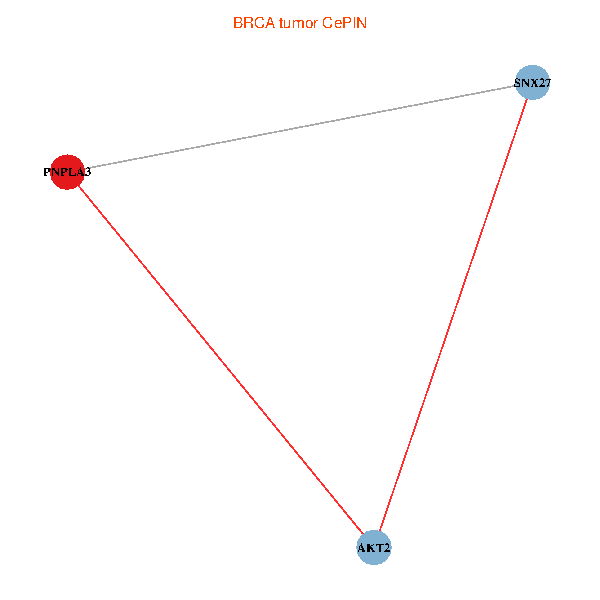
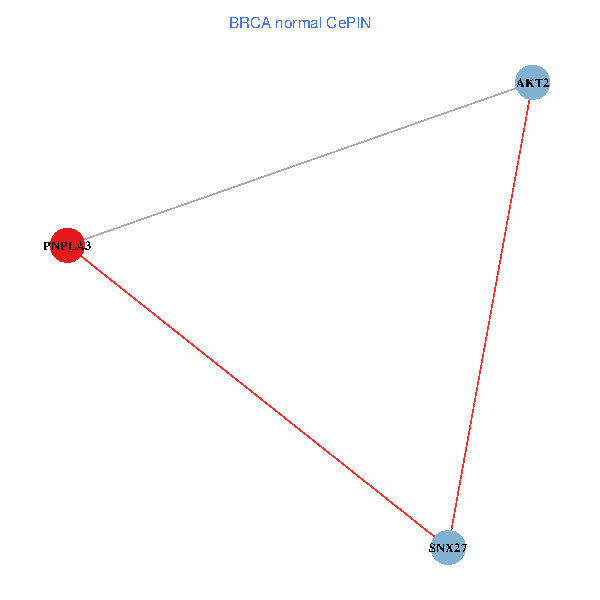
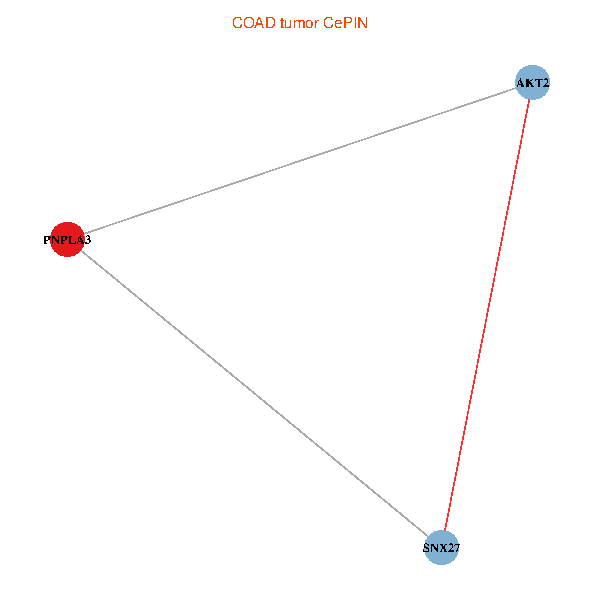
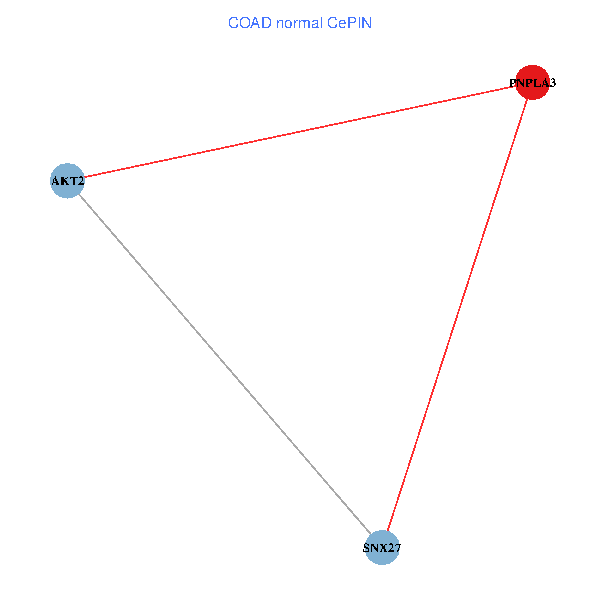
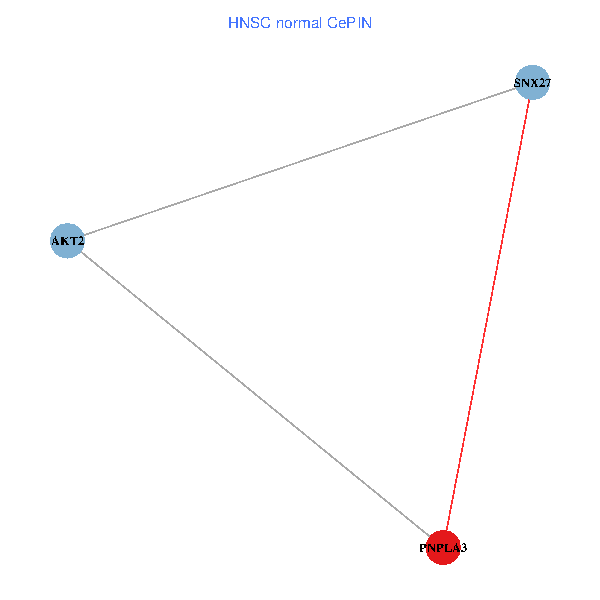
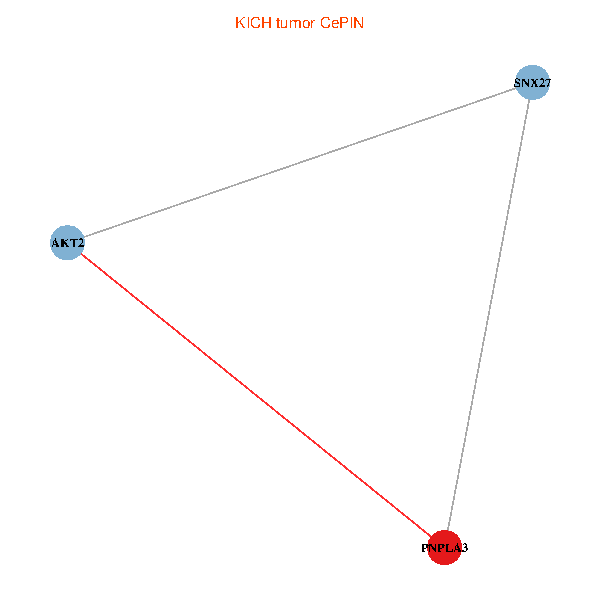
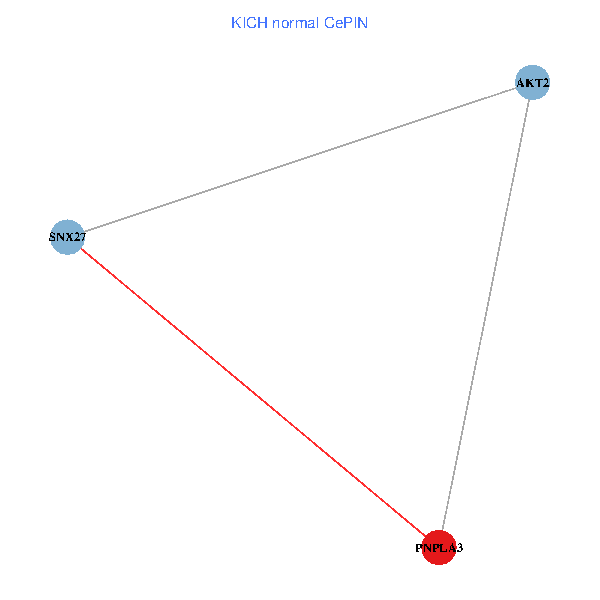
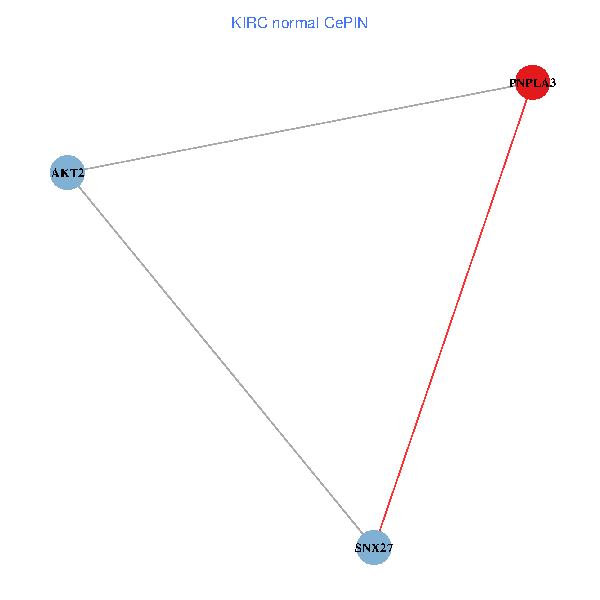
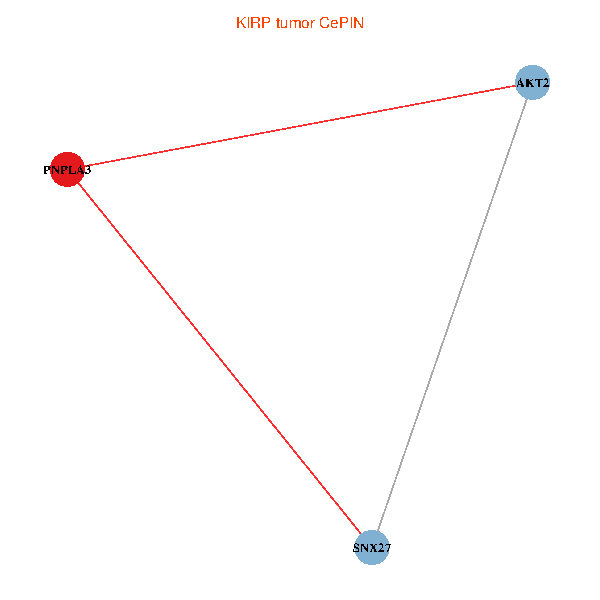
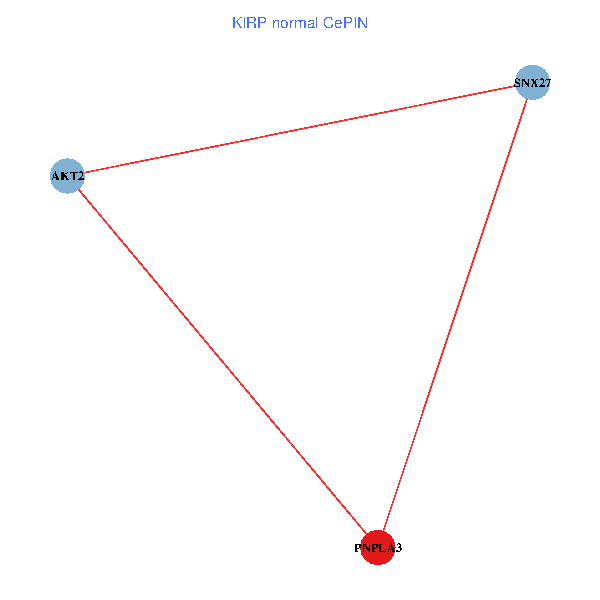
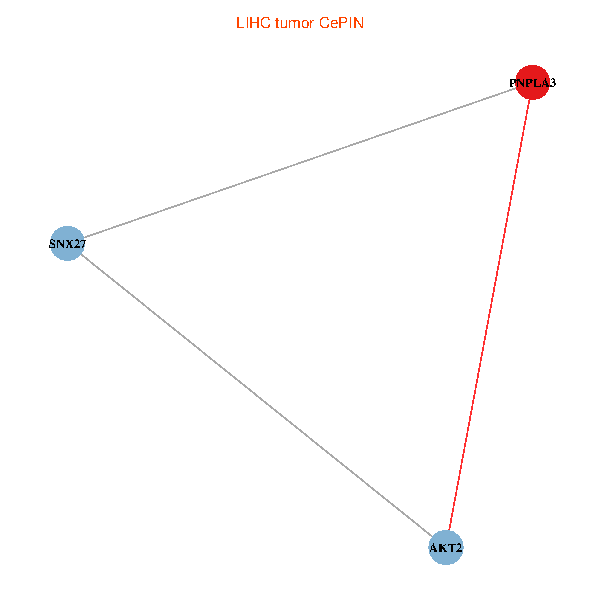
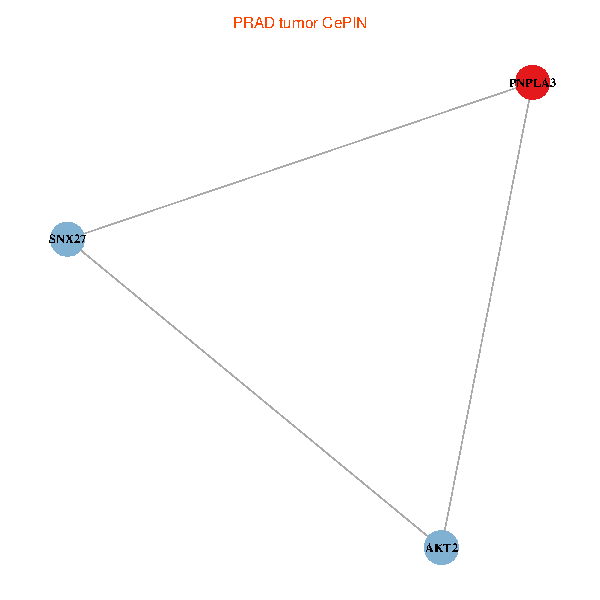
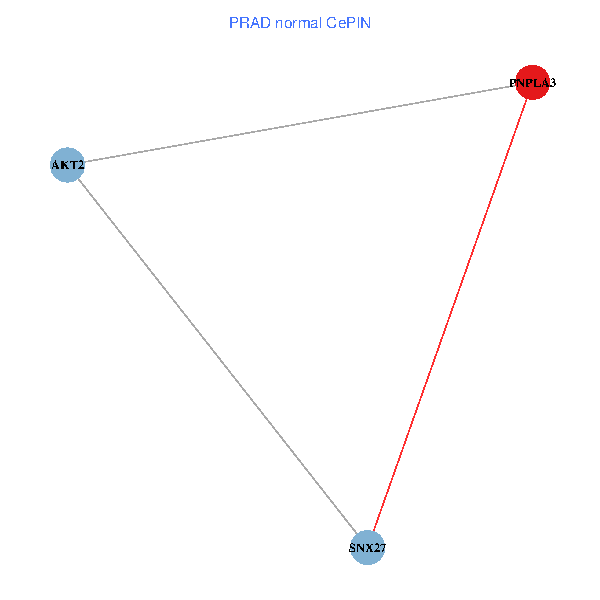
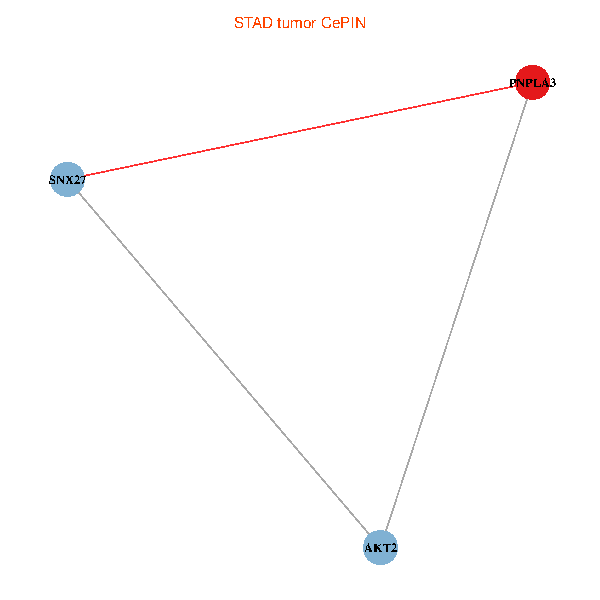
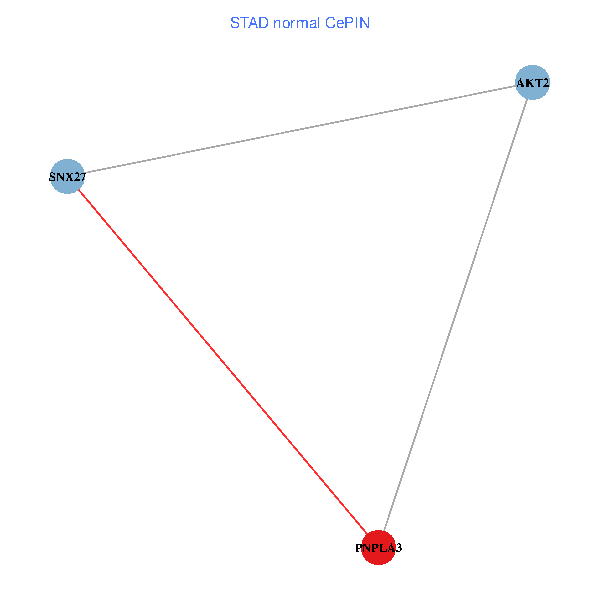
| Co-expressed gene networks based on protein-protein interaction data (CePIN) (TCGA IlluminaHiSeq_RNASeqV2, pan-cancer normalized log2(norm_counts+1) data, version 2016-08-16) (PINA2 ppi data) |
| BRCA (tumor) | BRCA (normal) |
| PNPLA3, AKT2, SNX27 (tumor) | PNPLA3, AKT2, SNX27 (normal) |
 |  |
| COAD (tumor) | COAD (normal) |
| PNPLA3, AKT2, SNX27 (tumor) | PNPLA3, AKT2, SNX27 (normal) |
 |  |
| HNSC (tumor) | HNSC (normal) |
| PNPLA3, AKT2, SNX27 (tumor) | PNPLA3, AKT2, SNX27 (normal) |
 |  |
| KICH (tumor) | KICH (normal) |
| PNPLA3, AKT2, SNX27 (tumor) | PNPLA3, AKT2, SNX27 (normal) |
 |  |
| KIRC (tumor) | KIRC (normal) |
| PNPLA3, AKT2, SNX27 (tumor) | PNPLA3, AKT2, SNX27 (normal) |
 |  |
| KIRP (tumor) | KIRP (normal) |
| PNPLA3, AKT2, SNX27 (tumor) | PNPLA3, AKT2, SNX27 (normal) |
 |  |
| LIHC (tumor) | LIHC (normal) |
| PNPLA3, AKT2, SNX27 (tumor) | PNPLA3, AKT2, SNX27 (normal) |
 |  |
| LUAD (tumor) | LUAD (normal) |
| PNPLA3, AKT2, SNX27 (tumor) | PNPLA3, AKT2, SNX27 (normal) |
 |  |
| LUSC (tumor) | LUSC (normal) |
| PNPLA3, AKT2, SNX27 (tumor) | PNPLA3, AKT2, SNX27 (normal) |
 |  |
| PRAD (tumor) | PRAD (normal) |
| PNPLA3, AKT2, SNX27 (tumor) | PNPLA3, AKT2, SNX27 (normal) |
 |  |
| STAD (tumor) | STAD (normal) |
| PNPLA3, AKT2, SNX27 (tumor) | PNPLA3, AKT2, SNX27 (normal) |
 |  |
| THCA (tumor) | THCA (normal) |
| PNPLA3, AKT2, SNX27 (tumor) | PNPLA3, AKT2, SNX27 (normal) |
 |  |
| Top |
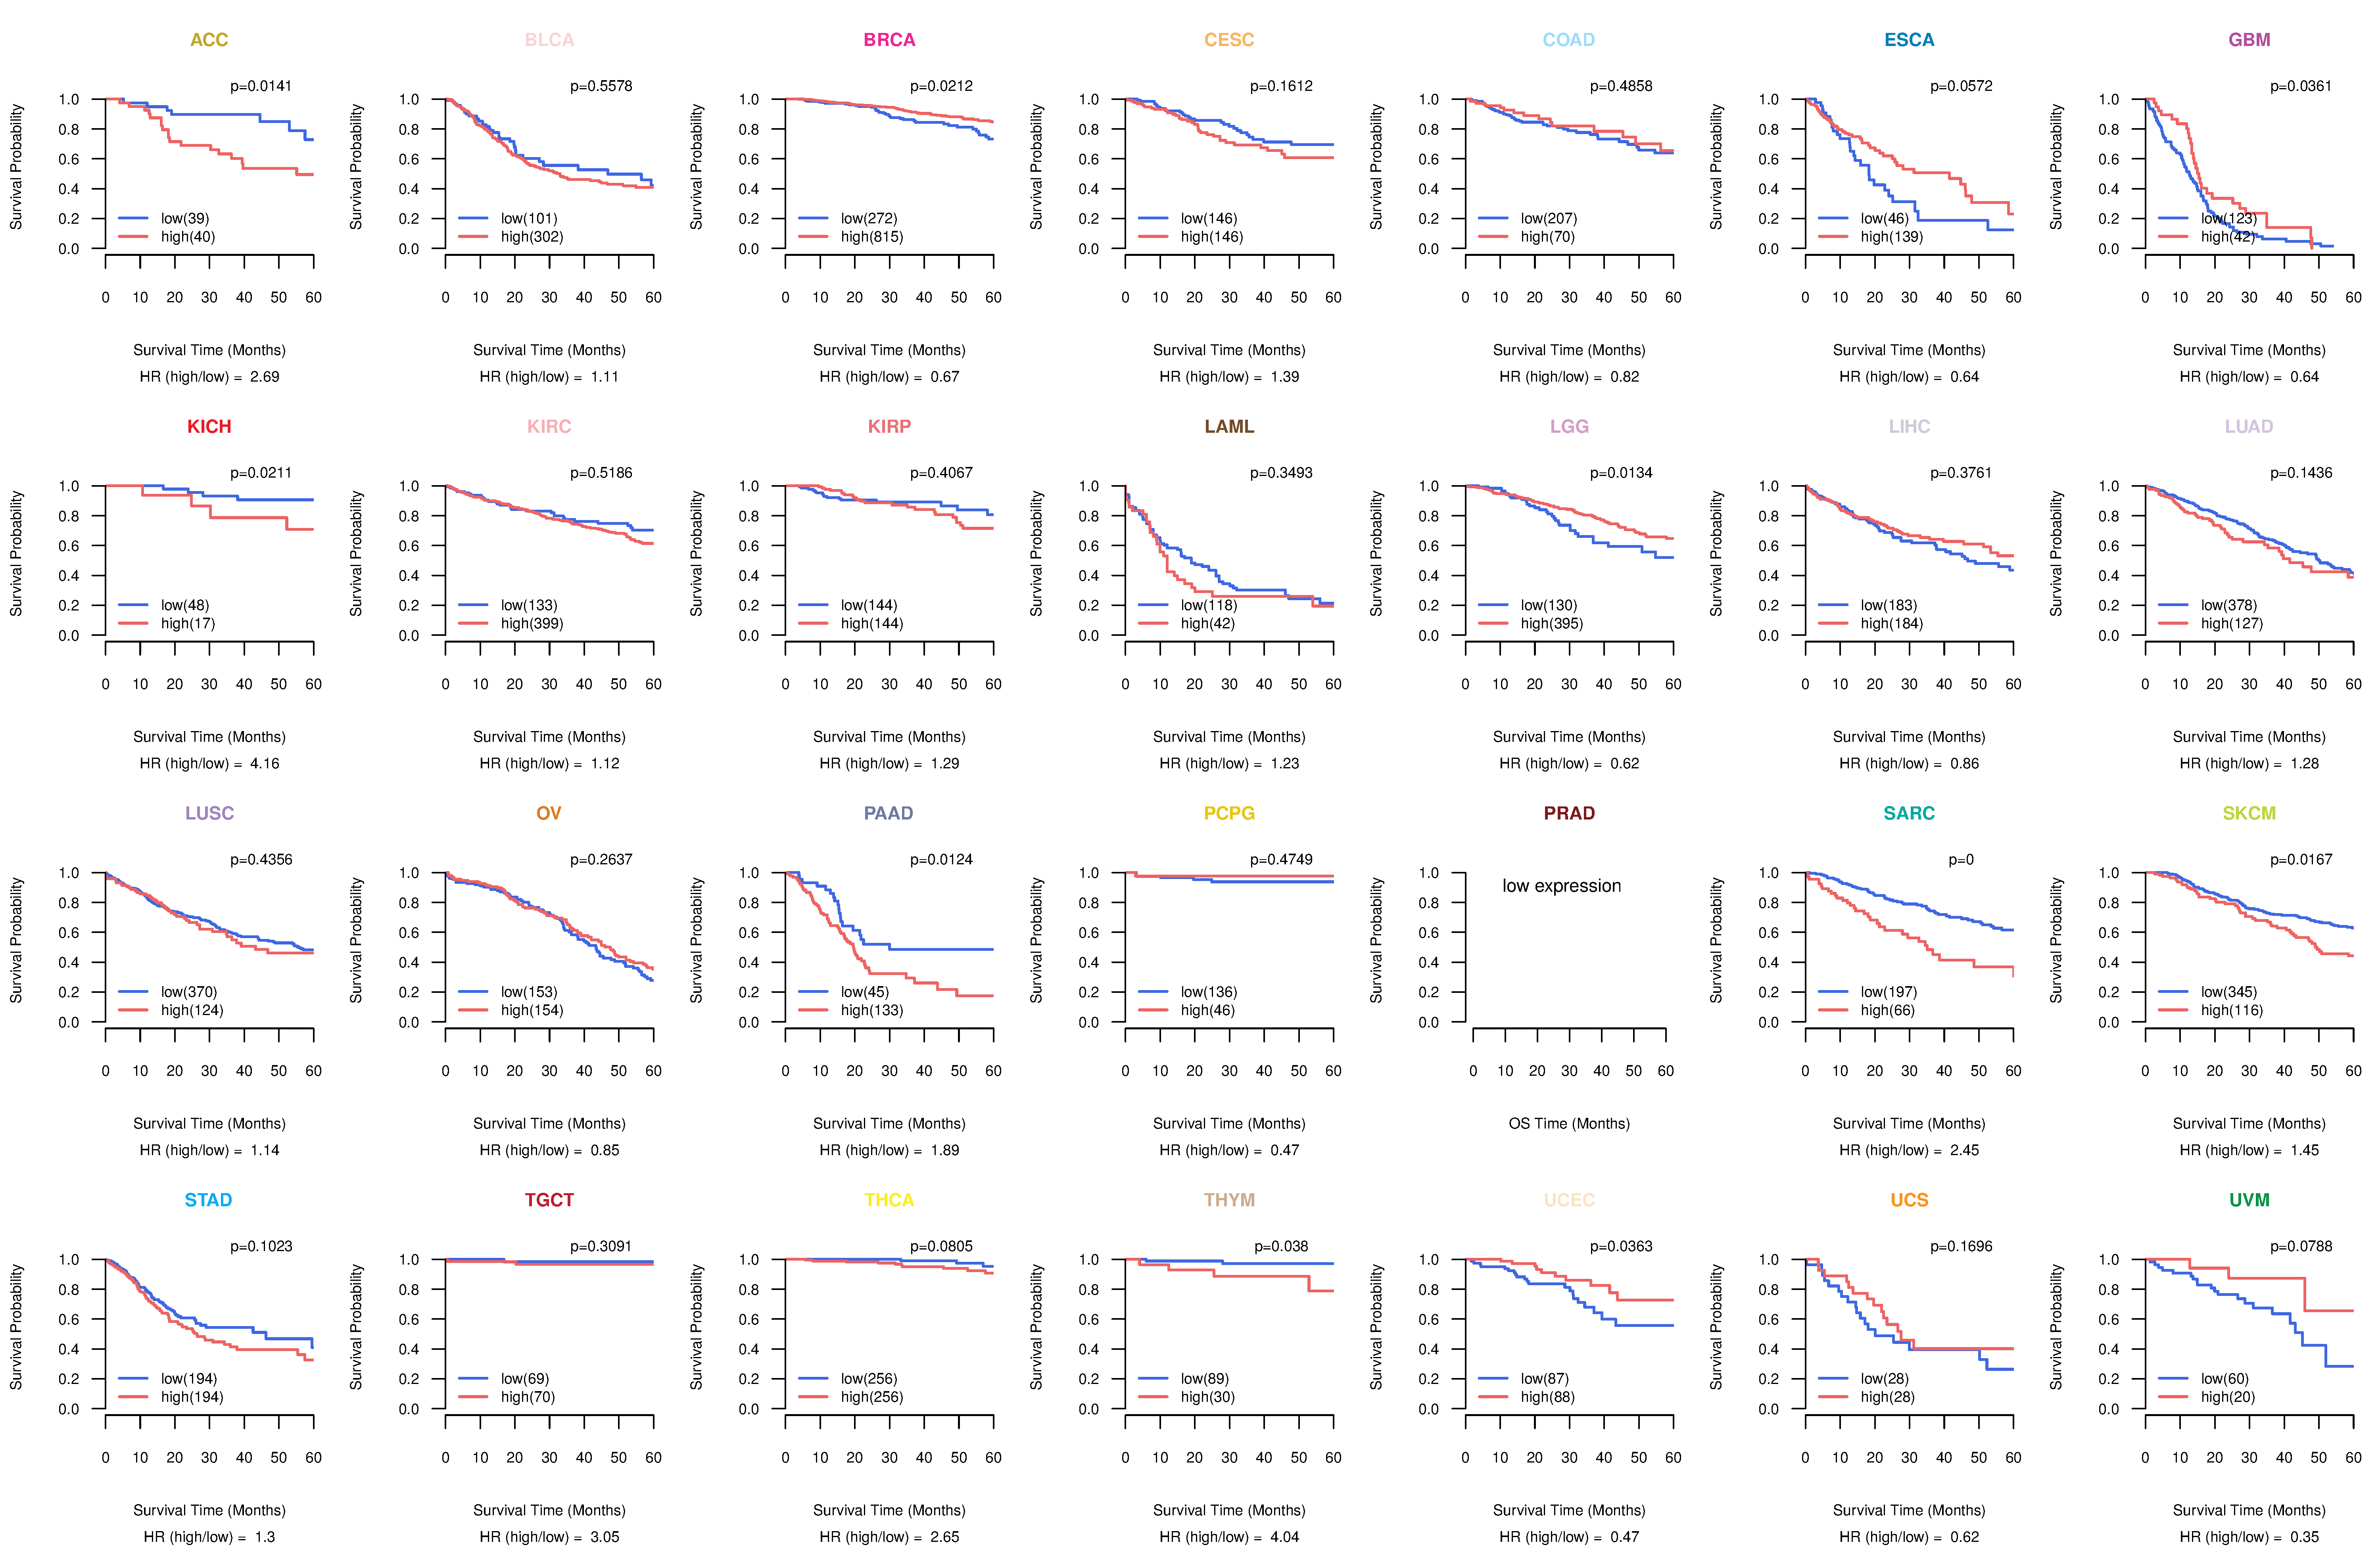
| TissGeneProg for PNPLA3 |
| Kaplan-Meier plots with logrank tests of overall survival (OS) using 28 cancer types (TCGA IlluminaHiSeq_RNASeqV2, pan-cancer normalized log2(norm_counts+1) data, version 2016-08-16) (TCGA clinicalMatrix, phenotype data, version 2016-04-27) * Click on the image to enlarge it in a new window. |
 |
| Kaplan-Meier plots with logrank test of relapse free survival (RFS) using 28 cancer types (TCGA IlluminaHiSeq_RNASeqV2, pan-cancer normalized log2(norm_counts+1) data, version 2016-08-16) (TCGA clinicalMatrix, phenotype data, version 2016-04-27) * Click on the image enlarge it in a new window. |
 |
| Forest plot of Cox proportional hazard ratio (HR) and 95% CI of overall survival (OS) using 28 cancer types (TCGA IlluminaHiSeq_RNASeqV2, pan-cancer normalized log2(norm_counts+1) data, version 2016-08-16) (TCGA clinicalMatrix, phenotype data, version 2016-04-27) * Click on the image enlarge it in a new window. |
 |
| Forest plot of Cox proportional hazard ratio (HR) and 95% CI of relapse free survival (RFS) using 28 cancer types (TCGA IlluminaHiSeq_RNASeqV2, pan-cancer normalized log2(norm_counts+1) data, version 2016-08-16) (TCGA clinicalMatrix, phenotype data, version 2016-04-27) * Click on the image enlarge it in a new window. |
 |
| Top |
| TissGeneClin for PNPLA3 |
| TissGeneDrug for PNPLA3 |
| Drug information targeting TissGene (DrugBank Version 5.0.6, 2017-04-01) |
| DrugBank ID | Drug name | Drug activity | Drug type | Drug status |
| Top |
| TissGeneDisease for PNPLA3 |
| Disease information associated with TissGene (DisGeNet, 2016-06-01) |
| Disease ID | Disease name | # pubmeds | Source |
| umls:C0400966 | Non-alcoholic Fatty Liver Disease | 84 | BeFree,CTD_human,GAD,GWASCAT |
| umls:C0015695 | Fatty Liver | 51 | BeFree,CTD_human,GAD,LHGDN |
| umls:C2711227 | Steatohepatitis | 34 | BeFree |
| umls:C0028754 | Obesity | 32 | BeFree,GAD |
| umls:C0023890 | Liver Cirrhosis | 22 | BeFree,GAD |
| umls:C2239176 | Liver carcinoma | 21 | BeFree |
| umls:C0023895 | Liver diseases | 20 | BeFree,GAD |
| umls:C1623038 | Cirrhosis | 20 | BeFree |
| umls:C0239946 | Fibrosis, Liver | 15 | BeFree |
| umls:C0524910 | Hepatitis C, Chronic | 12 | BeFree |
| umls:C0023896 | Alcoholic Liver Diseases | 10 | BeFree,CTD_human,GAD |
| umls:C0023891 | Liver Cirrhosis, Alcoholic | 9 | BeFree,CTD_human,GAD |
| umls:C0497406 | Overweight | 9 | BeFree,GAD |
| umls:C3241937 | Nonalcoholic Steatohepatitis | 9 | BeFree |
| umls:C0019196 | Hepatitis C | 8 | BeFree |
| umls:C0524620 | Metabolic Syndrome X | 8 | BeFree,GAD |
| umls:C0011860 | Diabetes Mellitus, Non-Insulin-Dependent | 6 | BeFree,GAD |
| umls:C0162309 | Adrenoleukodystrophy | 4 | BeFree |
| umls:C0341439 | Chronic liver disease | 4 | BeFree |
| umls:C0345904 | Malignant neoplasm of liver | 4 | BeFree |
| umls:C0011849 | Diabetes Mellitus | 3 | BeFree |
| umls:C0021655 | Insulin Resistance | 3 | GAD |
| umls:C0279000 | Liver and Intrahepatic Biliary Tract Carcinoma | 3 | BeFree |
| umls:C0524909 | Hepatitis B, Chronic | 3 | BeFree |
| umls:C0001973 | Alcoholic Intoxication, Chronic | 2 | BeFree,GAD |
| umls:C0011847 | Diabetes | 2 | BeFree |
| umls:C0019163 | Hepatitis B | 2 | BeFree |
| umls:C0019693 | HIV Infections | 2 | BeFree |
| umls:C0020459 | Hyperinsulinism | 2 | BeFree |
| umls:C0025517 | Metabolic Diseases | 2 | BeFree |
| umls:C0028756 | Obesity, Morbid | 2 | BeFree |
| umls:C0042721 | Viral hepatitis | 2 | BeFree |
| umls:C0042769 | Virus Diseases | 2 | BeFree |
| umls:C2362324 | Pediatric Obesity | 2 | BeFree |
| umls:C0003850 | Arteriosclerosis | 1 | BeFree |
| umls:C0004153 | Atherosclerosis | 1 | BeFree |
| umls:C0008350 | Cholelithiasis | 1 | BeFree |
| umls:C0011854 | Diabetes Mellitus, Insulin-Dependent | 1 | BeFree |
| umls:C0015696 | Fatty Liver, Alcoholic | 1 | GAD |
| umls:C0016059 | Fibrosis | 1 | GAD |
| umls:C0020456 | Hyperglycemia | 1 | BeFree |
| umls:C0023903 | Liver neoplasms | 1 | BeFree |
| umls:C0085207 | Gestational Diabetes | 1 | BeFree |
| umls:C0085605 | Liver Failure | 1 | BeFree |
| umls:C0267925 | Stenosis of bile duct | 1 | BeFree |
| umls:C0745744 | End Stage Liver Disease | 1 | BeFree |
| umls:C0947622 | Cholecystolithiasis | 1 | BeFree |
| umls:C1512409 | Hepatocarcinogenesis | 1 | BeFree |
| umls:C1561546 | Alkaline Phosphatase Adverse Event | 1 | GAD |
| umls:C2936179 | Obesity, Visceral | 1 | BeFree |
|
Copyright 2016-Present - The University of Texas Health Science Center at Houston (UTHealth) Web File Viewing | How to Report, Fraud, Waste and Abuse | State of Texas | Statewide Search | Texas Homeland Security | Site Policies |