 |
| |
| |
| |
| |
| |
| |
|

| TissGeneSummary for TSGA10 |
 Gene summary Gene summary |
| Basic gene information | Gene symbol | TSGA10 |
| Gene name | testis specific, 10 | |
| Synonyms | CEP4L|CT79 | |
| Cytomap | UCSC genome browser: 2q11.2 | |
| Type of gene | protein-coding | |
| RefGenes | NM_025244.2, NM_182911.3, | |
| Description | cancer/testis antigen 79testis development protein NYD-SP7testis-specific gene 10 protein | |
| Modification date | 20141207 | |
| dbXrefs | MIM : 607166 | |
| HGNC : HGNC | ||
| Ensembl : ENSG00000135951 | ||
| HPRD : 06202 | ||
| Vega : OTTHUMG00000130637 | ||
| Protein | UniProt: go to UniProt's Cross Reference DB Table | |
| Expression | CleanEX: HS_TSGA10 | |
| BioGPS: 80705 | ||
| Pathway | NCI Pathway Interaction Database: TSGA10 | |
| KEGG: TSGA10 | ||
| REACTOME: TSGA10 | ||
| Pathway Commons: TSGA10 | ||
| Context | iHOP: TSGA10 | |
| ligand binding site mutation search in PubMed: TSGA10 | ||
| UCL Cancer Institute: TSGA10 | ||
| Assigned class in TissGDB* | C | |
| Included tissue-specific gene expression resources | ||
| Specific-tissues in normal samples (assigned by TissGDB using HPA, TiGER, and GTEx) | Testis | |
| Cancer types related to the specific-tissues in cancer samples (assigned by TissGDB using TCGA) | TGCT | |
| Reference showing the relevant tissue of TSGA10 | ||
| Description by TissGene annotations | ||
| * Class A consists of genes with literature evidence and is part of the cTissGenes. Class B consists of only cTissGenes without additional evidence. The remaining genes belong to Class C. |
| Gene ontology having evidence of Inferred from Direct Assay (IDA) from Entrez |
| GO ID | GO term | PubMed ID |
| Top |
| TissGeneExp for TSGA10 |
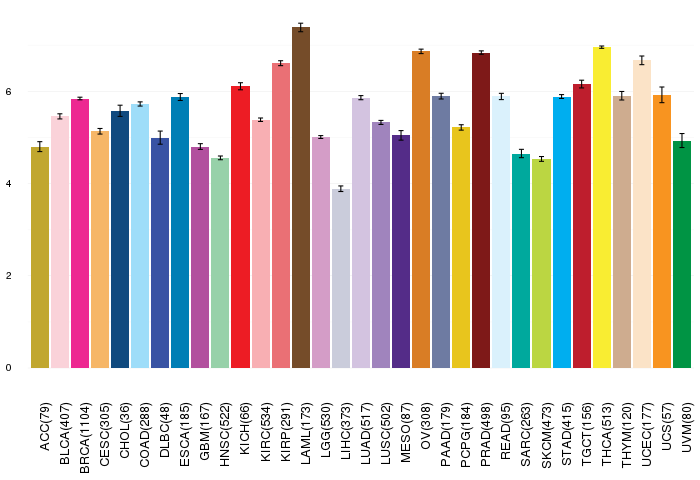
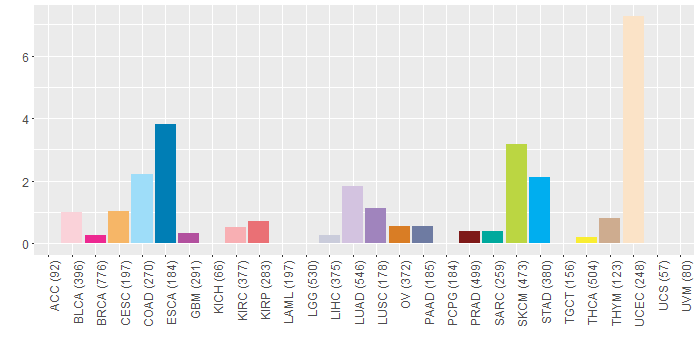
| Gene expressions across 28 cancer types (X-axis: cancer type and Y-axis: log2(norm_counts+1)) (TCGA IlluminaHiSeq_RNASeqV2, pan-cancer normalized log2(norm_counts+1) data, version 2016-08-16) |
 |
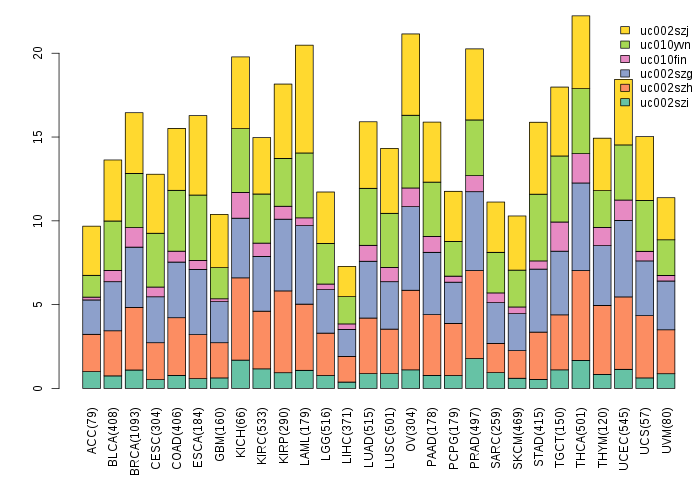
| Gene isoform expressions across 28 cancer types (X-axis: cancer type and Y-axis: log2(norm_counts+1)) (TCGA pan-cancer tcga_rsem_isoform_tpm, version 2016-09-01) |
 |
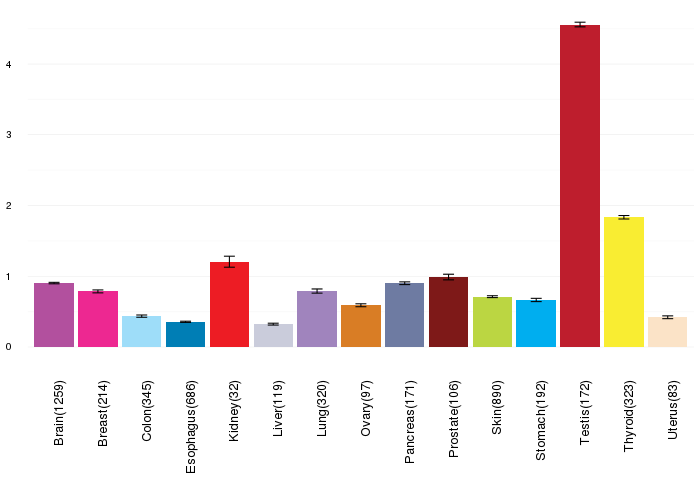
| Gene expressions across normal tissues of GTEx data (GTEx GTEx_Analysis_v6_RNA-seq_RNA-SeQCv1.1.8_gene_rpkm.gct) - Here, we shows the matched tissue types only among our 28 cancer types. |
 |
| Different expressions across 14 cancer types with more than 10 samples between matched tumors and normals (X-axis: cancer type and Y-axis: log2(norm_counts+1)) (TCGA IlluminaHiSeq_RNASeqV2, pan-cancer normalized log2(norm_counts+1) data, version 2016-08-16) |
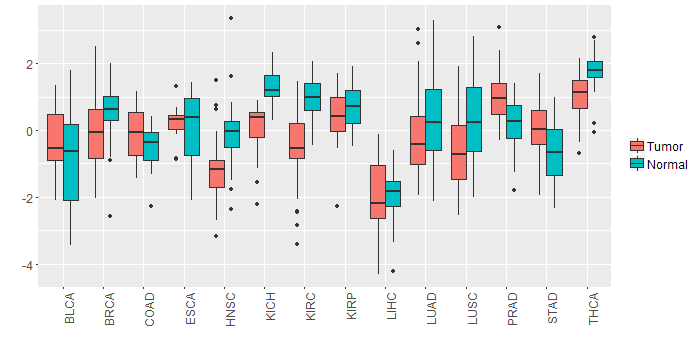 |
| - Significantly differentially expressed cancer types and information. (|Fold change|>1 and FDR<0.05) |
| Cancer type | Mean(exp) in tumor | Mean(exp) in matched normal | Log2FC | P-val. | FDR |
| KICH | 0.065841907 | 1.263493907 | -1.197652 | 2.12E-07 | 9.11E-07 |
| HNSC | -1.188115953 | -0.122483395 | -1.065632558 | 6.45E-07 | 5.11E-06 |
| KIRC | -0.499408815 | 0.974924518 | -1.474333333 | 2.30E-19 | 1.70E-18 |
| Top |
| TissGene-miRNA for TSGA10 |
| Significantly anti-correlated miRNAs of TissGene across 28 cancer types (Gene-miRNA relations from TargetScanHuman Relsease 7.1, Conserved_Site_Context_Scores.txt.zip, 06.01.2016) (TCGA IlluminaHiSeq_miRNASeq, log2(RPM+1) data, version 2016-11-21) (TCGA IlluminaHiSeq_RNASeqV2, log2(normalized_count+1) data, version 2016-08-16) (Spearman’s Rank Correlation (p-value<0.05 and coefficient<-0.25)) |
| Cancer type | miRNA id | miRNA accession | P-val. | Coeff. | # samples |
| Top |
| TissGeneMut for TSGA10 |
| TissGeneSNV for TSGA10 |
| nsSNV counts per each loci. Different colors of circles represent different cancer types. Circle size denotes number of samples. (TCGA somatic mutation (SNPs and small INDELs) data, version 2016-04-25) * Click on the image to enlarge it in a new window. |
 |
| Somatic nucleotide variants of TissGene across 28 cancer types (X-axis: cancer type and Y-axis: % of mutated samples) The numbers in parentheses are numbers of samples with mutation (nsSNVs). (TCGA somatic mutation (SNPs and small INDELs) data, version 2016-04-25) |
 |
| - nsSNVs sorted by frequency. |
| AAchange | Cancer type | # samples |
| p.R33C | SKCM | 2 |
| p.S286F | SKCM | 2 |
| p.R113Q | SKCM | 1 |
| p.Y695C | LUAD | 1 |
| p.R33H | BRCA | 1 |
| p.I50S | UCEC | 1 |
| p.D460Y | LUAD | 1 |
| p.D278G | HNSC | 1 |
| p.E190* | KIRP | 1 |
| p.H46N | UCEC | 1 |
| p.R253Q | HNSC | 1 |
| p.I258T | KIRC | 1 |
| p.E647K | SKCM | 1 |
| p.S59Y | UCEC | 1 |
| p.K197N | ESCA | 1 |
| p.R418* | UCEC | 1 |
| p.Q479H | COAD | 1 |
| p.A531V | COAD | 1 |
| p.S290R | UCEC | 1 |
| p.E145Q | BLCA | 1 |
| p.E190X | KIRP | 1 |
| p.E233D | THCA | 1 |
| p.E535* | UCEC | 1 |
| p.K279R | UCEC | 1 |
| p.R77Q | UCEC | 1 |
| p.N401D | LUAD | 1 |
| p.T93M | PAAD | 1 |
| p.Q495* | SKCM | 1 |
| p.Q387E | LUAD | 1 |
| p.R331W | CESC | 1 |
| p.L445R | STAD | 1 |
| p.S545Y | LUSC | 1 |
| p.Q332* | UCEC | 1 |
| p.R3* | PRAD | 1 |
| p.E69K | KIRC | 1 |
| p.V502L | HNSC | 1 |
| p.L154P | ESCA | 1 |
| p.N283K | UCEC | 1 |
| p.I536T | BLCA | 1 |
| p.R418X | SKCM | 1 |
| p.I284S | UCEC | 1 |
| p.R113* | LUAD | 1 |
| p.V321A | OV | 1 |
| p.E537* | UCEC | 1 |
| p.R79Q | DLBC | 1 |
| p.K477M | STAD | 1 |
| p.R330C | UCEC | 1 |
| p.S662Y | READ | 1 |
| p.R3Q | COAD | 1 |
| p.L273M | STAD | 1 |
| p.Q495X | SKCM | 1 |
| p.Q495H | COAD | 1 |
| p.R687* | UCEC | 1 |
| p.E255D | SKCM | 1 |
| p.S372P | SKCM | 1 |
| p.R687L | ESCA | 1 |
| p.Q252E | HNSC | 1 |
| p.A133V | STAD | 1 |
| p.E551* | LUAD | 1 |
| p.S6F | SKCM | 1 |
| p.R432H | HNSC | 1 |
| p.T262N | ESCA | 1 |
| p.E69D | BLCA | 1 |
| p.V487A | UCEC | 1 |
| p.E148Q | CESC | 1 |
| p.S202Y | UCEC | 1 |
| p.T132A | LIHC | 1 |
| p.R575Q | UCEC | 1 |
| p.R3X | COAD | 1 |
| p.S299L | SKCM | 1 |
| p.R33C | UCEC | 1 |
| p.E597K | GBM | 1 |
| p.R561K | STAD | 1 |
| p.R3X | PRAD | 1 |
| p.R687* | SARC | 1 |
| p.S461F | HNSC | 1 |
| p.E136* | LUAD | 1 |
| p.Q556* | LUAD | 1 |
| p.K532* | SKCM | 1 |
| p.L206F | LUSC | 1 |
| p.R683Q | KIRP | 1 |
| p.D460Y | PRAD | 1 |
| p.E451D | PAAD | 1 |
| p.E578Q | ESCA | 1 |
| p.S13P | COAD | 1 |
| p.P9L | SKCM | 1 |
| p.K169E | HNSC | 1 |
| p.E145Q | HNSC | 1 |
| p.G288E | SKCM | 1 |
| p.E691D | OV | 1 |
| p.Q556H | CHOL | 1 |
| p.Q593E | BLCA | 1 |
| p.K84E | ESCA | 1 |
| p.K223N | ESCA | 1 |
| p.S503Y | LUAD | 1 |
| p.K279N | UCEC | 1 |
| p.E102D | LUAD | 1 |
| p.S408F | UCEC | 1 |
| p.Y658* | BRCA | 1 |
| p.S85G | THYM | 1 |
| p.S672L | SKCM | 1 |
| p.R649H | UCEC | 1 |
| p.A558T | STAD | 1 |
| p.L685P | UCEC | 1 |
| p.R418* | SKCM | 1 |
| p.R330C | STAD | 1 |
| p.Q556H | LUAD | 1 |
| p.R3* | STAD | 1 |
| Top |
| TissGeneCNV for TSGA10 |
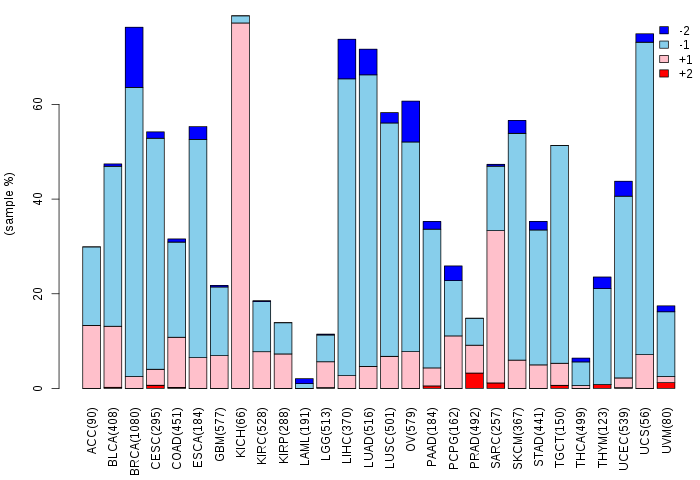
| Copy number variations of TissGene across 28 cancer types (X-axis: cancer type and Y-axis: % of CNV samples) (TCGA Gistic2_CopyNumber_Gistic2_all_data_by_genes, Gistic2 copy number data, version 2016-08-16) |
 |
| Top |
| TissGeneFusions for TSGA10 |
| Fusion genes including TissGene (ChimerDB 3.0, 2016-12-01 and TCGA fusion Portal 2015-12-01) |
| Database | Src | Cancer type | Sample | Fusion gene | ORF | 5'-gene BP | 3'-gene BP |
| Chimerdb3.0 | FusionScan | UCS | TCGA-N9-A4Q1-01A | CHIC2-TSGA10 | Out-of-Frame | chr4:54915121 | chr2:99614684 |
| TCGAfusionPortal | PRADA | BRCA | TCGA-A8-A08L-01A | CHN1-TSGA10 | CDS-5UTR | Chr2:175869622 | Chr2:99734222 |
| TCGAfusionPortal | PRADA | LUSC | TCGA-22-5492-01A | ACTR2-TSGA10 | In-frame | Chr2:65455091 | Chr2:99722160 |
| TCGAfusionPortal | PRADA | PRAD | TCGA-KK-A8ID-01A | KIAA1310-TSGA10 | In-frame | Chr2:97278555 | Chr2:99720581 |
| Top |
| TissGeneNet for TSGA10 |
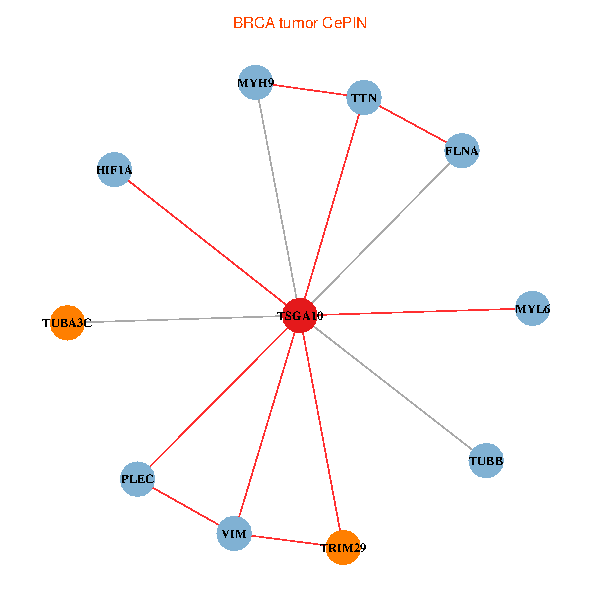
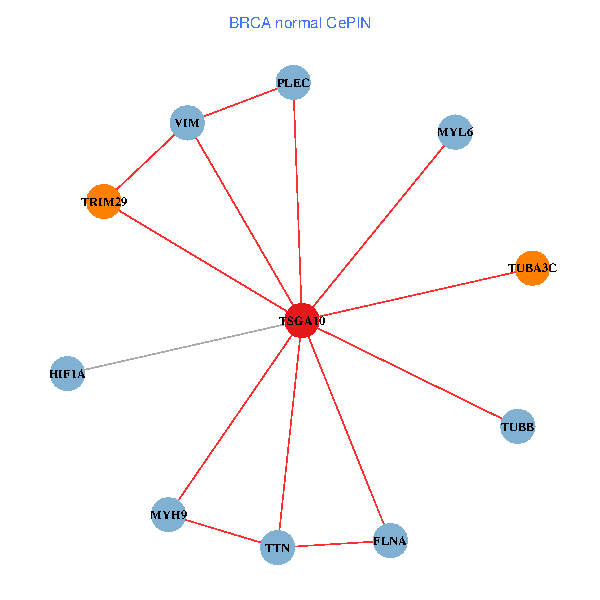
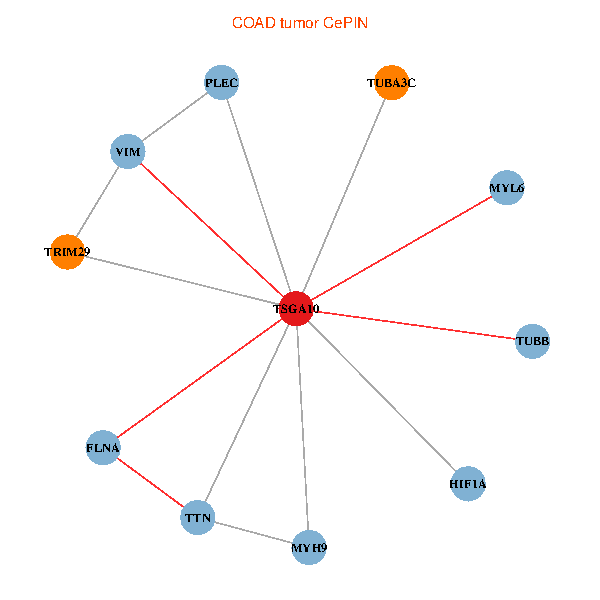
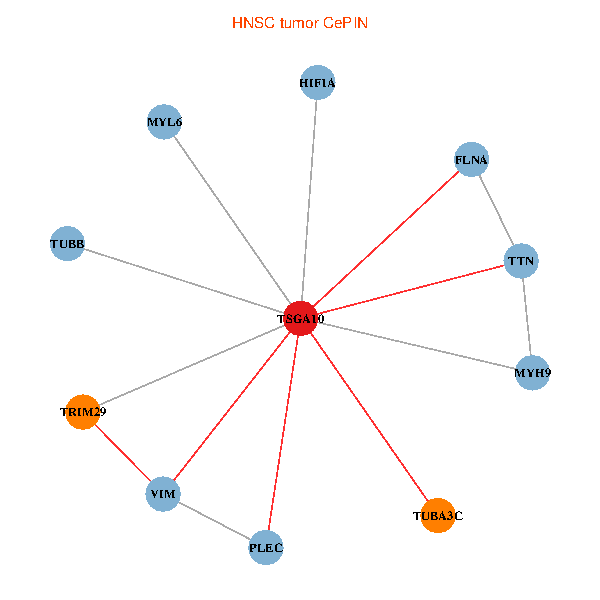
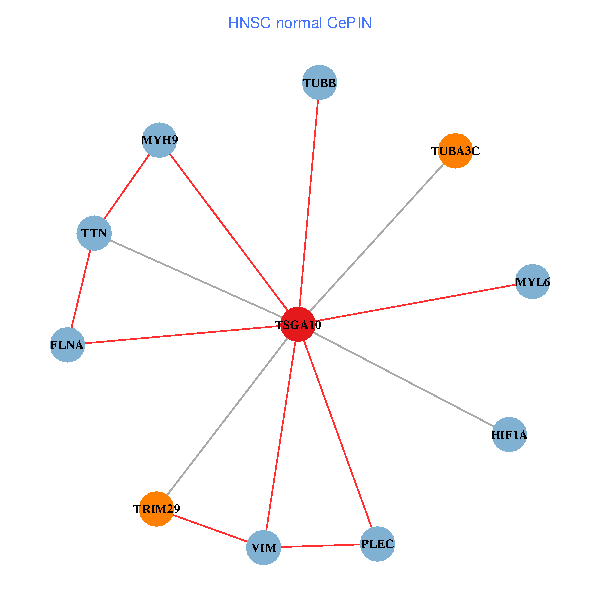
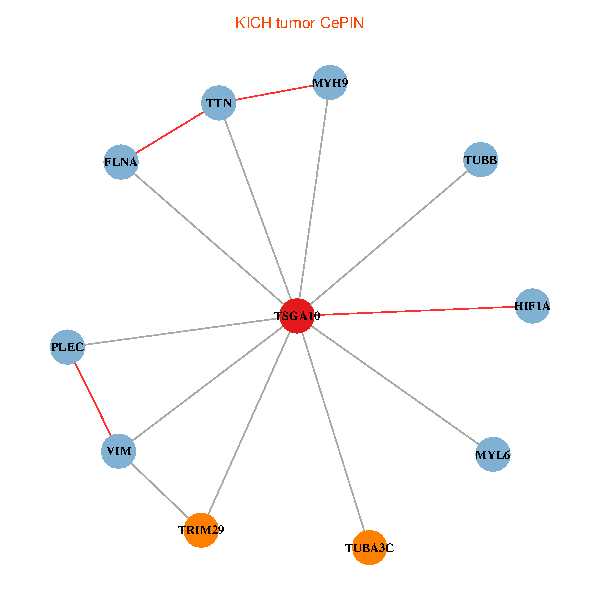
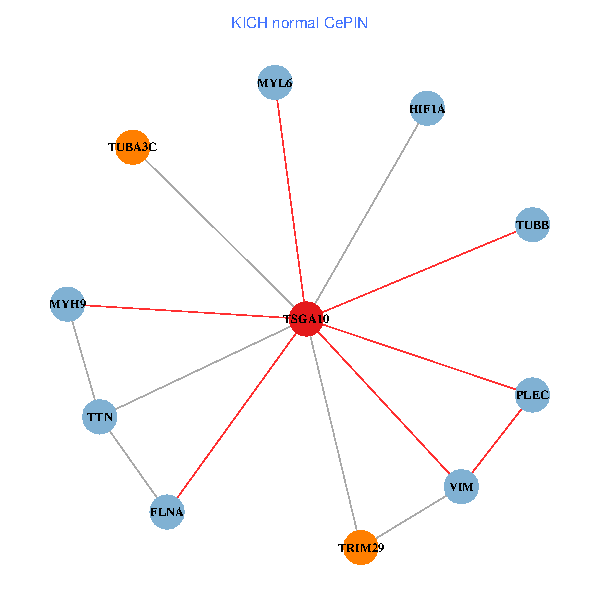
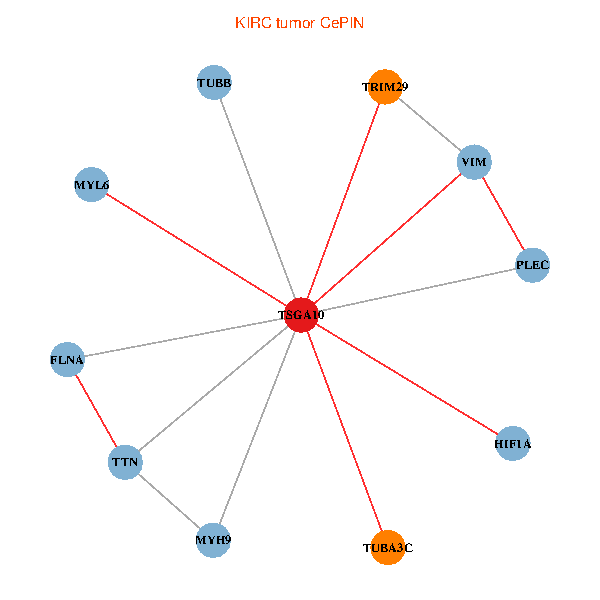
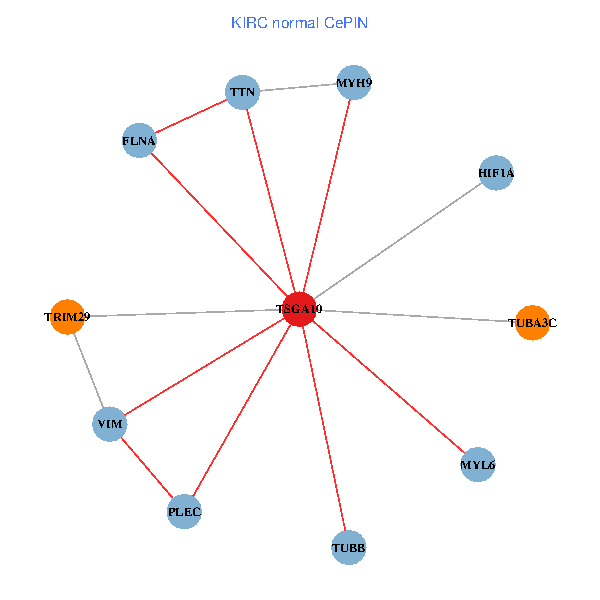
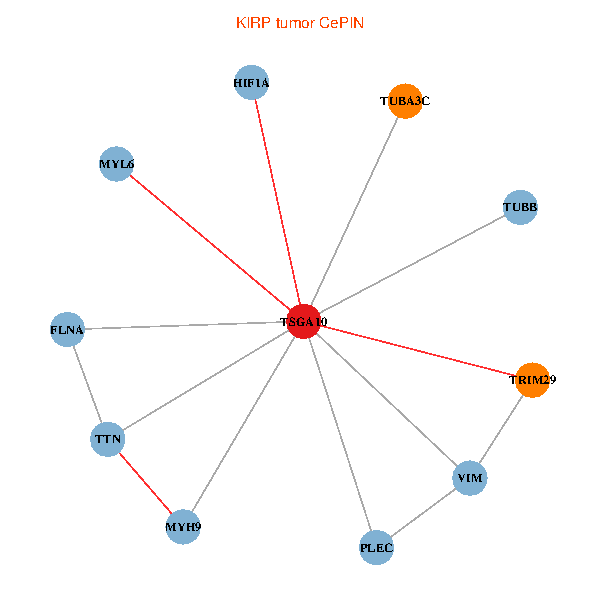
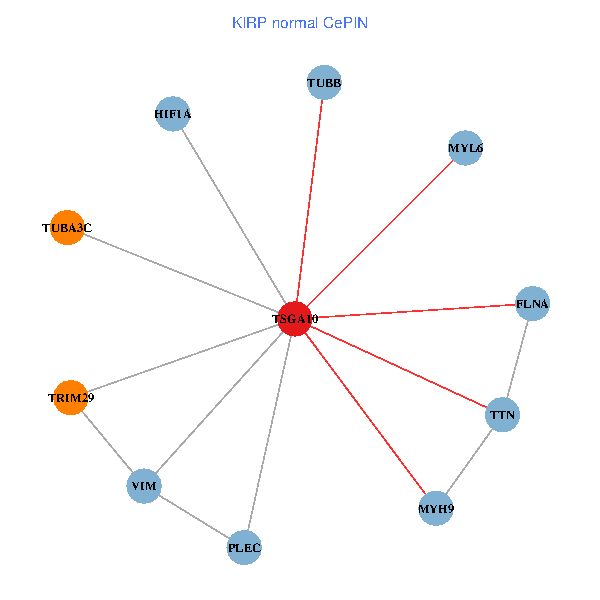
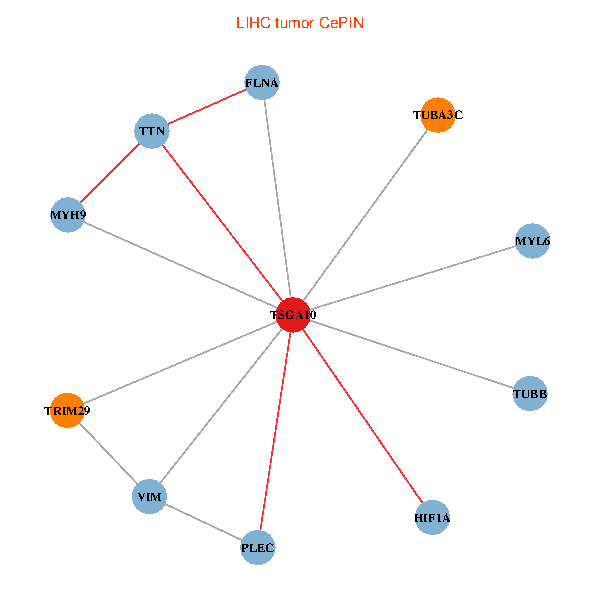
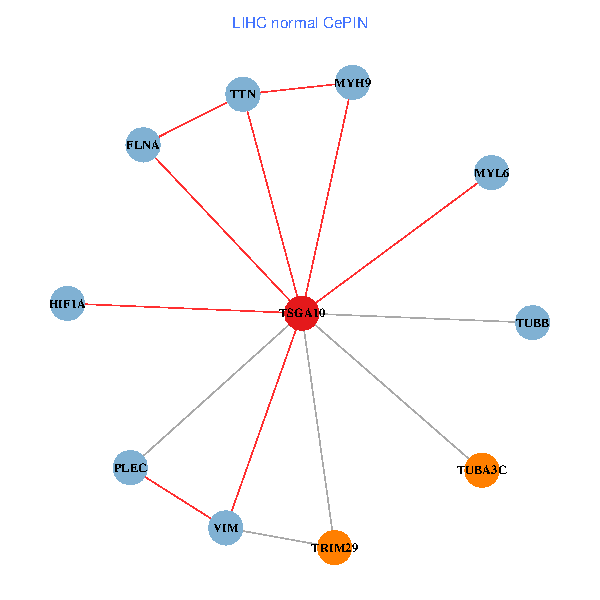
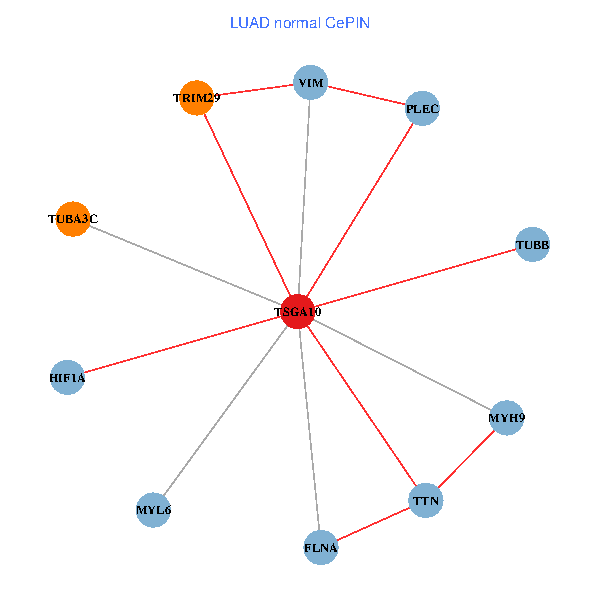
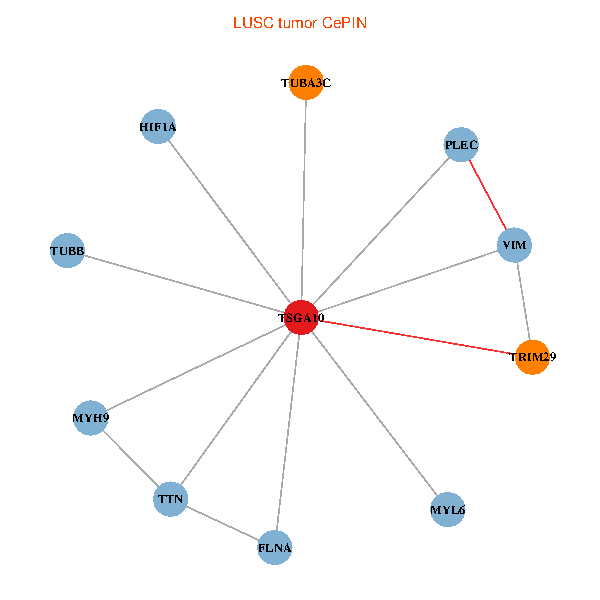
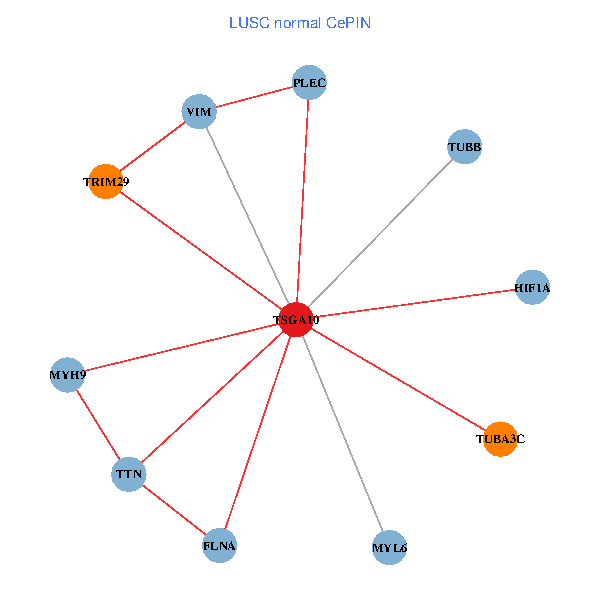
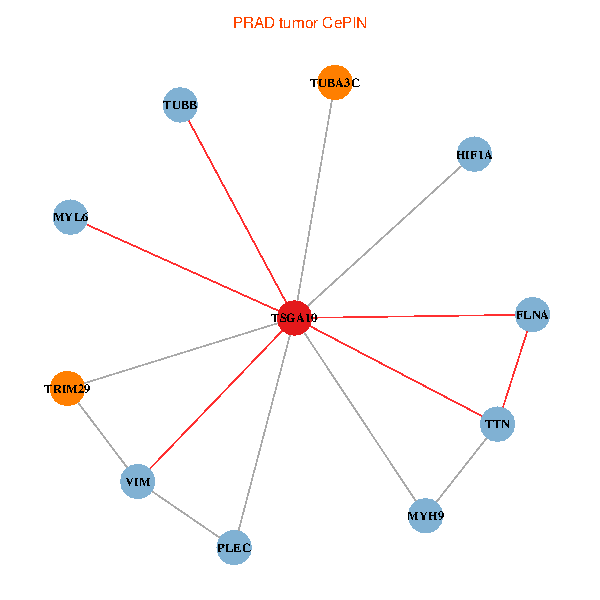
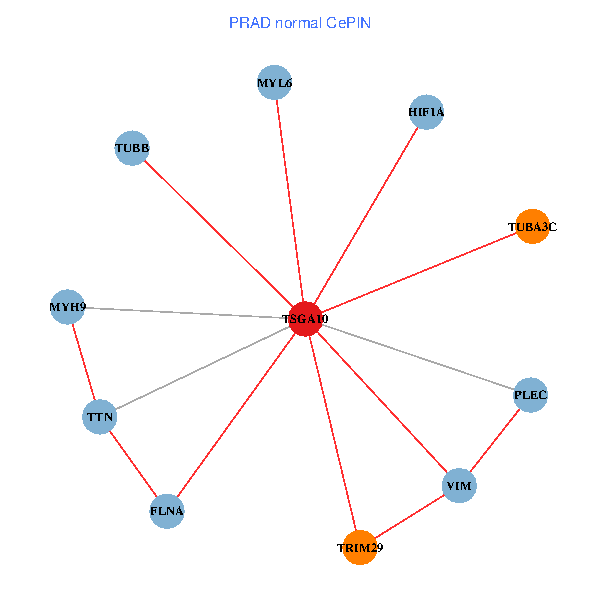
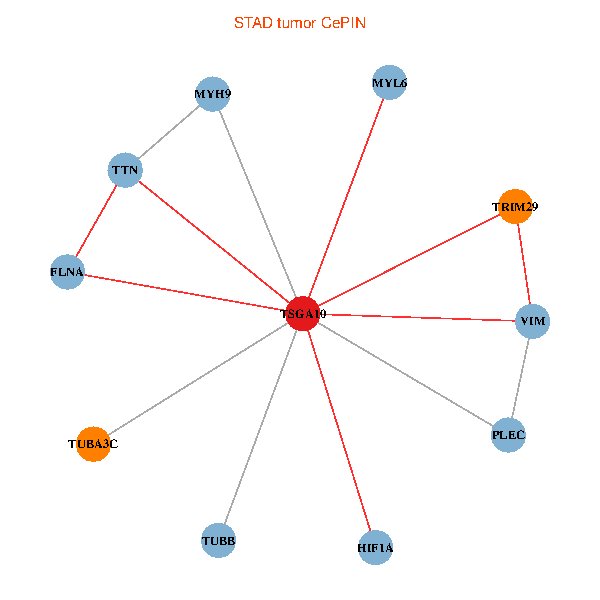
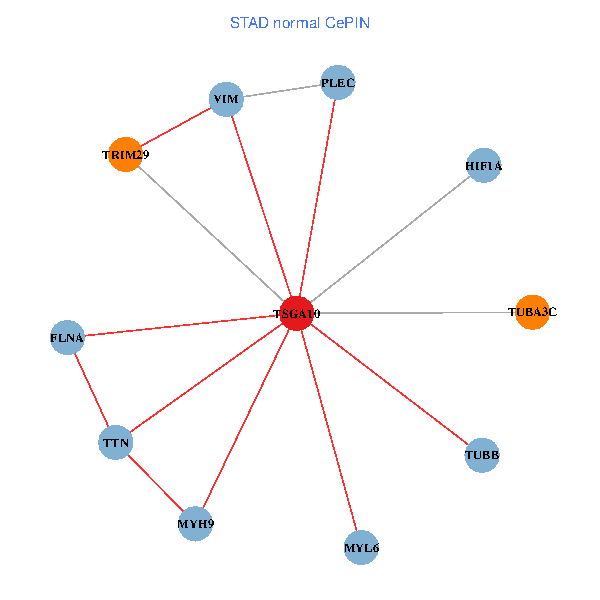
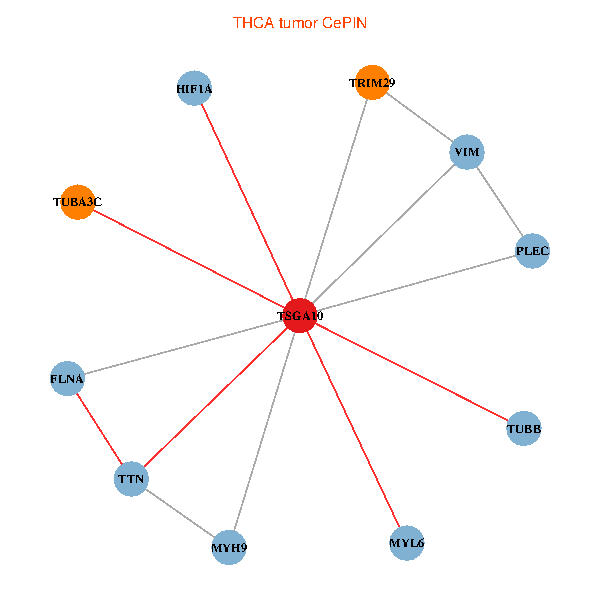
| Co-expressed gene networks based on protein-protein interaction data (CePIN) (TCGA IlluminaHiSeq_RNASeqV2, pan-cancer normalized log2(norm_counts+1) data, version 2016-08-16) (PINA2 ppi data) |
| BRCA (tumor) | BRCA (normal) |
| TSGA10, FLNA, HIF1A, MYL6, TRIM29, TUBB, MYH9, TTN, VIM, TUBA3C, PLEC (tumor) | TSGA10, FLNA, HIF1A, MYL6, TRIM29, TUBB, MYH9, TTN, VIM, TUBA3C, PLEC (normal) |
 |  |
| COAD (tumor) | COAD (normal) |
| TSGA10, FLNA, HIF1A, MYL6, TRIM29, TUBB, MYH9, TTN, VIM, TUBA3C, PLEC (tumor) | TSGA10, FLNA, HIF1A, MYL6, TRIM29, TUBB, MYH9, TTN, VIM, TUBA3C, PLEC (normal) |
 |  |
| HNSC (tumor) | HNSC (normal) |
| TSGA10, FLNA, HIF1A, MYL6, TRIM29, TUBB, MYH9, TTN, VIM, TUBA3C, PLEC (tumor) | TSGA10, FLNA, HIF1A, MYL6, TRIM29, TUBB, MYH9, TTN, VIM, TUBA3C, PLEC (normal) |
 |  |
| KICH (tumor) | KICH (normal) |
| TSGA10, FLNA, HIF1A, MYL6, TRIM29, TUBB, MYH9, TTN, VIM, TUBA3C, PLEC (tumor) | TSGA10, FLNA, HIF1A, MYL6, TRIM29, TUBB, MYH9, TTN, VIM, TUBA3C, PLEC (normal) |
 |  |
| KIRC (tumor) | KIRC (normal) |
| TSGA10, FLNA, HIF1A, MYL6, TRIM29, TUBB, MYH9, TTN, VIM, TUBA3C, PLEC (tumor) | TSGA10, FLNA, HIF1A, MYL6, TRIM29, TUBB, MYH9, TTN, VIM, TUBA3C, PLEC (normal) |
 |  |
| KIRP (tumor) | KIRP (normal) |
| TSGA10, FLNA, HIF1A, MYL6, TRIM29, TUBB, MYH9, TTN, VIM, TUBA3C, PLEC (tumor) | TSGA10, FLNA, HIF1A, MYL6, TRIM29, TUBB, MYH9, TTN, VIM, TUBA3C, PLEC (normal) |
 |  |
| LIHC (tumor) | LIHC (normal) |
| TSGA10, FLNA, HIF1A, MYL6, TRIM29, TUBB, MYH9, TTN, VIM, TUBA3C, PLEC (tumor) | TSGA10, FLNA, HIF1A, MYL6, TRIM29, TUBB, MYH9, TTN, VIM, TUBA3C, PLEC (normal) |
 |  |
| LUAD (tumor) | LUAD (normal) |
| TSGA10, FLNA, HIF1A, MYL6, TRIM29, TUBB, MYH9, TTN, VIM, TUBA3C, PLEC (tumor) | TSGA10, FLNA, HIF1A, MYL6, TRIM29, TUBB, MYH9, TTN, VIM, TUBA3C, PLEC (normal) |
 |  |
| LUSC (tumor) | LUSC (normal) |
| TSGA10, FLNA, HIF1A, MYL6, TRIM29, TUBB, MYH9, TTN, VIM, TUBA3C, PLEC (tumor) | TSGA10, FLNA, HIF1A, MYL6, TRIM29, TUBB, MYH9, TTN, VIM, TUBA3C, PLEC (normal) |
 |  |
| PRAD (tumor) | PRAD (normal) |
| TSGA10, FLNA, HIF1A, MYL6, TRIM29, TUBB, MYH9, TTN, VIM, TUBA3C, PLEC (tumor) | TSGA10, FLNA, HIF1A, MYL6, TRIM29, TUBB, MYH9, TTN, VIM, TUBA3C, PLEC (normal) |
 |  |
| STAD (tumor) | STAD (normal) |
| TSGA10, FLNA, HIF1A, MYL6, TRIM29, TUBB, MYH9, TTN, VIM, TUBA3C, PLEC (tumor) | TSGA10, FLNA, HIF1A, MYL6, TRIM29, TUBB, MYH9, TTN, VIM, TUBA3C, PLEC (normal) |
 |  |
| THCA (tumor) | THCA (normal) |
| TSGA10, FLNA, HIF1A, MYL6, TRIM29, TUBB, MYH9, TTN, VIM, TUBA3C, PLEC (tumor) | TSGA10, FLNA, HIF1A, MYL6, TRIM29, TUBB, MYH9, TTN, VIM, TUBA3C, PLEC (normal) |
 |  |
| Top |
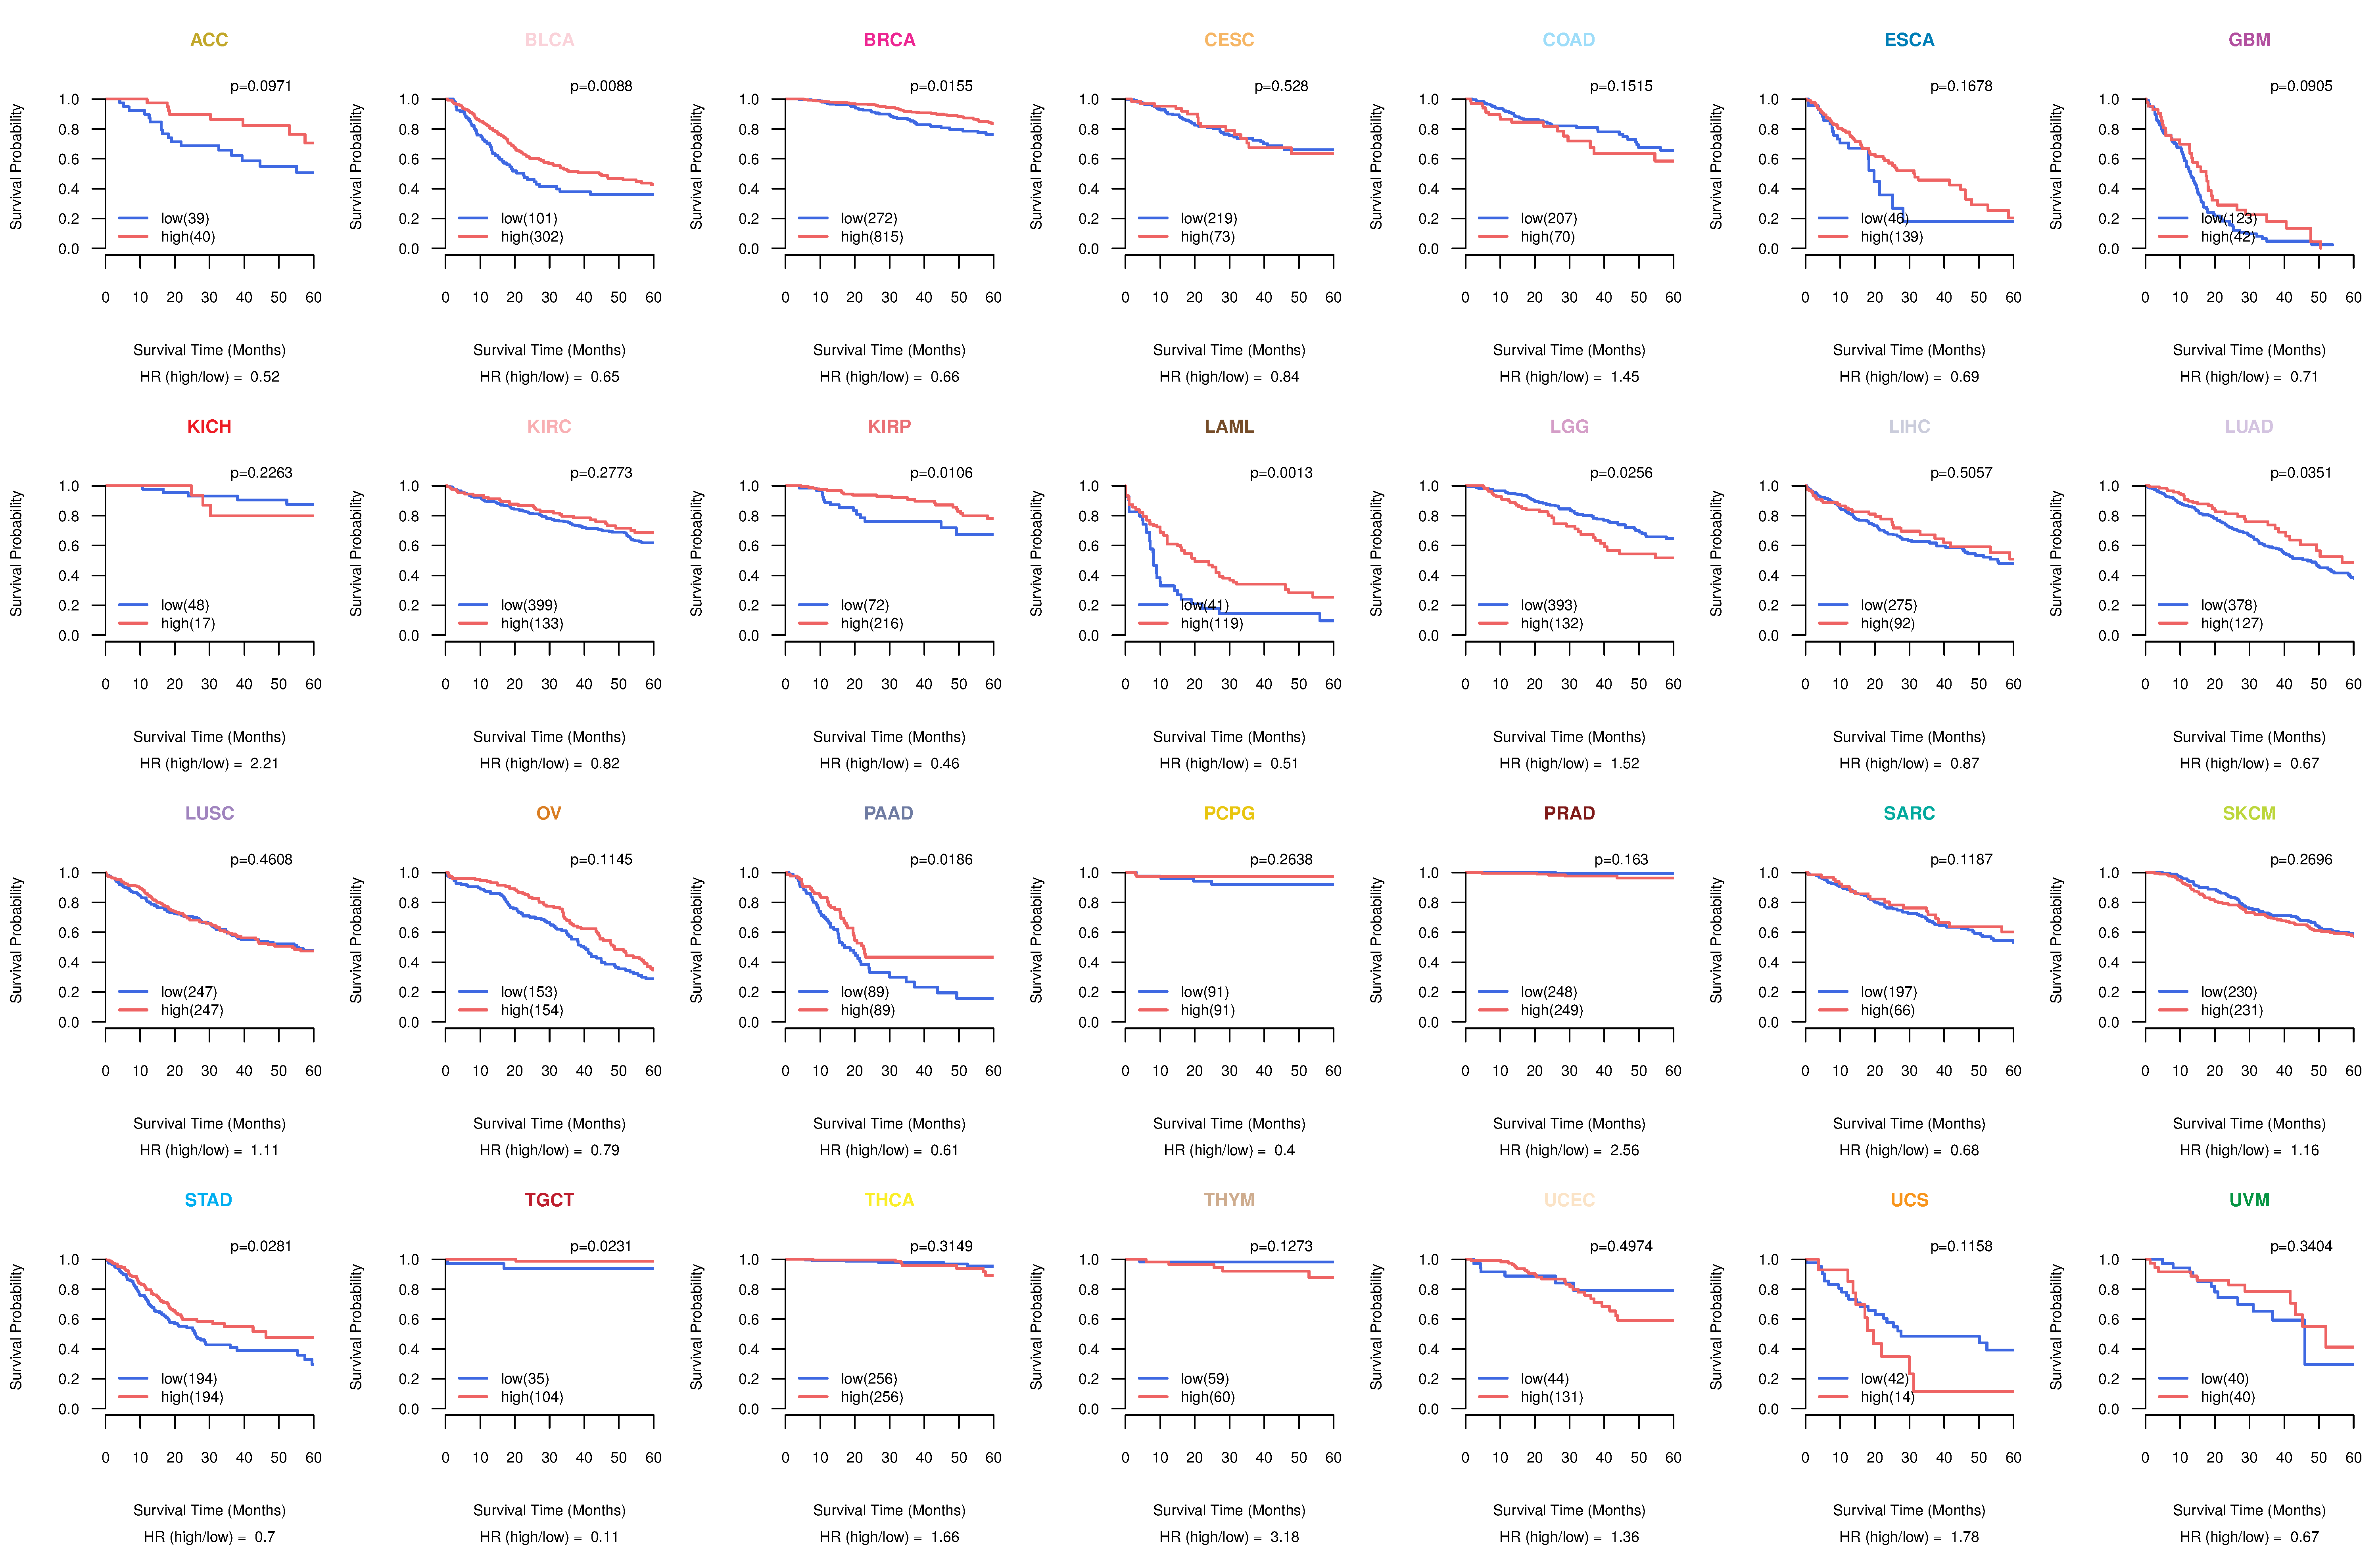
| TissGeneProg for TSGA10 |
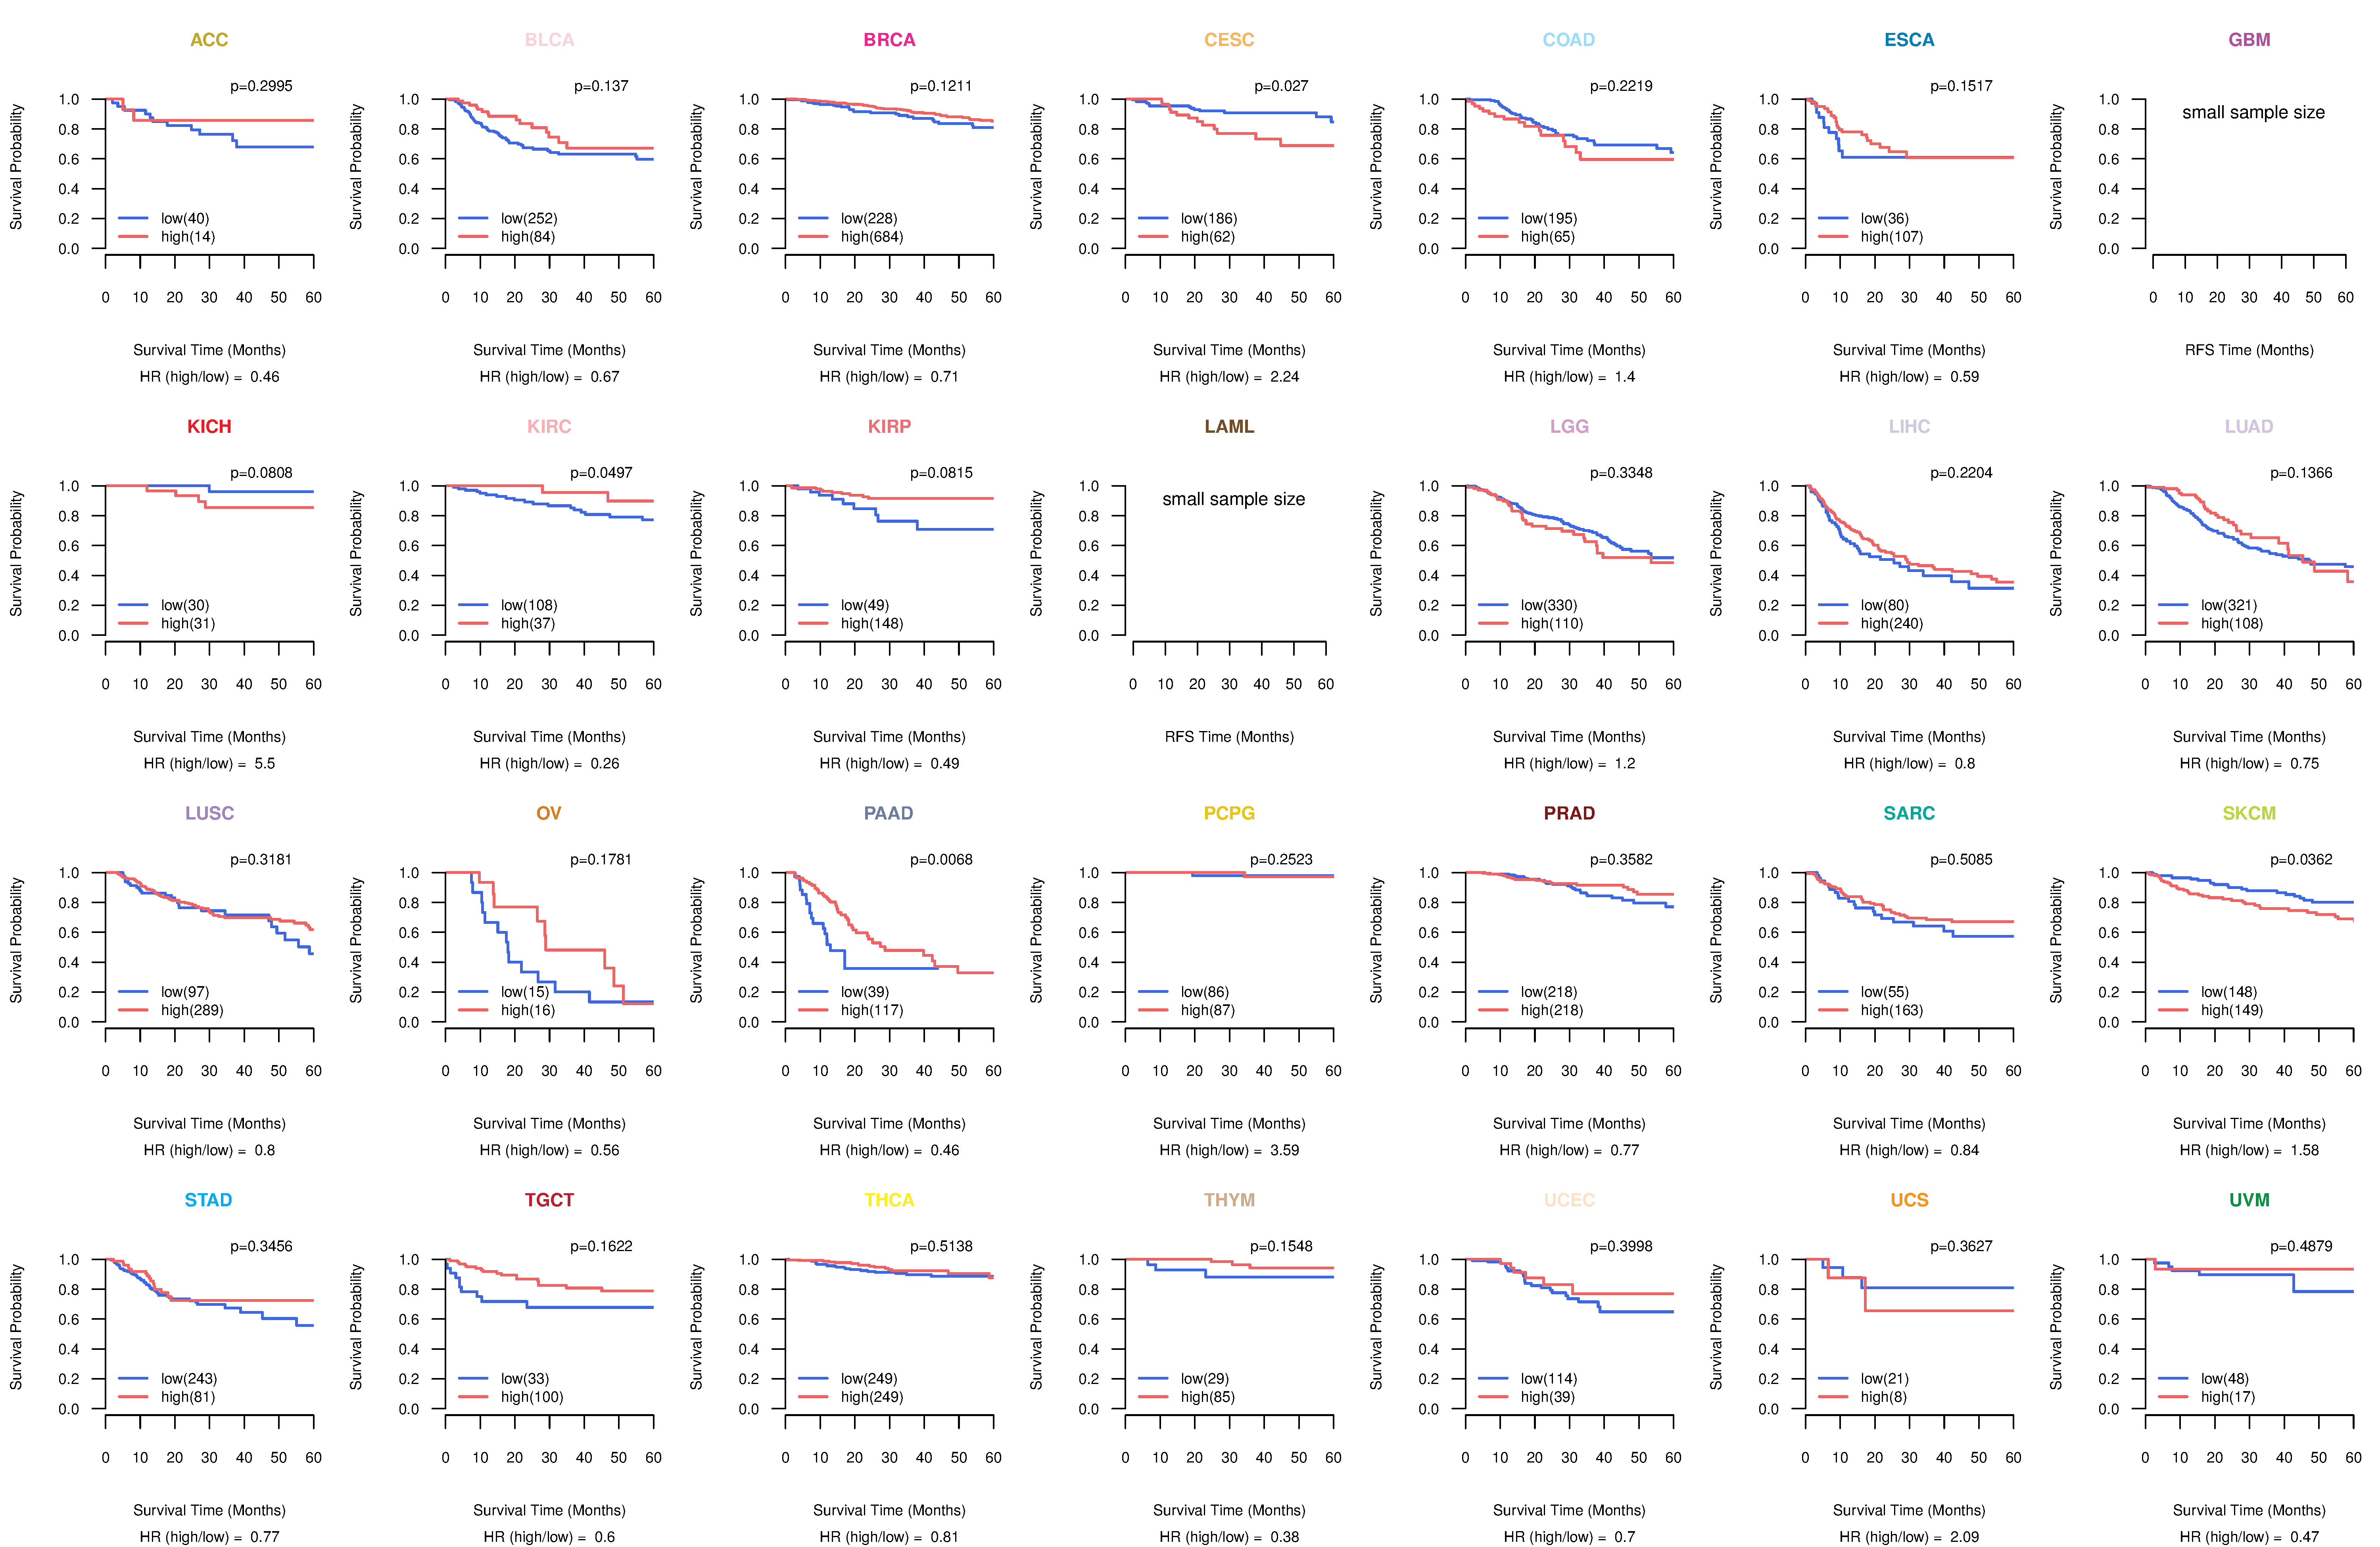
| Kaplan-Meier plots with logrank tests of overall survival (OS) using 28 cancer types (TCGA IlluminaHiSeq_RNASeqV2, pan-cancer normalized log2(norm_counts+1) data, version 2016-08-16) (TCGA clinicalMatrix, phenotype data, version 2016-04-27) * Click on the image to enlarge it in a new window. |
 |
| Kaplan-Meier plots with logrank test of relapse free survival (RFS) using 28 cancer types (TCGA IlluminaHiSeq_RNASeqV2, pan-cancer normalized log2(norm_counts+1) data, version 2016-08-16) (TCGA clinicalMatrix, phenotype data, version 2016-04-27) * Click on the image enlarge it in a new window. |
 |
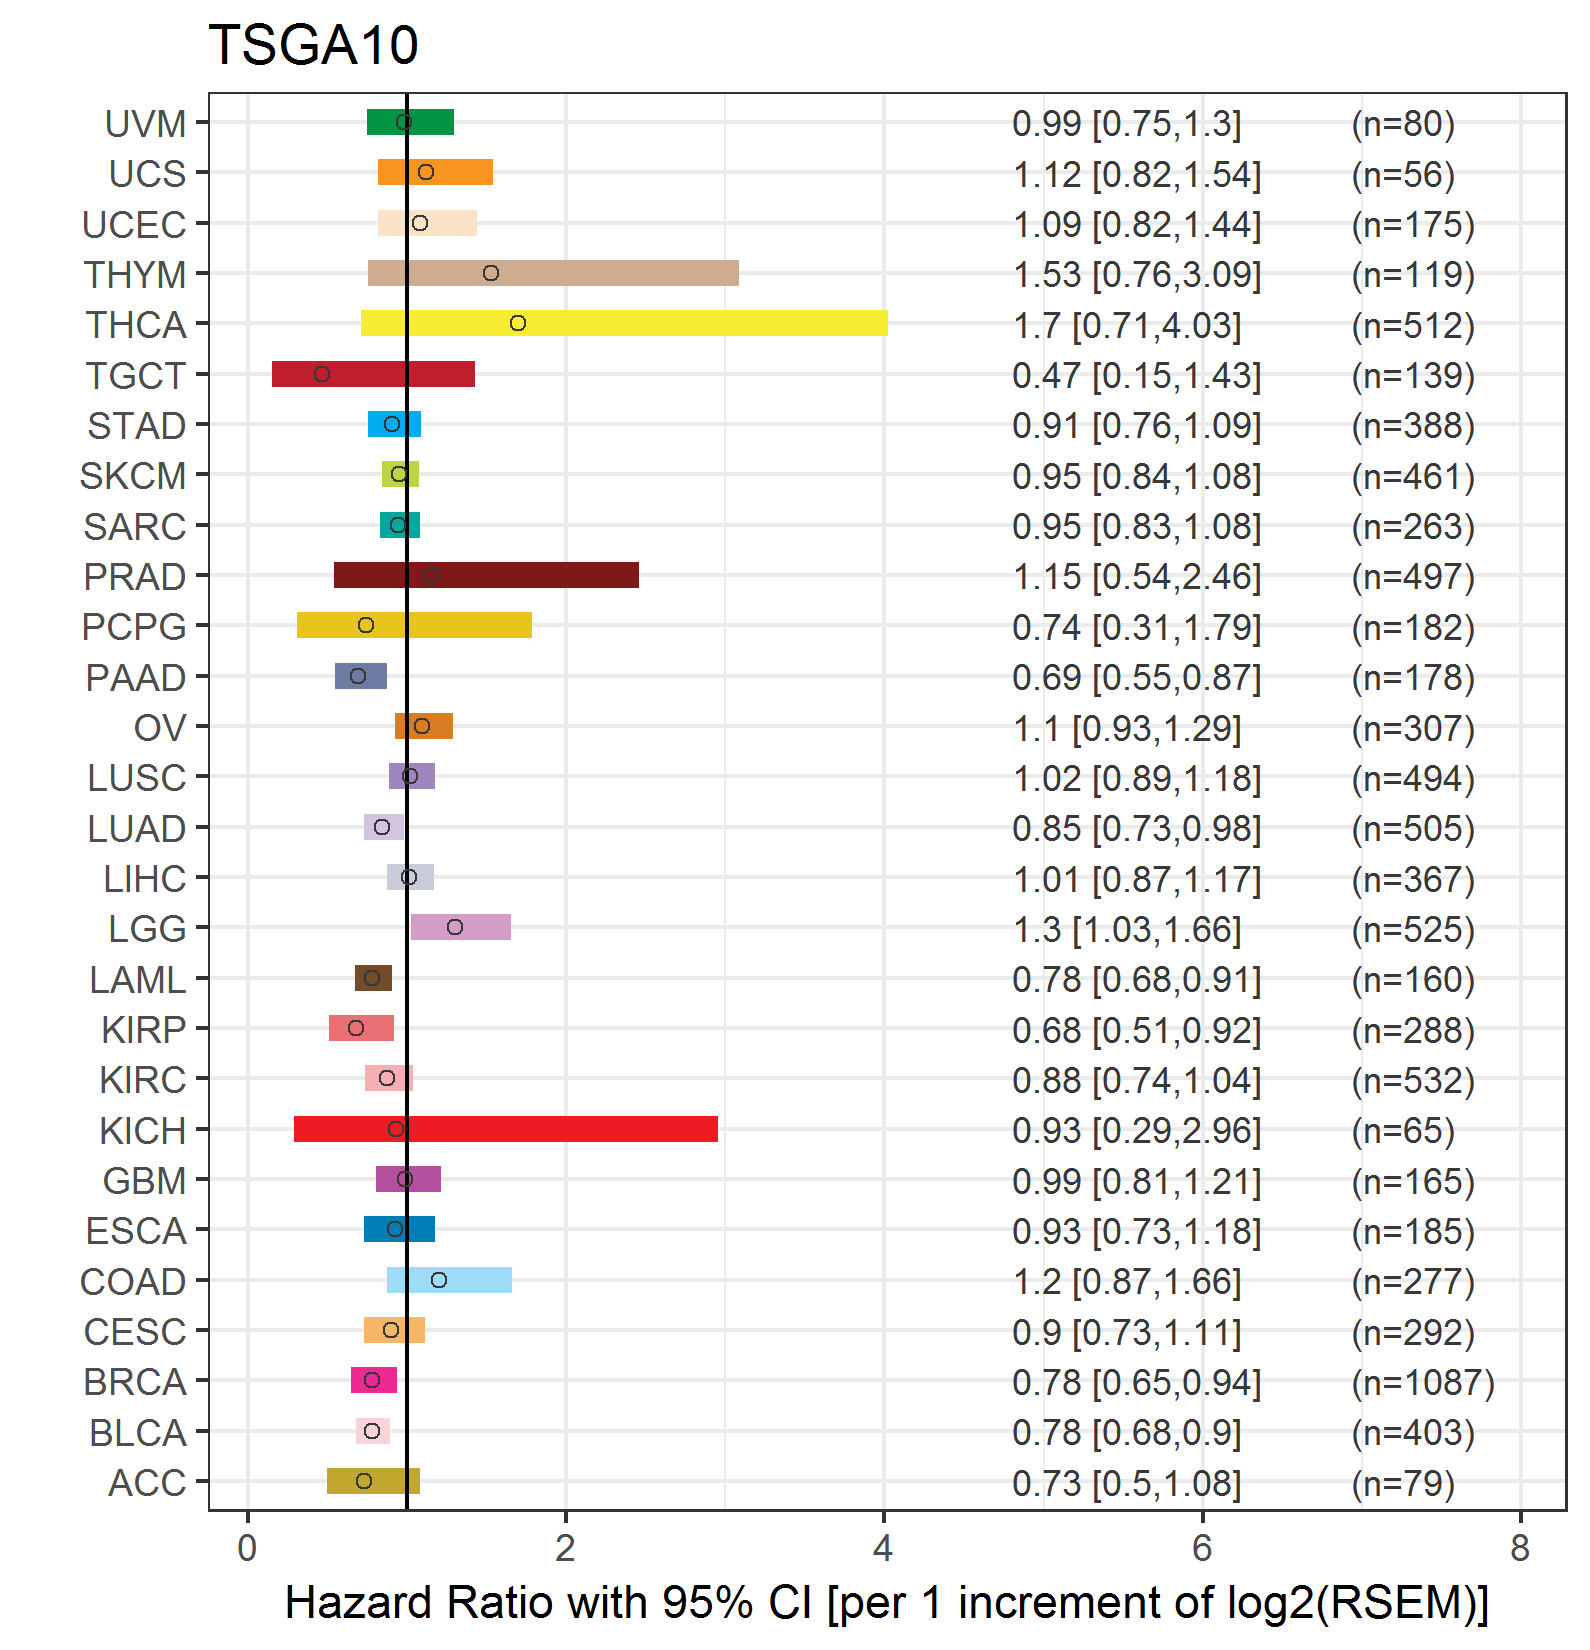
| Forest plot of Cox proportional hazard ratio (HR) and 95% CI of overall survival (OS) using 28 cancer types (TCGA IlluminaHiSeq_RNASeqV2, pan-cancer normalized log2(norm_counts+1) data, version 2016-08-16) (TCGA clinicalMatrix, phenotype data, version 2016-04-27) * Click on the image enlarge it in a new window. |
 |
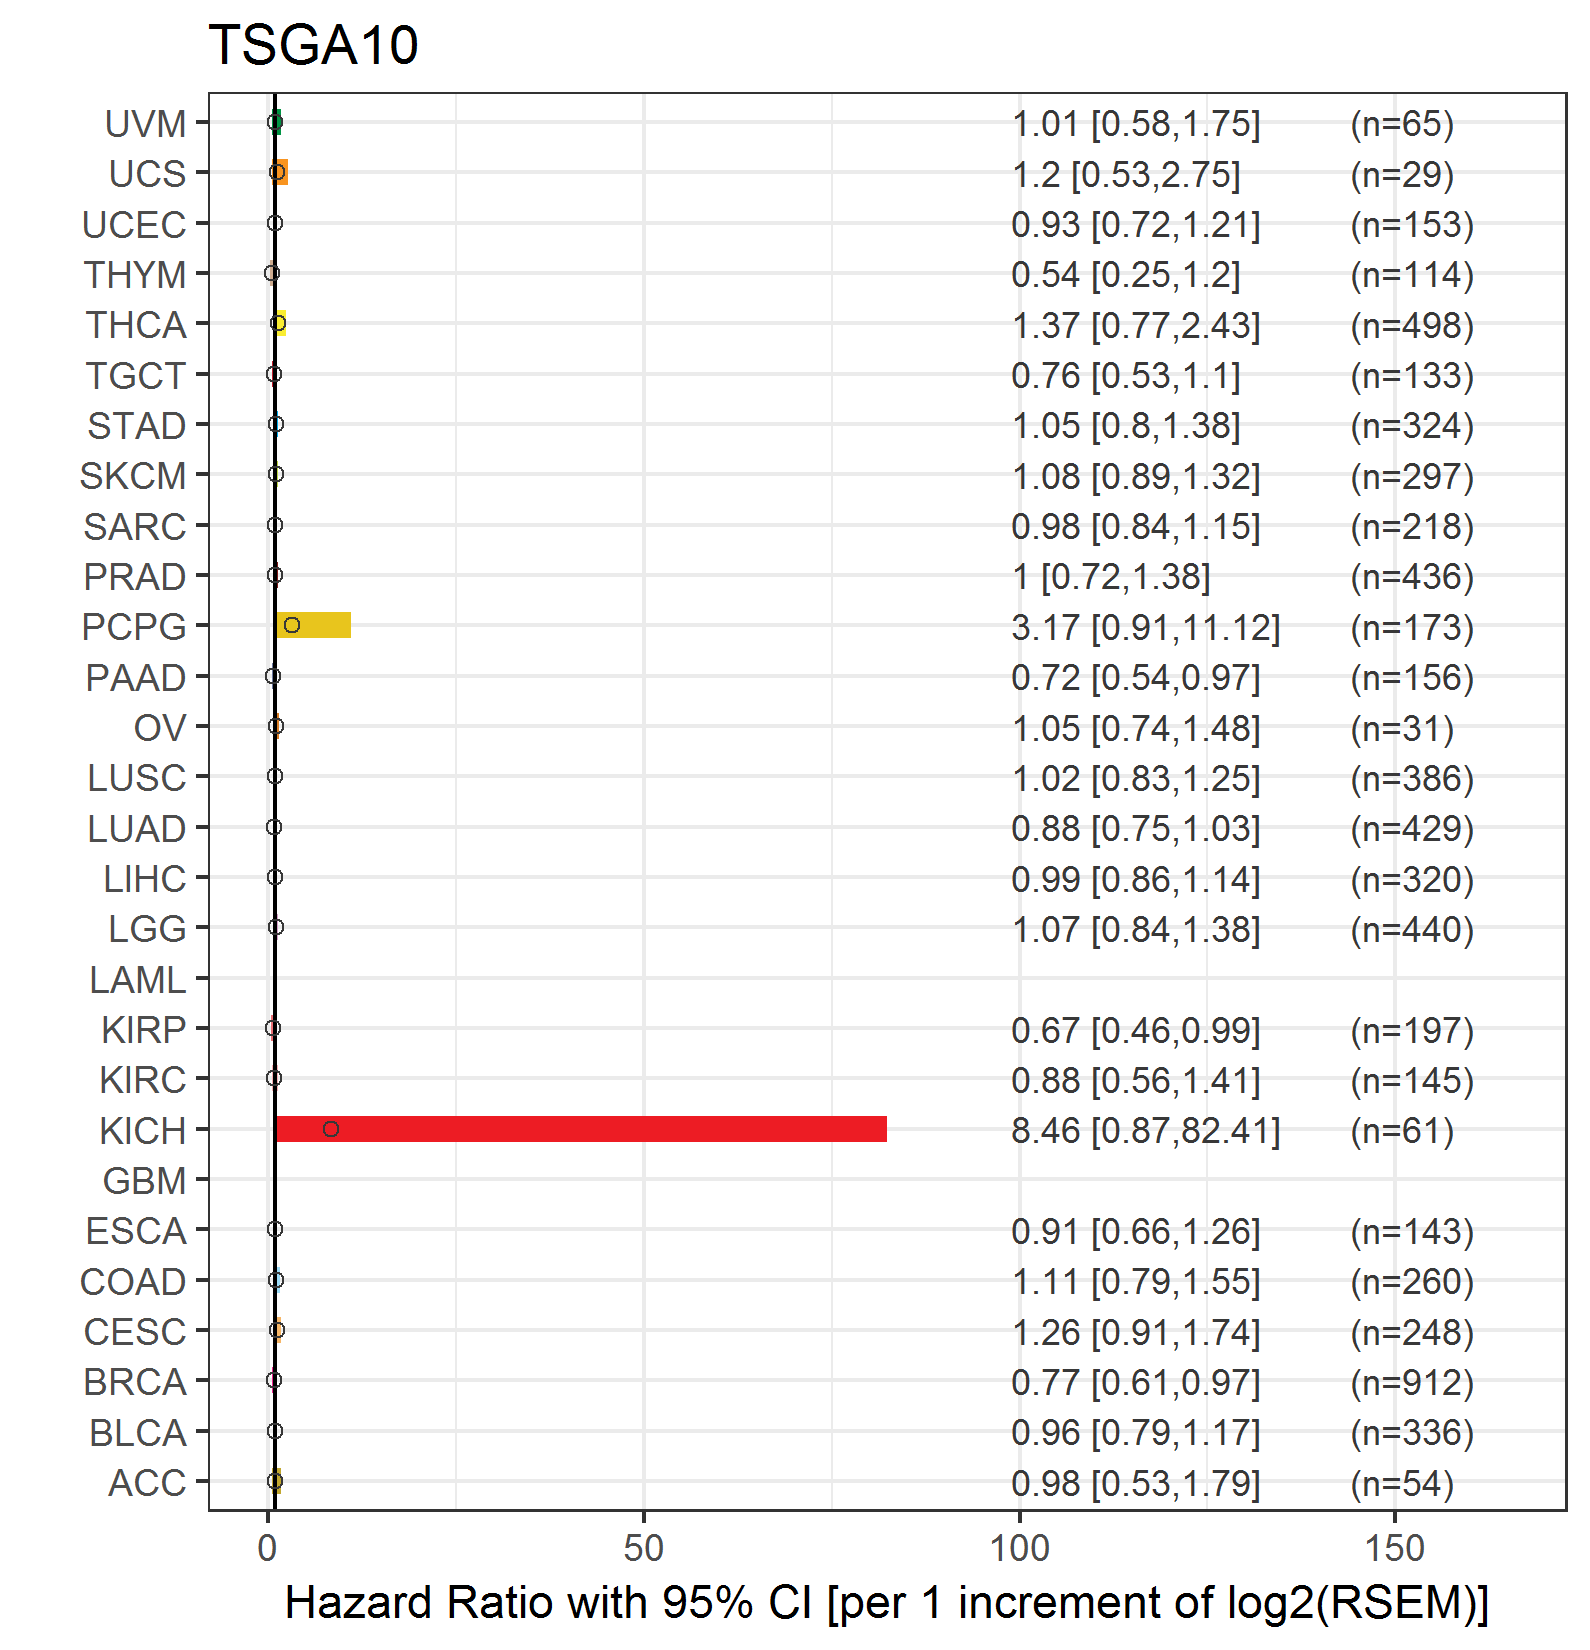
| Forest plot of Cox proportional hazard ratio (HR) and 95% CI of relapse free survival (RFS) using 28 cancer types (TCGA IlluminaHiSeq_RNASeqV2, pan-cancer normalized log2(norm_counts+1) data, version 2016-08-16) (TCGA clinicalMatrix, phenotype data, version 2016-04-27) * Click on the image enlarge it in a new window. |
 |
| Top |
| TissGeneClin for TSGA10 |
| TissGeneDrug for TSGA10 |
| Drug information targeting TissGene (DrugBank Version 5.0.6, 2017-04-01) |
| DrugBank ID | Drug name | Drug activity | Drug type | Drug status |
| Top |
| TissGeneDisease for TSGA10 |
| Disease information associated with TissGene (DisGeNet, 2016-06-01) |
| Disease ID | Disease name | # pubmeds | Source |
| umls:C0005695 | Bladder Neoplasm | 1 | LHGDN |
| umls:C0009375 | Colonic Neoplasms | 1 | LHGDN |
| umls:C0023418 | leukemia | 1 | BeFree |
| umls:C0023449 | Acute lymphocytic leukemia | 1 | BeFree |
| umls:C0025202 | melanoma | 1 | LHGDN |
| umls:C0033578 | Prostatic Neoplasms | 1 | LHGDN |
| umls:C0085669 | Acute leukemia | 1 | BeFree |
| umls:C0242596 | Neoplasm, Residual | 1 | BeFree |
| umls:C0376544 | Hematopoietic Neoplasms | 1 | BeFree |
| umls:C0919267 | ovarian neoplasm | 1 | LHGDN |
| umls:C1961102 | Precursor Cell Lymphoblastic Leukemia Lymphoma | 1 | BeFree,LHGDN |
| umls:C2239176 | Liver carcinoma | 1 | BeFree,LHGDN |
|
Copyright 2016-Present - The University of Texas Health Science Center at Houston (UTHealth) Web File Viewing | How to Report, Fraud, Waste and Abuse | State of Texas | Statewide Search | Texas Homeland Security | Site Policies |