 |
| |
| |
| |
| |
| |
| |
|

| TissGeneSummary for TAS1R1 |
 Gene summary Gene summary |
| Basic gene information | Gene symbol | TAS1R1 |
| Gene name | taste receptor, type 1, member 1 | |
| Synonyms | GPR70|T1R1|TR1 | |
| Cytomap | UCSC genome browser: 1p36.23 | |
| Type of gene | protein-coding | |
| RefGenes | NM_138697.3, NM_177540.2,NM_177539.1,NM_177541.1, | |
| Description | G protein-coupled receptor 70G-protein coupled receptor 70seven transmembrane helix receptortaste receptor type 1 member 1 | |
| Modification date | 20141207 | |
| dbXrefs | MIM : 606225 | |
| HGNC : HGNC | ||
| Ensembl : ENSG00000173662 | ||
| HPRD : 06939 | ||
| Vega : OTTHUMG00000001441 | ||
| Protein | UniProt: go to UniProt's Cross Reference DB Table | |
| Expression | CleanEX: HS_TAS1R1 | |
| BioGPS: 80835 | ||
| Pathway | NCI Pathway Interaction Database: TAS1R1 | |
| KEGG: TAS1R1 | ||
| REACTOME: TAS1R1 | ||
| Pathway Commons: TAS1R1 | ||
| Context | iHOP: TAS1R1 | |
| ligand binding site mutation search in PubMed: TAS1R1 | ||
| UCL Cancer Institute: TAS1R1 | ||
| Assigned class in TissGDB* | C | |
| Included tissue-specific gene expression resources | HPA,GTEx | |
| Specific-tissues in normal samples (assigned by TissGDB using HPA, TiGER, and GTEx) | Testis | |
| Cancer types related to the specific-tissues in cancer samples (assigned by TissGDB using TCGA) | TGCT | |
| Reference showing the relevant tissue of TAS1R1 | ||
| Description by TissGene annotations | Fused withTSGene | |
| * Class A consists of genes with literature evidence and is part of the cTissGenes. Class B consists of only cTissGenes without additional evidence. The remaining genes belong to Class C. |
| Gene ontology having evidence of Inferred from Direct Assay (IDA) from Entrez |
| GO ID | GO term | PubMed ID | GO:0050912 | detection of chemical stimulus involved in sensory perception of taste | 11917125 | GO:0050917 | sensory perception of umami taste | 11917125 | GO:0050912 | detection of chemical stimulus involved in sensory perception of taste | 11917125 | GO:0050917 | sensory perception of umami taste | 11917125 |
| Top |
| TissGeneExp for TAS1R1 |
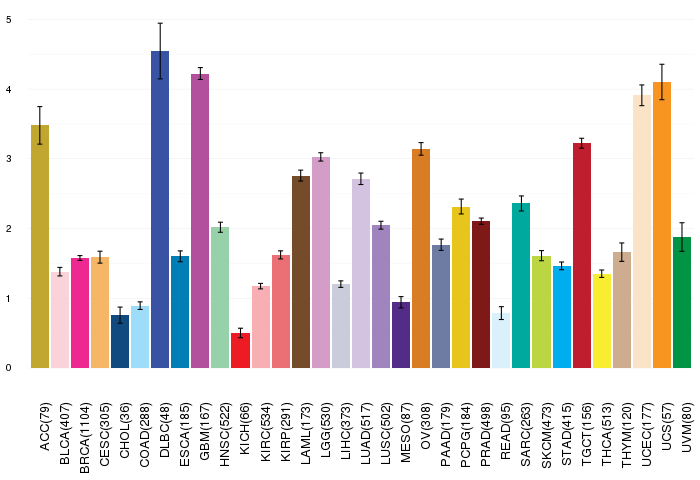
| Gene expressions across 28 cancer types (X-axis: cancer type and Y-axis: log2(norm_counts+1)) (TCGA IlluminaHiSeq_RNASeqV2, pan-cancer normalized log2(norm_counts+1) data, version 2016-08-16) |
 |
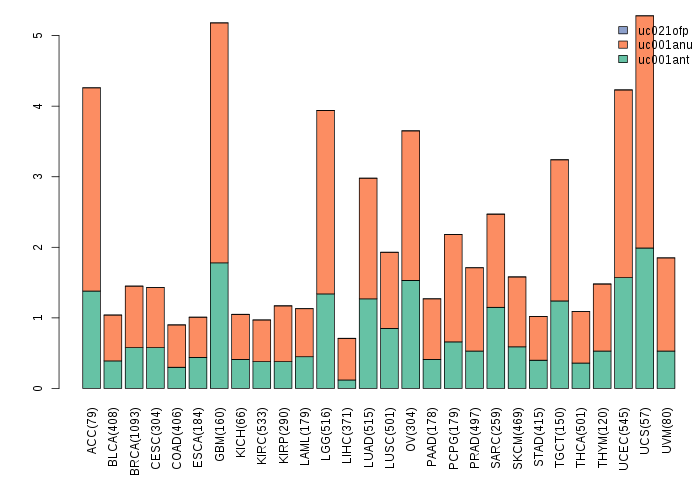
| Gene isoform expressions across 28 cancer types (X-axis: cancer type and Y-axis: log2(norm_counts+1)) (TCGA pan-cancer tcga_rsem_isoform_tpm, version 2016-09-01) |
 |
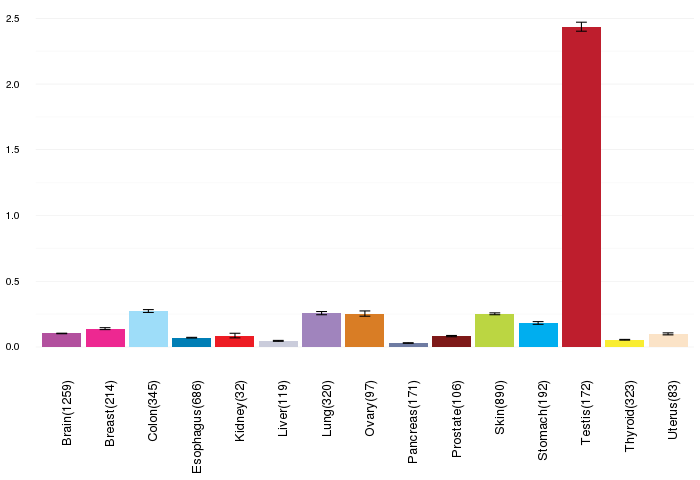
| Gene expressions across normal tissues of GTEx data (GTEx GTEx_Analysis_v6_RNA-seq_RNA-SeQCv1.1.8_gene_rpkm.gct) - Here, we shows the matched tissue types only among our 28 cancer types. |
 |
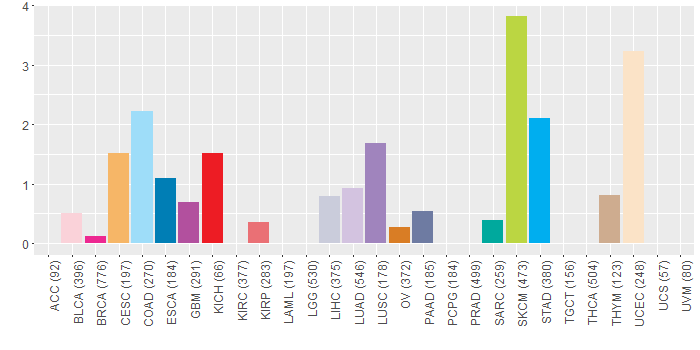
| Different expressions across 14 cancer types with more than 10 samples between matched tumors and normals (X-axis: cancer type and Y-axis: log2(norm_counts+1)) (TCGA IlluminaHiSeq_RNASeqV2, pan-cancer normalized log2(norm_counts+1) data, version 2016-08-16) |
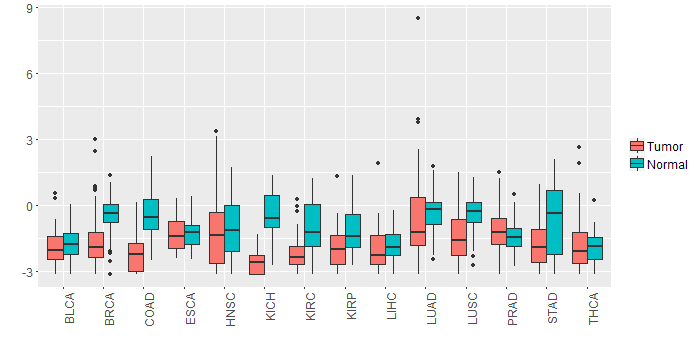 |
| - Significantly differentially expressed cancer types and information. (|Fold change|>1 and FDR<0.05) |
| Cancer type | Mean(exp) in tumor | Mean(exp) in matched normal | Log2FC | P-val. | FDR |
| COAD | -2.164399309 | -0.403514694 | -1.760884615 | 8.66E-09 | 7.84E-08 |
| KICH | -2.542406694 | -0.427846694 | -2.11456 | 1.16E-09 | 7.16E-09 |
| BRCA | -1.674169957 | -0.414900659 | -1.259269298 | 5.94E-18 | 3.66E-17 |
| KIRC | -2.180378583 | -0.957688305 | -1.222690278 | 3.68E-12 | 1.49E-11 |
| STAD | -1.686814694 | -0.660905319 | -1.025909375 | 0.00395 | 0.016035289 |
| Top |
| TissGene-miRNA for TAS1R1 |
| Significantly anti-correlated miRNAs of TissGene across 28 cancer types (Gene-miRNA relations from TargetScanHuman Relsease 7.1, Conserved_Site_Context_Scores.txt.zip, 06.01.2016) (TCGA IlluminaHiSeq_miRNASeq, log2(RPM+1) data, version 2016-11-21) (TCGA IlluminaHiSeq_RNASeqV2, log2(normalized_count+1) data, version 2016-08-16) (Spearman’s Rank Correlation (p-value<0.05 and coefficient<-0.25)) |
| Cancer type | miRNA id | miRNA accession | P-val. | Coeff. | # samples |
| Top |
| TissGeneMut for TAS1R1 |
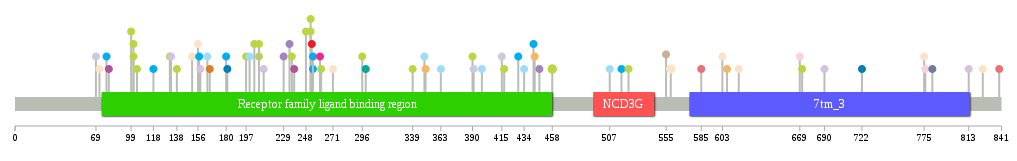
| TissGeneSNV for TAS1R1 |
| nsSNV counts per each loci. Different colors of circles represent different cancer types. Circle size denotes number of samples. (TCGA somatic mutation (SNPs and small INDELs) data, version 2016-04-25) * Click on the image to enlarge it in a new window. |
 |
 |
| Somatic nucleotide variants of TissGene across 28 cancer types (X-axis: cancer type and Y-axis: % of mutated samples) The numbers in parentheses are numbers of samples with mutation (nsSNVs). (TCGA somatic mutation (SNPs and small INDELs) data, version 2016-04-25) |
 |
| - nsSNVs sorted by frequency. |
| AAchange | Cancer type | # samples |
| p.G458E | SKCM | 2 |
| p.E758K | HNSC | 2 |
| p.F559L | UCEC | 2 |
| p.H417Y | SKCM | 1 |
| p.S447C | LUSC | 1 |
| p.W208* | SKCM | 1 |
| p.G585S | KIRP | 1 |
| p.A157T | STAD | 1 |
| p.V118A | STAD | 1 |
| p.Q101* | SKCM | 1 |
| p.K228T | READ | 1 |
| p.W200C | COAD | 1 |
| p.D132N | SKCM | 1 |
| p.A775T | UCEC | 1 |
| p.L607F | CESC | 1 |
| p.M166I | OV | 1 |
| p.A636T | HNSC | 1 |
| p.R398H | COAD | 1 |
| p.Q181L | ESCA | 1 |
| p.G363D | COAD | 1 |
| p.G839S | KIRP | 1 |
| p.R652H | DLBC | 1 |
| p.F517S | STAD | 1 |
| p.R415* | LIHC | 1 |
| p.G72D | UCEC | 1 |
| p.H671Y | SKCM | 1 |
| p.A299T | SARC | 1 |
| p.G99R | SKCM | 1 |
| p.S212T | LUAD | 1 |
| p.Y813* | LUAD | 1 |
| p.Y390C | SKCM | 1 |
| p.R350K | CESC | 1 |
| p.V271M | HNSC | 1 |
| p.V164M | COAD | 1 |
| p.E197K | SKCM | 1 |
| p.A78T | STAD | 1 |
| p.G252S | SKCM | 1 |
| p.A156V | UCEC | 1 |
| p.D104N | SKCM | 1 |
| p.R349C | COAD | 1 |
| p.R261P | SKCM | 1 |
| p.W208X | SKCM | 1 |
| p.R391Q | LIHC | 1 |
| p.Q101X | SKCM | 1 |
| p.G236R | SKCM | 1 |
| p.L133F | LUAD | 1 |
| p.G523E | SKCM | 1 |
| p.F776L | BLCA | 1 |
| p.G234V | LUSC | 1 |
| p.R443H | CESC | 1 |
| p.H429Y | STAD | 1 |
| p.A434T | COAD | 1 |
| p.C238Y | GBM | 1 |
| p.F669L | BLCA | 1 |
| p.R180W | STAD | 1 |
| p.E339K | SKCM | 1 |
| p.E825* | UCEC | 1 |
| p.V296M | SKCM | 1 |
| p.S248F | SKCM | 1 |
| p.G617D | UCEC | 1 |
| p.A299T | HNSC | 1 |
| p.R151H | UCEC | 1 |
| p.E229K | LUSC | 1 |
| p.R603S | UCEC | 1 |
| p.G252D | SKCM | 1 |
| p.G204E | SKCM | 1 |
| p.R80W | GBM | 1 |
| p.R555H | THYM | 1 |
| p.E722Q | HNSC | 1 |
| p.P138S | SKCM | 1 |
| p.N442S | STAD | 1 |
| p.L158Q | LUAD | 1 |
| p.N69I | LIHC | 1 |
| p.E254X | STAD | 1 |
| p.E254* | STAD | 1 |
| p.V271M | UCEC | 1 |
| p.E722D | ESCA | 1 |
| p.V782I | PAAD | 1 |
| p.R535T | HNSC | 1 |
| p.Q690K | LUAD | 1 |
| p.M260V | BRCA | 1 |
| p.C507F | COAD | 1 |
| p.D253N | KICH | 1 |
| Top |
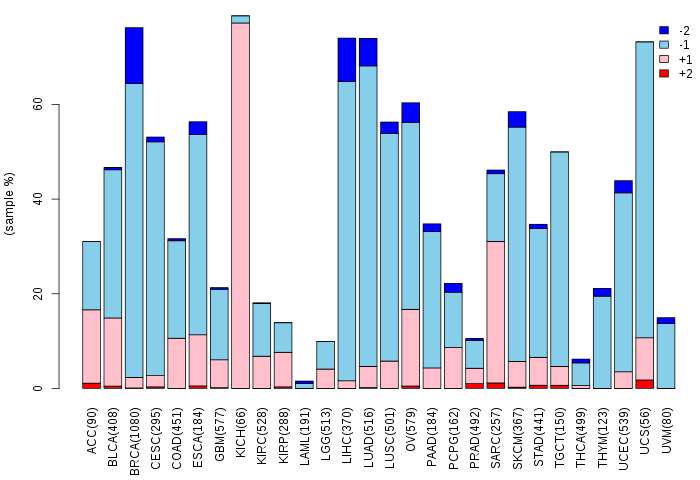
| TissGeneCNV for TAS1R1 |
| Copy number variations of TissGene across 28 cancer types (X-axis: cancer type and Y-axis: % of CNV samples) (TCGA Gistic2_CopyNumber_Gistic2_all_data_by_genes, Gistic2 copy number data, version 2016-08-16) |
 |
| Top |
| TissGeneFusions for TAS1R1 |
| Fusion genes including TissGene (ChimerDB 3.0, 2016-12-01 and TCGA fusion Portal 2015-12-01) |
| Database | Src | Cancer type | Sample | Fusion gene | ORF | 5'-gene BP | 3'-gene BP |
| Chimerdb3.0 | TopHat-Fusion | SARC | TCGA-DX-A7EU-01A | ENO1-TAS1R1 | In-Frame | chr1:8928046 | chr1:6639101 |
| TCGAfusionPortal | PRADA | BRCA | TCGA-D8-A1XK-01A | ZBTB48-TAS1R1 | In-frame | Chr1:6648904 | Chr1:6637010 |
| Top |
| TissGeneNet for TAS1R1 |
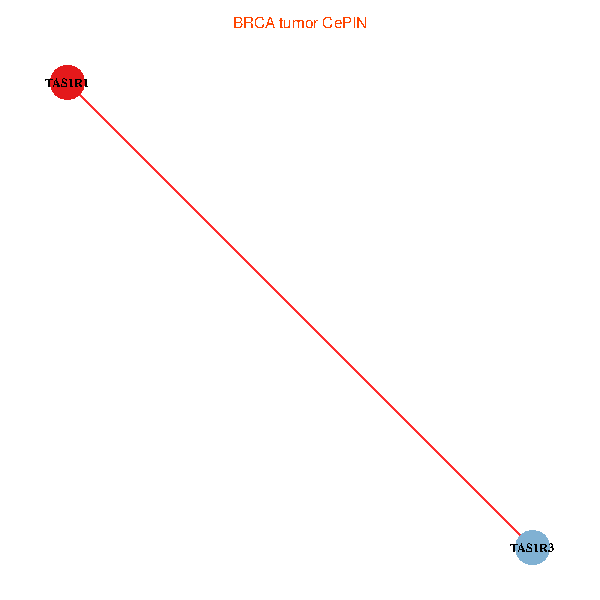
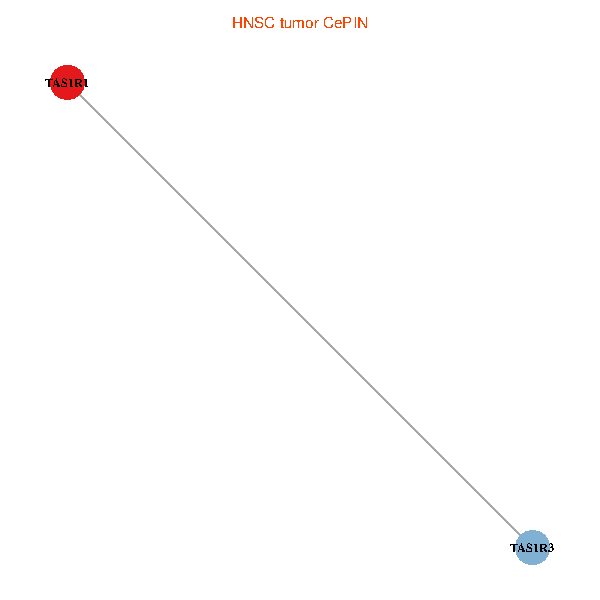
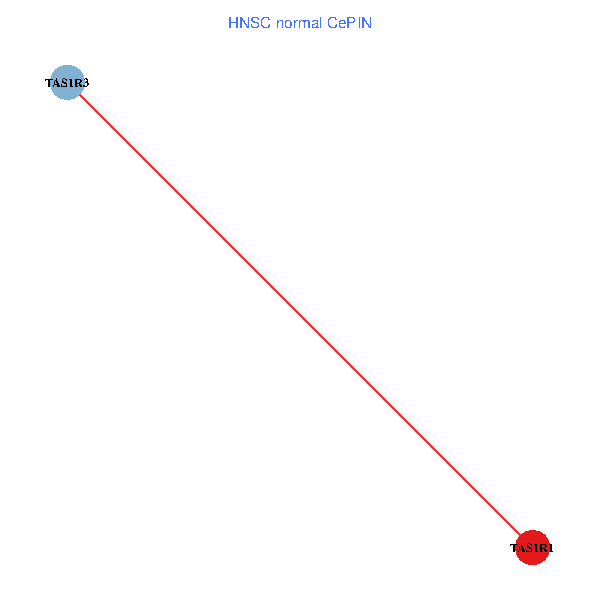
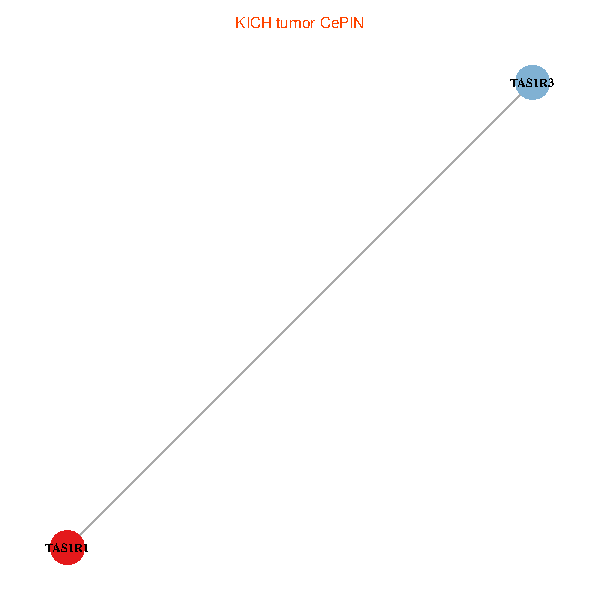
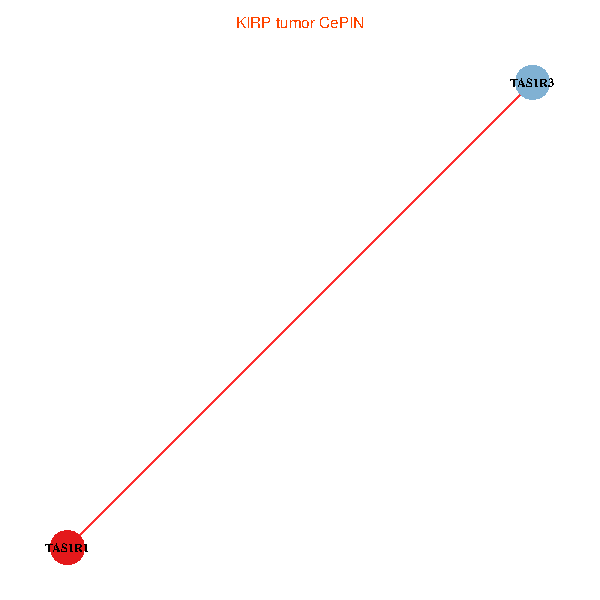
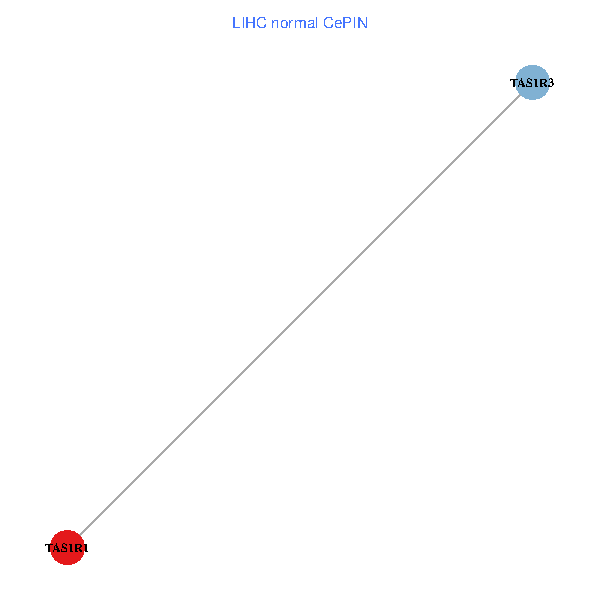
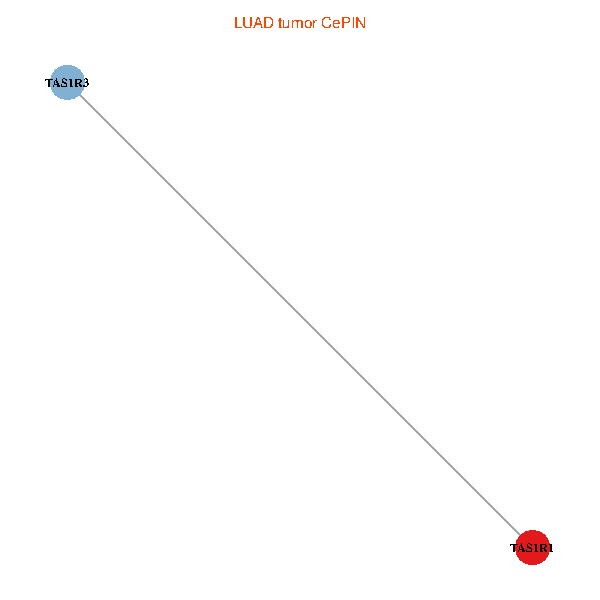
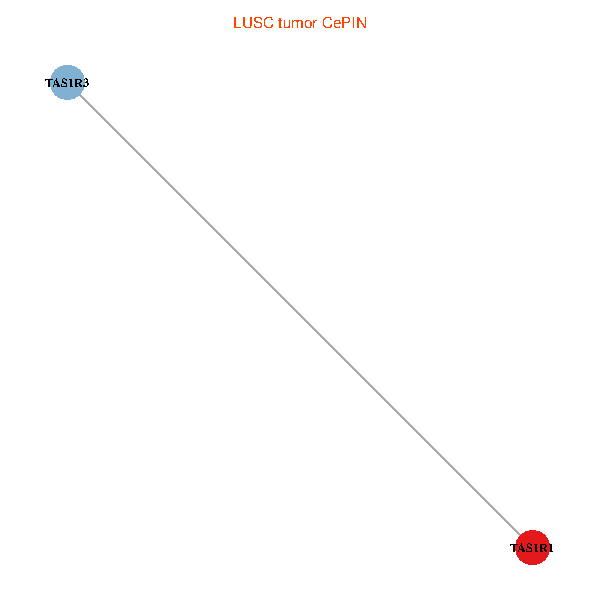
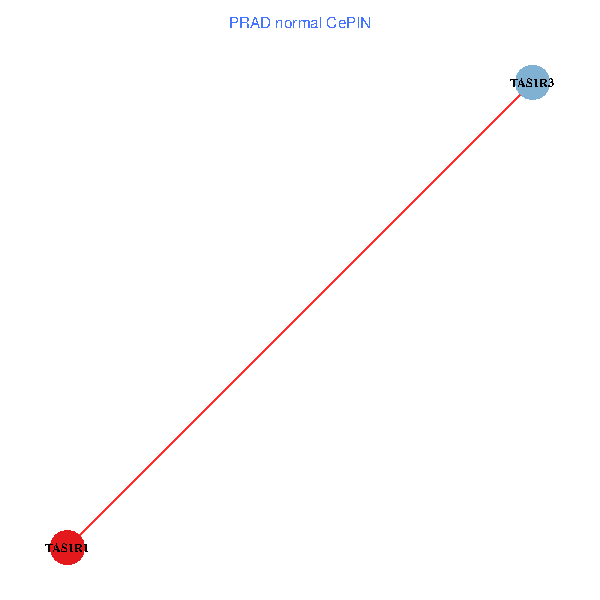
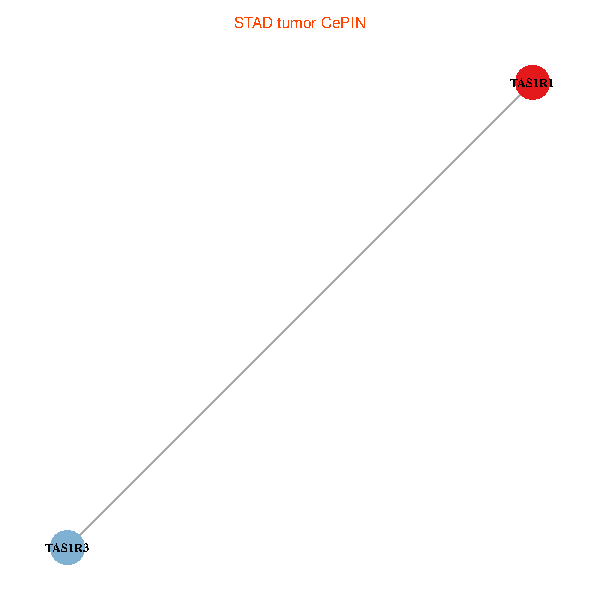
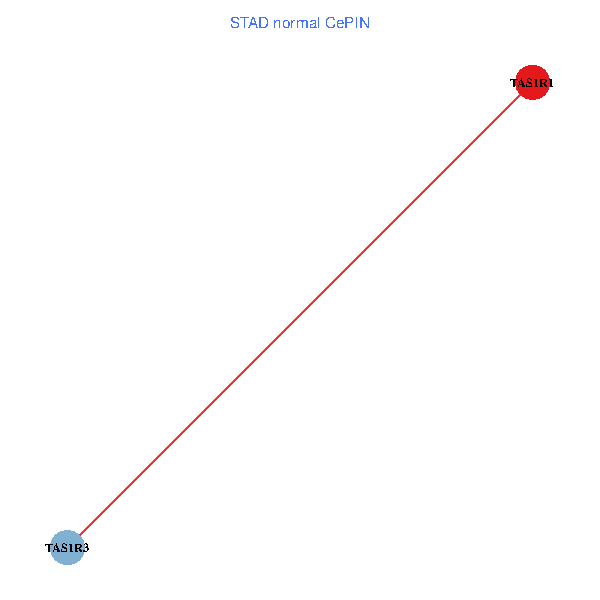
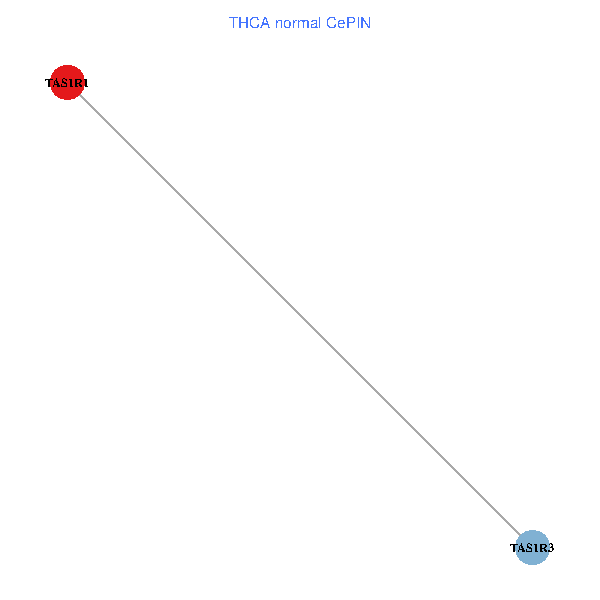
| Co-expressed gene networks based on protein-protein interaction data (CePIN) (TCGA IlluminaHiSeq_RNASeqV2, pan-cancer normalized log2(norm_counts+1) data, version 2016-08-16) (PINA2 ppi data) |
| BRCA (tumor) | BRCA (normal) |
| TAS1R1, TAS1R3 (tumor) | TAS1R1, TAS1R3 (normal) |
 |  |
| COAD (tumor) | COAD (normal) |
| TAS1R1, TAS1R3 (tumor) | TAS1R1, TAS1R3 (normal) |
 |  |
| HNSC (tumor) | HNSC (normal) |
| TAS1R1, TAS1R3 (tumor) | TAS1R1, TAS1R3 (normal) |
 |  |
| KICH (tumor) | KICH (normal) |
| TAS1R1, TAS1R3 (tumor) | TAS1R1, TAS1R3 (normal) |
 |  |
| KIRC (tumor) | KIRC (normal) |
| TAS1R1, TAS1R3 (tumor) | TAS1R1, TAS1R3 (normal) |
 |  |
| KIRP (tumor) | KIRP (normal) |
| TAS1R1, TAS1R3 (tumor) | TAS1R1, TAS1R3 (normal) |
 |  |
| LIHC (tumor) | LIHC (normal) |
| TAS1R1, TAS1R3 (tumor) | TAS1R1, TAS1R3 (normal) |
 |  |
| LUAD (tumor) | LUAD (normal) |
| TAS1R1, TAS1R3 (tumor) | TAS1R1, TAS1R3 (normal) |
 |  |
| LUSC (tumor) | LUSC (normal) |
| TAS1R1, TAS1R3 (tumor) | TAS1R1, TAS1R3 (normal) |
 |  |
| PRAD (tumor) | PRAD (normal) |
| TAS1R1, TAS1R3 (tumor) | TAS1R1, TAS1R3 (normal) |
 |  |
| STAD (tumor) | STAD (normal) |
| TAS1R1, TAS1R3 (tumor) | TAS1R1, TAS1R3 (normal) |
 |  |
| THCA (tumor) | THCA (normal) |
| TAS1R1, TAS1R3 (tumor) | TAS1R1, TAS1R3 (normal) |
 |  |
| Top |
| TissGeneProg for TAS1R1 |
| Kaplan-Meier plots with logrank tests of overall survival (OS) using 28 cancer types (TCGA IlluminaHiSeq_RNASeqV2, pan-cancer normalized log2(norm_counts+1) data, version 2016-08-16) (TCGA clinicalMatrix, phenotype data, version 2016-04-27) * Click on the image to enlarge it in a new window. |
 |
| Kaplan-Meier plots with logrank test of relapse free survival (RFS) using 28 cancer types (TCGA IlluminaHiSeq_RNASeqV2, pan-cancer normalized log2(norm_counts+1) data, version 2016-08-16) (TCGA clinicalMatrix, phenotype data, version 2016-04-27) * Click on the image enlarge it in a new window. |
 |
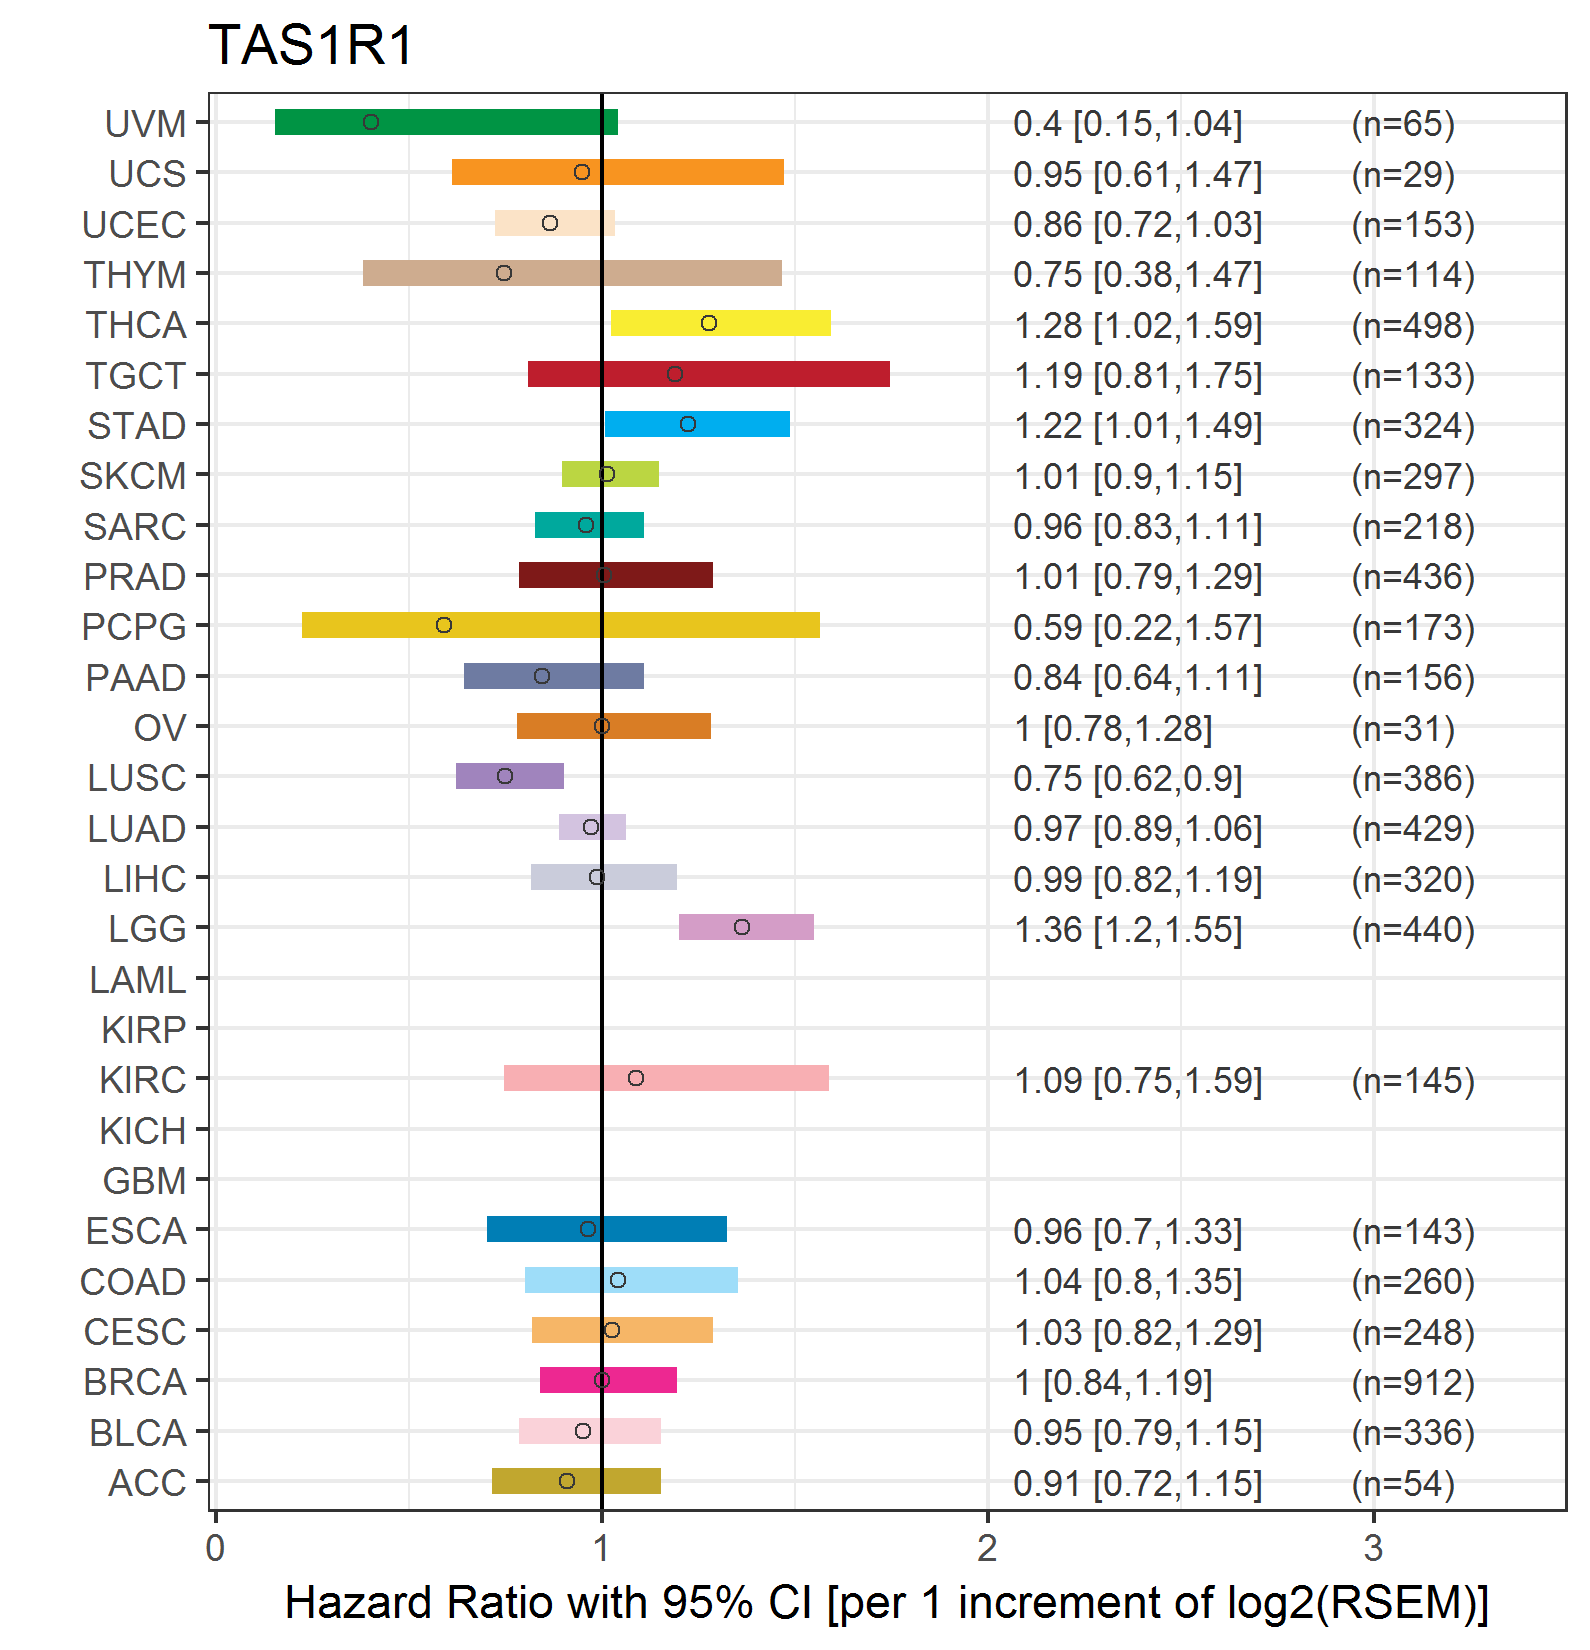
| Forest plot of Cox proportional hazard ratio (HR) and 95% CI of overall survival (OS) using 28 cancer types (TCGA IlluminaHiSeq_RNASeqV2, pan-cancer normalized log2(norm_counts+1) data, version 2016-08-16) (TCGA clinicalMatrix, phenotype data, version 2016-04-27) * Click on the image enlarge it in a new window. |
 |
| Forest plot of Cox proportional hazard ratio (HR) and 95% CI of relapse free survival (RFS) using 28 cancer types (TCGA IlluminaHiSeq_RNASeqV2, pan-cancer normalized log2(norm_counts+1) data, version 2016-08-16) (TCGA clinicalMatrix, phenotype data, version 2016-04-27) * Click on the image enlarge it in a new window. |
 |
| Top |
| TissGeneClin for TAS1R1 |
| TissGeneDrug for TAS1R1 |
| Drug information targeting TissGene (DrugBank Version 5.0.6, 2017-04-01) |
| DrugBank ID | Drug name | Drug activity | Drug type | Drug status |
| Top |
| TissGeneDisease for TAS1R1 |
| Disease information associated with TissGene (DisGeNet, 2016-06-01) |
| Disease ID | Disease name | # pubmeds | Source |
|
Copyright 2016-Present - The University of Texas Health Science Center at Houston (UTHealth) Web File Viewing | How to Report, Fraud, Waste and Abuse | State of Texas | Statewide Search | Texas Homeland Security | Site Policies |