 |
| |
| |
| |
| |
| |
| |
|

| TissGeneSummary for CLPB |
 Gene summary Gene summary |
| Basic gene information | Gene symbol | CLPB |
| Gene name | ClpB caseinolytic peptidase B homolog (E. coli) | |
| Synonyms | HSP78|SKD3 | |
| Cytomap | UCSC genome browser: 11q13.4 | |
| Type of gene | protein-coding | |
| RefGenes | NM_001258392.1, NM_001258393.1,NM_001258394.1,NM_030813.4, | |
| Description | caseinolytic peptidase B protein homologsuppressor of potassium transport defect 3 | |
| Modification date | 20141207 | |
| dbXrefs | HGNC : HGNC | |
| Ensembl : ENSG00000162129 | ||
| HPRD : 11560 | ||
| Vega : OTTHUMG00000167902 | ||
| Protein | UniProt: go to UniProt's Cross Reference DB Table | |
| Expression | CleanEX: HS_CLPB | |
| BioGPS: 81570 | ||
| Pathway | NCI Pathway Interaction Database: CLPB | |
| KEGG: CLPB | ||
| REACTOME: CLPB | ||
| Pathway Commons: CLPB | ||
| Context | iHOP: CLPB | |
| ligand binding site mutation search in PubMed: CLPB | ||
| UCL Cancer Institute: CLPB | ||
| Assigned class in TissGDB* | C | |
| Included tissue-specific gene expression resources | HPA,GTEx | |
| Specific-tissues in normal samples (assigned by TissGDB using HPA, TiGER, and GTEx) | Testis | |
| Cancer types related to the specific-tissues in cancer samples (assigned by TissGDB using TCGA) | TGCT | |
| Reference showing the relevant tissue of CLPB | ||
| Description by TissGene annotations | Have significant anti-correlated miRNA TissgsLTS Fused withTSGene | |
| * Class A consists of genes with literature evidence and is part of the cTissGenes. Class B consists of only cTissGenes without additional evidence. The remaining genes belong to Class C. |
| Gene ontology having evidence of Inferred from Direct Assay (IDA) from Entrez |
| GO ID | GO term | PubMed ID | GO:0034605 | cellular response to heat | 2745427 | GO:0034605 | cellular response to heat | 2745427 |
| Top |
| TissGeneExp for CLPB |
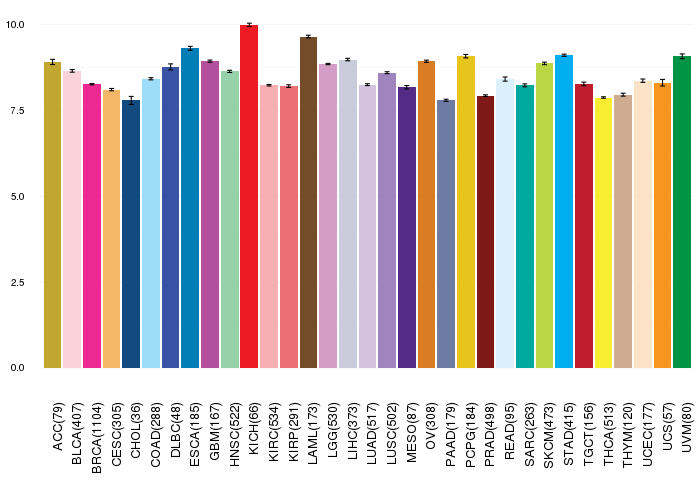
| Gene expressions across 28 cancer types (X-axis: cancer type and Y-axis: log2(norm_counts+1)) (TCGA IlluminaHiSeq_RNASeqV2, pan-cancer normalized log2(norm_counts+1) data, version 2016-08-16) |
 |
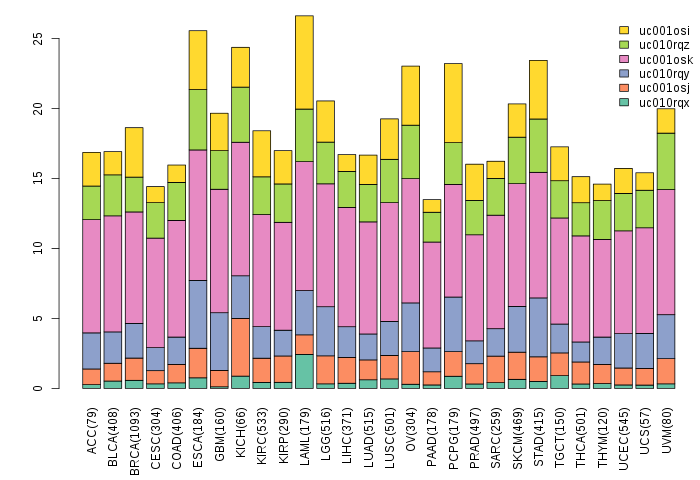
| Gene isoform expressions across 28 cancer types (X-axis: cancer type and Y-axis: log2(norm_counts+1)) (TCGA pan-cancer tcga_rsem_isoform_tpm, version 2016-09-01) |
 |
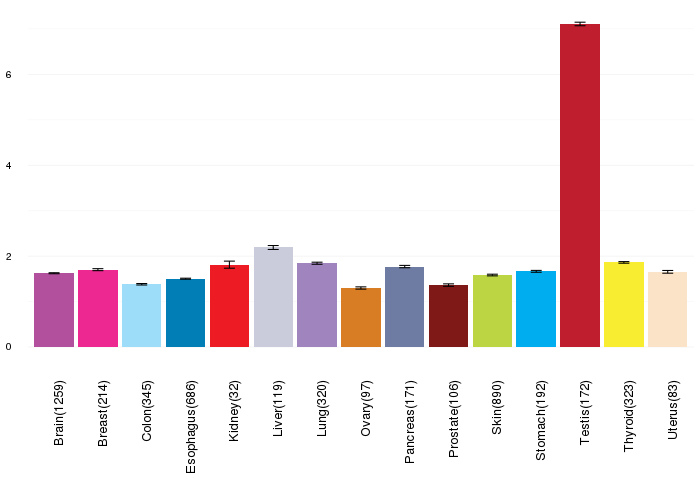
| Gene expressions across normal tissues of GTEx data (GTEx GTEx_Analysis_v6_RNA-seq_RNA-SeQCv1.1.8_gene_rpkm.gct) - Here, we shows the matched tissue types only among our 28 cancer types. |
 |
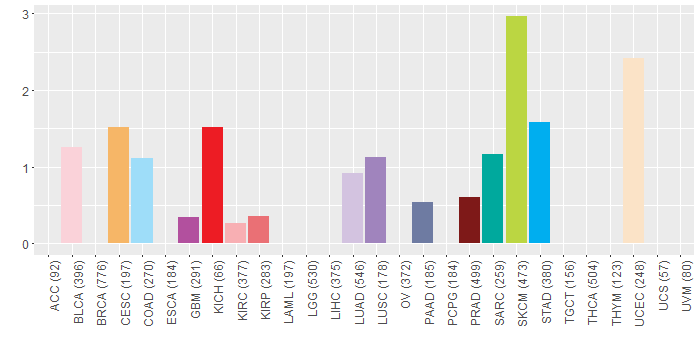
| Different expressions across 14 cancer types with more than 10 samples between matched tumors and normals (X-axis: cancer type and Y-axis: log2(norm_counts+1)) (TCGA IlluminaHiSeq_RNASeqV2, pan-cancer normalized log2(norm_counts+1) data, version 2016-08-16) |
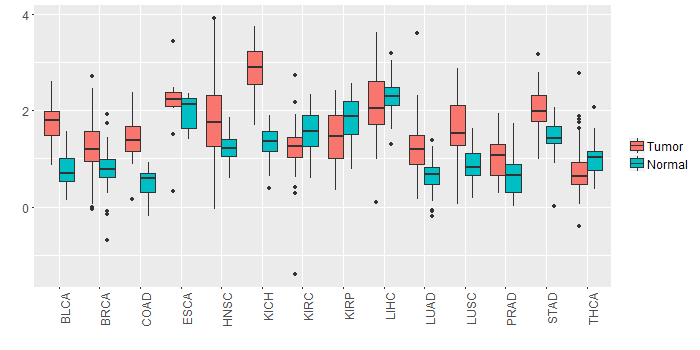 |
| - Significantly differentially expressed cancer types and information. (|Fold change|>1 and FDR<0.05) |
| Cancer type | Mean(exp) in tumor | Mean(exp) in matched normal | Log2FC | P-val. | FDR |
| KICH | 2.861069205 | 1.325213205 | 1.535856 | 4.01E-16 | 1.06E-14 |
| Top |
| TissGene-miRNA for CLPB |
| Significantly anti-correlated miRNAs of TissGene across 28 cancer types (Gene-miRNA relations from TargetScanHuman Relsease 7.1, Conserved_Site_Context_Scores.txt.zip, 06.01.2016) (TCGA IlluminaHiSeq_miRNASeq, log2(RPM+1) data, version 2016-11-21) (TCGA IlluminaHiSeq_RNASeqV2, log2(normalized_count+1) data, version 2016-08-16) (Spearman’s Rank Correlation (p-value<0.05 and coefficient<-0.25)) |
| Cancer type | miRNA id | miRNA accession | P-val. | Coeff. | # samples |
| ACC | hsa-miR-339-5p | MIMAT0000764 | 0.024 | -0.26 | 78 |
| ACC | hsa-miR-339-5p | MIMAT0000764 | 0.024 | -0.26 | 78 |
| LUAD | hsa-let-7a-5p | MIMAT0000062 | 0.03 | -0.28 | 60 |
| LUAD | hsa-miR-22-3p | MIMAT0000077 | 0.025 | -0.29 | 60 |
| LUAD | hsa-let-7f-5p | MIMAT0000067 | 0.0099 | -0.33 | 60 |
| Top |
| TissGeneMut for CLPB |
| TissGeneSNV for CLPB |
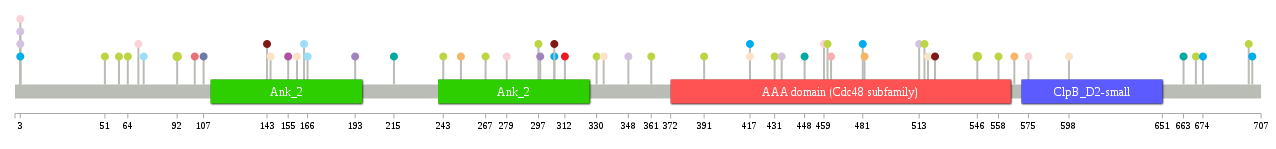
| nsSNV counts per each loci. Different colors of circles represent different cancer types. Circle size denotes number of samples. (TCGA somatic mutation (SNPs and small INDELs) data, version 2016-04-25) * Click on the image to enlarge it in a new window. |
 |
 |
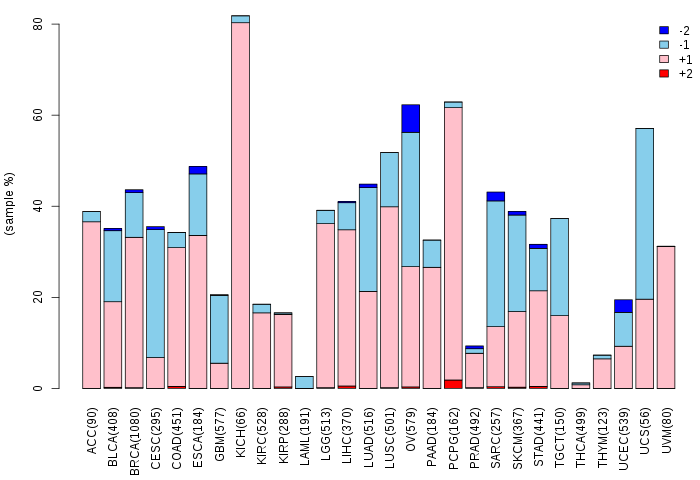
| Somatic nucleotide variants of TissGene across 28 cancer types (X-axis: cancer type and Y-axis: % of mutated samples) The numbers in parentheses are numbers of samples with mutation (nsSNVs). (TCGA somatic mutation (SNPs and small INDELs) data, version 2016-04-25) |
 |
| - nsSNVs sorted by frequency. |
| AAchange | Cancer type | # samples |
| p.P92S | SKCM | 2 |
| p.R546C | SKCM | 2 |
| p.A306V | PRAD | 1 |
| p.K482N | CESC | 1 |
| p.E330* | SKCM | 1 |
| p.M298I | LUSC | 1 |
| p.N145D | UCEC | 1 |
| p.N448S | SARC | 1 |
| p.E636Q | READ | 1 |
| p.E297K | SKCM | 1 |
| p.R417* | HNSC | 1 |
| p.V274I | HNSC | 1 |
| p.A391V | SKCM | 1 |
| p.Y279C | BLCA | 1 |
| p.P243S | SKCM | 1 |
| p.R3C | LUAD | 1 |
| p.A306T | STAD | 1 |
| p.R334W | UCEC | 1 |
| p.G481R | STAD | 1 |
| p.V463M | KIRC | 1 |
| p.V160A | UCEC | 1 |
| p.R3C | BLCA | 1 |
| p.A459V | BLCA | 1 |
| p.A361V | SKCM | 1 |
| p.R3G | LUAD | 1 |
| p.V107I | PAAD | 1 |
| p.R674C | STAD | 1 |
| p.Q70* | BLCA | 1 |
| p.R516C | SKCM | 1 |
| p.T598M | UCEC | 1 |
| p.K702N | STAD | 1 |
| p.R297W | READ | 1 |
| p.P193R | LUSC | 1 |
| p.W168* | HNSC | 1 |
| p.D253Y | CESC | 1 |
| p.L166R | COAD | 1 |
| p.R417* | STAD | 1 |
| p.S59L | SKCM | 1 |
| p.I348V | LUAD | 1 |
| p.A522V | PRAD | 1 |
| p.E215K | SARC | 1 |
| p.F558I | SKCM | 1 |
| p.A513S | LUAD | 1 |
| p.R312Q | KICH | 1 |
| p.G3V | STAD | 1 |
| p.A306V | HNSC | 1 |
| p.R417Q | UCEC | 1 |
| p.R143H | PRAD | 1 |
| p.S663R | SARC | 1 |
| p.R73C | COAD | 1 |
| p.H164R | COAD | 1 |
| p.E575* | BLCA | 1 |
| p.P461S | SKCM | 1 |
| p.E267K | SKCM | 1 |
| p.D102V | KIRP | 1 |
| p.S155* | GBM | 1 |
| p.A51V | SKCM | 1 |
| p.R518C | UCEC | 1 |
| p.R3S | HNSC | 1 |
| p.S64F | SKCM | 1 |
| p.Y567C | CESC | 1 |
| p.A696V | HNSC | 1 |
| p.E435* | LUAD | 1 |
| p.P700A | SKCM | 1 |
| p.P431S | SKCM | 1 |
| p.P670A | SKCM | 1 |
| Top |
| TissGeneCNV for CLPB |
| Copy number variations of TissGene across 28 cancer types (X-axis: cancer type and Y-axis: % of CNV samples) (TCGA Gistic2_CopyNumber_Gistic2_all_data_by_genes, Gistic2 copy number data, version 2016-08-16) |
 |
| Top |
| TissGeneFusions for CLPB |
| Fusion genes including TissGene (ChimerDB 3.0, 2016-12-01 and TCGA fusion Portal 2015-12-01) |
| Database | Src | Cancer type | Sample | Fusion gene | ORF | 5'-gene BP | 3'-gene BP |
| Chimerdb3.0 | ChiTaRs | NA | BX954309 | CLPB-CABP4 | chr11:72003817 | chr11:67223119 | |
| Chimerdb3.0 | ChiTaRs | NA | BF815616 | CLPB-HECA | chr11:72053183 | chr6:139499229 | |
| Chimerdb3.0 | FusionScan | ESCA | TCGA-LN-A49W-01A | CLPB-GOLGA8B | CDS-5'UTR | chr11:72069923 | chr15:34846157 |
| Chimerdb3.0 | FusionScan | ESCA | TCGA-LN-A49W-01A | CLPB-GOLGA8A | CDS-5'UTR | chr11:72069923 | chr15:34699936 |
| TCGAfusionPortal | PRADA | BRCA | TCGA-A8-A09D-01A | CLPB-ARMC4 | In-frame | Chr11:72012847 | Chr10:28229734 |
| TCGAfusionPortal | PRADA | BRCA | TCGA-AR-A24K-01A | CLPB-MTUS2 | In-frame | Chr11:72069924 | Chr13:29674910 |
| TCGAfusionPortal | PRADA | BRCA | TCGA-B6-A0RL-01A | CLPB-C2CD3 | In-frame | Chr11:72040751 | Chr11:73817538 |
| TCGAfusionPortal | PRADA | BRCA | TCGA-BH-A0B9-01A | CLPB-STARD10 | CDS-5UTR | Chr11:72091325 | Chr11:72492339 |
| TCGAfusionPortal | PRADA | HNSC | TCGA-CV-7418-01A | LRP5-CLPB | In-frame | Chr11:68080273 | Chr11:72070052 |
| Top |
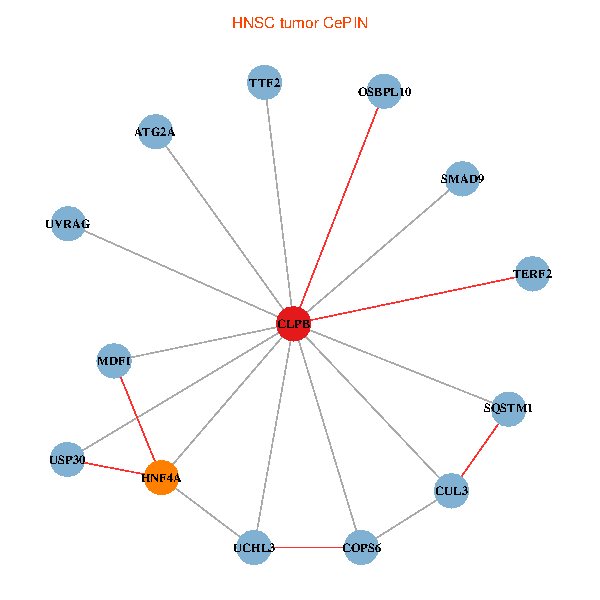
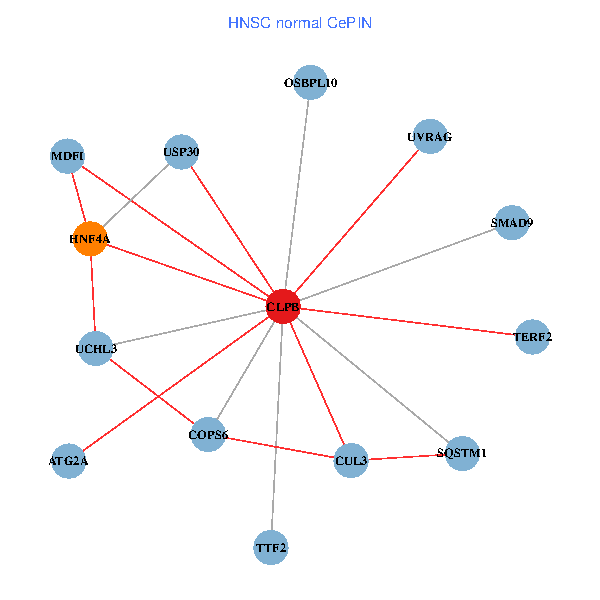
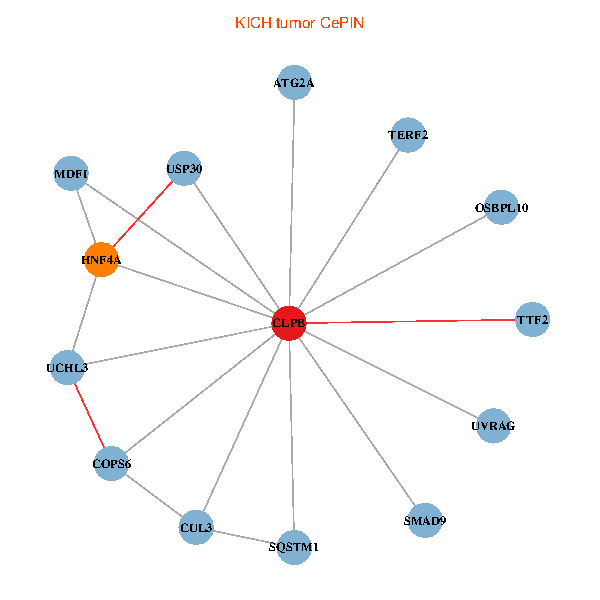
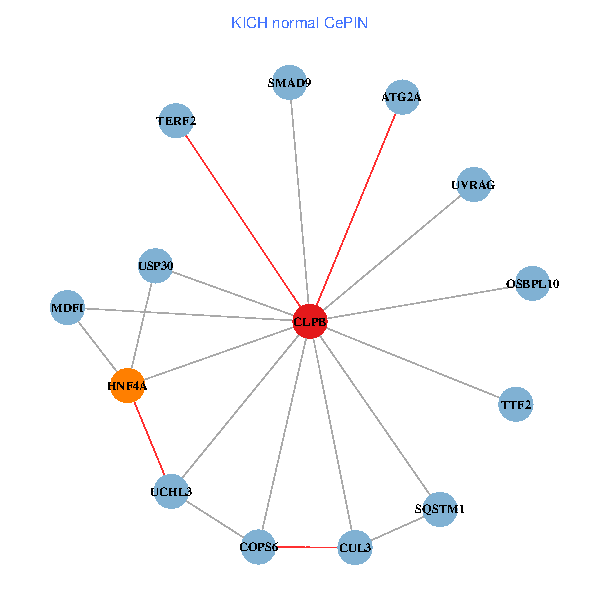
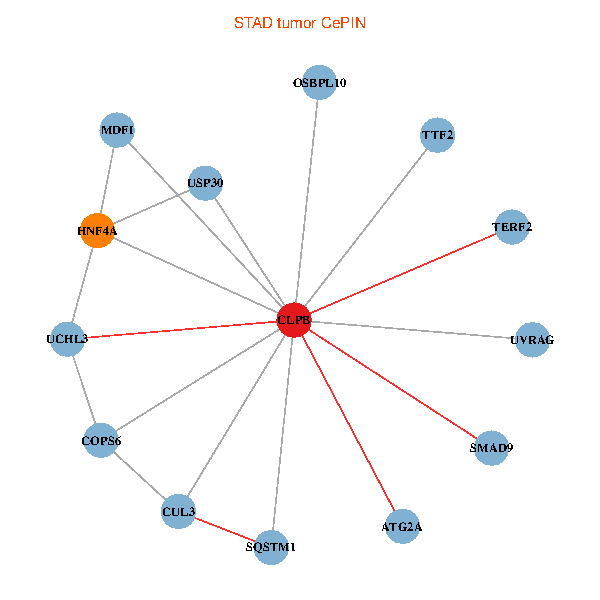
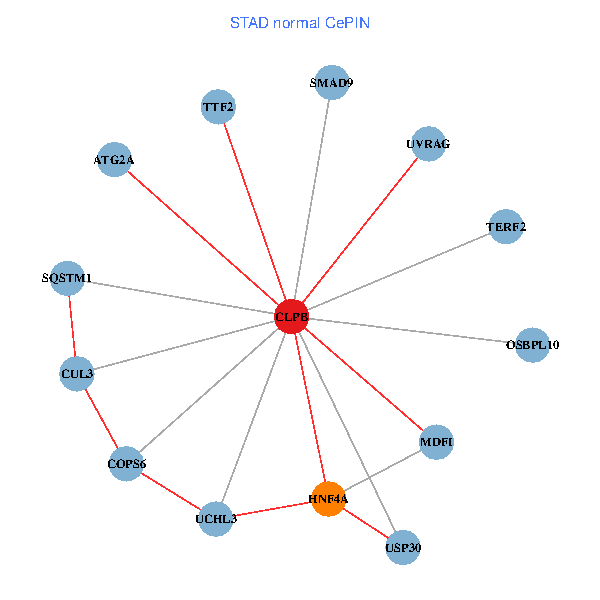
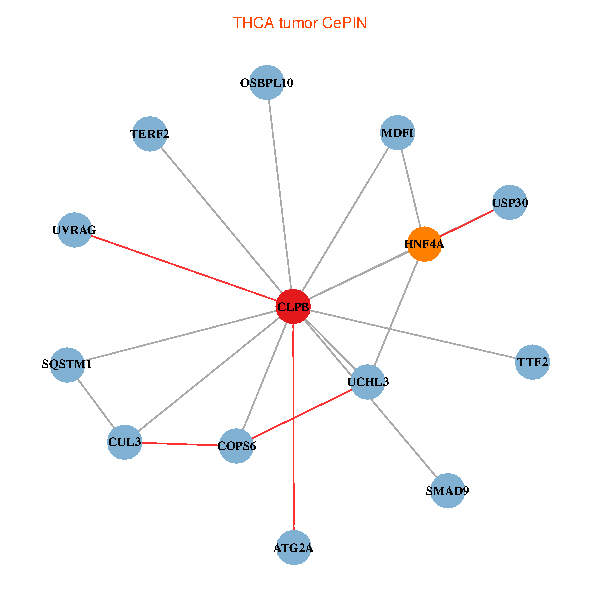
| TissGeneNet for CLPB |
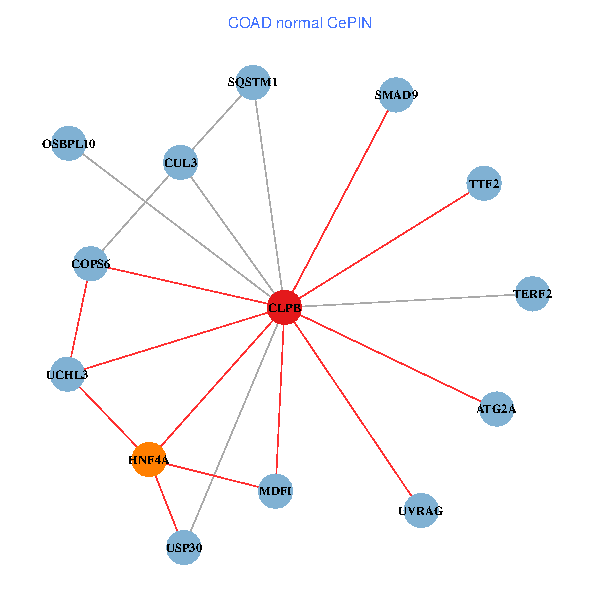
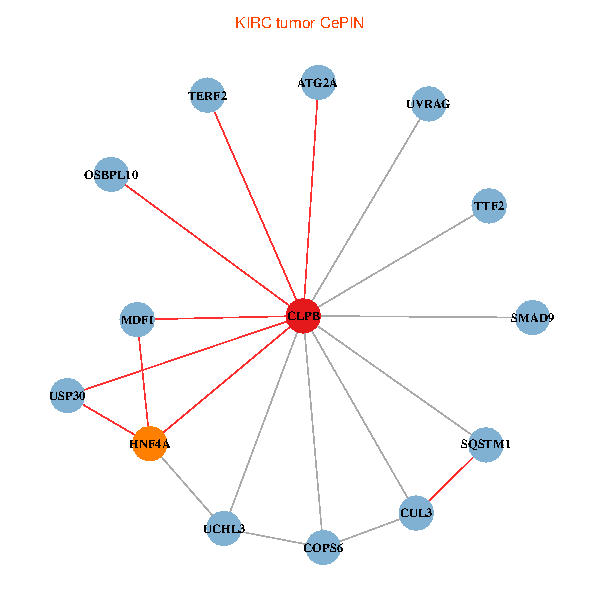
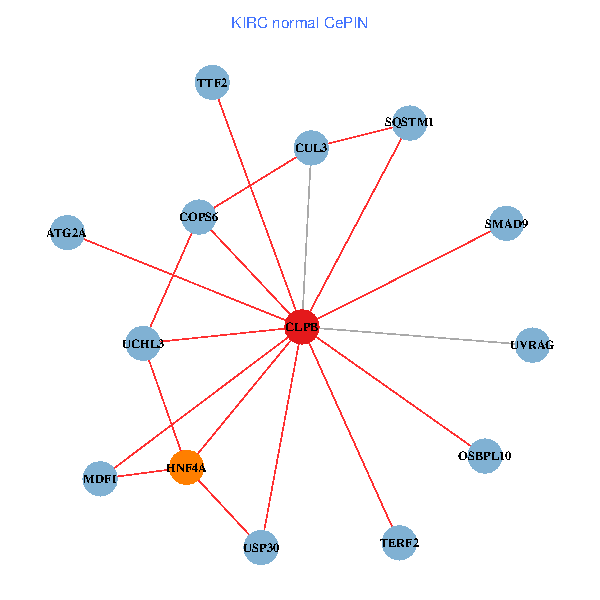
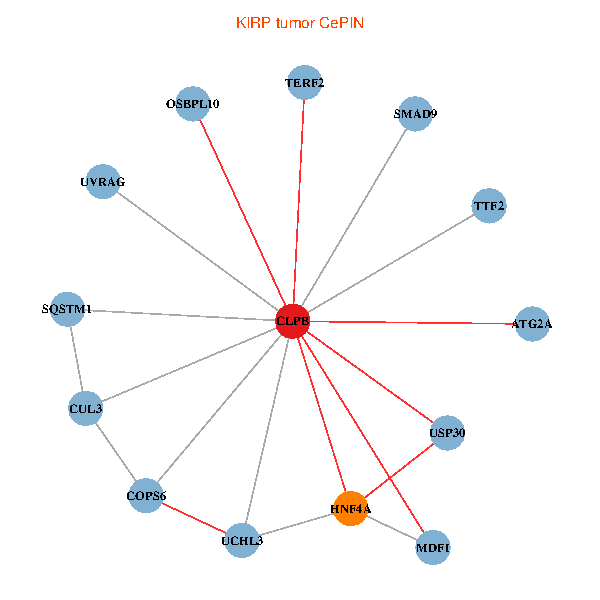
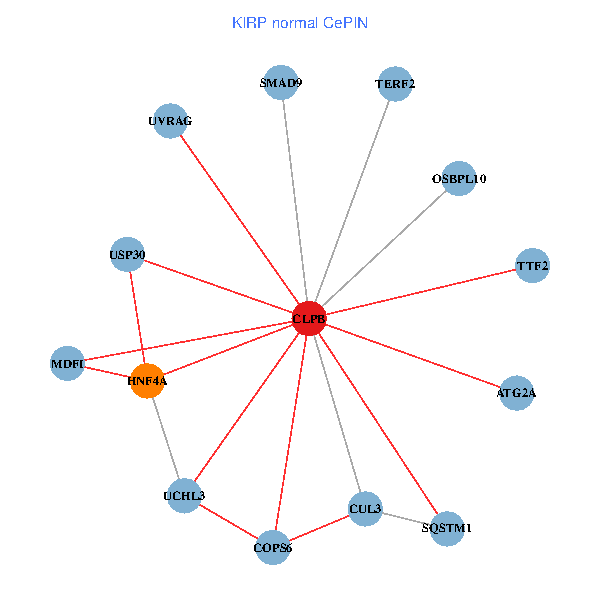
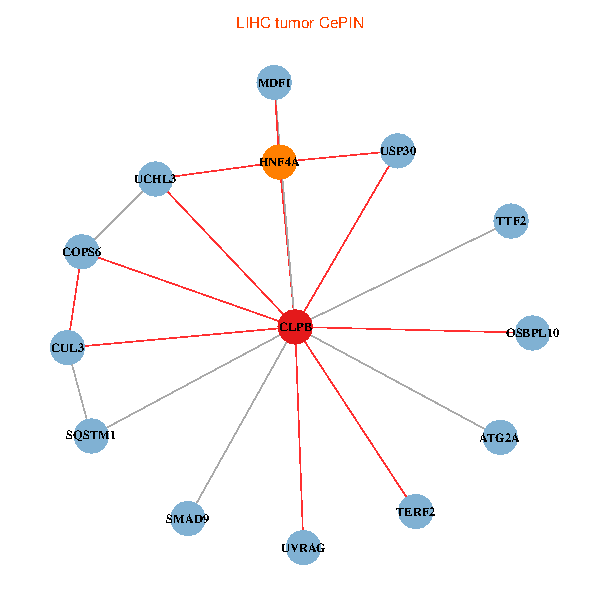
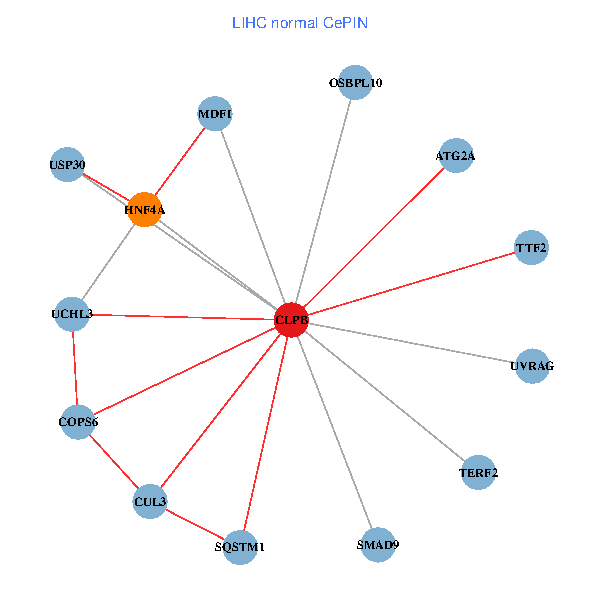
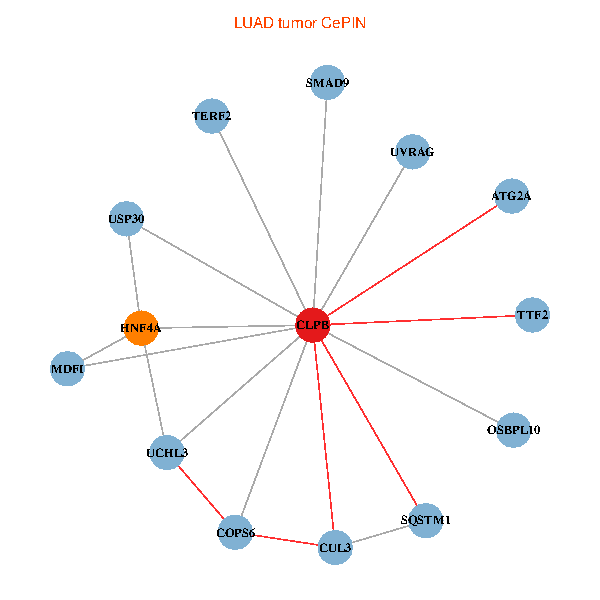
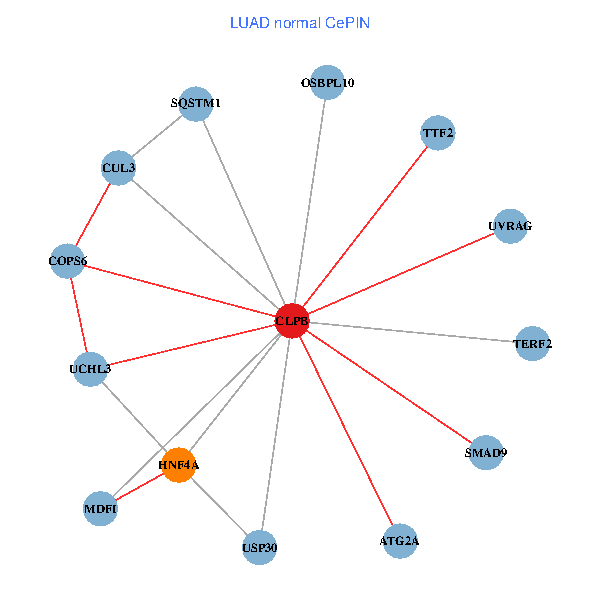
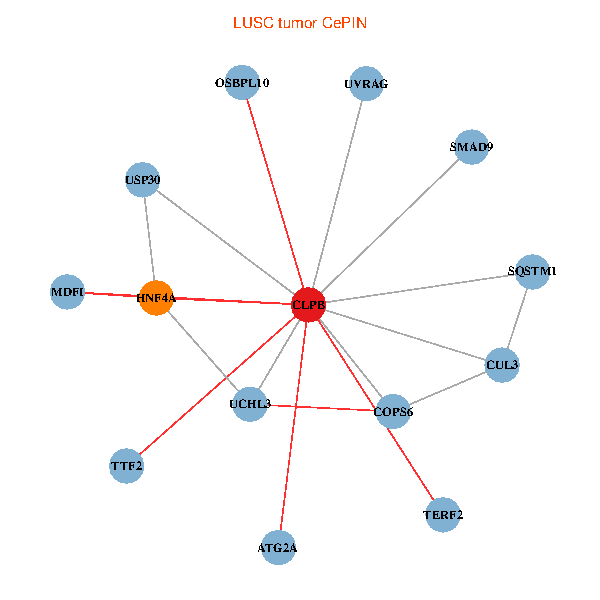
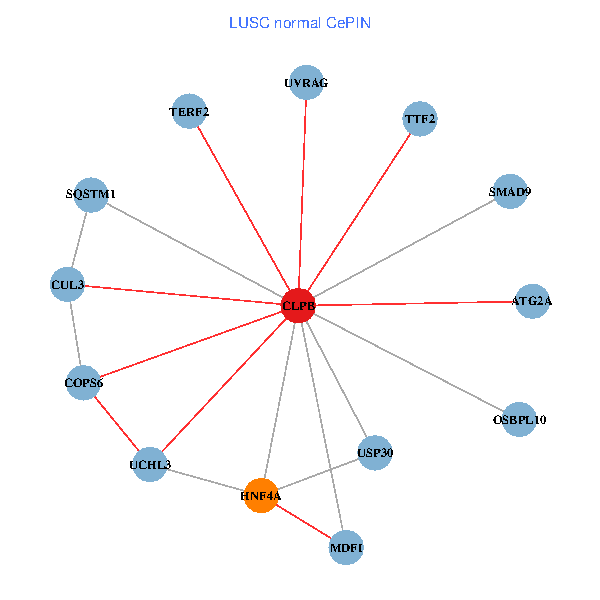
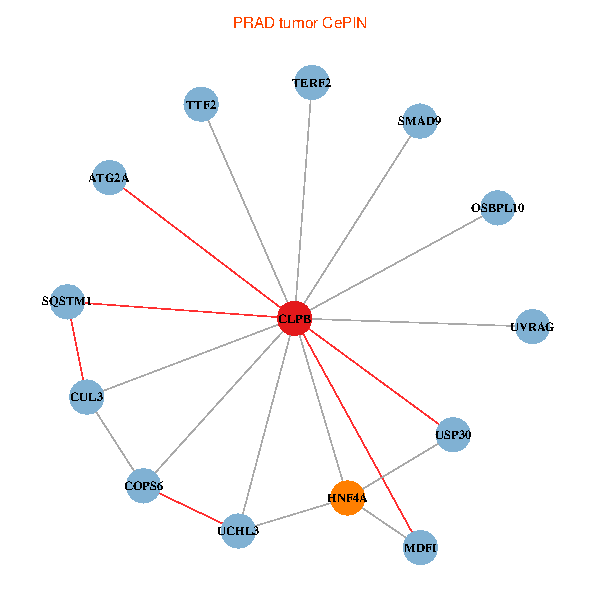
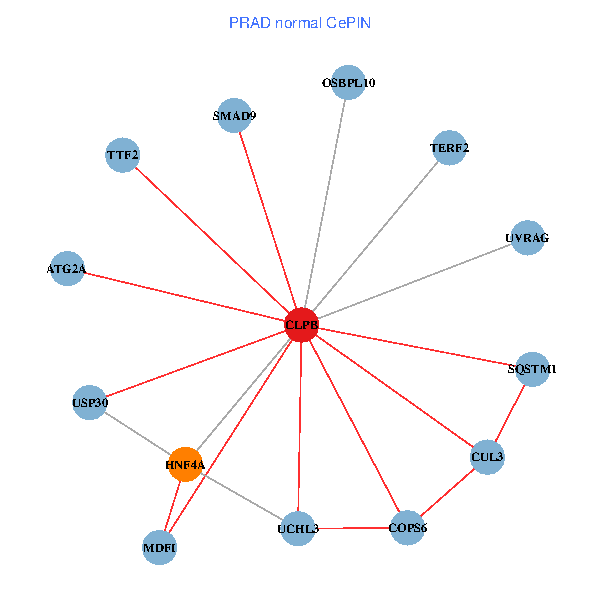
| Co-expressed gene networks based on protein-protein interaction data (CePIN) (TCGA IlluminaHiSeq_RNASeqV2, pan-cancer normalized log2(norm_counts+1) data, version 2016-08-16) (PINA2 ppi data) |
| BRCA (tumor) | BRCA (normal) |
| CLPB, SQSTM1, COPS6, HNF4A, MDFI, TERF2, CUL3, UCHL3, ATG2A, UVRAG, SMAD9, TTF2, USP30, OSBPL10 (tumor) | CLPB, SQSTM1, COPS6, HNF4A, MDFI, TERF2, CUL3, UCHL3, ATG2A, UVRAG, SMAD9, TTF2, USP30, OSBPL10 (normal) |
 |  |
| COAD (tumor) | COAD (normal) |
| CLPB, SQSTM1, COPS6, HNF4A, MDFI, TERF2, CUL3, UCHL3, ATG2A, UVRAG, SMAD9, TTF2, USP30, OSBPL10 (tumor) | CLPB, SQSTM1, COPS6, HNF4A, MDFI, TERF2, CUL3, UCHL3, ATG2A, UVRAG, SMAD9, TTF2, USP30, OSBPL10 (normal) |
 |  |
| HNSC (tumor) | HNSC (normal) |
| CLPB, SQSTM1, COPS6, HNF4A, MDFI, TERF2, CUL3, UCHL3, ATG2A, UVRAG, SMAD9, TTF2, USP30, OSBPL10 (tumor) | CLPB, SQSTM1, COPS6, HNF4A, MDFI, TERF2, CUL3, UCHL3, ATG2A, UVRAG, SMAD9, TTF2, USP30, OSBPL10 (normal) |
 |  |
| KICH (tumor) | KICH (normal) |
| CLPB, SQSTM1, COPS6, HNF4A, MDFI, TERF2, CUL3, UCHL3, ATG2A, UVRAG, SMAD9, TTF2, USP30, OSBPL10 (tumor) | CLPB, SQSTM1, COPS6, HNF4A, MDFI, TERF2, CUL3, UCHL3, ATG2A, UVRAG, SMAD9, TTF2, USP30, OSBPL10 (normal) |
 |  |
| KIRC (tumor) | KIRC (normal) |
| CLPB, SQSTM1, COPS6, HNF4A, MDFI, TERF2, CUL3, UCHL3, ATG2A, UVRAG, SMAD9, TTF2, USP30, OSBPL10 (tumor) | CLPB, SQSTM1, COPS6, HNF4A, MDFI, TERF2, CUL3, UCHL3, ATG2A, UVRAG, SMAD9, TTF2, USP30, OSBPL10 (normal) |
 |  |
| KIRP (tumor) | KIRP (normal) |
| CLPB, SQSTM1, COPS6, HNF4A, MDFI, TERF2, CUL3, UCHL3, ATG2A, UVRAG, SMAD9, TTF2, USP30, OSBPL10 (tumor) | CLPB, SQSTM1, COPS6, HNF4A, MDFI, TERF2, CUL3, UCHL3, ATG2A, UVRAG, SMAD9, TTF2, USP30, OSBPL10 (normal) |
 |  |
| LIHC (tumor) | LIHC (normal) |
| CLPB, SQSTM1, COPS6, HNF4A, MDFI, TERF2, CUL3, UCHL3, ATG2A, UVRAG, SMAD9, TTF2, USP30, OSBPL10 (tumor) | CLPB, SQSTM1, COPS6, HNF4A, MDFI, TERF2, CUL3, UCHL3, ATG2A, UVRAG, SMAD9, TTF2, USP30, OSBPL10 (normal) |
 |  |
| LUAD (tumor) | LUAD (normal) |
| CLPB, SQSTM1, COPS6, HNF4A, MDFI, TERF2, CUL3, UCHL3, ATG2A, UVRAG, SMAD9, TTF2, USP30, OSBPL10 (tumor) | CLPB, SQSTM1, COPS6, HNF4A, MDFI, TERF2, CUL3, UCHL3, ATG2A, UVRAG, SMAD9, TTF2, USP30, OSBPL10 (normal) |
 |  |
| LUSC (tumor) | LUSC (normal) |
| CLPB, SQSTM1, COPS6, HNF4A, MDFI, TERF2, CUL3, UCHL3, ATG2A, UVRAG, SMAD9, TTF2, USP30, OSBPL10 (tumor) | CLPB, SQSTM1, COPS6, HNF4A, MDFI, TERF2, CUL3, UCHL3, ATG2A, UVRAG, SMAD9, TTF2, USP30, OSBPL10 (normal) |
 |  |
| PRAD (tumor) | PRAD (normal) |
| CLPB, SQSTM1, COPS6, HNF4A, MDFI, TERF2, CUL3, UCHL3, ATG2A, UVRAG, SMAD9, TTF2, USP30, OSBPL10 (tumor) | CLPB, SQSTM1, COPS6, HNF4A, MDFI, TERF2, CUL3, UCHL3, ATG2A, UVRAG, SMAD9, TTF2, USP30, OSBPL10 (normal) |
 |  |
| STAD (tumor) | STAD (normal) |
| CLPB, SQSTM1, COPS6, HNF4A, MDFI, TERF2, CUL3, UCHL3, ATG2A, UVRAG, SMAD9, TTF2, USP30, OSBPL10 (tumor) | CLPB, SQSTM1, COPS6, HNF4A, MDFI, TERF2, CUL3, UCHL3, ATG2A, UVRAG, SMAD9, TTF2, USP30, OSBPL10 (normal) |
 |  |
| THCA (tumor) | THCA (normal) |
| CLPB, SQSTM1, COPS6, HNF4A, MDFI, TERF2, CUL3, UCHL3, ATG2A, UVRAG, SMAD9, TTF2, USP30, OSBPL10 (tumor) | CLPB, SQSTM1, COPS6, HNF4A, MDFI, TERF2, CUL3, UCHL3, ATG2A, UVRAG, SMAD9, TTF2, USP30, OSBPL10 (normal) |
 |  |
| Top |
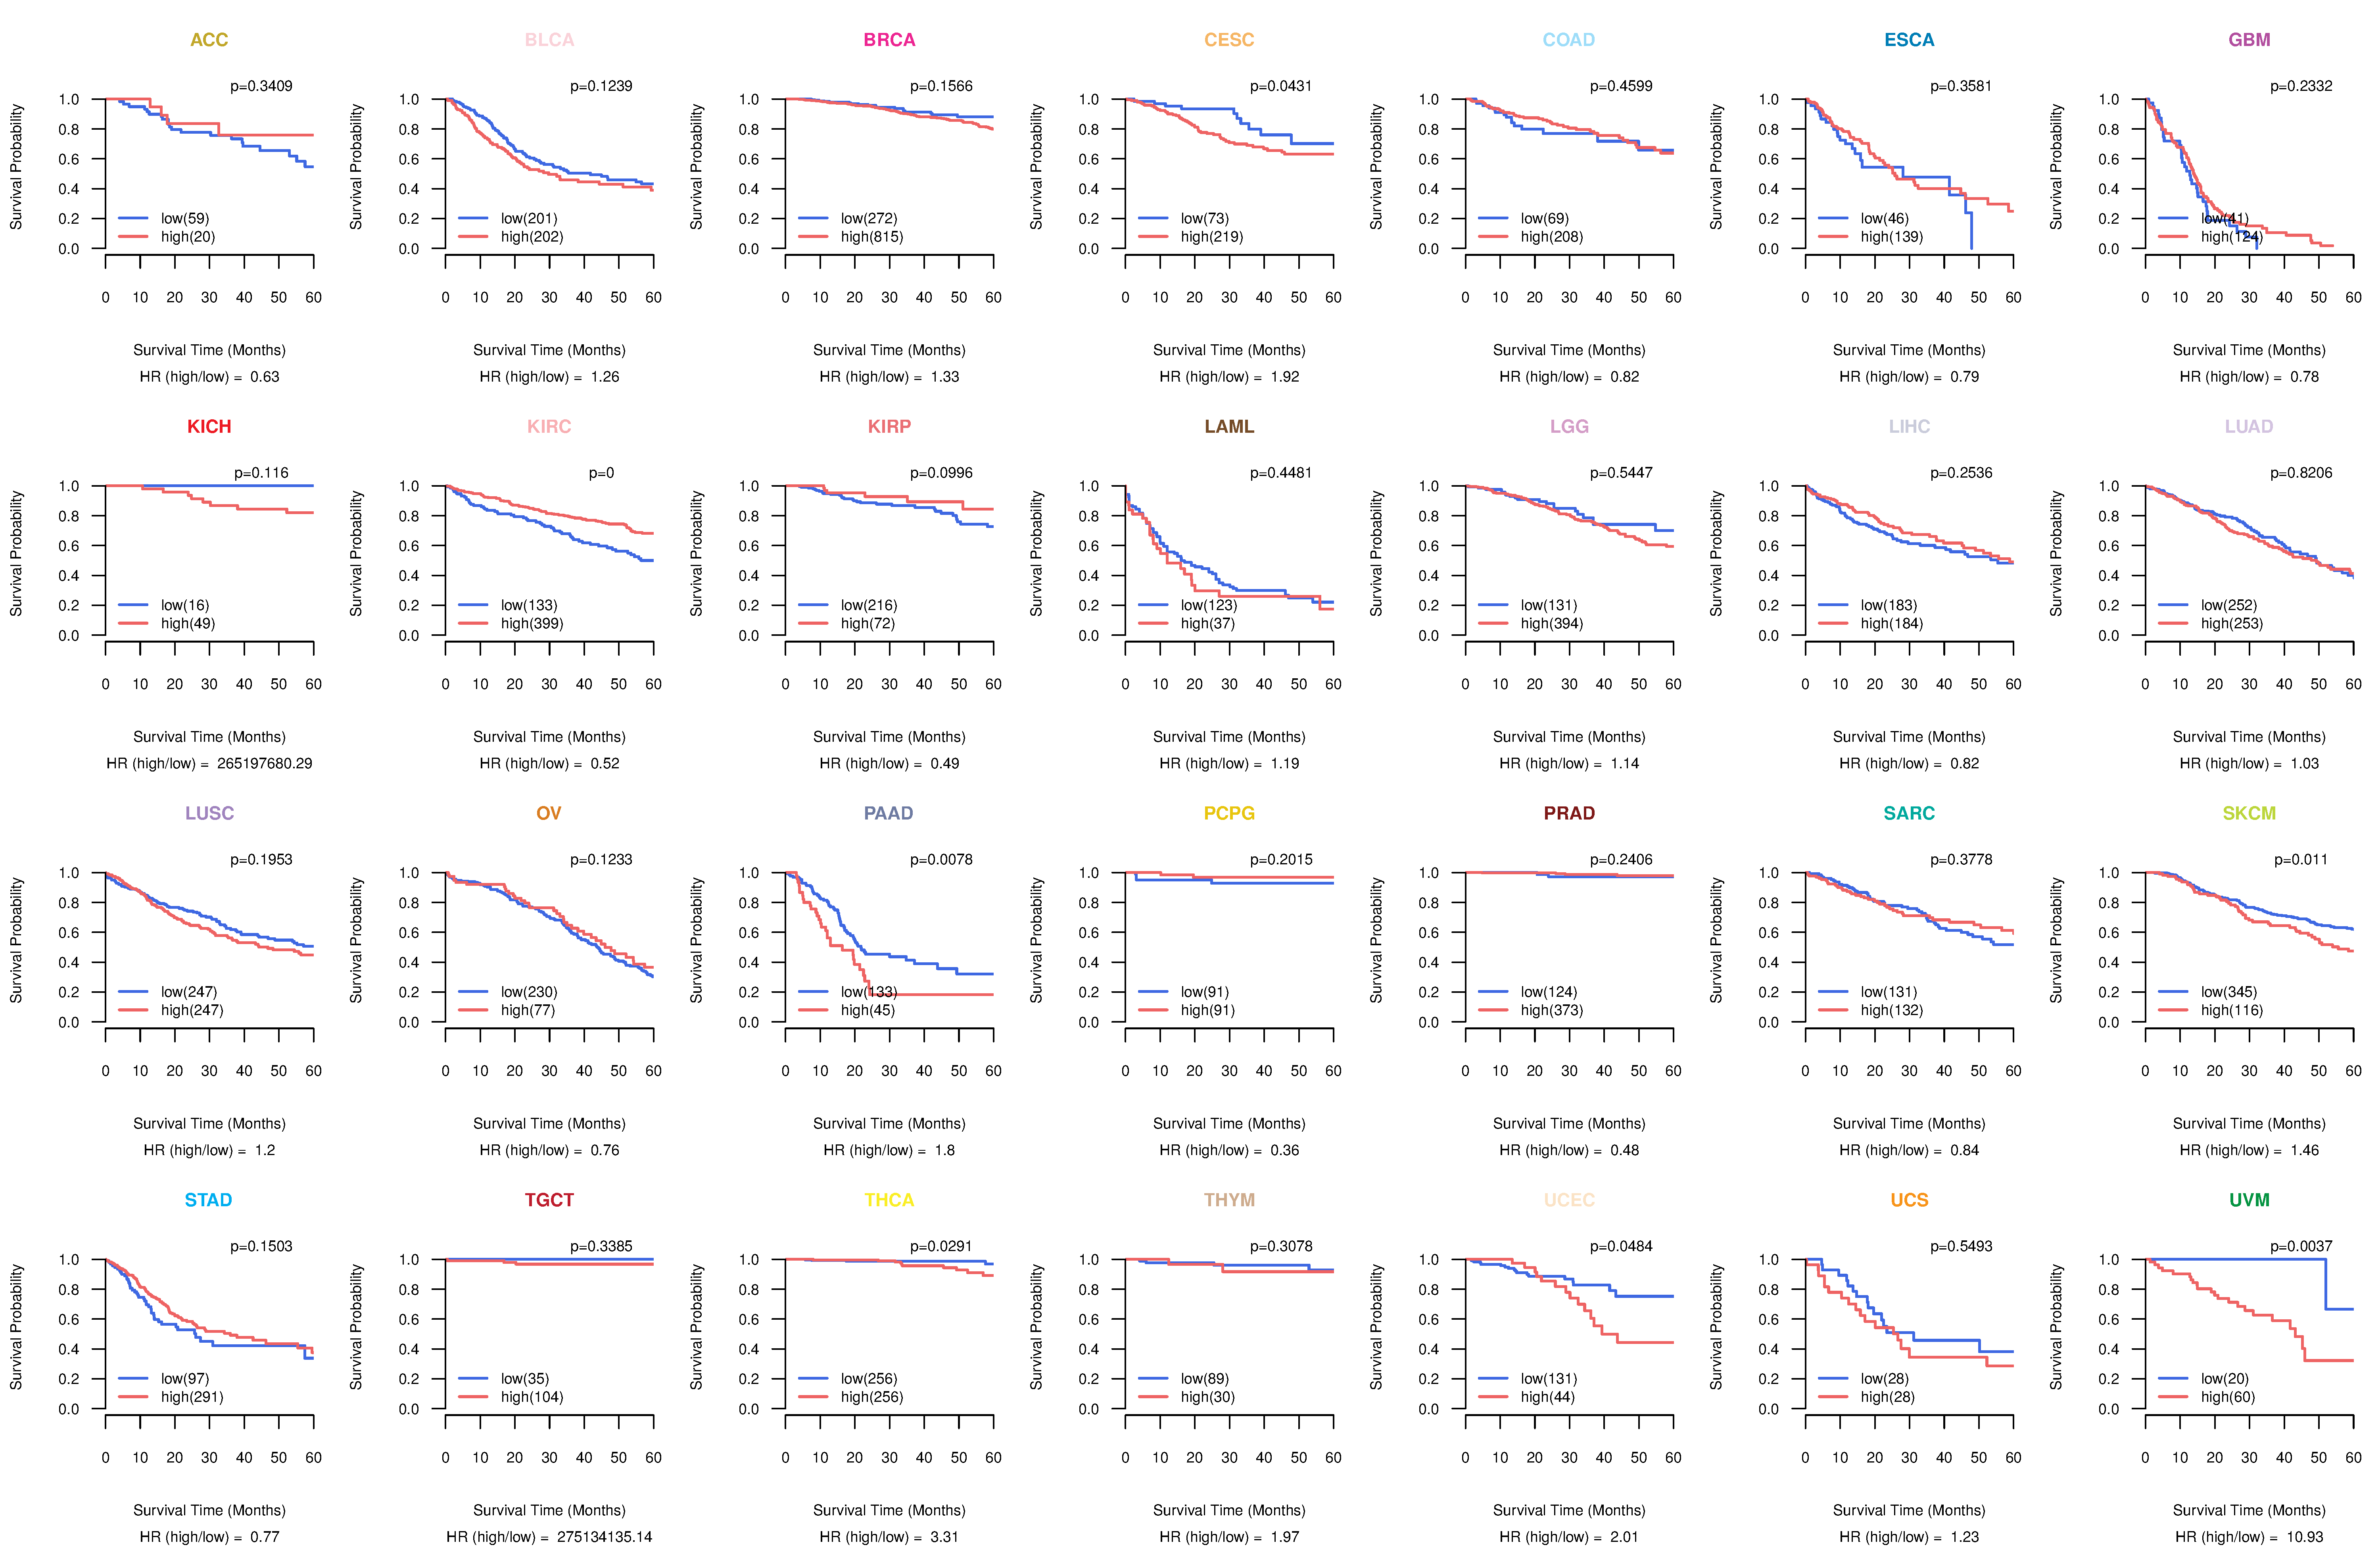
| TissGeneProg for CLPB |
| Kaplan-Meier plots with logrank tests of overall survival (OS) using 28 cancer types (TCGA IlluminaHiSeq_RNASeqV2, pan-cancer normalized log2(norm_counts+1) data, version 2016-08-16) (TCGA clinicalMatrix, phenotype data, version 2016-04-27) * Click on the image to enlarge it in a new window. |
 |
| Kaplan-Meier plots with logrank test of relapse free survival (RFS) using 28 cancer types (TCGA IlluminaHiSeq_RNASeqV2, pan-cancer normalized log2(norm_counts+1) data, version 2016-08-16) (TCGA clinicalMatrix, phenotype data, version 2016-04-27) * Click on the image enlarge it in a new window. |
 |
| Forest plot of Cox proportional hazard ratio (HR) and 95% CI of overall survival (OS) using 28 cancer types (TCGA IlluminaHiSeq_RNASeqV2, pan-cancer normalized log2(norm_counts+1) data, version 2016-08-16) (TCGA clinicalMatrix, phenotype data, version 2016-04-27) * Click on the image enlarge it in a new window. |
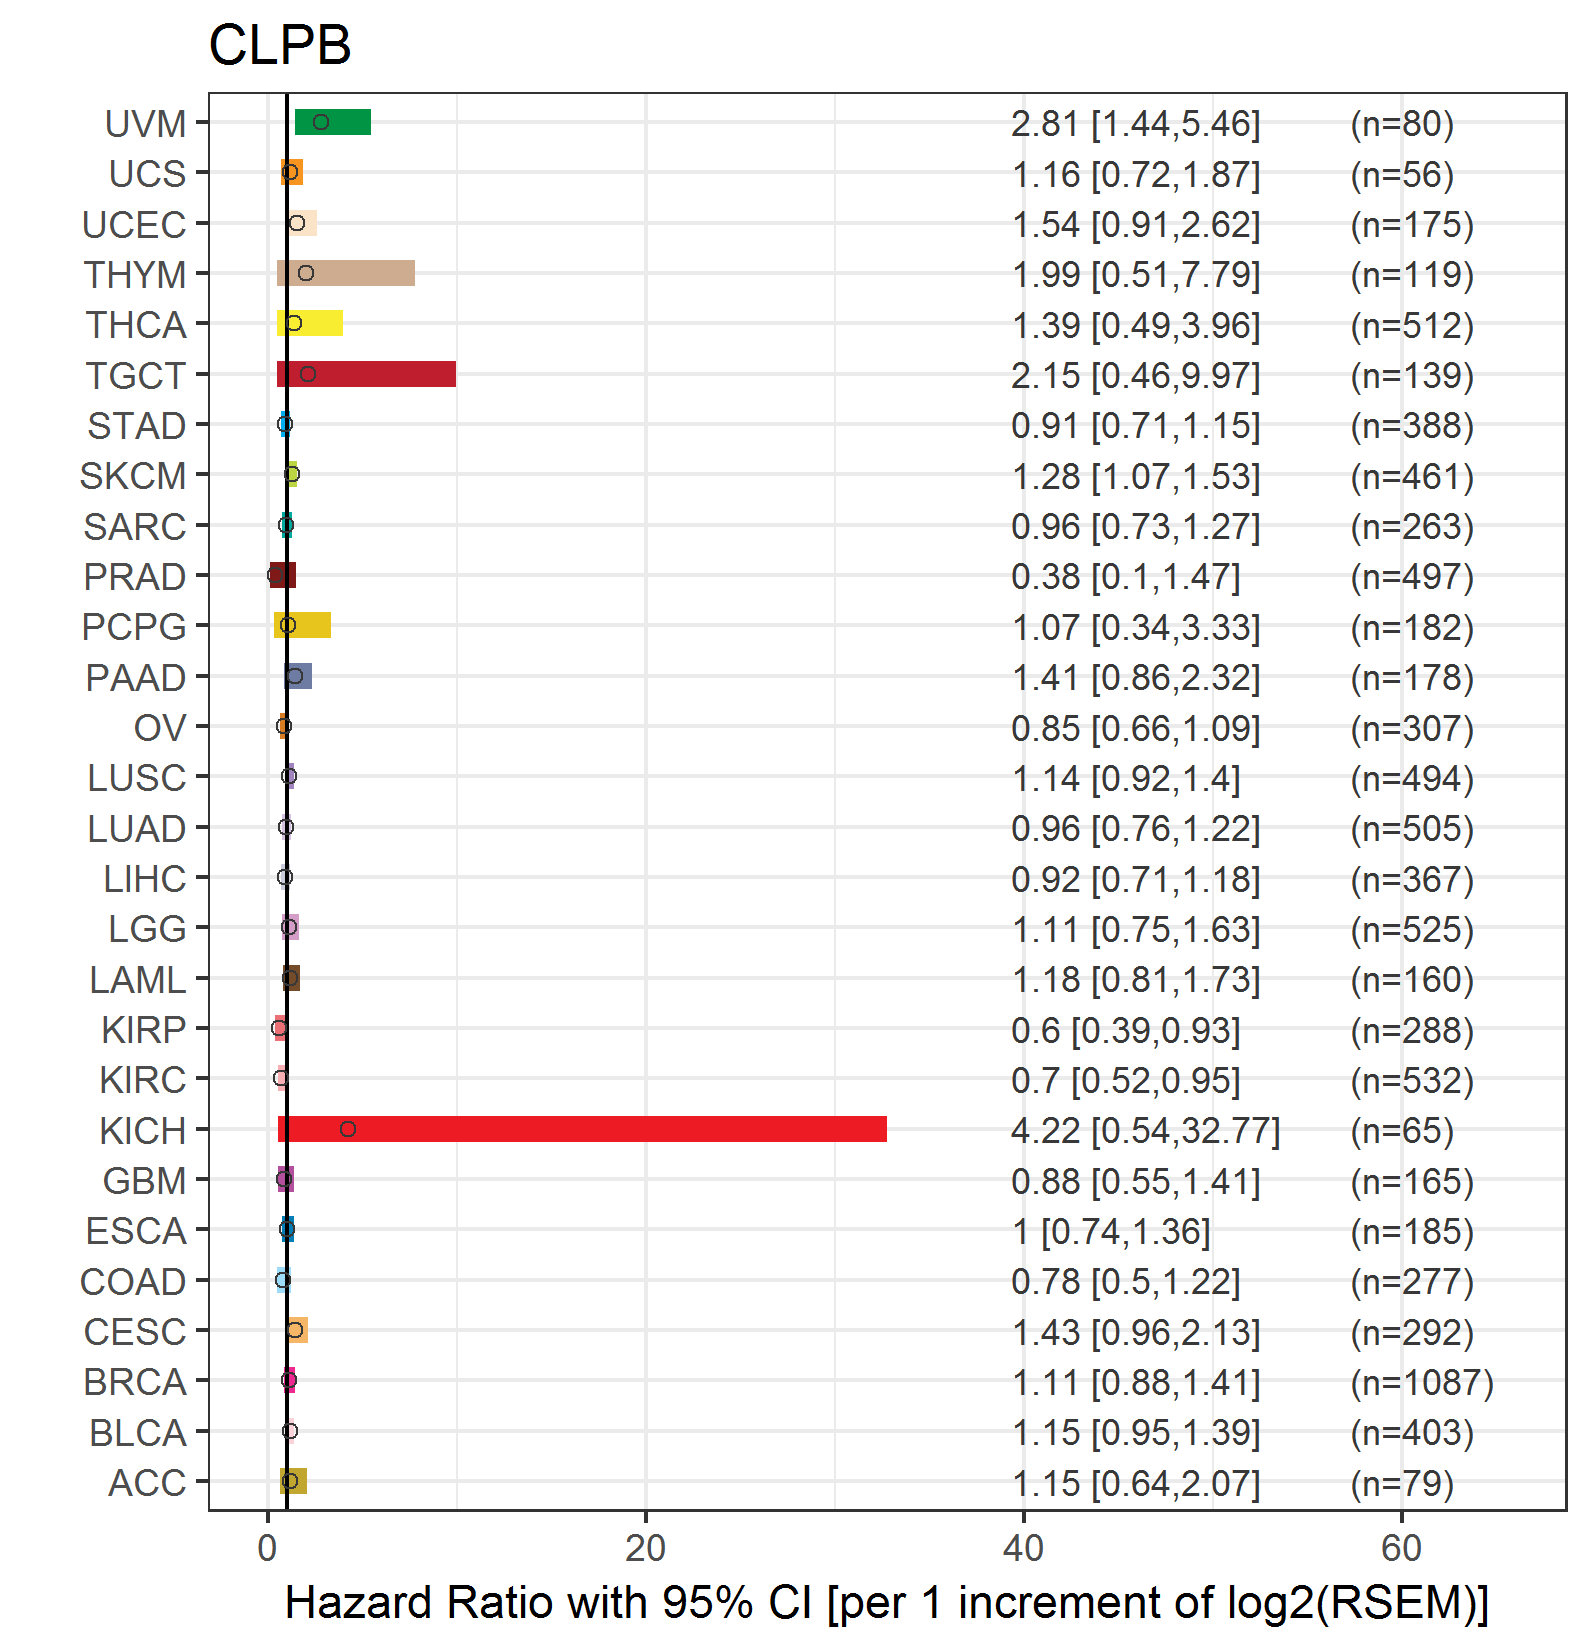 |
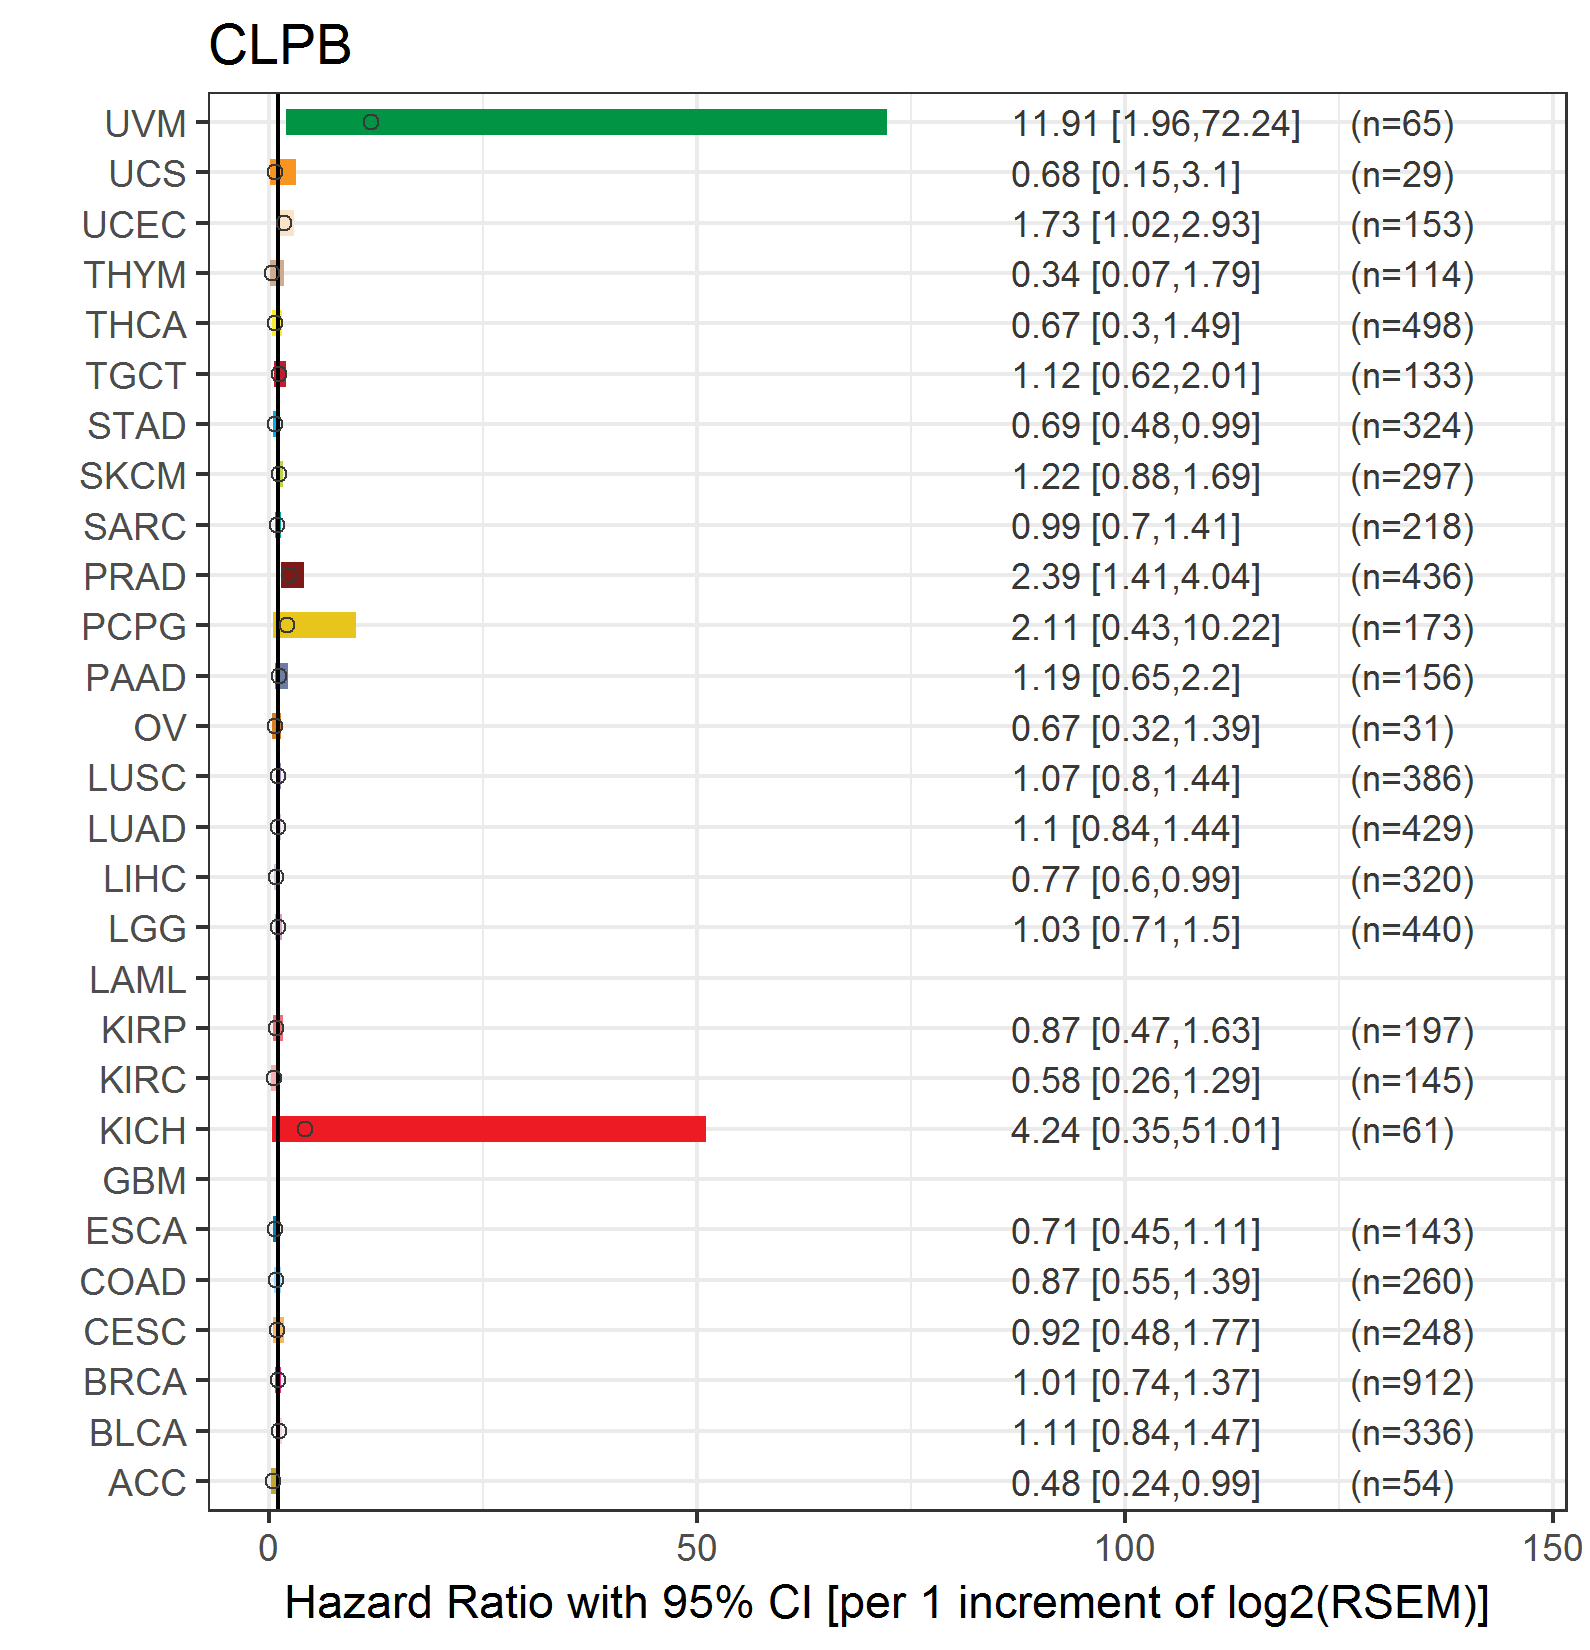
| Forest plot of Cox proportional hazard ratio (HR) and 95% CI of relapse free survival (RFS) using 28 cancer types (TCGA IlluminaHiSeq_RNASeqV2, pan-cancer normalized log2(norm_counts+1) data, version 2016-08-16) (TCGA clinicalMatrix, phenotype data, version 2016-04-27) * Click on the image enlarge it in a new window. |
 |
| Top |
| TissGeneClin for CLPB |
| TissGeneDrug for CLPB |
| Drug information targeting TissGene (DrugBank Version 5.0.6, 2017-04-01) |
| DrugBank ID | Drug name | Drug activity | Drug type | Drug status |
| Top |
| TissGeneDisease for CLPB |
| Disease information associated with TissGene (DisGeNet, 2016-06-01) |
| Disease ID | Disease name | # pubmeds | Source |
| umls:C0342727 | 3-@METHYLGLUTACONIC ACIDURIA, TYPE I | 2 | BeFree |
| umls:C3696376 | 3-Methylglutaconic Aciduria | 2 | BeFree |
| umls:C0018203 | Chronic granulomatous disease | 1 | BeFree |
| umls:C0085584 | Encephalopathies | 1 | BeFree |
| umls:C0235820 | Neonatal encephalopathy | 1 | BeFree |
| umls:C0235946 | Cerebral atrophy | 1 | BeFree |
| umls:C0340970 | Congenital neutropenia | 1 | BeFree |
| umls:C1853118 | Severe congenital neutropenia | 1 | BeFree |
| umls:C3714756 | Intellectual Disability | 1 | BeFree |
| umls:C3853041 | Severe Congenital Microcephaly | 1 | BeFree |
|
Copyright 2016-Present - The University of Texas Health Science Center at Houston (UTHealth) Web File Viewing | How to Report, Fraud, Waste and Abuse | State of Texas | Statewide Search | Texas Homeland Security | Site Policies |