 |
| |
| |
| |
| |
| |
| |
|

| TissGeneSummary for DIAPH3 |
 Gene summary Gene summary |
| Basic gene information | Gene symbol | DIAPH3 |
| Gene name | diaphanous-related formin 3 | |
| Synonyms | AN|AUNA1|DIA2|DRF3|NSDAN|diap3|mDia2 | |
| Cytomap | UCSC genome browser: 13q21.2 | |
| Type of gene | protein-coding | |
| RefGenes | NM_001042517.1, NM_001258366.1,NM_001258367.1,NM_001258368.1,NM_001258369.1, NM_001258370.1,NM_030932.3, | |
| Description | diaphanous homolog 3diaphanous-related formin-3protein diaphanous homolog 3 | |
| Modification date | 20141207 | |
| dbXrefs | MIM : 614567 | |
| HGNC : HGNC | ||
| Ensembl : ENSG00000139734 | ||
| HPRD : 10884 | ||
| Vega : OTTHUMG00000017004 | ||
| Protein | UniProt: go to UniProt's Cross Reference DB Table | |
| Expression | CleanEX: HS_DIAPH3 | |
| BioGPS: 81624 | ||
| Pathway | NCI Pathway Interaction Database: DIAPH3 | |
| KEGG: DIAPH3 | ||
| REACTOME: DIAPH3 | ||
| Pathway Commons: DIAPH3 | ||
| Context | iHOP: DIAPH3 | |
| ligand binding site mutation search in PubMed: DIAPH3 | ||
| UCL Cancer Institute: DIAPH3 | ||
| Assigned class in TissGDB* | B | |
| Included tissue-specific gene expression resources | HPA,TiGER,GTEx | |
| Specific-tissues in normal samples (assigned by TissGDB using HPA, TiGER, and GTEx) | Testis | |
| Cancer types related to the specific-tissues in cancer samples (assigned by TissGDB using TCGA) | TGCT | |
| Reference showing the relevant tissue of DIAPH3 | ||
| Description by TissGene annotations | ||
| * Class A consists of genes with literature evidence and is part of the cTissGenes. Class B consists of only cTissGenes without additional evidence. The remaining genes belong to Class C. |
| Gene ontology having evidence of Inferred from Direct Assay (IDA) from Entrez |
| GO ID | GO term | PubMed ID |
| Top |
| TissGeneExp for DIAPH3 |
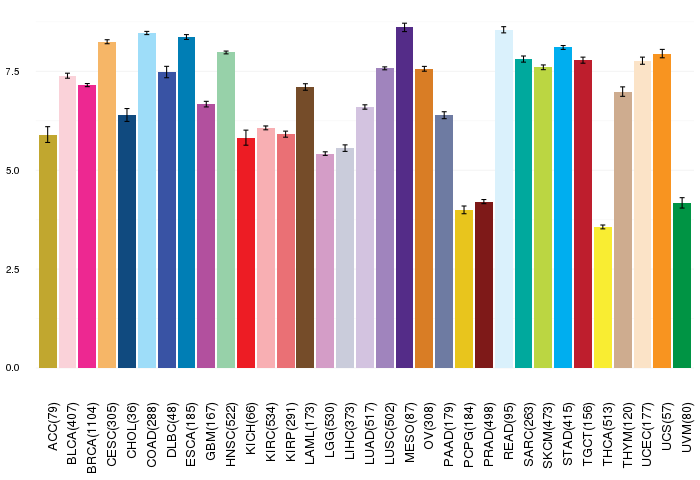
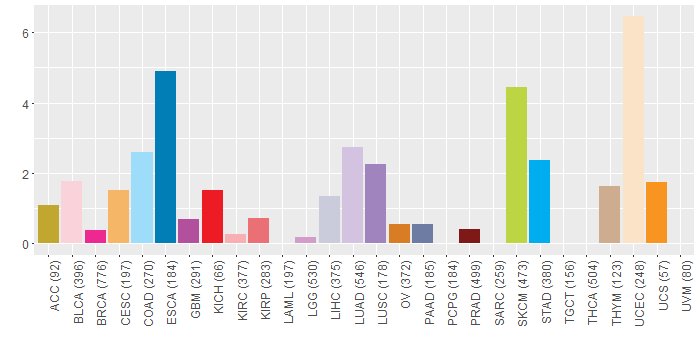
| Gene expressions across 28 cancer types (X-axis: cancer type and Y-axis: log2(norm_counts+1)) (TCGA IlluminaHiSeq_RNASeqV2, pan-cancer normalized log2(norm_counts+1) data, version 2016-08-16) |
 |
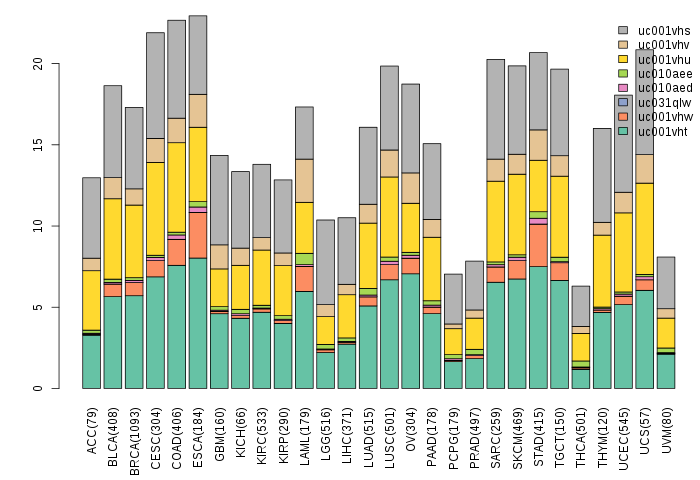
| Gene isoform expressions across 28 cancer types (X-axis: cancer type and Y-axis: log2(norm_counts+1)) (TCGA pan-cancer tcga_rsem_isoform_tpm, version 2016-09-01) |
 |
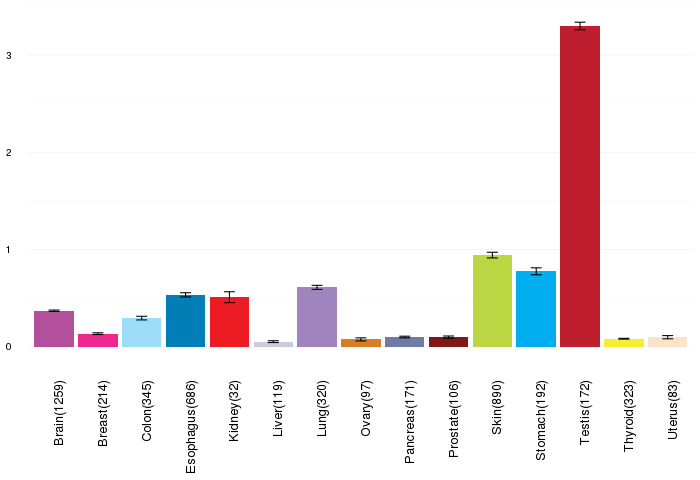
| Gene expressions across normal tissues of GTEx data (GTEx GTEx_Analysis_v6_RNA-seq_RNA-SeQCv1.1.8_gene_rpkm.gct) - Here, we shows the matched tissue types only among our 28 cancer types. |
 |
| Different expressions across 14 cancer types with more than 10 samples between matched tumors and normals (X-axis: cancer type and Y-axis: log2(norm_counts+1)) (TCGA IlluminaHiSeq_RNASeqV2, pan-cancer normalized log2(norm_counts+1) data, version 2016-08-16) |
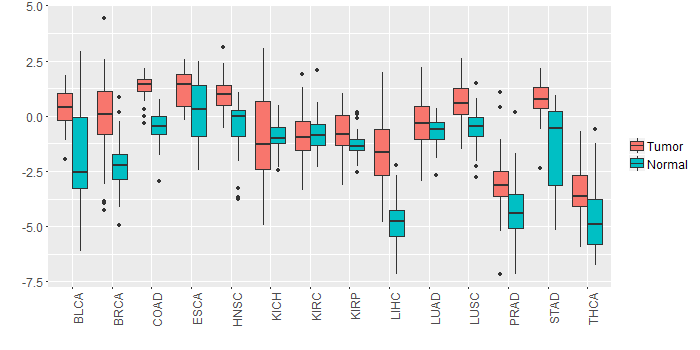 |
| - Significantly differentially expressed cancer types and information. (|Fold change|>1 and FDR<0.05) |
| Cancer type | Mean(exp) in tumor | Mean(exp) in matched normal | Log2FC | P-val. | FDR |
| PRAD | -2.998508069 | -4.349084992 | 1.350576923 | 1.13E-06 | 7.91E-06 |
| BRCA | 0.082222869 | -2.250857833 | 2.333080702 | 3.34E-34 | 5.90E-33 |
| STAD | 0.696199623 | -1.372831627 | 2.06903125 | 4.15E-06 | 5.46E-05 |
| LUSC | 0.621139329 | -0.548954788 | 1.170094118 | 1.11E-10 | 4.17E-10 |
| LIHC | -1.634981377 | -4.836249377 | 3.201268 | 3.48E-20 | 2.21E-18 |
| THCA | -3.427903343 | -4.682513512 | 1.254610169 | 3.70E-07 | 1.49E-06 |
| COAD | 1.2702477 | -0.485148453 | 1.755396154 | 6.41E-12 | 1.35E-10 |
| HNSC | 0.981528112 | -0.392471888 | 1.374 | 9.69E-09 | 1.19E-07 |
| BLCA | 0.286548308 | -2.179656955 | 2.466205263 | 0.000221 | 0.002118552 |
| Top |
| TissGene-miRNA for DIAPH3 |
| Significantly anti-correlated miRNAs of TissGene across 28 cancer types (Gene-miRNA relations from TargetScanHuman Relsease 7.1, Conserved_Site_Context_Scores.txt.zip, 06.01.2016) (TCGA IlluminaHiSeq_miRNASeq, log2(RPM+1) data, version 2016-11-21) (TCGA IlluminaHiSeq_RNASeqV2, log2(normalized_count+1) data, version 2016-08-16) (Spearman’s Rank Correlation (p-value<0.05 and coefficient<-0.25)) |
| Cancer type | miRNA id | miRNA accession | P-val. | Coeff. | # samples |
| Top |
| TissGeneMut for DIAPH3 |
| TissGeneSNV for DIAPH3 |
| nsSNV counts per each loci. Different colors of circles represent different cancer types. Circle size denotes number of samples. (TCGA somatic mutation (SNPs and small INDELs) data, version 2016-04-25) * Click on the image to enlarge it in a new window. |
 |
 |
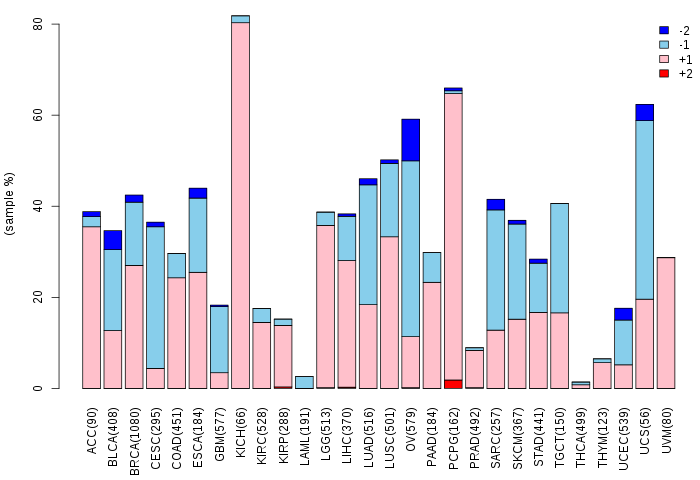
| Somatic nucleotide variants of TissGene across 28 cancer types (X-axis: cancer type and Y-axis: % of mutated samples) The numbers in parentheses are numbers of samples with mutation (nsSNVs). (TCGA somatic mutation (SNPs and small INDELs) data, version 2016-04-25) |
 |
| - nsSNVs sorted by frequency. |
| AAchange | Cancer type | # samples |
| p.P1181L | SKCM | 2 |
| p.R1089W | UCEC | 2 |
| p.E1153K | BLCA | 1 |
| p.R1191Q | KICH | 1 |
| p.H1143Y | LUAD | 1 |
| p.P941S | SKCM | 1 |
| p.E972K | UCEC | 1 |
| p.N1064I | UCEC | 1 |
| p.E463K | SKCM | 1 |
| p.R1042H | UCEC | 1 |
| p.I345F | KIRP | 1 |
| p.A294V | HNSC | 1 |
| p.K290T | SKCM | 1 |
| p.Q1066H | COAD | 1 |
| p.R185Q | READ | 1 |
| p.S439F | SKCM | 1 |
| p.D1063N | BRCA | 1 |
| p.H621Y | SKCM | 1 |
| p.W210C | LUAD | 1 |
| p.P636A | STAD | 1 |
| p.E829Q | CESC | 1 |
| p.P50S | SKCM | 1 |
| p.A314P | ESCA | 1 |
| p.S705L | READ | 1 |
| p.E256D | COAD | 1 |
| p.P88S | BLCA | 1 |
| p.L1171F | UCEC | 1 |
| p.V550G | SKCM | 1 |
| p.P940S | OV | 1 |
| p.I453V | PRAD | 1 |
| p.R482Q | ESCA | 1 |
| p.P611H | HNSC | 1 |
| p.G1056S | LUAD | 1 |
| p.K707N | UCEC | 1 |
| p.S866F | SKCM | 1 |
| p.E167X | READ | 1 |
| p.A283T | COAD | 1 |
| p.E891A | PRAD | 1 |
| p.A665T | ESCA | 1 |
| p.R1042C | HNSC | 1 |
| p.S603F | SKCM | 1 |
| p.Q858* | CESC | 1 |
| p.N1108S | LUAD | 1 |
| p.E430X | STAD | 1 |
| p.P348L | COAD | 1 |
| p.R731P | LIHC | 1 |
| p.S99R | THYM | 1 |
| p.D476Y | HNSC | 1 |
| p.S269N | UCEC | 1 |
| p.I629T | STAD | 1 |
| p.S704L | UCEC | 1 |
| p.R1048P | ESCA | 1 |
| p.V789M | BLCA | 1 |
| p.T1168M | STAD | 1 |
| p.G861E | SKCM | 1 |
| p.A12V | HNSC | 1 |
| p.K233Q | UCEC | 1 |
| p.G861R | UCEC | 1 |
| p.E1051* | UCEC | 1 |
| p.T350I | LUSC | 1 |
| p.R200Q | LUAD | 1 |
| p.E972K | STAD | 1 |
| p.D872Y | CHOL | 1 |
| p.P615T | BLCA | 1 |
| p.E1014D | UCEC | 1 |
| p.K707T | UCEC | 1 |
| p.R731W | LGG | 1 |
| p.N92T | LUSC | 1 |
| p.M821V | SKCM | 1 |
| p.K115E | KIRP | 1 |
| p.P379H | SKCM | 1 |
| p.L196M | STAD | 1 |
| p.L1170R | UCEC | 1 |
| p.K104E | KIRP | 1 |
| p.A104S | PAAD | 1 |
| p.L441R | STAD | 1 |
| p.R367H | HNSC | 1 |
| p.P350L | SKCM | 1 |
| p.V86L | SKCM | 1 |
| p.H884Y | SKCM | 1 |
| p.I644M | LUAD | 1 |
| p.V1103F | LUAD | 1 |
| p.I982R | BLCA | 1 |
| p.V35I | COAD | 1 |
| p.R1191X | LIHC | 1 |
| p.P941L | SKCM | 1 |
| p.E430* | STAD | 1 |
| p.R144L | LUAD | 1 |
| p.P822S | SKCM | 1 |
| p.R1089W | UCS | 1 |
| p.N650H | STAD | 1 |
| p.R172Q | UCEC | 1 |
| p.S334* | SKCM | 1 |
| p.G40S | SKCM | 1 |
| p.P590A | ACC | 1 |
| p.T917M | LIHC | 1 |
| p.P940S | SKCM | 1 |
| p.L1090P | SKCM | 1 |
| p.N112K | GBM | 1 |
| p.E711* | UCEC | 1 |
| p.P820L | COAD | 1 |
| p.E784K | LUAD | 1 |
| p.P613L | SKCM | 1 |
| p.P596H | STAD | 1 |
| p.S103L | HNSC | 1 |
| p.C341F | LUAD | 1 |
| p.V246F | LUAD | 1 |
| p.E1115* | STAD | 1 |
| p.L883I | ESCA | 1 |
| p.F997I | OV | 1 |
| p.C890Y | ESCA | 1 |
| p.P327A | ACC | 1 |
| p.P564S | GBM | 1 |
| p.M558V | SKCM | 1 |
| p.K637N | UCEC | 1 |
| p.E248X | READ | 1 |
| p.G166R | HNSC | 1 |
| p.P1085L | SKCM | 1 |
| p.V295L | BLCA | 1 |
| p.R855W | UCEC | 1 |
| p.E182* | LUAD | 1 |
| p.L1136P | SKCM | 1 |
| p.K94N | UCEC | 1 |
| p.E829D | UCEC | 1 |
| p.V813G | SKCM | 1 |
| p.Q928H | HNSC | 1 |
| p.E504G | LUAD | 1 |
| p.A433T | UCEC | 1 |
| p.L512P | ESCA | 1 |
| p.Q924* | STAD | 1 |
| p.F658L | SKCM | 1 |
| p.S573L | CESC | 1 |
| p.D614N | SKCM | 1 |
| p.P615L | SKCM | 1 |
| p.R472I | UCEC | 1 |
| p.E995K | SKCM | 1 |
| p.E828K | UCEC | 1 |
| p.I709V | LUAD | 1 |
| p.E639* | UCEC | 1 |
| p.N283K | KIRC | 1 |
| p.S30F | READ | 1 |
| p.P626S | BRCA | 1 |
| p.I150M | LUSC | 1 |
| p.E735* | LUAD | 1 |
| p.Q924K | DLBC | 1 |
| p.L804V | CESC | 1 |
| p.V349L | SKCM | 1 |
| p.N1122S | BRCA | 1 |
| p.Q257_splice | LUSC | 1 |
| p.D877N | SKCM | 1 |
| p.F179S | LIHC | 1 |
| p.P642H | SKCM | 1 |
| p.D763N | THYM | 1 |
| p.E394K | UCEC | 1 |
| p.K55Q | READ | 1 |
| p.E683D | HNSC | 1 |
| p.I320N | ESCA | 1 |
| p.A76D | ESCA | 1 |
| p.Q721K | CHOL | 1 |
| p.A500S | UCEC | 1 |
| p.D698G | HNSC | 1 |
| p.P1085S | SKCM | 1 |
| p.V624I | COAD | 1 |
| p.R1098W | BLCA | 1 |
| p.C687F | LUAD | 1 |
| p.R1089L | LIHC | 1 |
| p.P577S | HNSC | 1 |
| Top |
| TissGeneCNV for DIAPH3 |
| Copy number variations of TissGene across 28 cancer types (X-axis: cancer type and Y-axis: % of CNV samples) (TCGA Gistic2_CopyNumber_Gistic2_all_data_by_genes, Gistic2 copy number data, version 2016-08-16) |
 |
| Top |
| TissGeneFusions for DIAPH3 |
| Fusion genes including TissGene (ChimerDB 3.0, 2016-12-01 and TCGA fusion Portal 2015-12-01) |
| Database | Src | Cancer type | Sample | Fusion gene | ORF | 5'-gene BP | 3'-gene BP |
| Chimerdb3.0 | ChiTaRs | NA | AW665284 | TXN2-DIAPH3 | chr22:36863639 | chr13:60686261 | |
| Chimerdb3.0 | ChiTaRs | NA | BF335440 | R3HDML-DIAPH3 | chr20:42973885 | chr13:60411837 | |
| Chimerdb3.0 | ChiTaRs | NA | AA947531 | DIAPH3-DIAPH3 | chr13:60240112 | chr13:60240106 | |
| Chimerdb3.0 | ChiTaRs | NA | BF335408 | R3HDML-DIAPH3 | chr20:42973885 | chr13:60411846 | |
| Chimerdb3.0 | ChiTaRs | NA | BU960336 | DIAPH3-DIAPH3 | chr13:60348906 | chr13:60348315 | |
| Chimerdb3.0 | FusionScan | PRAD | TCGA-KK-A59V-01A | DIAPH3-DOK5 | Out-of-Frame | chr13:60582677 | chr20:53266953 |
| Chimerdb3.0 | FusionScan | BRCA | TCGA-AN-A0FY-01A | DIAPH3-TDRD3 | In-Frame | chr13:60667761 | chr13:61141658 |
| TCGAfusionPortal | PRADA | BRCA | TCGA-AN-A0FY-01A | TDRD3-DIAPH3 | In-frame | Chr13:61084889 | Chr13:60499004 |
| TCGAfusionPortal | PRADA | BRCA | TCGA-AN-A0FY-01A | DIAPH3-TDRD3 | In-frame | Chr13:60667762 | Chr13:61141659 |
| TCGAfusionPortal | PRADA | KIRC | TCGA-BP-4173-01A | PCCA-DIAPH3 | In-frame | Chr13:100861717 | Chr13:60616954 |
| Top |
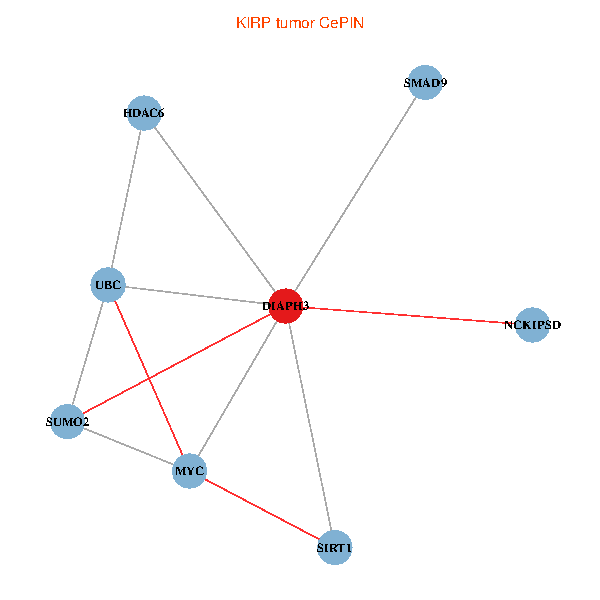
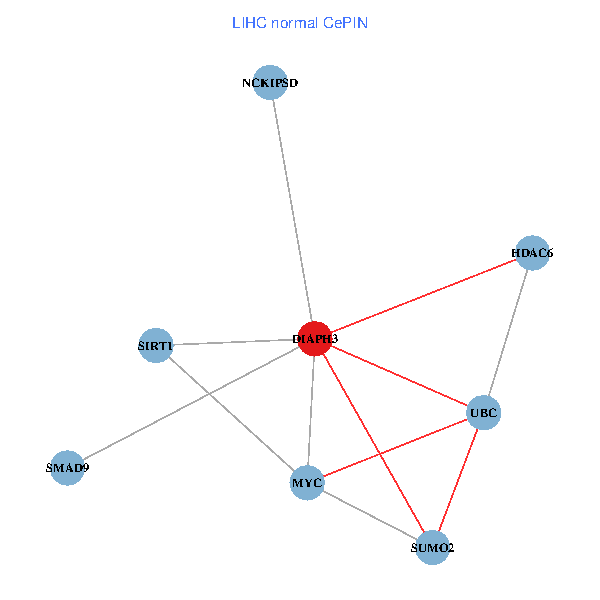
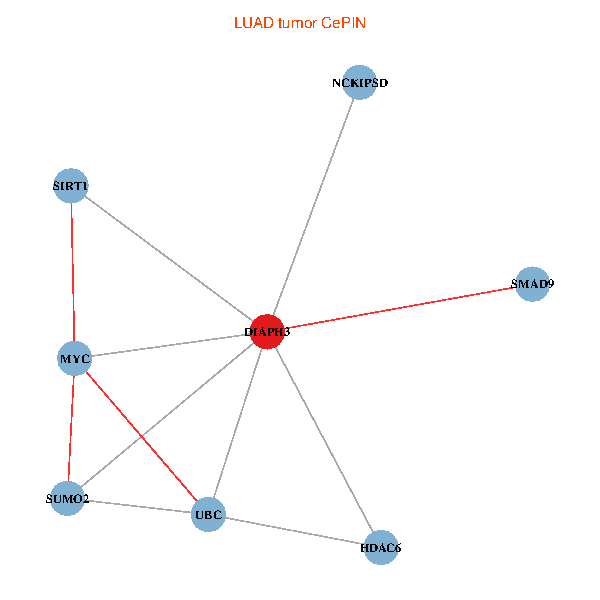
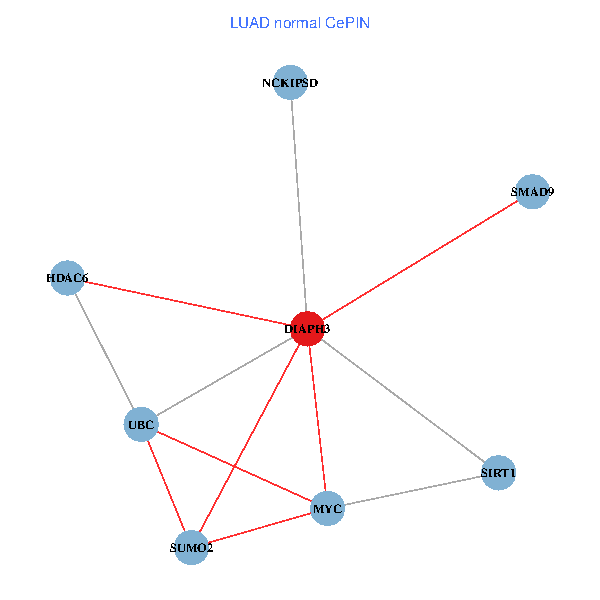
| TissGeneNet for DIAPH3 |
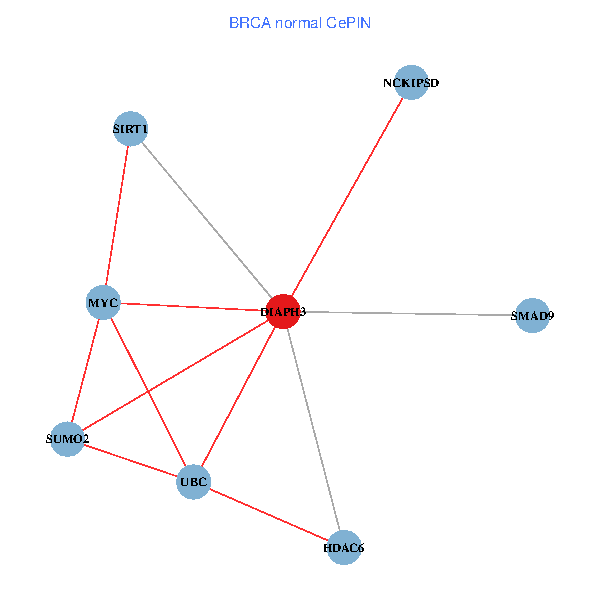
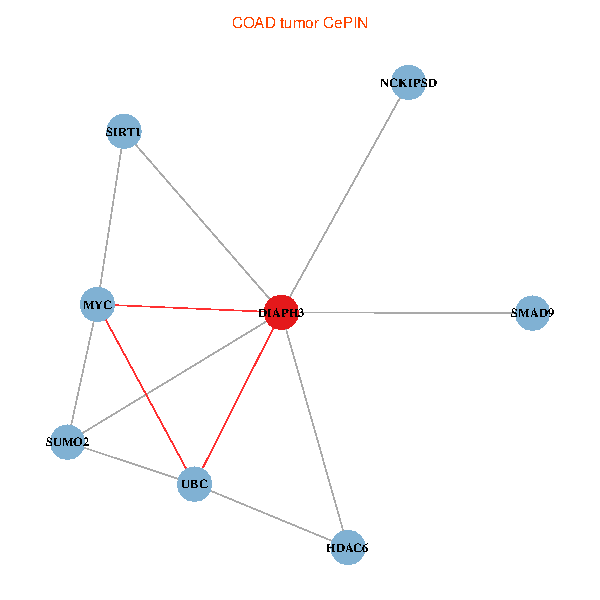
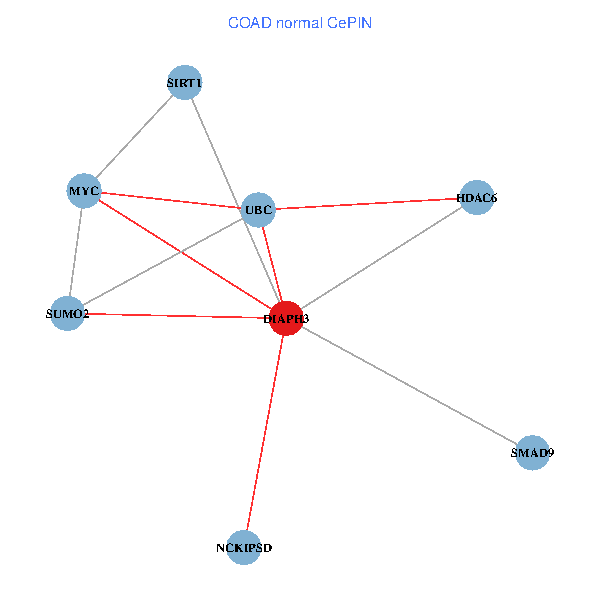
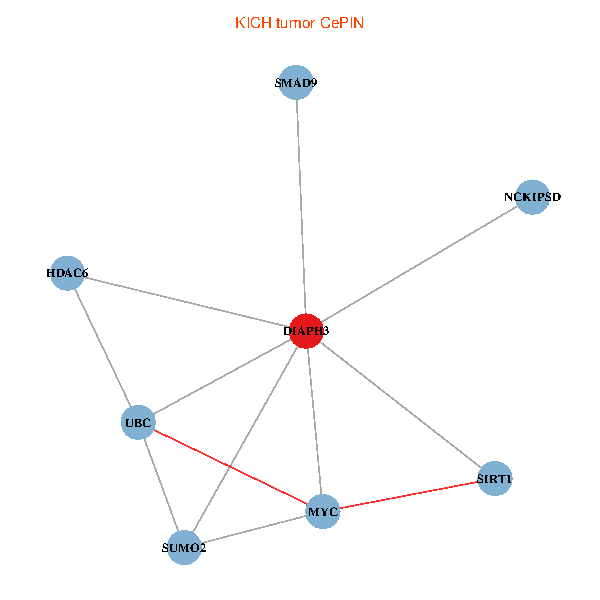
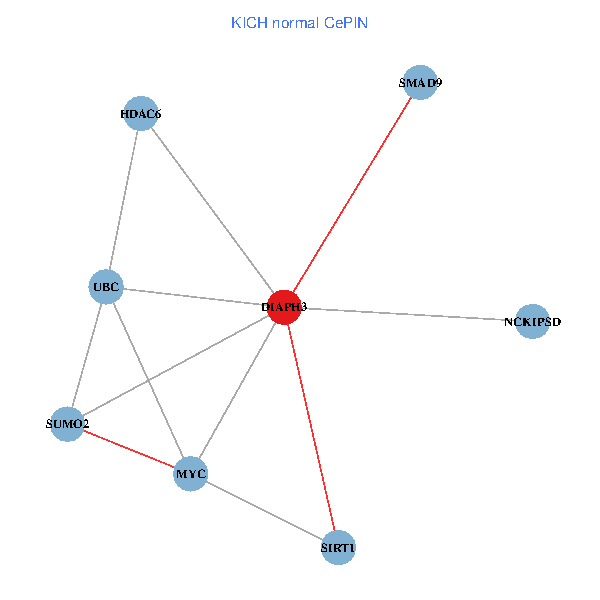
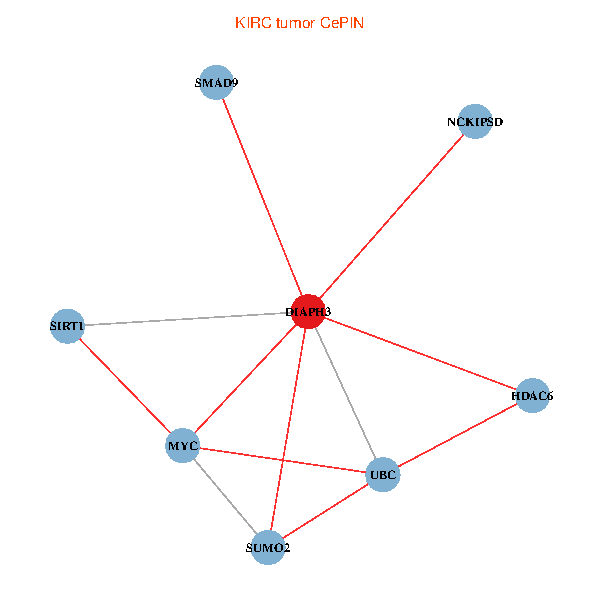
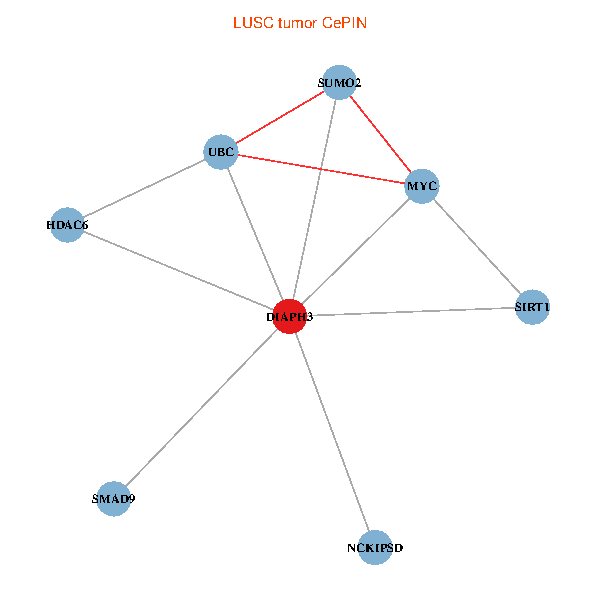
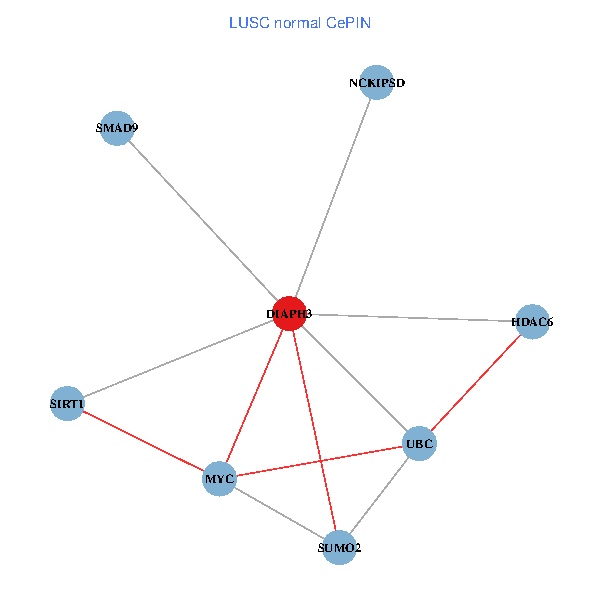
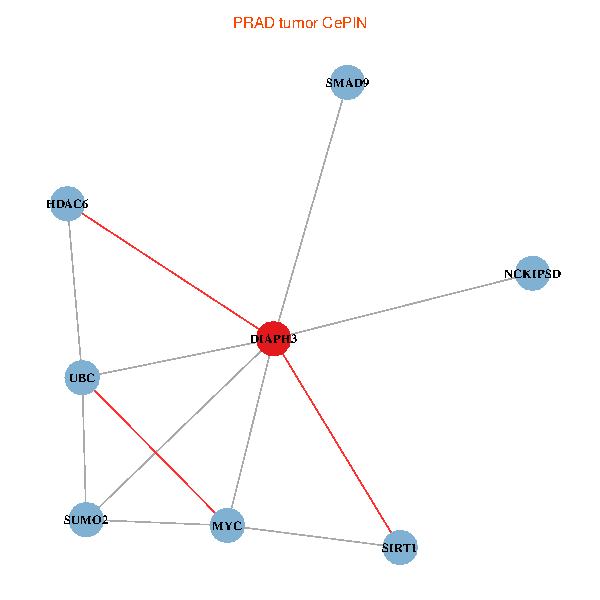
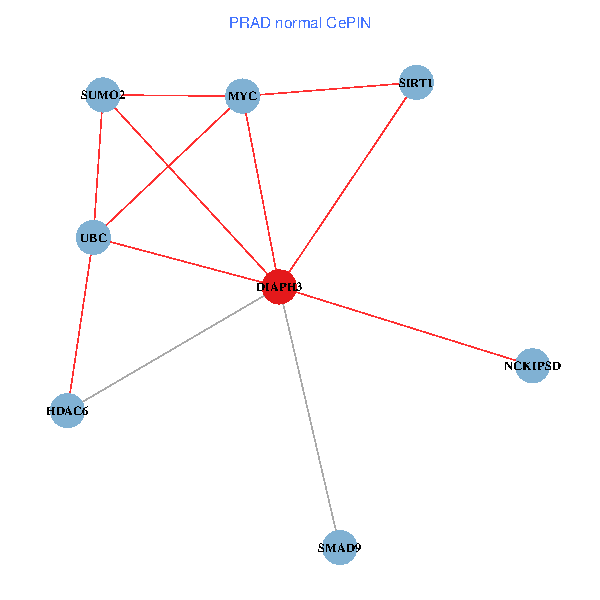
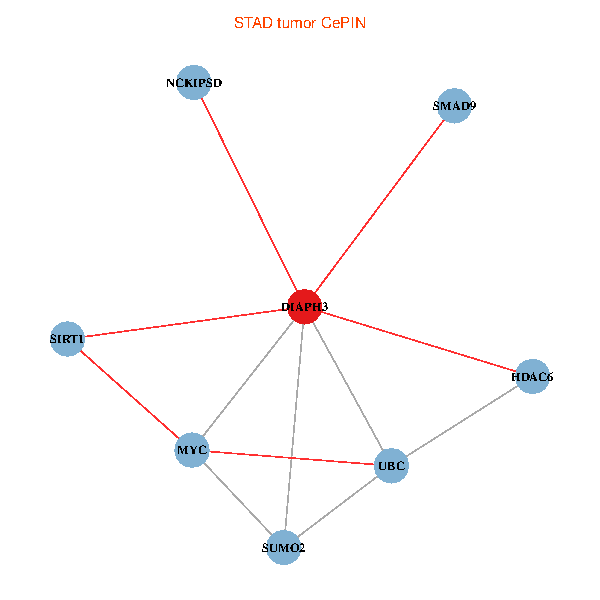
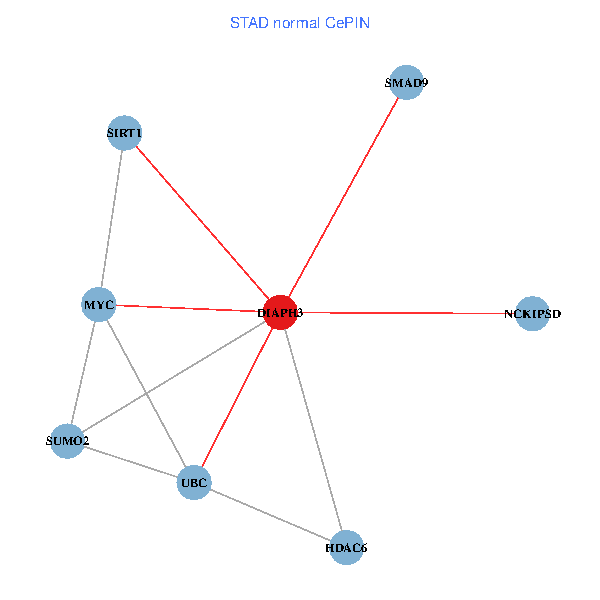
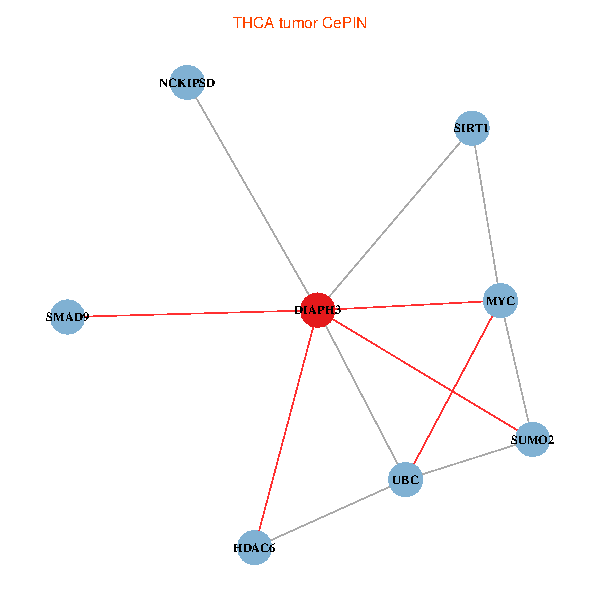
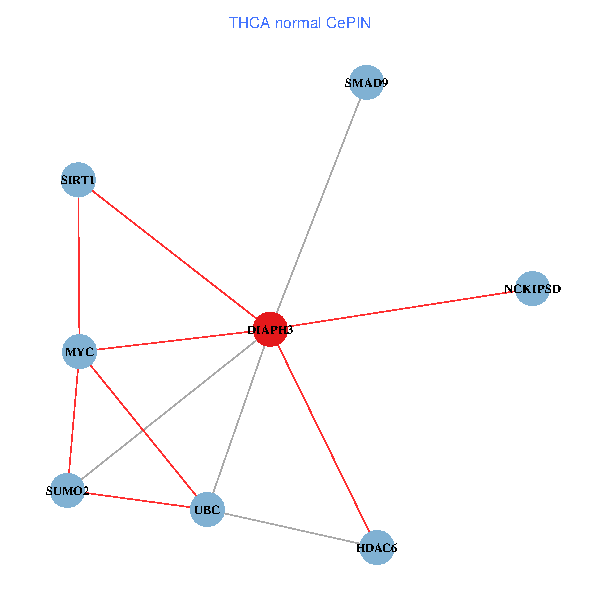
| Co-expressed gene networks based on protein-protein interaction data (CePIN) (TCGA IlluminaHiSeq_RNASeqV2, pan-cancer normalized log2(norm_counts+1) data, version 2016-08-16) (PINA2 ppi data) |
| BRCA (tumor) | BRCA (normal) |
| DIAPH3, UBC, SUMO2, HDAC6, MYC, NCKIPSD, SIRT1, SMAD9 (tumor) | DIAPH3, UBC, SUMO2, HDAC6, MYC, NCKIPSD, SIRT1, SMAD9 (normal) |
 |  |
| COAD (tumor) | COAD (normal) |
| DIAPH3, UBC, SUMO2, HDAC6, MYC, NCKIPSD, SIRT1, SMAD9 (tumor) | DIAPH3, UBC, SUMO2, HDAC6, MYC, NCKIPSD, SIRT1, SMAD9 (normal) |
 |  |
| HNSC (tumor) | HNSC (normal) |
| DIAPH3, UBC, SUMO2, HDAC6, MYC, NCKIPSD, SIRT1, SMAD9 (tumor) | DIAPH3, UBC, SUMO2, HDAC6, MYC, NCKIPSD, SIRT1, SMAD9 (normal) |
 |  |
| KICH (tumor) | KICH (normal) |
| DIAPH3, UBC, SUMO2, HDAC6, MYC, NCKIPSD, SIRT1, SMAD9 (tumor) | DIAPH3, UBC, SUMO2, HDAC6, MYC, NCKIPSD, SIRT1, SMAD9 (normal) |
 |  |
| KIRC (tumor) | KIRC (normal) |
| DIAPH3, UBC, SUMO2, HDAC6, MYC, NCKIPSD, SIRT1, SMAD9 (tumor) | DIAPH3, UBC, SUMO2, HDAC6, MYC, NCKIPSD, SIRT1, SMAD9 (normal) |
 |  |
| KIRP (tumor) | KIRP (normal) |
| DIAPH3, UBC, SUMO2, HDAC6, MYC, NCKIPSD, SIRT1, SMAD9 (tumor) | DIAPH3, UBC, SUMO2, HDAC6, MYC, NCKIPSD, SIRT1, SMAD9 (normal) |
 |  |
| LIHC (tumor) | LIHC (normal) |
| DIAPH3, UBC, SUMO2, HDAC6, MYC, NCKIPSD, SIRT1, SMAD9 (tumor) | DIAPH3, UBC, SUMO2, HDAC6, MYC, NCKIPSD, SIRT1, SMAD9 (normal) |
 |  |
| LUAD (tumor) | LUAD (normal) |
| DIAPH3, UBC, SUMO2, HDAC6, MYC, NCKIPSD, SIRT1, SMAD9 (tumor) | DIAPH3, UBC, SUMO2, HDAC6, MYC, NCKIPSD, SIRT1, SMAD9 (normal) |
 |  |
| LUSC (tumor) | LUSC (normal) |
| DIAPH3, UBC, SUMO2, HDAC6, MYC, NCKIPSD, SIRT1, SMAD9 (tumor) | DIAPH3, UBC, SUMO2, HDAC6, MYC, NCKIPSD, SIRT1, SMAD9 (normal) |
 |  |
| PRAD (tumor) | PRAD (normal) |
| DIAPH3, UBC, SUMO2, HDAC6, MYC, NCKIPSD, SIRT1, SMAD9 (tumor) | DIAPH3, UBC, SUMO2, HDAC6, MYC, NCKIPSD, SIRT1, SMAD9 (normal) |
 |  |
| STAD (tumor) | STAD (normal) |
| DIAPH3, UBC, SUMO2, HDAC6, MYC, NCKIPSD, SIRT1, SMAD9 (tumor) | DIAPH3, UBC, SUMO2, HDAC6, MYC, NCKIPSD, SIRT1, SMAD9 (normal) |
 |  |
| THCA (tumor) | THCA (normal) |
| DIAPH3, UBC, SUMO2, HDAC6, MYC, NCKIPSD, SIRT1, SMAD9 (tumor) | DIAPH3, UBC, SUMO2, HDAC6, MYC, NCKIPSD, SIRT1, SMAD9 (normal) |
 |  |
| Top |
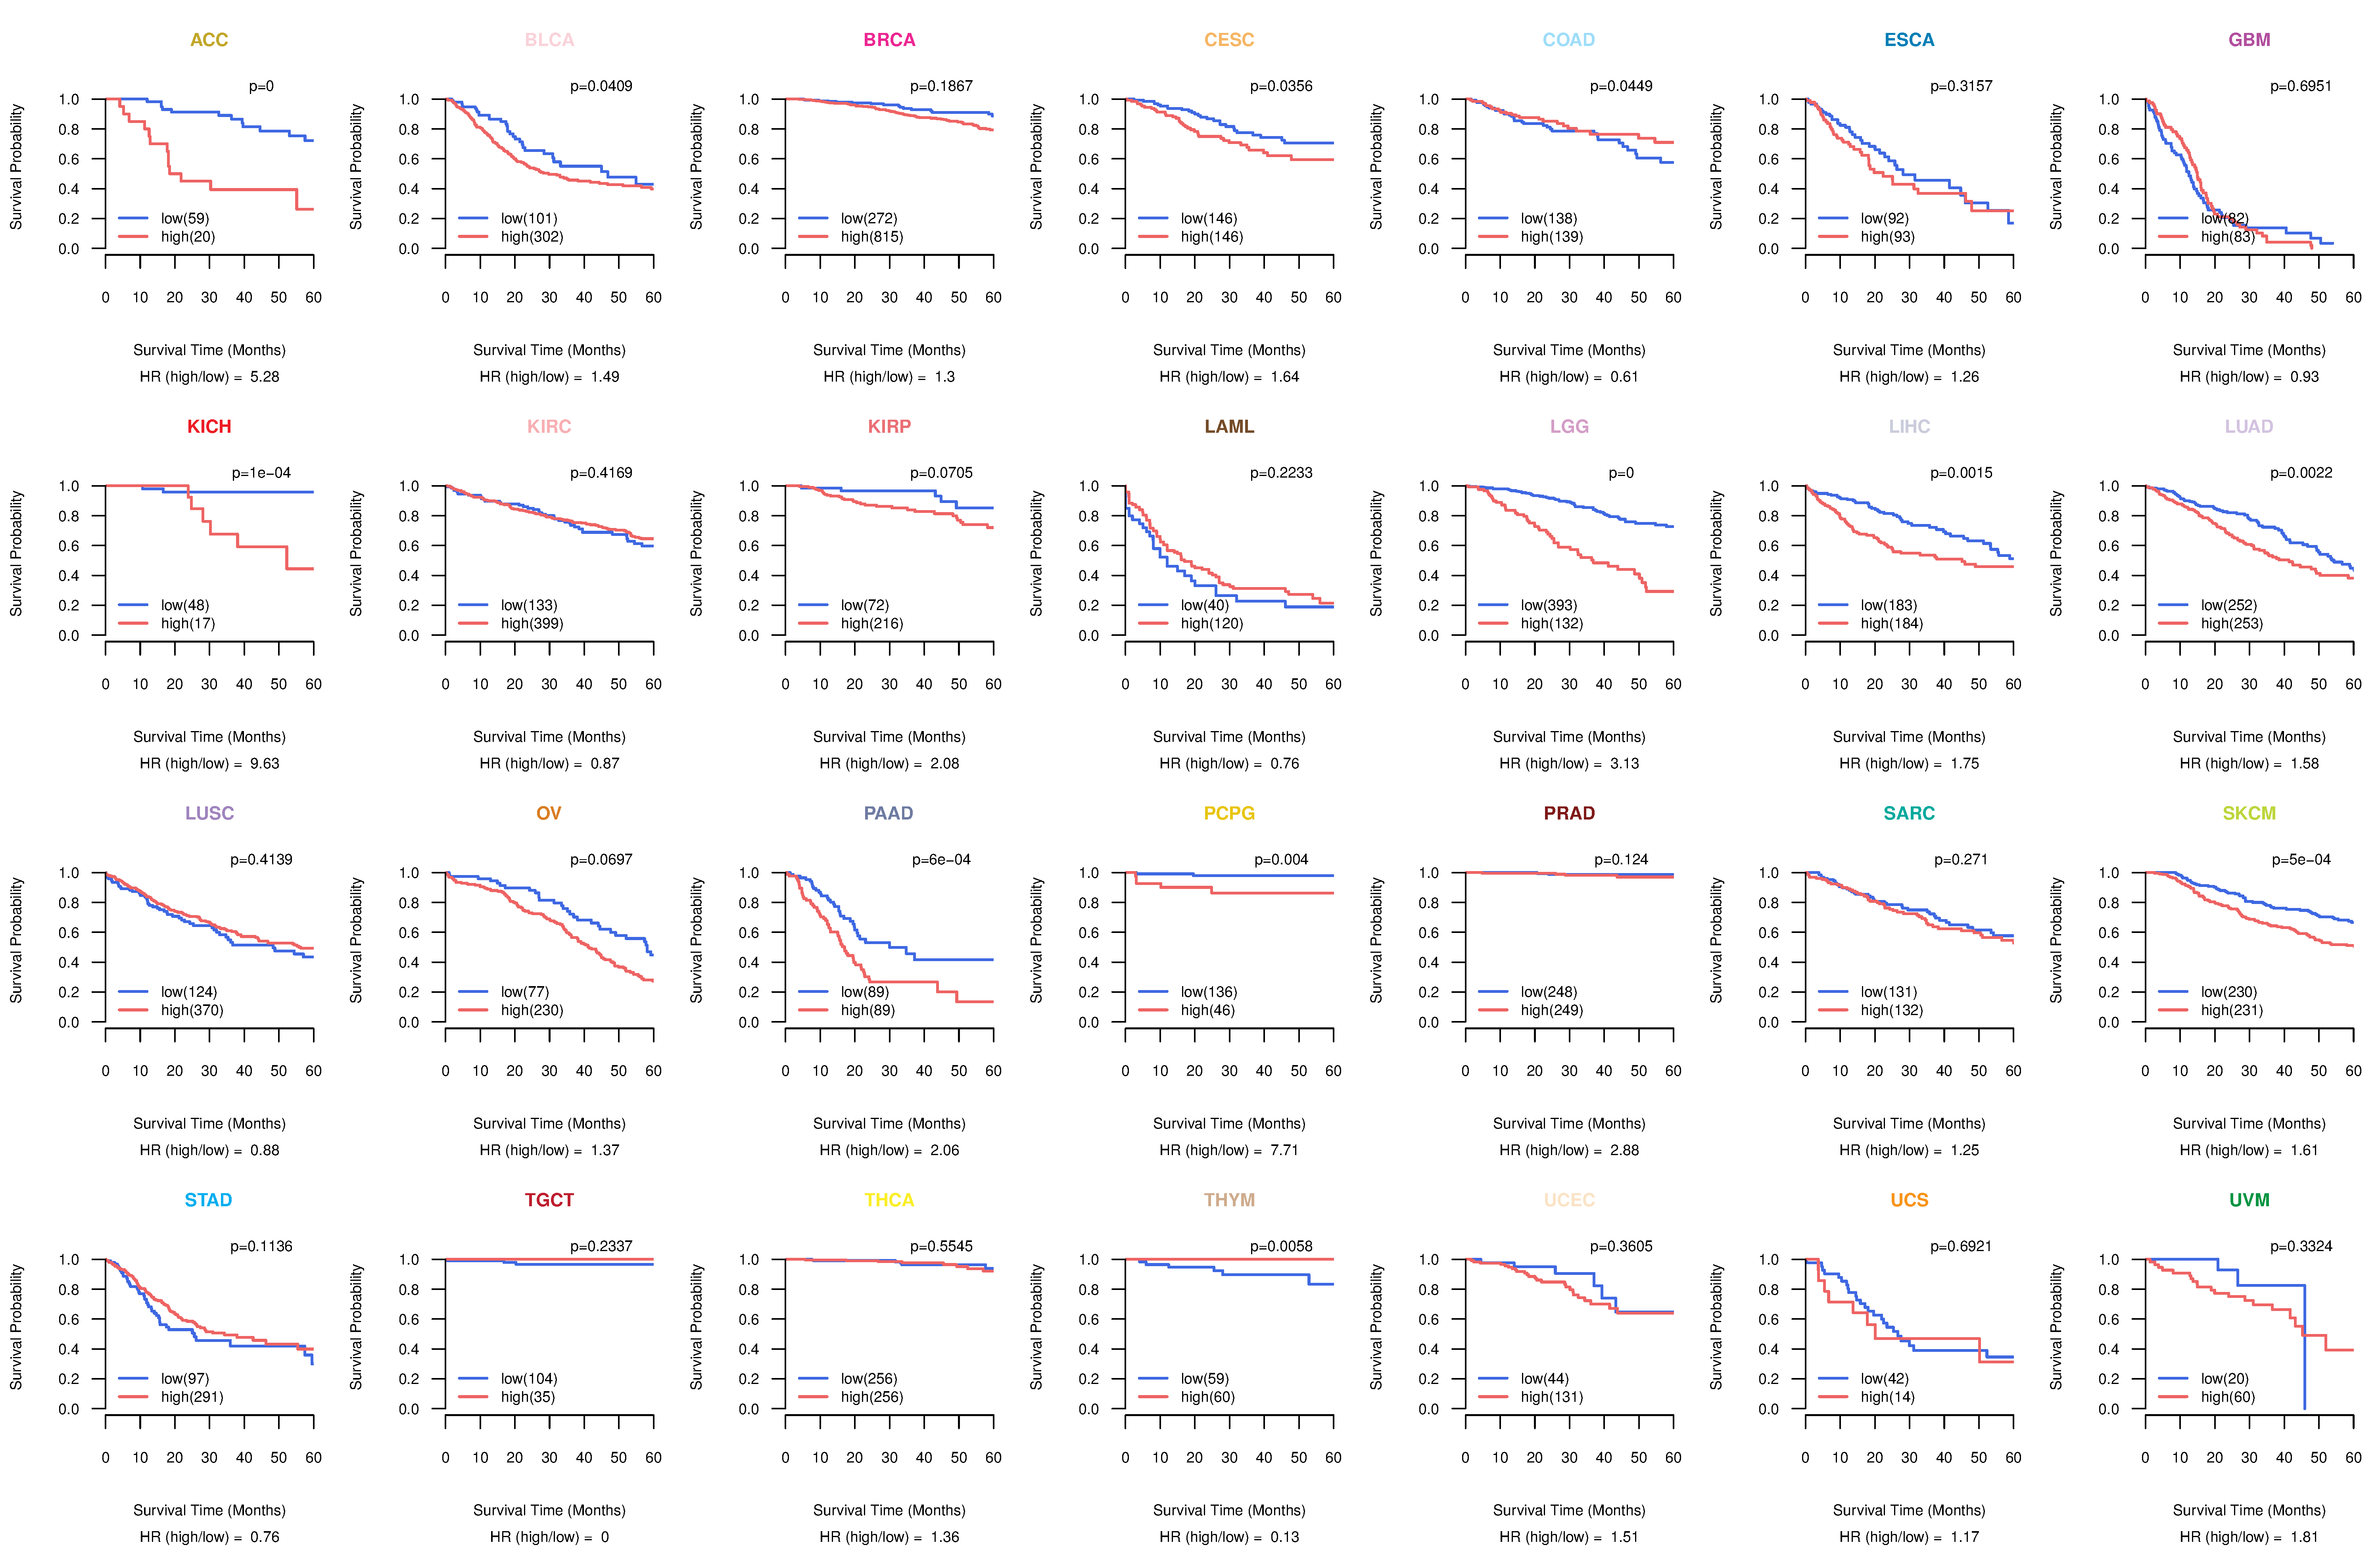
| TissGeneProg for DIAPH3 |
| Kaplan-Meier plots with logrank tests of overall survival (OS) using 28 cancer types (TCGA IlluminaHiSeq_RNASeqV2, pan-cancer normalized log2(norm_counts+1) data, version 2016-08-16) (TCGA clinicalMatrix, phenotype data, version 2016-04-27) * Click on the image to enlarge it in a new window. |
 |
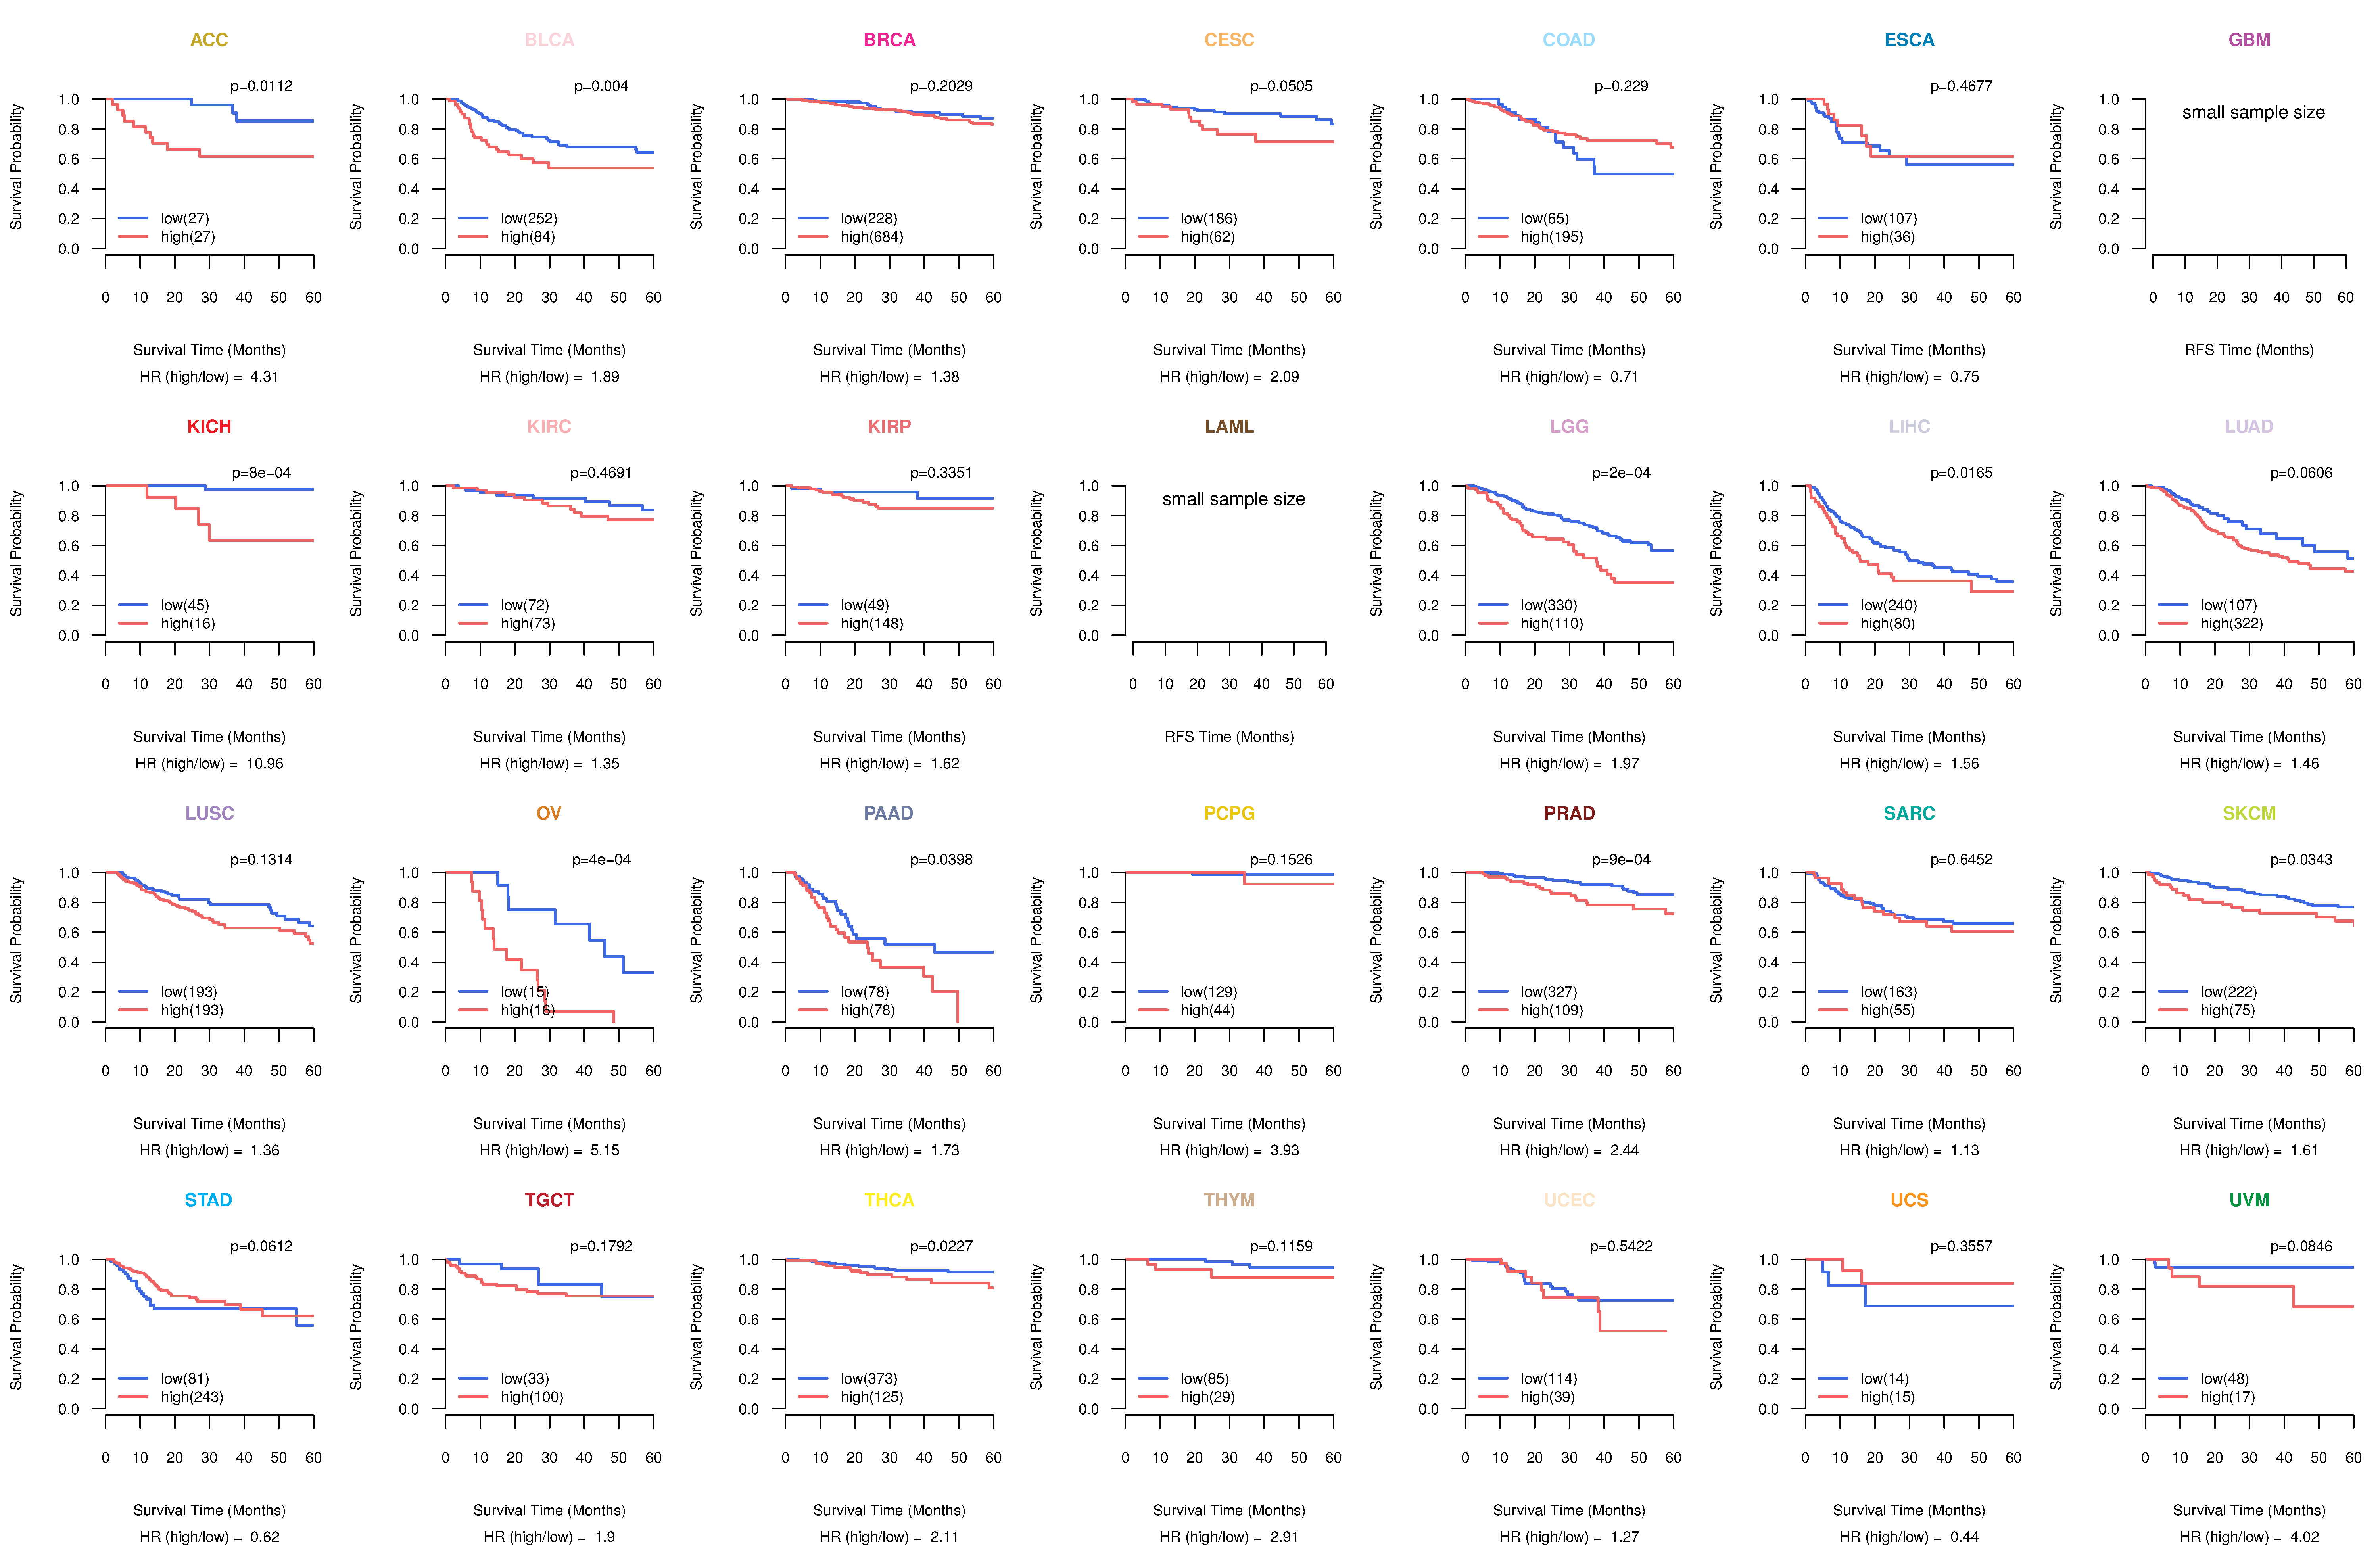
| Kaplan-Meier plots with logrank test of relapse free survival (RFS) using 28 cancer types (TCGA IlluminaHiSeq_RNASeqV2, pan-cancer normalized log2(norm_counts+1) data, version 2016-08-16) (TCGA clinicalMatrix, phenotype data, version 2016-04-27) * Click on the image enlarge it in a new window. |
 |
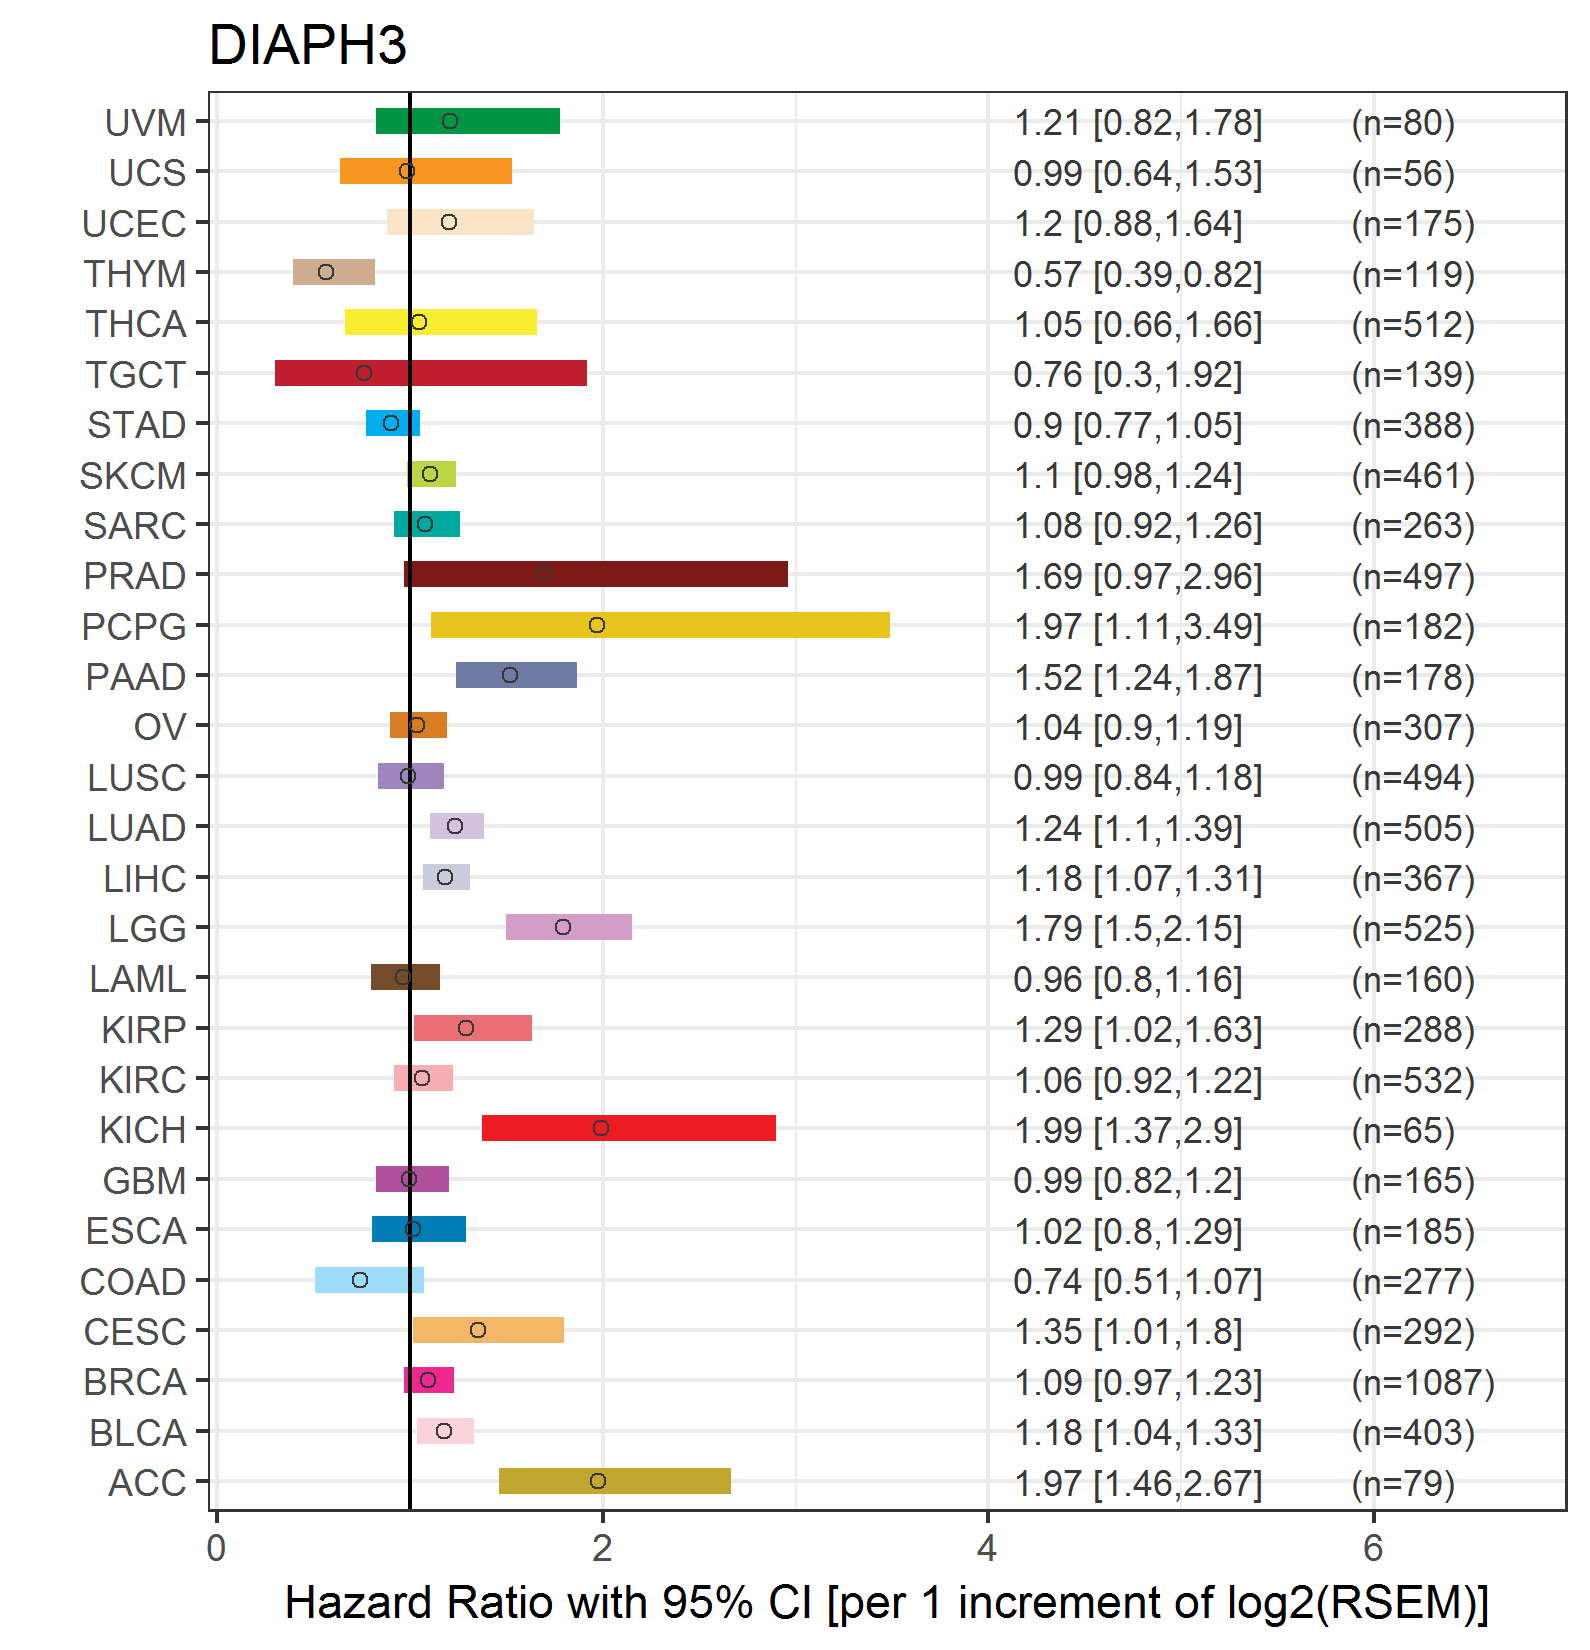
| Forest plot of Cox proportional hazard ratio (HR) and 95% CI of overall survival (OS) using 28 cancer types (TCGA IlluminaHiSeq_RNASeqV2, pan-cancer normalized log2(norm_counts+1) data, version 2016-08-16) (TCGA clinicalMatrix, phenotype data, version 2016-04-27) * Click on the image enlarge it in a new window. |
 |
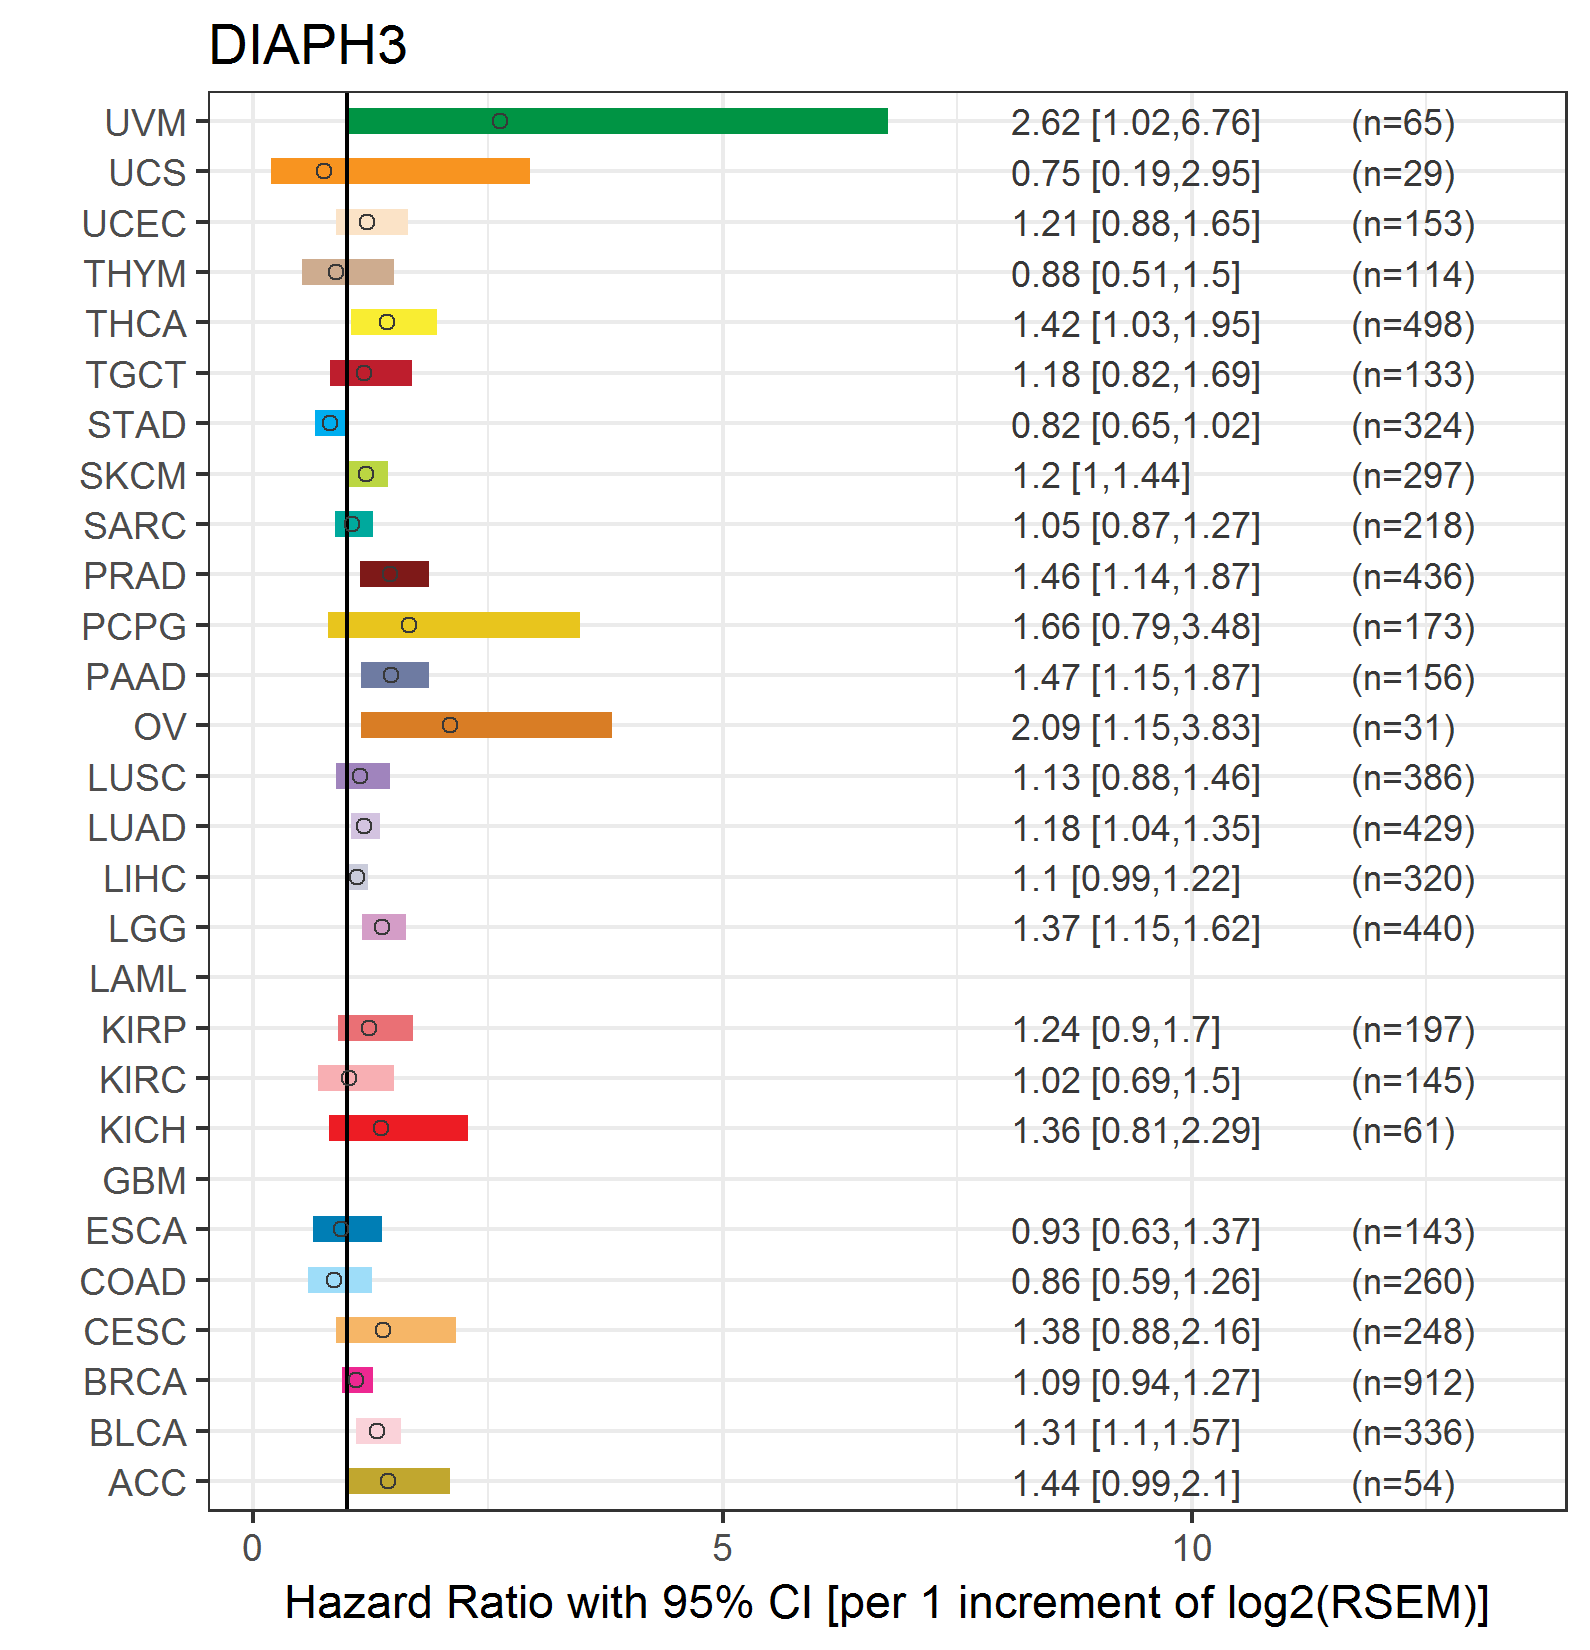
| Forest plot of Cox proportional hazard ratio (HR) and 95% CI of relapse free survival (RFS) using 28 cancer types (TCGA IlluminaHiSeq_RNASeqV2, pan-cancer normalized log2(norm_counts+1) data, version 2016-08-16) (TCGA clinicalMatrix, phenotype data, version 2016-04-27) * Click on the image enlarge it in a new window. |
 |
| Top |
| TissGeneClin for DIAPH3 |
| TissGeneDrug for DIAPH3 |
| Drug information targeting TissGene (DrugBank Version 5.0.6, 2017-04-01) |
| DrugBank ID | Drug name | Drug activity | Drug type | Drug status |
| Top |
| TissGeneDisease for DIAPH3 |
| Disease information associated with TissGene (DisGeNet, 2016-06-01) |
| Disease ID | Disease name | # pubmeds | Source |
| umls:C0027627 | Neoplasm Metastasis | 2 | BeFree |
| umls:C1852271 | Auditory neuropathy | 2 | BeFree |
| umls:C0004352 | Autistic Disorder | 1 | BeFree |
| umls:C0029925 | Ovarian Carcinoma | 1 | BeFree |
| umls:C0155552 | Hearing Loss, Mixed Conductive-Sensorineural | 1 | BeFree |
| umls:C0178874 | Tumor Progression | 1 | BeFree |
| umls:C0677886 | Epithelial ovarian cancer | 1 | BeFree |
| umls:C0936223 | Metastatic Prostate Carcinoma | 1 | BeFree |
| umls:C1140680 | Malignant neoplasm of ovary | 1 | BeFree |
| umls:C1836743 | AUDITORY NEUROPATHY, AUTOSOMAL DOMINANT, 1 | 0 | CLINVAR,CTD_human,MGD |
|
Copyright 2016-Present - The University of Texas Health Science Center at Houston (UTHealth) Web File Viewing | How to Report, Fraud, Waste and Abuse | State of Texas | Statewide Search | Texas Homeland Security | Site Policies |