 |
| |
| |
| |
| |
| |
| |
|

| TissGeneSummary for APH1B |
 Gene summary Gene summary |
| Basic gene information | Gene symbol | APH1B |
| Gene name | APH1B gamma secretase subunit | |
| Synonyms | APH-1B|PRO1328|PSFL|TAAV688 | |
| Cytomap | UCSC genome browser: 15q22.2 | |
| Type of gene | protein-coding | |
| RefGenes | NM_001145646.1, NM_031301.3, | |
| Description | anterior pharynx defective 1 homolog Baph-1betagamma-secretase subunit APH-1B | |
| Modification date | 20141207 | |
| dbXrefs | MIM : 607630 | |
| HGNC : HGNC | ||
| Ensembl : ENSG00000138613 | ||
| HPRD : 06361 | ||
| Vega : OTTHUMG00000132863 | ||
| Protein | UniProt: go to UniProt's Cross Reference DB Table | |
| Expression | CleanEX: HS_APH1B | |
| BioGPS: 83464 | ||
| Pathway | NCI Pathway Interaction Database: APH1B | |
| KEGG: APH1B | ||
| REACTOME: APH1B | ||
| Pathway Commons: APH1B | ||
| Context | iHOP: APH1B | |
| ligand binding site mutation search in PubMed: APH1B | ||
| UCL Cancer Institute: APH1B | ||
| Assigned class in TissGDB* | C | |
| Included tissue-specific gene expression resources | TiGER,GTEx | |
| Specific-tissues in normal samples (assigned by TissGDB using HPA, TiGER, and GTEx) | Testis | |
| Cancer types related to the specific-tissues in cancer samples (assigned by TissGDB using TCGA) | TGCT | |
| Reference showing the relevant tissue of APH1B | ||
| Description by TissGene annotations | Cancer gene TissgsLTS | |
| * Class A consists of genes with literature evidence and is part of the cTissGenes. Class B consists of only cTissGenes without additional evidence. The remaining genes belong to Class C. |
| Gene ontology having evidence of Inferred from Direct Assay (IDA) from Entrez |
| GO ID | GO term | PubMed ID | GO:0016485 | protein processing | 12297508 | GO:0016485 | protein processing | 12297508 |
| Top |
| TissGeneExp for APH1B |
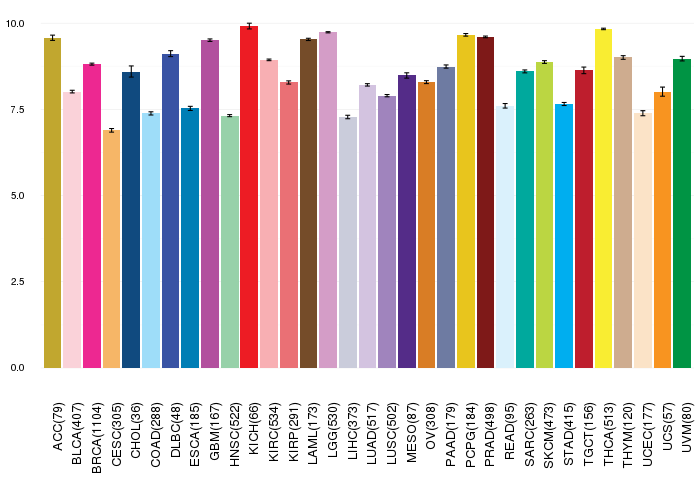
| Gene expressions across 28 cancer types (X-axis: cancer type and Y-axis: log2(norm_counts+1)) (TCGA IlluminaHiSeq_RNASeqV2, pan-cancer normalized log2(norm_counts+1) data, version 2016-08-16) |
 |
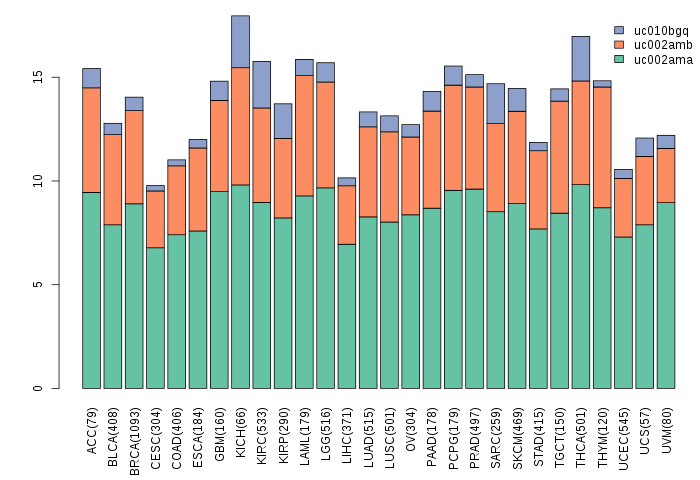
| Gene isoform expressions across 28 cancer types (X-axis: cancer type and Y-axis: log2(norm_counts+1)) (TCGA pan-cancer tcga_rsem_isoform_tpm, version 2016-09-01) |
 |
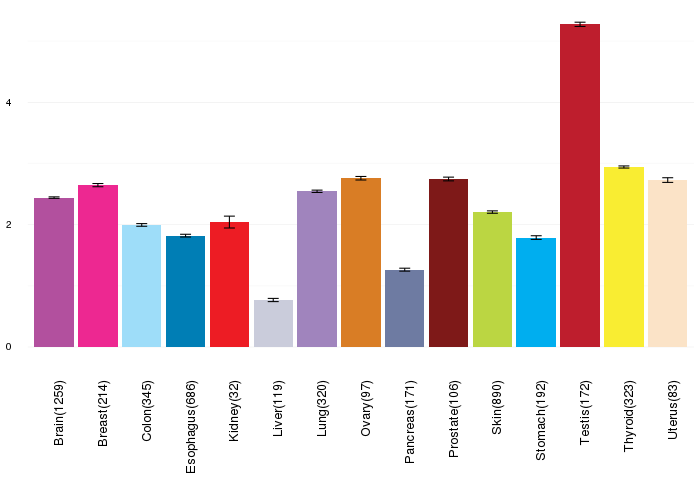
| Gene expressions across normal tissues of GTEx data (GTEx GTEx_Analysis_v6_RNA-seq_RNA-SeQCv1.1.8_gene_rpkm.gct) - Here, we shows the matched tissue types only among our 28 cancer types. |
 |
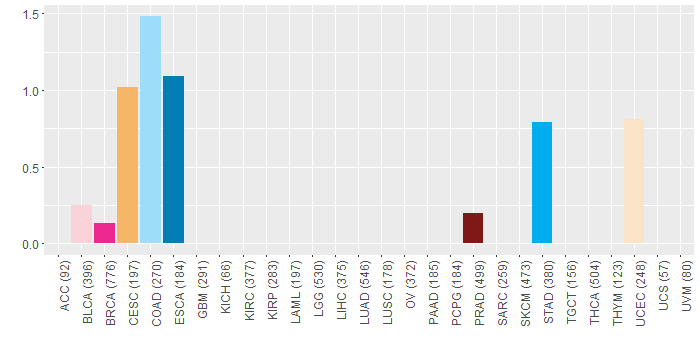
| Different expressions across 14 cancer types with more than 10 samples between matched tumors and normals (X-axis: cancer type and Y-axis: log2(norm_counts+1)) (TCGA IlluminaHiSeq_RNASeqV2, pan-cancer normalized log2(norm_counts+1) data, version 2016-08-16) |
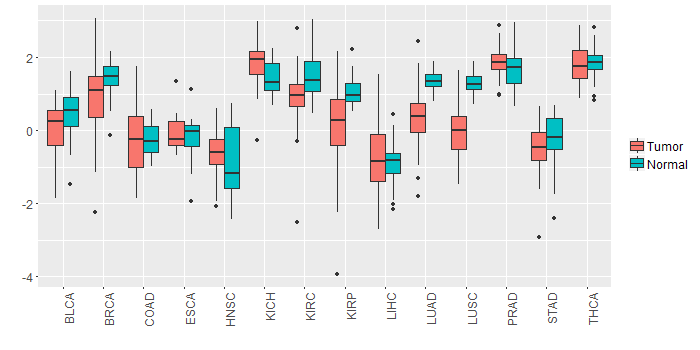 |
| - Significantly differentially expressed cancer types and information. (|Fold change|>1 and FDR<0.05) |
| Cancer type | Mean(exp) in tumor | Mean(exp) in matched normal | Log2FC | P-val. | FDR |
| LUSC | -0.078666548 | 1.287794236 | -1.366460784 | 5.77E-22 | 8.90E-21 |
| LUAD | 0.359828415 | 1.36564738 | -1.005818966 | 9.39E-14 | 8.32E-13 |
| KIRP | 0.045487251 | 1.070093501 | -1.02460625 | 9.55E-05 | 0.000327387 |
| Top |
| TissGene-miRNA for APH1B |
| Significantly anti-correlated miRNAs of TissGene across 28 cancer types (Gene-miRNA relations from TargetScanHuman Relsease 7.1, Conserved_Site_Context_Scores.txt.zip, 06.01.2016) (TCGA IlluminaHiSeq_miRNASeq, log2(RPM+1) data, version 2016-11-21) (TCGA IlluminaHiSeq_RNASeqV2, log2(normalized_count+1) data, version 2016-08-16) (Spearman’s Rank Correlation (p-value<0.05 and coefficient<-0.25)) |
| Cancer type | miRNA id | miRNA accession | P-val. | Coeff. | # samples |
| Top |
| TissGeneMut for APH1B |
| TissGeneSNV for APH1B |
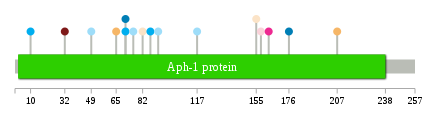
| nsSNV counts per each loci. Different colors of circles represent different cancer types. Circle size denotes number of samples. (TCGA somatic mutation (SNPs and small INDELs) data, version 2016-04-25) * Click on the image to enlarge it in a new window. |
 |
 |
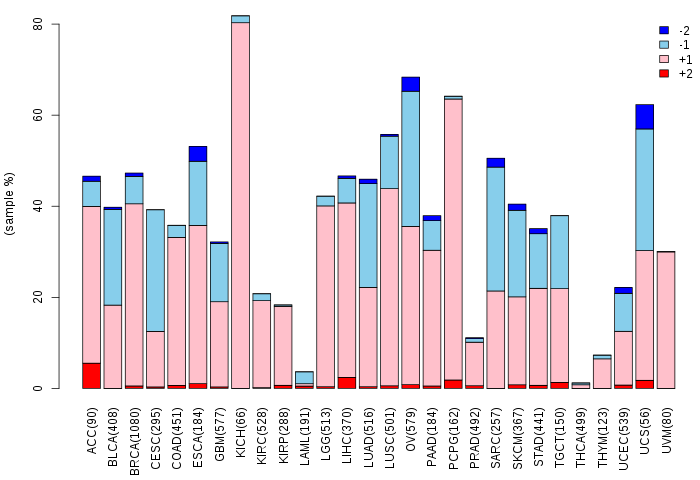
| Somatic nucleotide variants of TissGene across 28 cancer types (X-axis: cancer type and Y-axis: % of mutated samples) The numbers in parentheses are numbers of samples with mutation (nsSNVs). (TCGA somatic mutation (SNPs and small INDELs) data, version 2016-04-25) |
 |
| - nsSNVs sorted by frequency. |
| AAchange | Cancer type | # samples |
| p.F40L | READ | 1 |
| p.L71V | STAD | 1 |
| p.S49P | COAD | 1 |
| p.A117V | COAD | 1 |
| p.G65E | CESC | 1 |
| p.K92T | COAD | 1 |
| p.I32F | PRAD | 1 |
| p.V176I | ESCA | 1 |
| p.T163M | BRCA | 1 |
| p.A10T | STAD | 1 |
| p.I82N | UCEC | 1 |
| p.Y158C | BLCA | 1 |
| p.S207Y | CESC | 1 |
| p.R87Q | STAD | 1 |
| p.F155L | UCEC | 1 |
| p.A76V | COAD | 1 |
| p.L71M | ESCA | 1 |
| Top |
| TissGeneCNV for APH1B |
| Copy number variations of TissGene across 28 cancer types (X-axis: cancer type and Y-axis: % of CNV samples) (TCGA Gistic2_CopyNumber_Gistic2_all_data_by_genes, Gistic2 copy number data, version 2016-08-16) |
 |
| Top |
| TissGeneFusions for APH1B |
| Fusion genes including TissGene (ChimerDB 3.0, 2016-12-01 and TCGA fusion Portal 2015-12-01) |
| Database | Src | Cancer type | Sample | Fusion gene | ORF | 5'-gene BP | 3'-gene BP |
| Chimerdb3.0 | ChiTaRs | NA | DB166550 | APH1B-APH1B | chr15:63574609 | chr15:63571675 | |
| Chimerdb3.0 | ChiTaRs | NA | BF510174 | APH1B-APH1B | chr15:63575486 | chr15:63573273 | |
| Chimerdb3.0 | ChiTaRs | NA | BP398723 | APH1B-ERP29 | chr15:63599775 | chr12:112460532 |
| Top |
| TissGeneNet for APH1B |
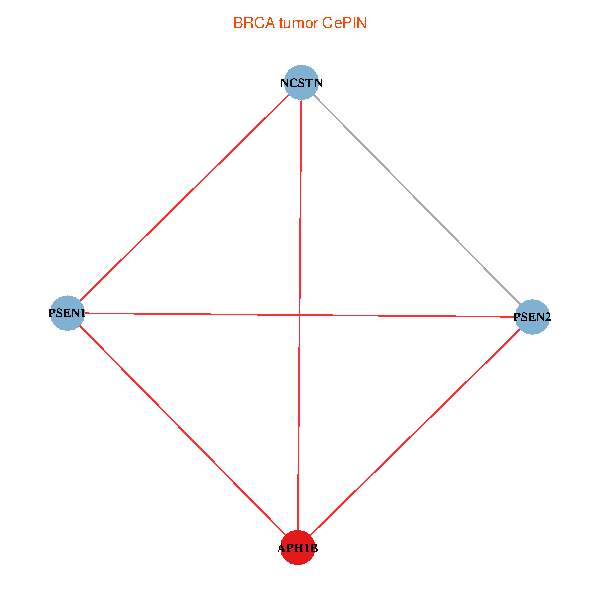
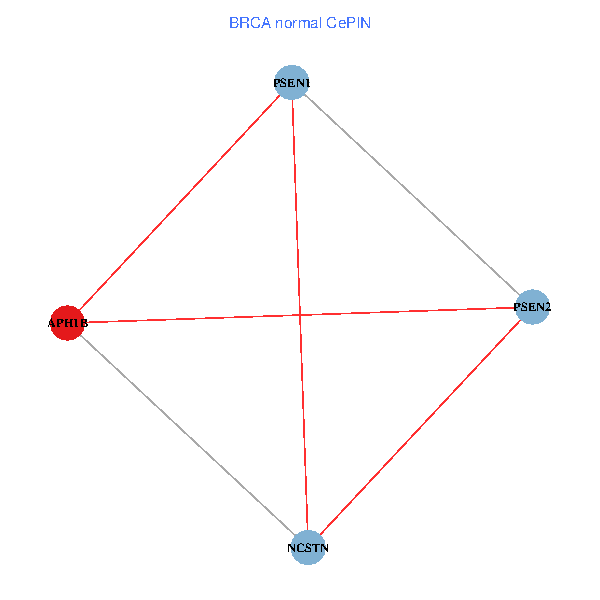
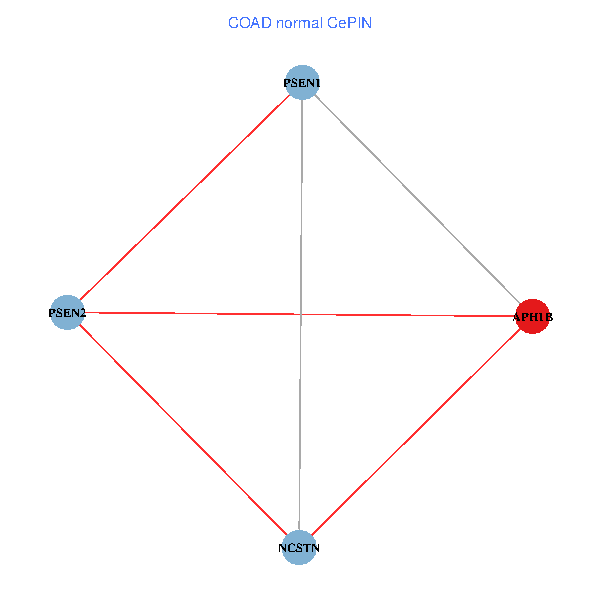
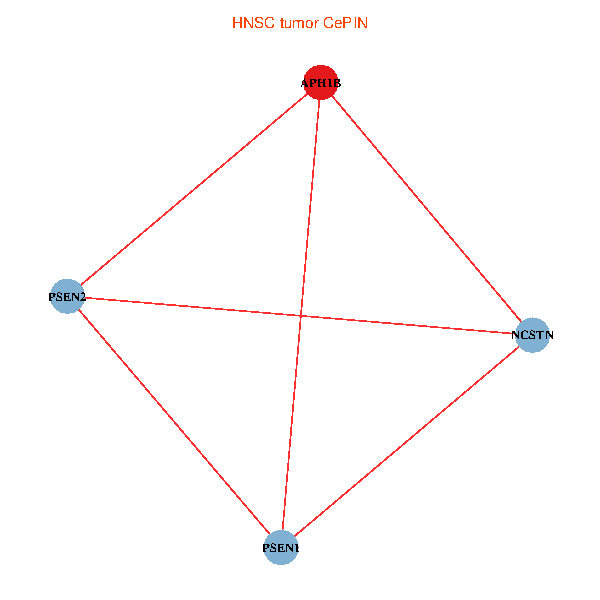
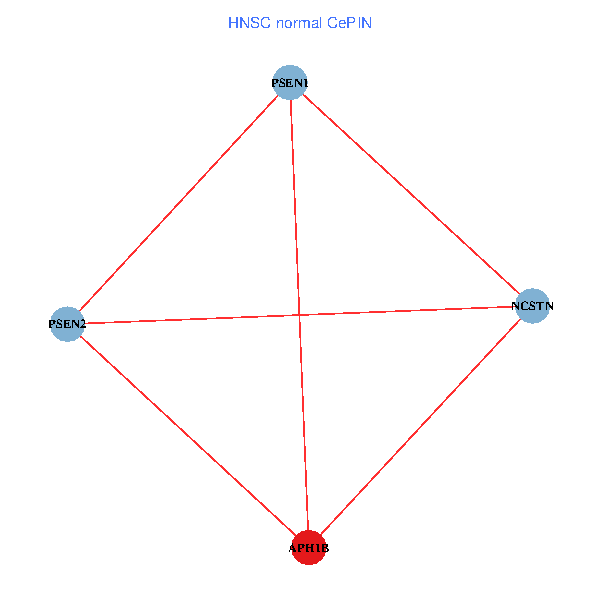
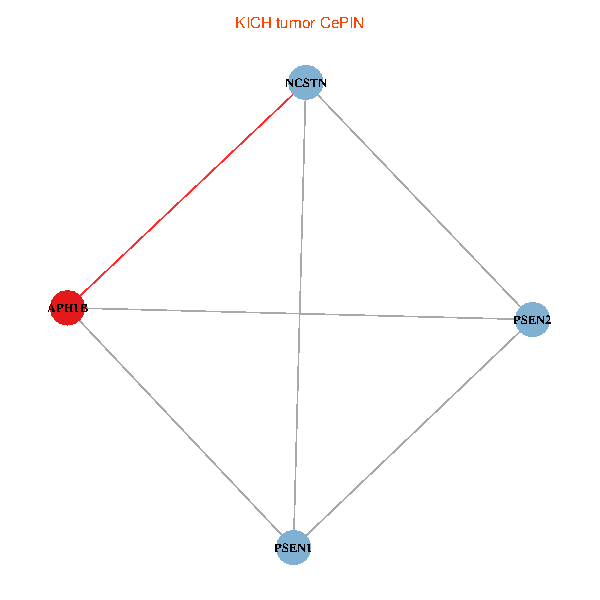
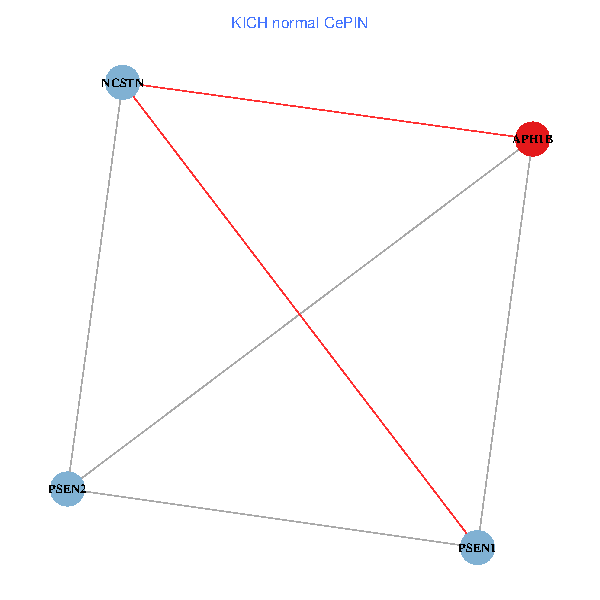
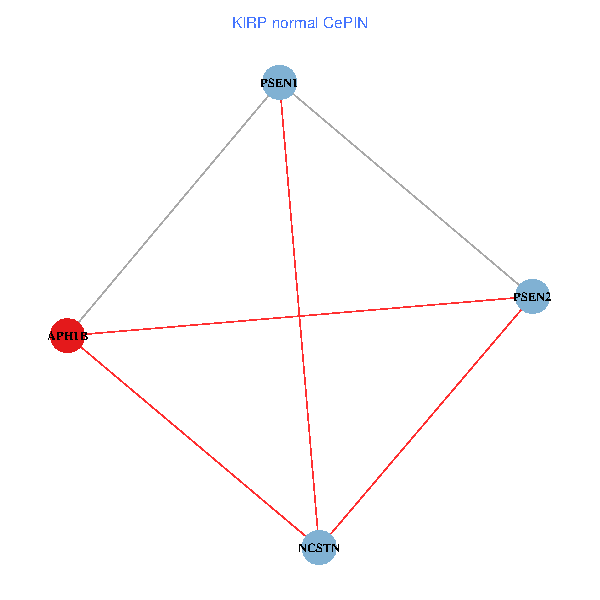
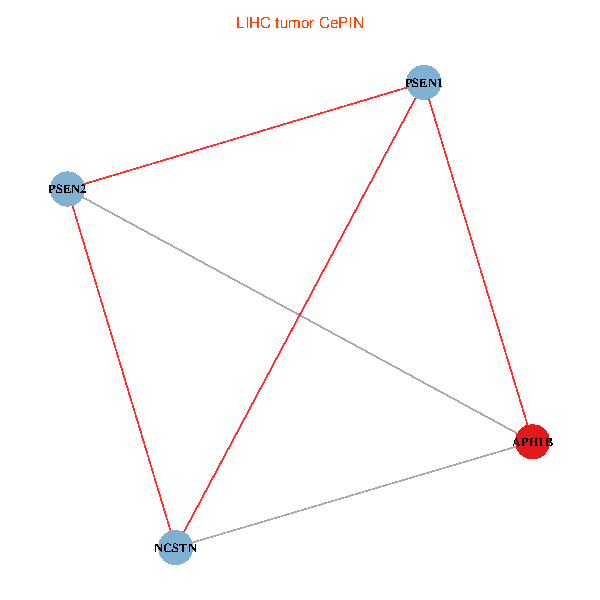
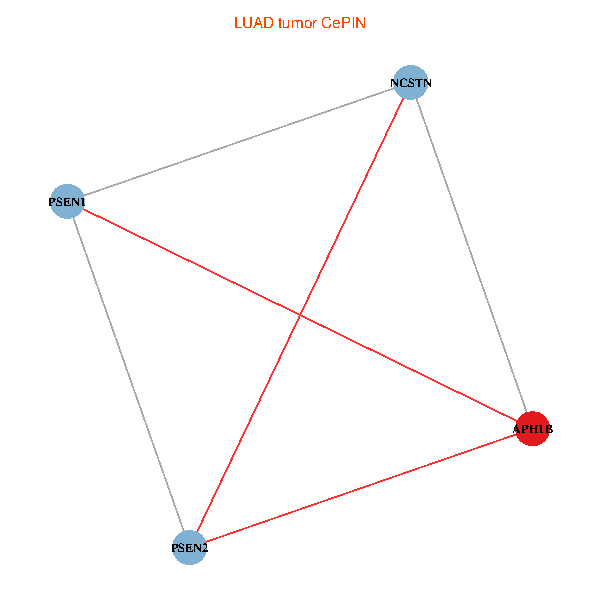
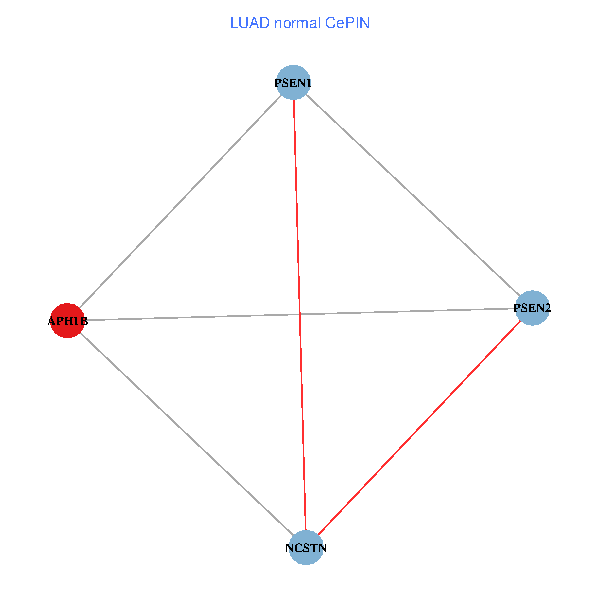
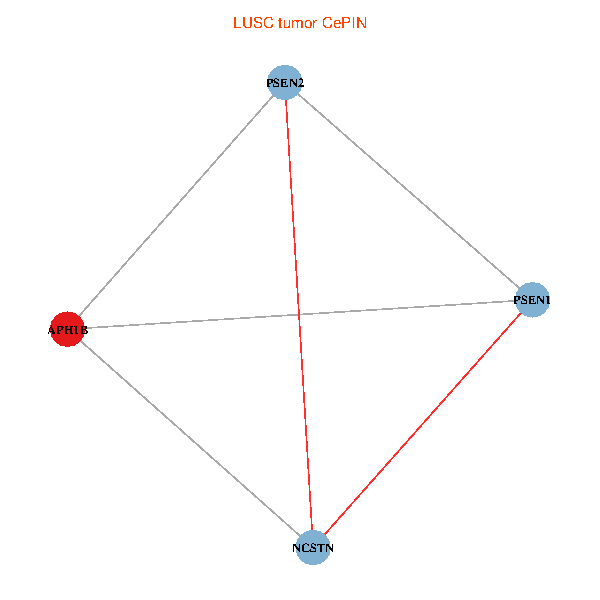
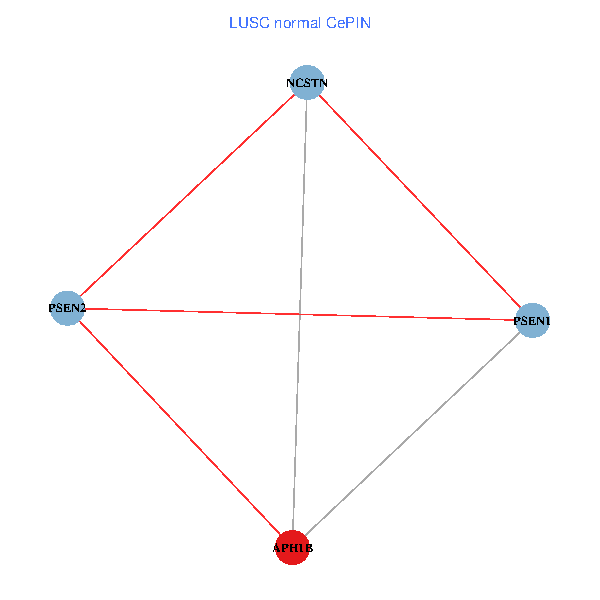
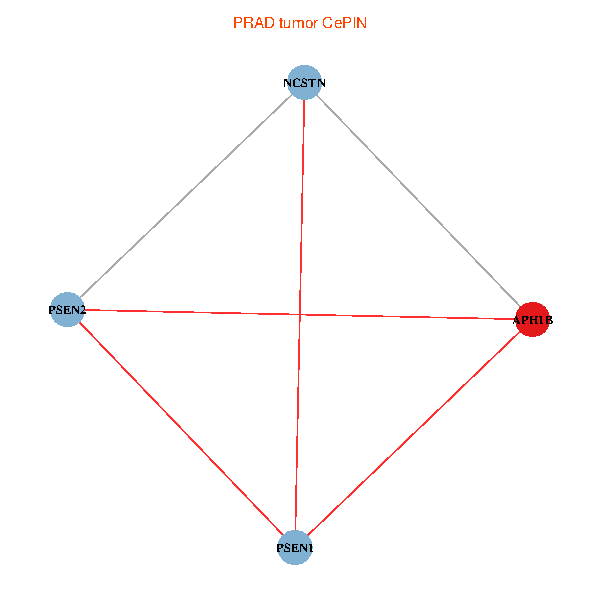
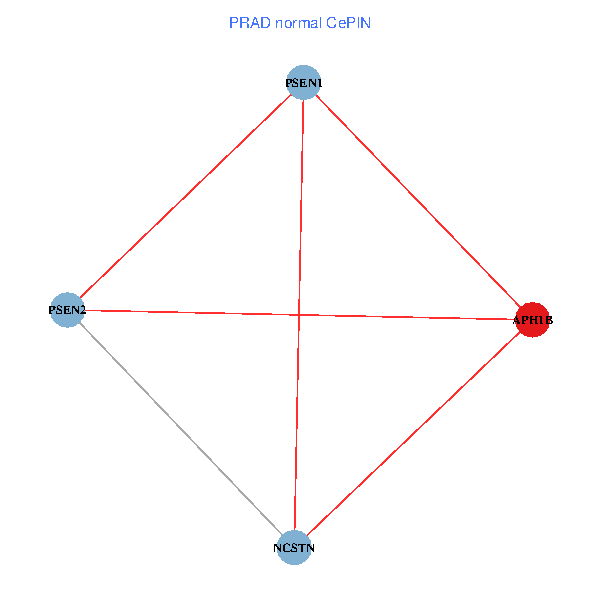
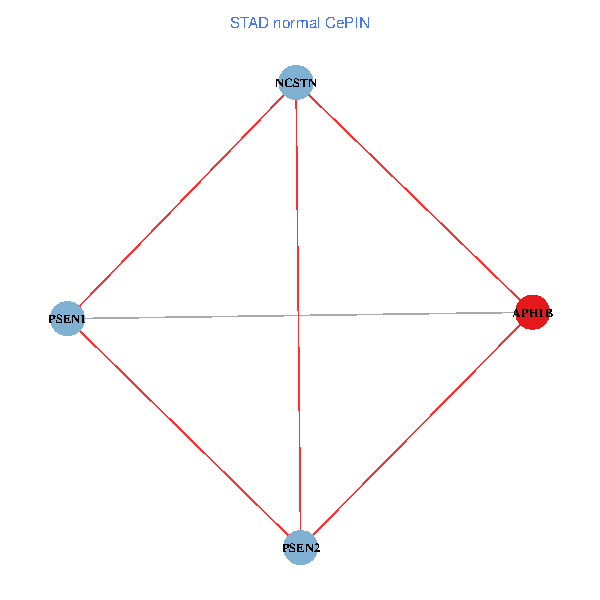
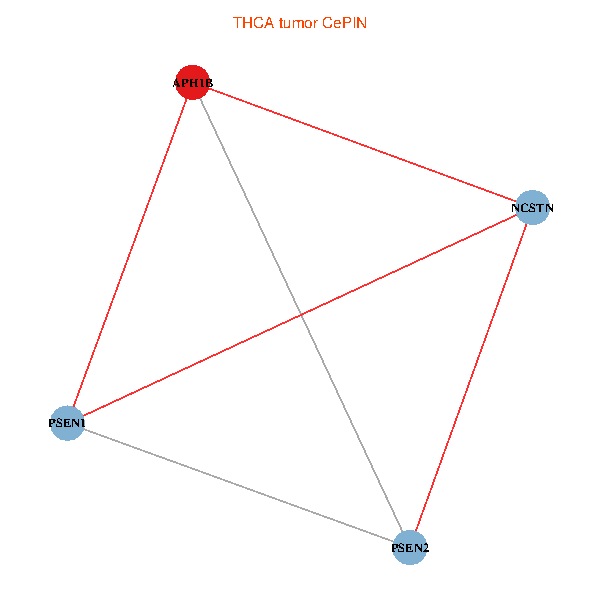
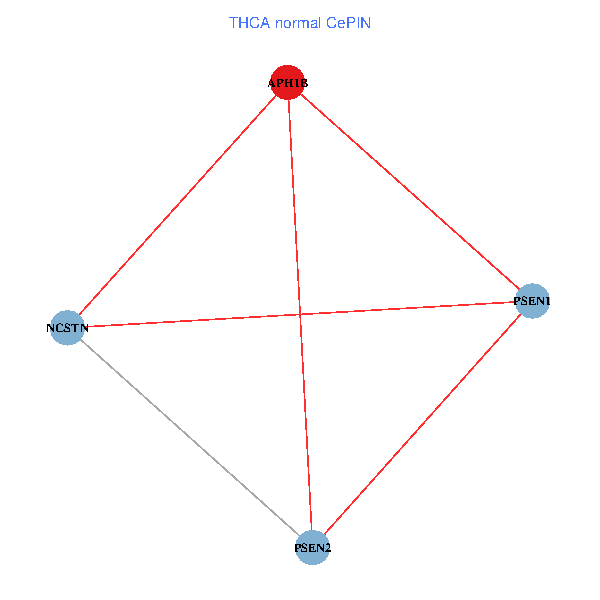
| Co-expressed gene networks based on protein-protein interaction data (CePIN) (TCGA IlluminaHiSeq_RNASeqV2, pan-cancer normalized log2(norm_counts+1) data, version 2016-08-16) (PINA2 ppi data) |
| BRCA (tumor) | BRCA (normal) |
| APH1B, PSEN1, NCSTN, PSEN2 (tumor) | APH1B, PSEN1, NCSTN, PSEN2 (normal) |
 |  |
| COAD (tumor) | COAD (normal) |
| APH1B, PSEN1, NCSTN, PSEN2 (tumor) | APH1B, PSEN1, NCSTN, PSEN2 (normal) |
 |  |
| HNSC (tumor) | HNSC (normal) |
| APH1B, PSEN1, NCSTN, PSEN2 (tumor) | APH1B, PSEN1, NCSTN, PSEN2 (normal) |
 |  |
| KICH (tumor) | KICH (normal) |
| APH1B, PSEN1, NCSTN, PSEN2 (tumor) | APH1B, PSEN1, NCSTN, PSEN2 (normal) |
 |  |
| KIRC (tumor) | KIRC (normal) |
| APH1B, PSEN1, NCSTN, PSEN2 (tumor) | APH1B, PSEN1, NCSTN, PSEN2 (normal) |
 |  |
| KIRP (tumor) | KIRP (normal) |
| APH1B, PSEN1, NCSTN, PSEN2 (tumor) | APH1B, PSEN1, NCSTN, PSEN2 (normal) |
 |  |
| LIHC (tumor) | LIHC (normal) |
| APH1B, PSEN1, NCSTN, PSEN2 (tumor) | APH1B, PSEN1, NCSTN, PSEN2 (normal) |
 |  |
| LUAD (tumor) | LUAD (normal) |
| APH1B, PSEN1, NCSTN, PSEN2 (tumor) | APH1B, PSEN1, NCSTN, PSEN2 (normal) |
 |  |
| LUSC (tumor) | LUSC (normal) |
| APH1B, PSEN1, NCSTN, PSEN2 (tumor) | APH1B, PSEN1, NCSTN, PSEN2 (normal) |
 |  |
| PRAD (tumor) | PRAD (normal) |
| APH1B, PSEN1, NCSTN, PSEN2 (tumor) | APH1B, PSEN1, NCSTN, PSEN2 (normal) |
 |  |
| STAD (tumor) | STAD (normal) |
| APH1B, PSEN1, NCSTN, PSEN2 (tumor) | APH1B, PSEN1, NCSTN, PSEN2 (normal) |
 |  |
| THCA (tumor) | THCA (normal) |
| APH1B, PSEN1, NCSTN, PSEN2 (tumor) | APH1B, PSEN1, NCSTN, PSEN2 (normal) |
 |  |
| Top |
| TissGeneProg for APH1B |
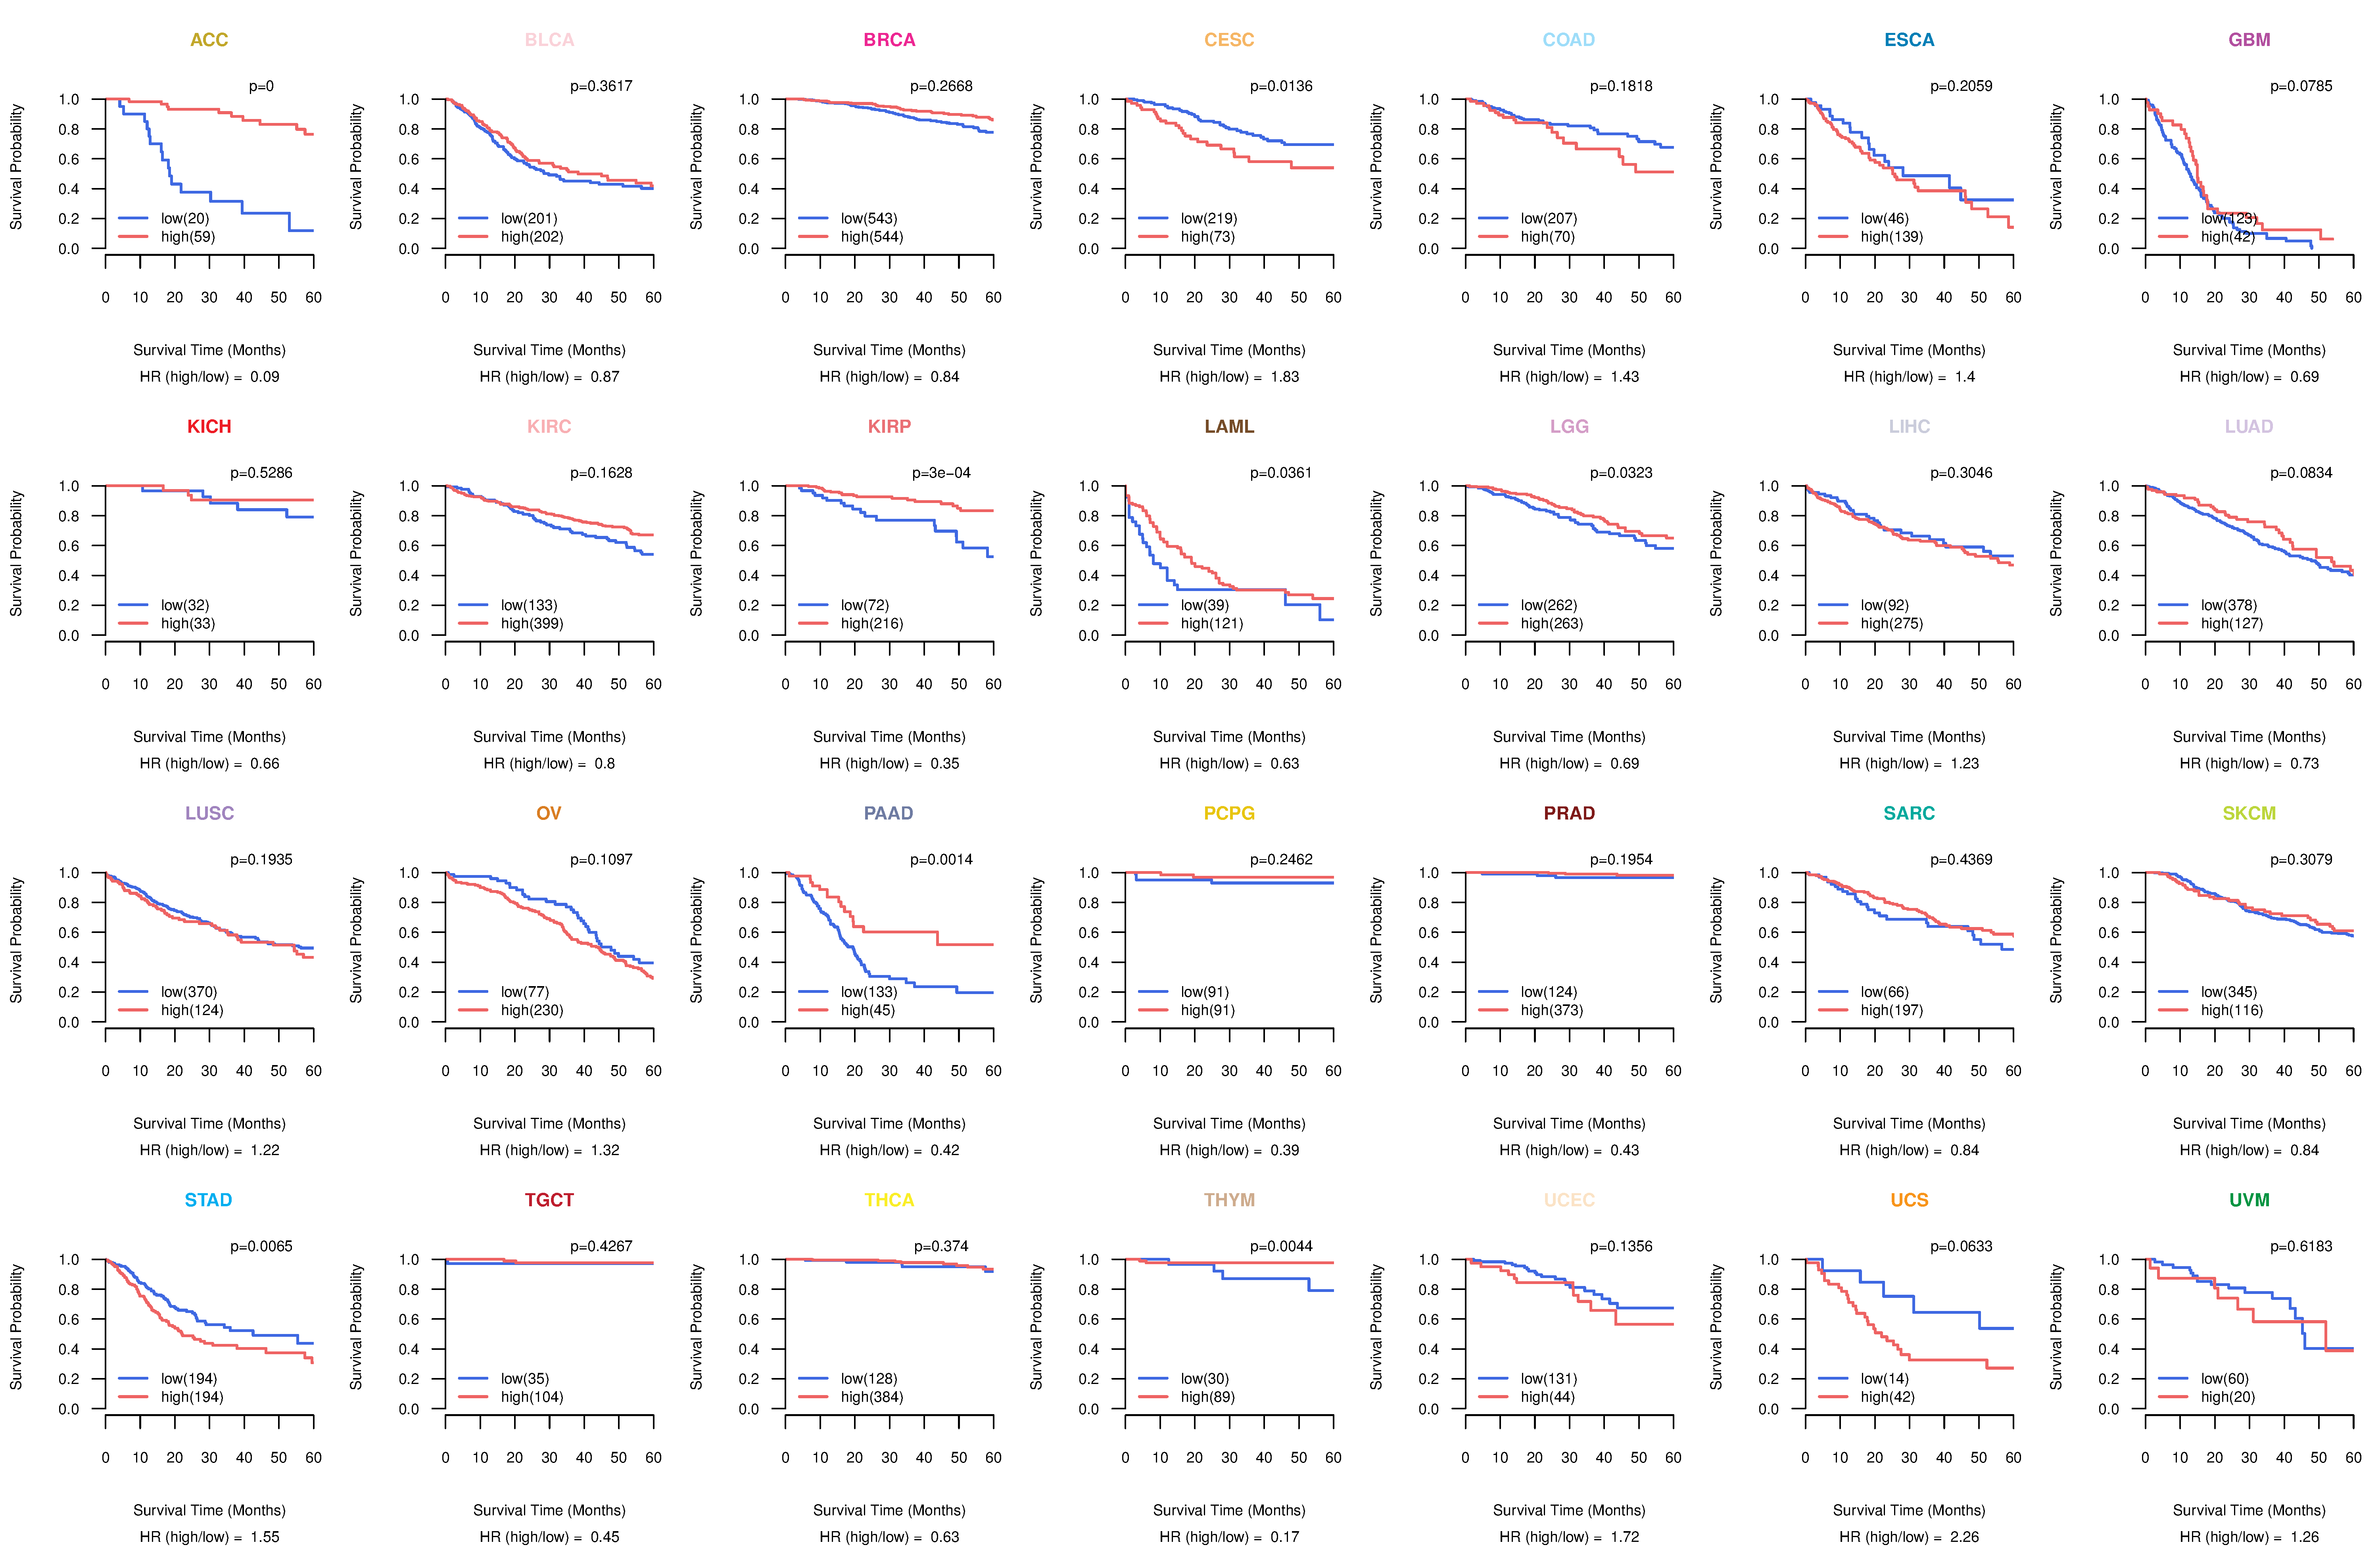
| Kaplan-Meier plots with logrank tests of overall survival (OS) using 28 cancer types (TCGA IlluminaHiSeq_RNASeqV2, pan-cancer normalized log2(norm_counts+1) data, version 2016-08-16) (TCGA clinicalMatrix, phenotype data, version 2016-04-27) * Click on the image to enlarge it in a new window. |
 |
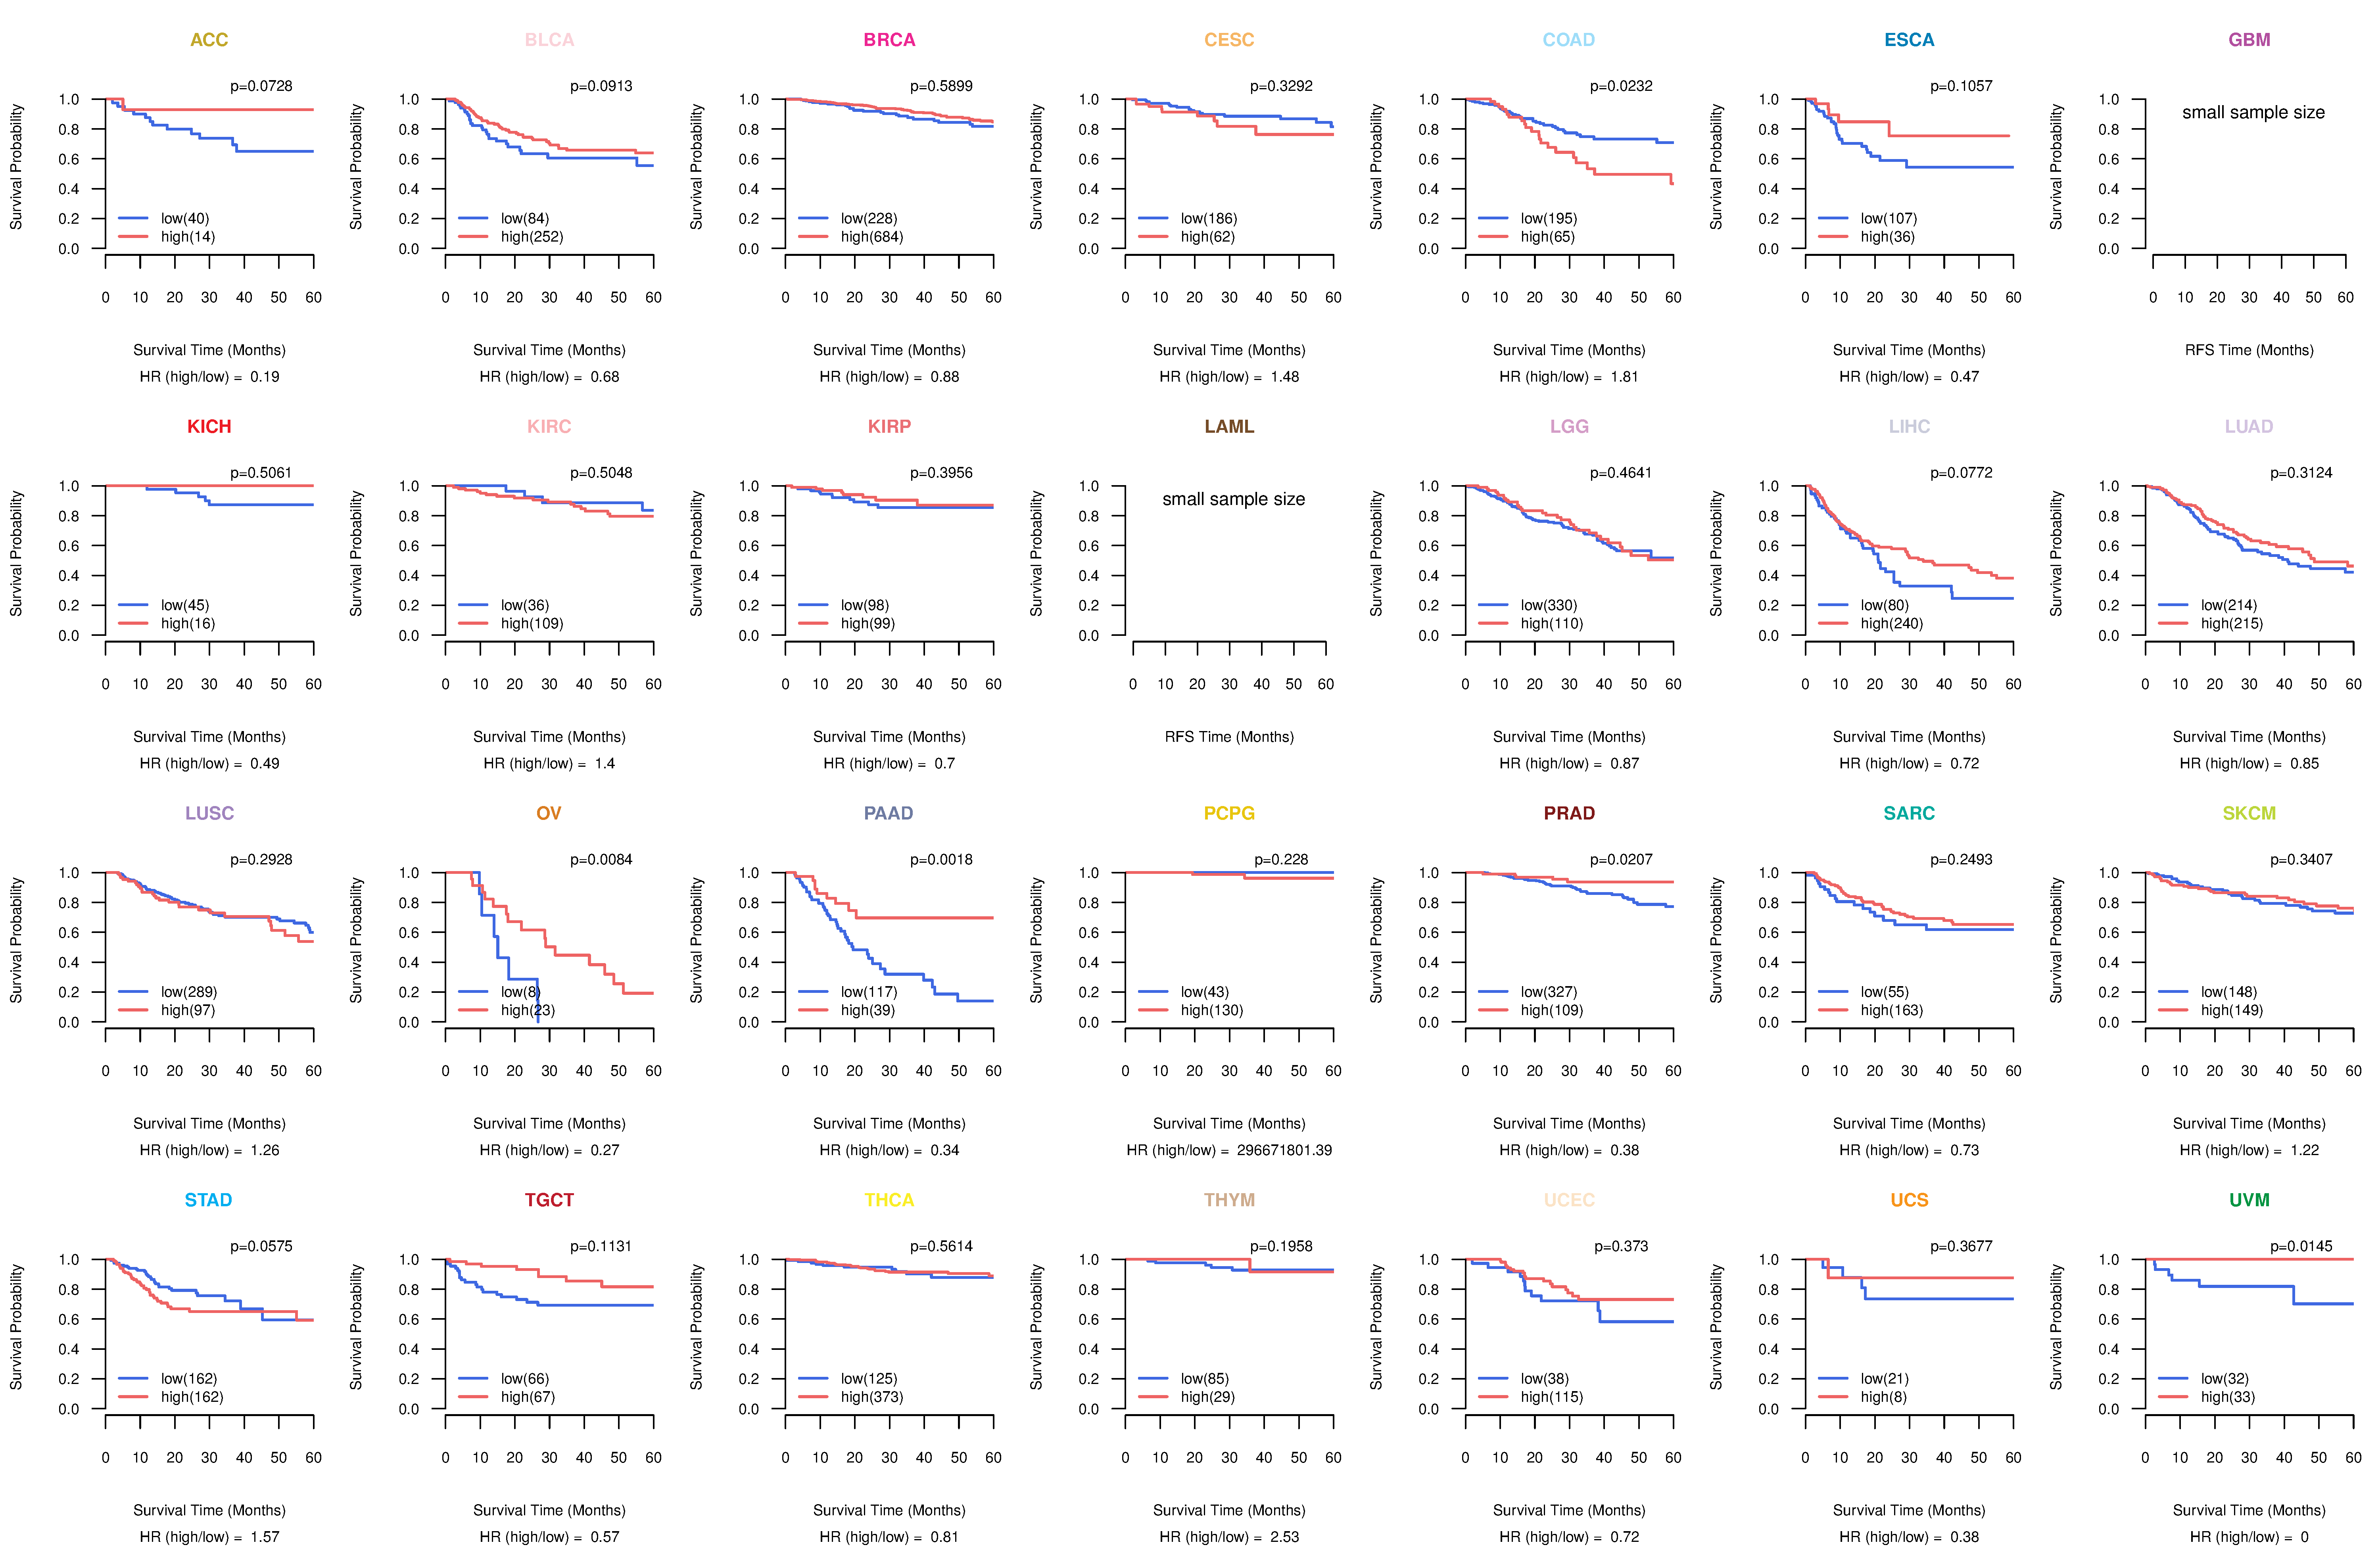
| Kaplan-Meier plots with logrank test of relapse free survival (RFS) using 28 cancer types (TCGA IlluminaHiSeq_RNASeqV2, pan-cancer normalized log2(norm_counts+1) data, version 2016-08-16) (TCGA clinicalMatrix, phenotype data, version 2016-04-27) * Click on the image enlarge it in a new window. |
 |
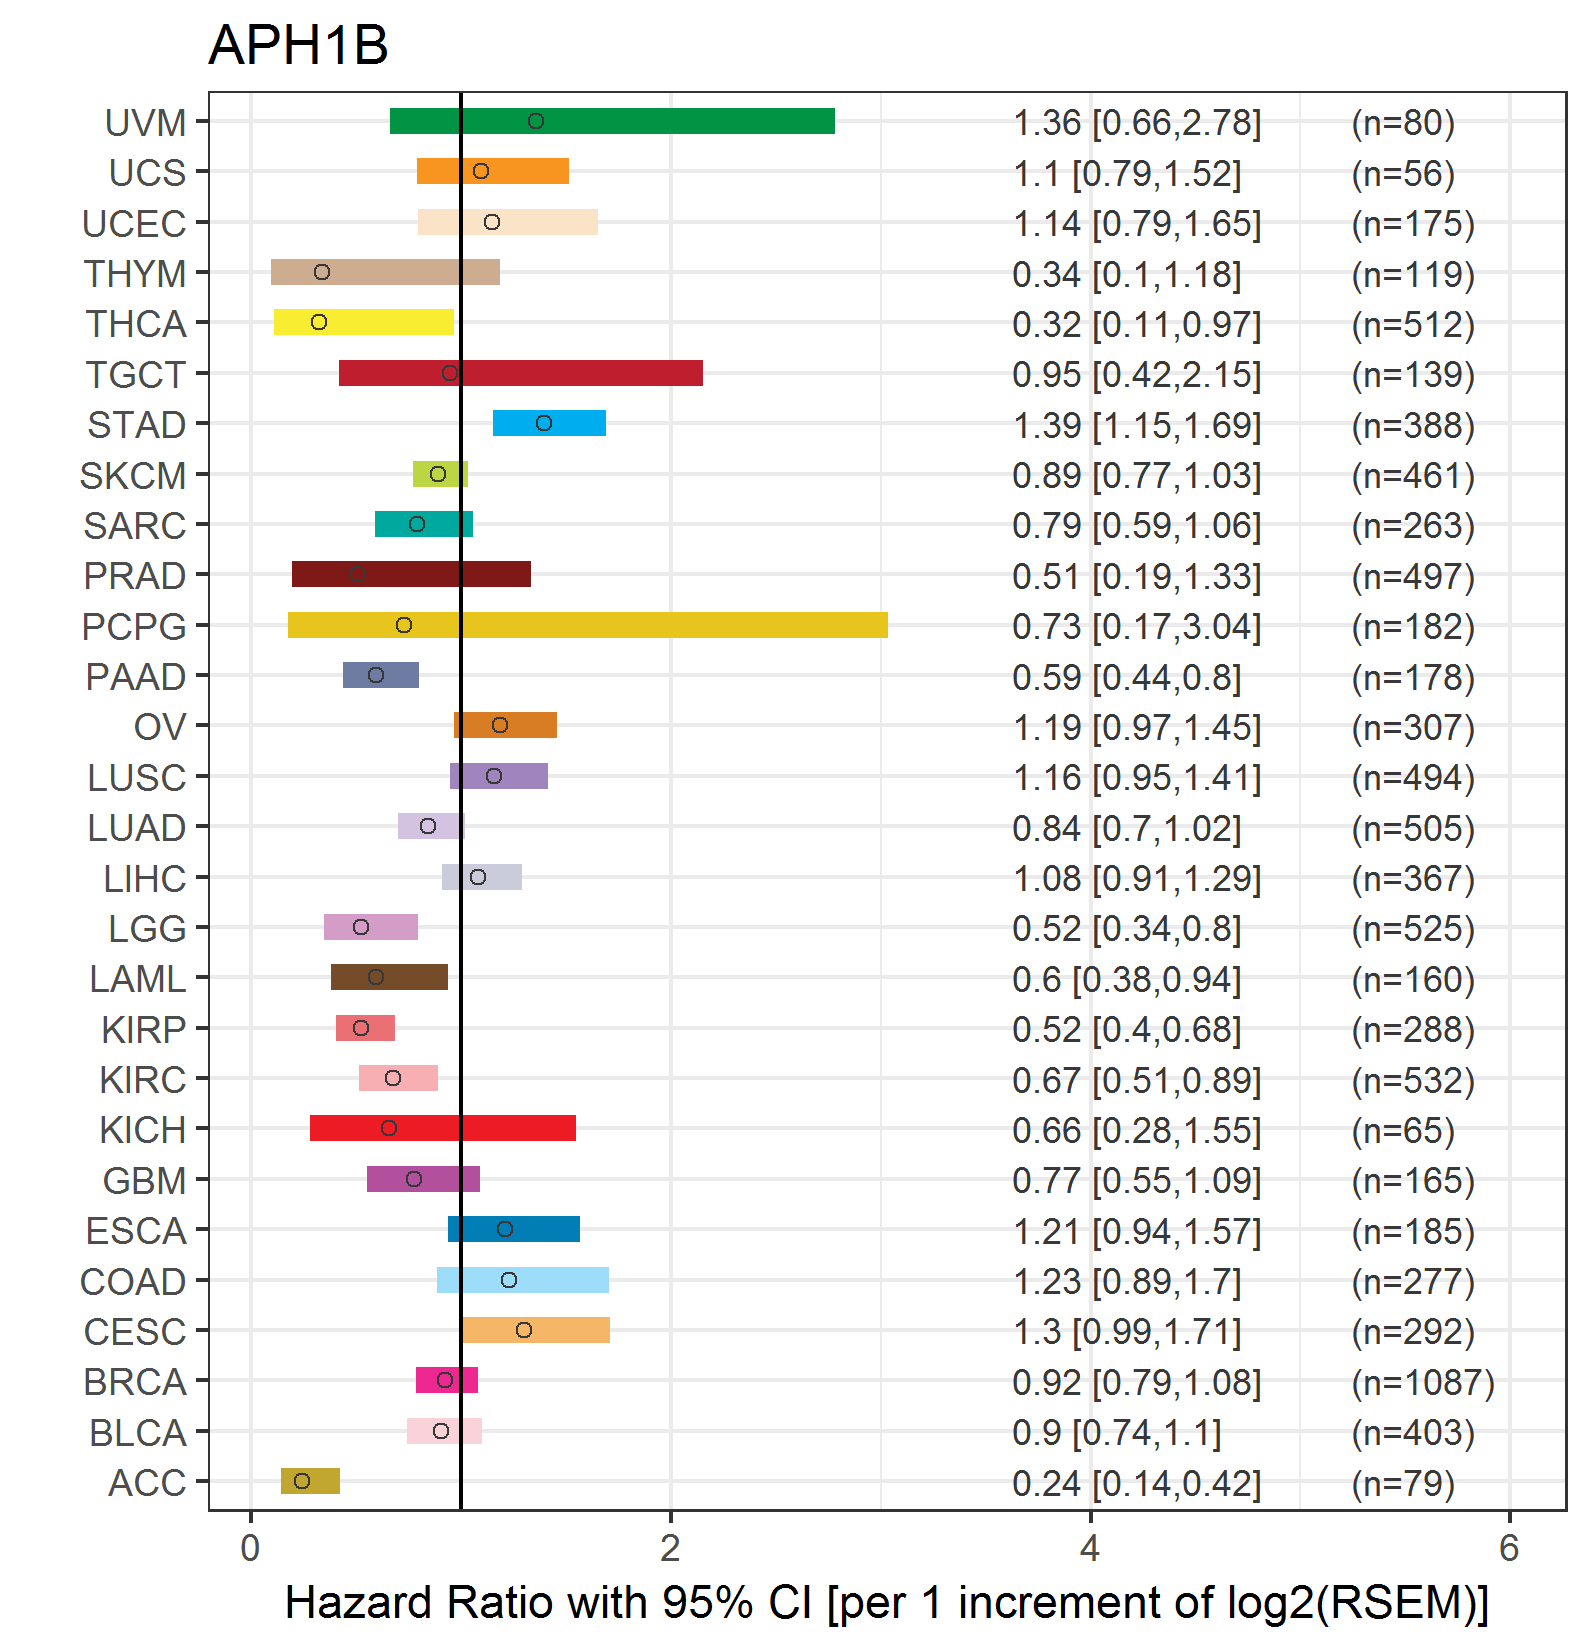
| Forest plot of Cox proportional hazard ratio (HR) and 95% CI of overall survival (OS) using 28 cancer types (TCGA IlluminaHiSeq_RNASeqV2, pan-cancer normalized log2(norm_counts+1) data, version 2016-08-16) (TCGA clinicalMatrix, phenotype data, version 2016-04-27) * Click on the image enlarge it in a new window. |
 |
| Forest plot of Cox proportional hazard ratio (HR) and 95% CI of relapse free survival (RFS) using 28 cancer types (TCGA IlluminaHiSeq_RNASeqV2, pan-cancer normalized log2(norm_counts+1) data, version 2016-08-16) (TCGA clinicalMatrix, phenotype data, version 2016-04-27) * Click on the image enlarge it in a new window. |
 |
| Top |
| TissGeneClin for APH1B |
| TissGeneDrug for APH1B |
| Drug information targeting TissGene (DrugBank Version 5.0.6, 2017-04-01) |
| DrugBank ID | Drug name | Drug activity | Drug type | Drug status |
| Top |
| TissGeneDisease for APH1B |
| Disease information associated with TissGene (DisGeNet, 2016-06-01) |
| Disease ID | Disease name | # pubmeds | Source |
| umls:C0002395 | Alzheimer's Disease | 3 | BeFree,GAD |
| umls:C0010054 | Coronary Arteriosclerosis | 1 | BeFree |
| umls:C0019693 | HIV Infections | 1 | BeFree,GAD |
| umls:C1956346 | Coronary Artery Disease | 1 | GAD,LHGDN |
|
Copyright 2016-Present - The University of Texas Health Science Center at Houston (UTHealth) Web File Viewing | How to Report, Fraud, Waste and Abuse | State of Texas | Statewide Search | Texas Homeland Security | Site Policies |