 |
| |
| |
| |
| |
| |
| |
|

| TissGeneSummary for NUF2 |
 Gene summary Gene summary |
| Basic gene information | Gene symbol | NUF2 |
| Gene name | NUF2, NDC80 kinetochore complex component | |
| Synonyms | CDCA1|CT106|NUF2R | |
| Cytomap | UCSC genome browser: 1q23.3 | |
| Type of gene | protein-coding | |
| RefGenes | NM_031423.3, NM_145697.2, | |
| Description | NUF2, NDC80 kinetochore complex component, homologcancer/testis antigen 106cell division cycle associated 1cell division cycle-associated protein 1hNuf2hNuf2RhsNuf2kinetochore protein Nuf2 | |
| Modification date | 20141207 | |
| dbXrefs | MIM : 611772 | |
| HGNC : HGNC | ||
| Ensembl : ENSG00000143228 | ||
| HPRD : 10817 | ||
| Vega : OTTHUMG00000034275 | ||
| Protein | UniProt: go to UniProt's Cross Reference DB Table | |
| Expression | CleanEX: HS_NUF2 | |
| BioGPS: 83540 | ||
| Pathway | NCI Pathway Interaction Database: NUF2 | |
| KEGG: NUF2 | ||
| REACTOME: NUF2 | ||
| Pathway Commons: NUF2 | ||
| Context | iHOP: NUF2 | |
| ligand binding site mutation search in PubMed: NUF2 | ||
| UCL Cancer Institute: NUF2 | ||
| Assigned class in TissGDB* | C | |
| Included tissue-specific gene expression resources | TiGER,GTEx | |
| Specific-tissues in normal samples (assigned by TissGDB using HPA, TiGER, and GTEx) | TestisThymus | |
| Cancer types related to the specific-tissues in cancer samples (assigned by TissGDB using TCGA) | TGCTTHYM | |
| Reference showing the relevant tissue of NUF2 | ||
| Description by TissGene annotations | Protective TissGene in OS | |
| * Class A consists of genes with literature evidence and is part of the cTissGenes. Class B consists of only cTissGenes without additional evidence. The remaining genes belong to Class C. |
| Gene ontology having evidence of Inferred from Direct Assay (IDA) from Entrez |
| GO ID | GO term | PubMed ID |
| Top |
| TissGeneExp for NUF2 |
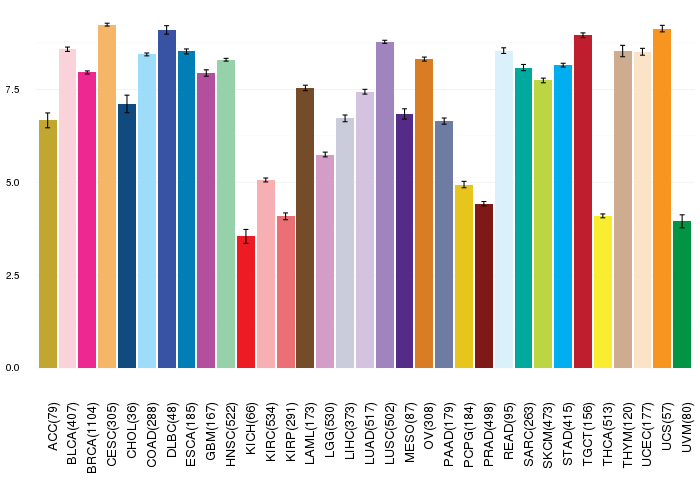
| Gene expressions across 28 cancer types (X-axis: cancer type and Y-axis: log2(norm_counts+1)) (TCGA IlluminaHiSeq_RNASeqV2, pan-cancer normalized log2(norm_counts+1) data, version 2016-08-16) |
 |
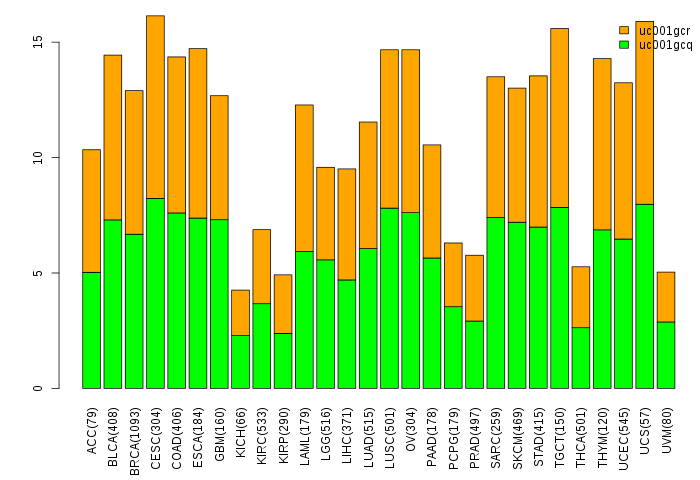
| Gene isoform expressions across 28 cancer types (X-axis: cancer type and Y-axis: log2(norm_counts+1)) (TCGA pan-cancer tcga_rsem_isoform_tpm, version 2016-09-01) |
 |
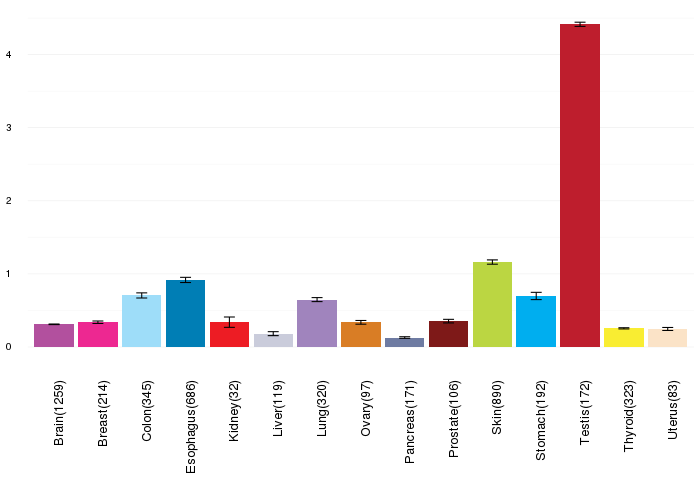
| Gene expressions across normal tissues of GTEx data (GTEx GTEx_Analysis_v6_RNA-seq_RNA-SeQCv1.1.8_gene_rpkm.gct) - Here, we shows the matched tissue types only among our 28 cancer types. |
 |
| Different expressions across 14 cancer types with more than 10 samples between matched tumors and normals (X-axis: cancer type and Y-axis: log2(norm_counts+1)) (TCGA IlluminaHiSeq_RNASeqV2, pan-cancer normalized log2(norm_counts+1) data, version 2016-08-16) |
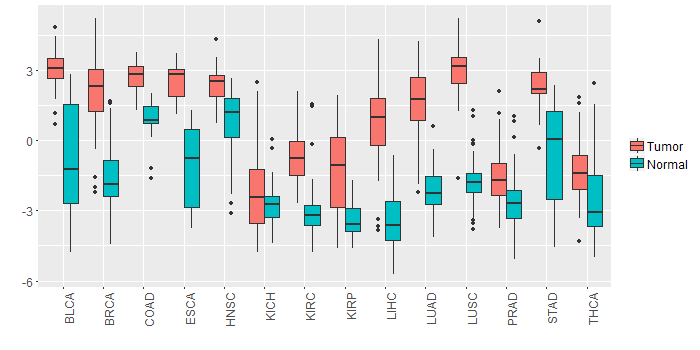 |
| - Significantly differentially expressed cancer types and information. (|Fold change|>1 and FDR<0.05) |
| Cancer type | Mean(exp) in tumor | Mean(exp) in matched normal | Log2FC | P-val. | FDR |
| LUSC | 2.914864737 | -1.752119576 | 4.666984314 | 1.24E-39 | 9.31E-37 |
| HNSC | 2.409266835 | 0.809620323 | 1.599646512 | 5.94E-09 | 7.73E-08 |
| BRCA | 2.184741621 | -1.644216274 | 3.828957895 | 1.70E-57 | 4.79E-55 |
| KIRP | -1.226355912 | -3.422477787 | 2.196121875 | 6.24E-08 | 3.95E-07 |
| KIRC | -0.727515982 | -3.059563204 | 2.332047222 | 2.89E-26 | 3.90E-25 |
| LUAD | 1.664190532 | -2.141861192 | 3.806051724 | 3.91E-29 | 3.51E-27 |
| LIHC | 0.619092463 | -3.442611537 | 4.061704 | 2.42E-23 | 2.99E-21 |
| BLCA | 2.992315305 | -0.78614259 | 3.778457895 | 8.75E-07 | 2.95E-05 |
| COAD | 2.70230154 | 0.87837077 | 1.823930769 | 8.68E-12 | 1.74E-10 |
| STAD | 2.316031588 | -0.464693412 | 2.780725 | 2.90E-08 | 1.05E-06 |
| ESCA | 2.49815119 | -1.139285174 | 3.637436364 | 4.66E-05 | 0.00191923 |
| THCA | -1.329289334 | -2.43387069 | 1.104581356 | 0.000112 | 0.000305379 |
| PRAD | -1.550456153 | -2.57092346 | 1.020467308 | 2.59E-05 | 0.000128411 |
| Top |
| TissGene-miRNA for NUF2 |
| Significantly anti-correlated miRNAs of TissGene across 28 cancer types (Gene-miRNA relations from TargetScanHuman Relsease 7.1, Conserved_Site_Context_Scores.txt.zip, 06.01.2016) (TCGA IlluminaHiSeq_miRNASeq, log2(RPM+1) data, version 2016-11-21) (TCGA IlluminaHiSeq_RNASeqV2, log2(normalized_count+1) data, version 2016-08-16) (Spearman’s Rank Correlation (p-value<0.05 and coefficient<-0.25)) |
| Cancer type | miRNA id | miRNA accession | P-val. | Coeff. | # samples |
| Top |
| TissGeneMut for NUF2 |
| TissGeneSNV for NUF2 |
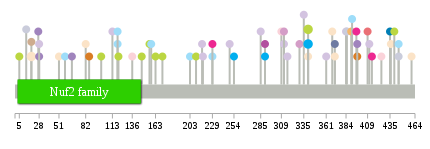
| nsSNV counts per each loci. Different colors of circles represent different cancer types. Circle size denotes number of samples. (TCGA somatic mutation (SNPs and small INDELs) data, version 2016-04-25) * Click on the image to enlarge it in a new window. |
 |
 |
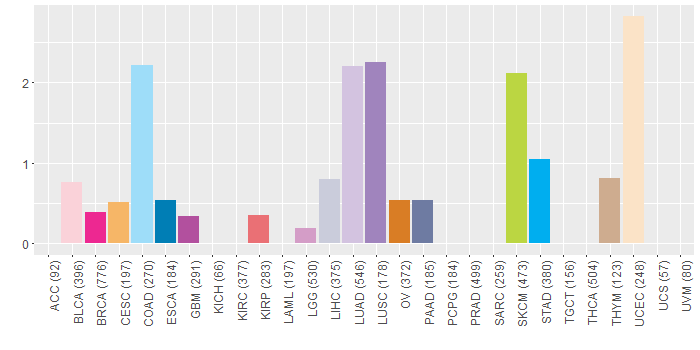
| Somatic nucleotide variants of TissGene across 28 cancer types (X-axis: cancer type and Y-axis: % of mutated samples) The numbers in parentheses are numbers of samples with mutation (nsSNVs). (TCGA somatic mutation (SNPs and small INDELs) data, version 2016-04-25) |
 |
| - nsSNVs sorted by frequency. |
| AAchange | Cancer type | # samples |
| p.S340L | SKCM | 2 |
| p.S340L | STAD | 2 |
| p.R19H | UCEC | 2 |
| p.A411S | LUAD | 1 |
| p.S86R | OV | 1 |
| p.Y254H | STAD | 1 |
| p.G436S | UCEC | 1 |
| p.S312I | LUAD | 1 |
| p.R414K | BRCA | 1 |
| p.S229L | BRCA | 1 |
| p.R119Q | COAD | 1 |
| p.S340L | READ | 1 |
| p.S217L | LUAD | 1 |
| p.F460S | UCEC | 1 |
| p.Y445C | LIHC | 1 |
| p.K33N | READ | 1 |
| p.I203M | COAD | 1 |
| p.F82V | UCEC | 1 |
| p.K409Q | KIRP | 1 |
| p.G58R | COAD | 1 |
| p.Q396E | BRCA | 1 |
| p.Q290H | GBM | 1 |
| p.D443Y | HNSC | 1 |
| p.R371H | PAAD | 1 |
| p.S312I | LGG | 1 |
| p.E249D | LUAD | 1 |
| p.E316Q | LUAD | 1 |
| p.R384T | LUAD | 1 |
| p.Q368K | UCEC | 1 |
| p.E218G | LUAD | 1 |
| p.R119W | COAD | 1 |
| p.Y445N | COAD | 1 |
| p.Q356K | HNSC | 1 |
| p.S147F | SKCM | 1 |
| p.L163I | SKCM | 1 |
| p.C285F | LUAD | 1 |
| p.R371H | UCEC | 1 |
| p.S5F | SKCM | 1 |
| p.D435G | ESCA | 1 |
| p.S171F | SKCM | 1 |
| p.G385D | LIHC | 1 |
| p.D27N | LUSC | 1 |
| p.N156I | SKCM | 1 |
| p.K309T | BLCA | 1 |
| p.K113Q | LUAD | 1 |
| p.R19C | THYM | 1 |
| p.V391A | COAD | 1 |
| p.E397D | OV | 1 |
| p.G28S | LUAD | 1 |
| p.D281Y | READ | 1 |
| p.A440T | SKCM | 1 |
| p.K335N | LUAD | 1 |
| p.E13D | LIHC | 1 |
| p.E397K | LUSC | 1 |
| p.I401T | DLBC | 1 |
| p.N425T | BLCA | 1 |
| p.R100P | SKCM | 1 |
| p.R390* | CESC | 1 |
| p.S229L | COAD | 1 |
| p.S340L | UCEC | 1 |
| p.A158T | COAD | 1 |
| p.E136K | BLCA | 1 |
| p.E330D | LGG | 1 |
| p.R51S | UCEC | 1 |
| p.M66_splice | LUSC | 1 |
| p.F120V | SKCM | 1 |
| p.G28C | LUSC | 1 |
| p.Q290H | STAD | 1 |
| p.K361M | LUAD | 1 |
| p.S210F | SKCM | 1 |
| Top |
| TissGeneCNV for NUF2 |
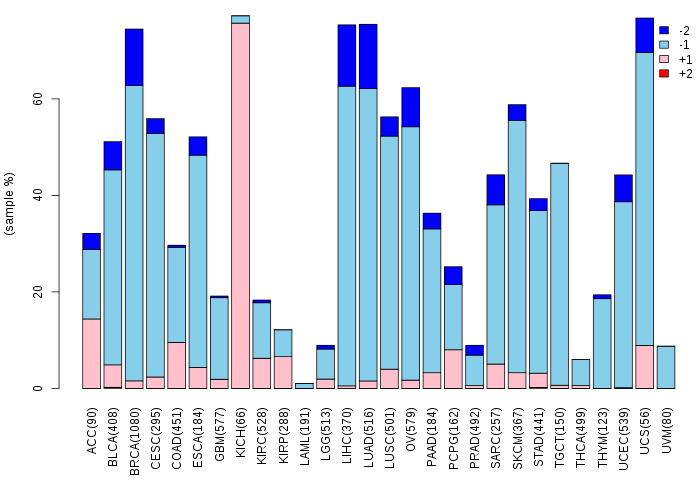
| Copy number variations of TissGene across 28 cancer types (X-axis: cancer type and Y-axis: % of CNV samples) (TCGA Gistic2_CopyNumber_Gistic2_all_data_by_genes, Gistic2 copy number data, version 2016-08-16) |
 |
| Top |
| TissGeneFusions for NUF2 |
| Fusion genes including TissGene (ChimerDB 3.0, 2016-12-01 and TCGA fusion Portal 2015-12-01) |
| Database | Src | Cancer type | Sample | Fusion gene | ORF | 5'-gene BP | 3'-gene BP |
| Chimerdb3.0 | FusionScan | SARC | TCGA-DX-A1KY-01A | NUF2-PHEX | In-Frame | chr1:163310216 | chrX:22151639 |
| TCGAfusionPortal | PRADA | LUAD | TCGA-78-7159-01A | NUF2-TIMM17A | In-frame | Chr1:163317728 | Chr1:201926409 |
| Top |
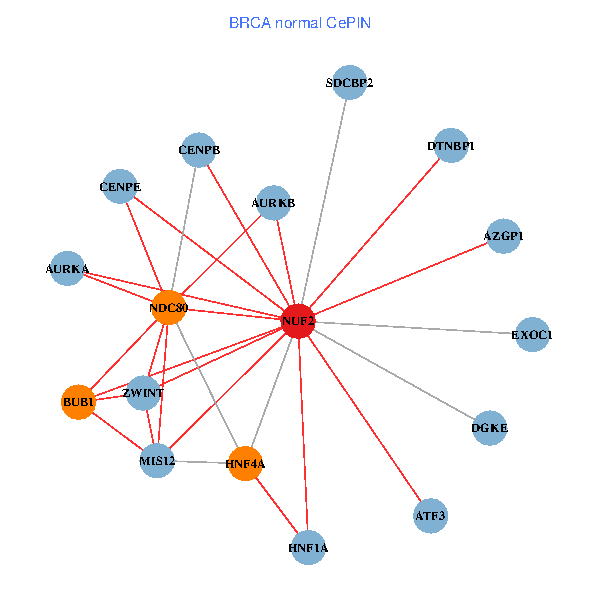
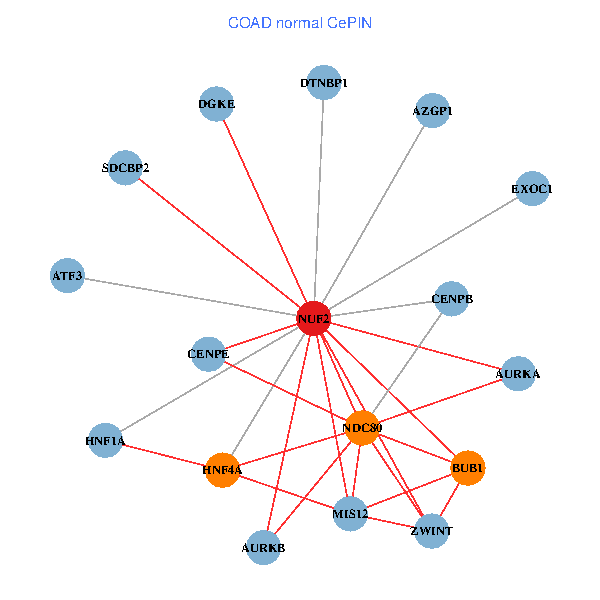
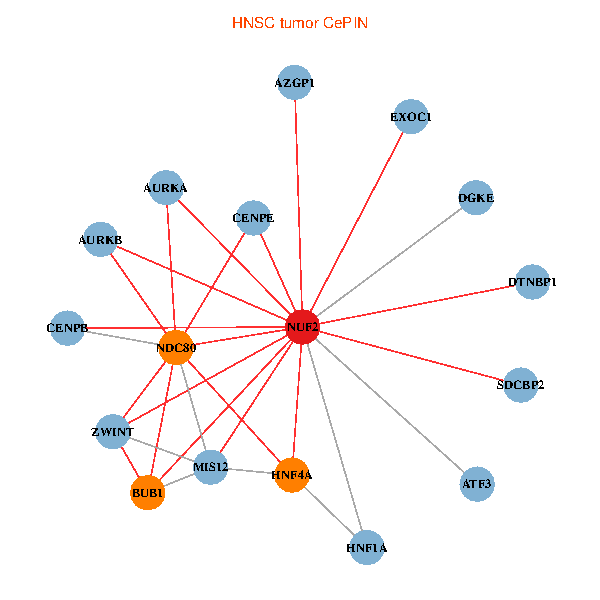
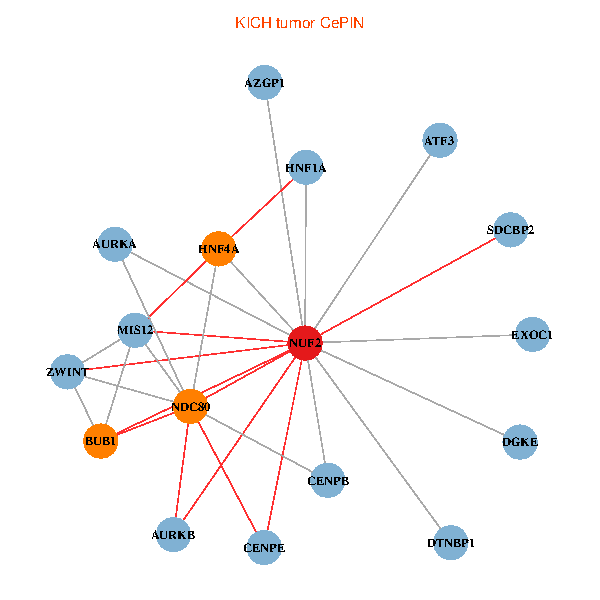
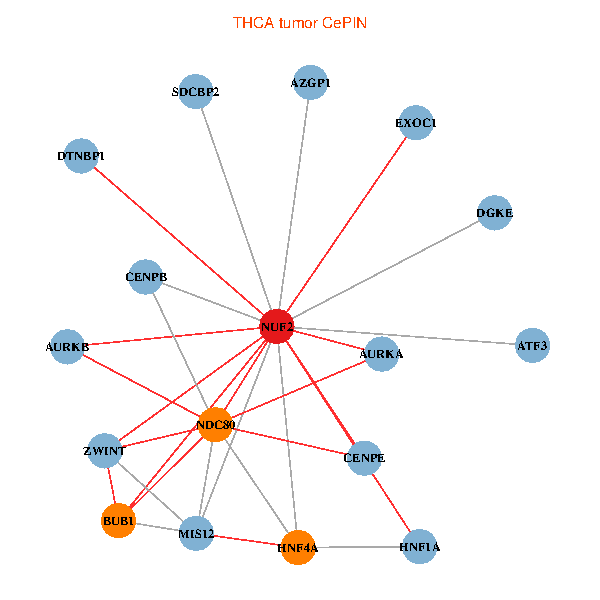
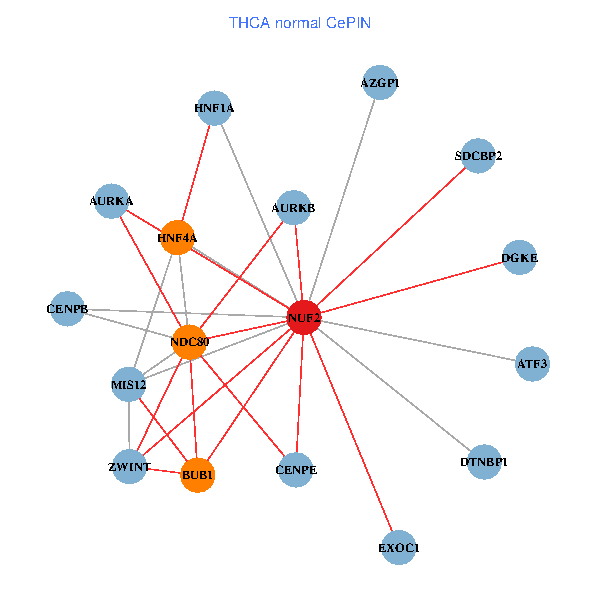
| TissGeneNet for NUF2 |
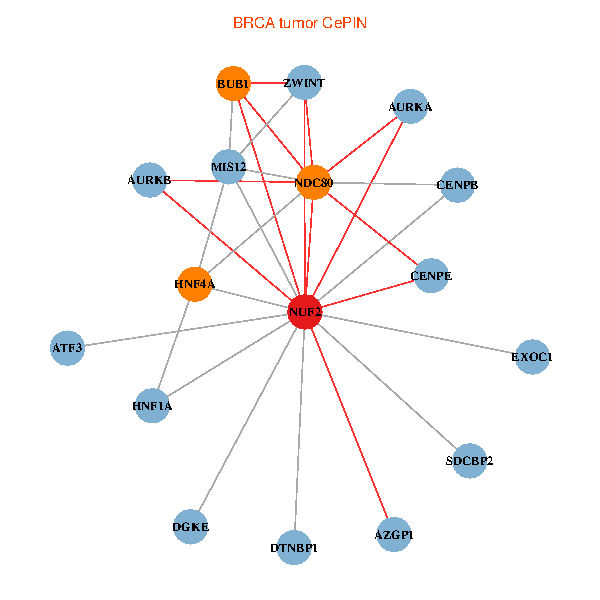
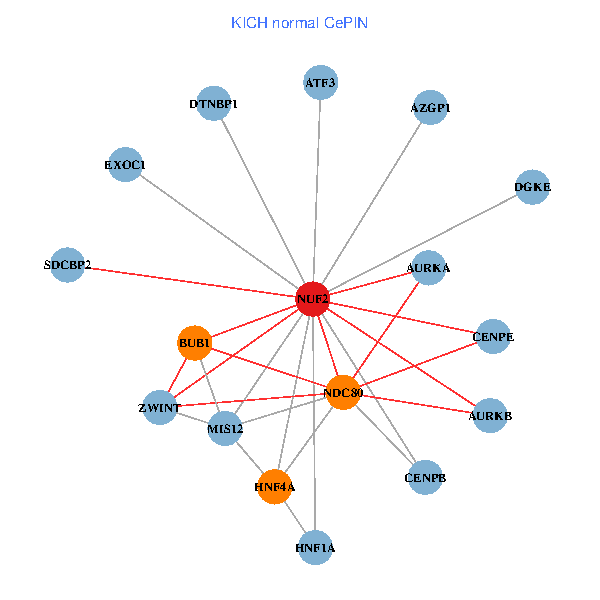
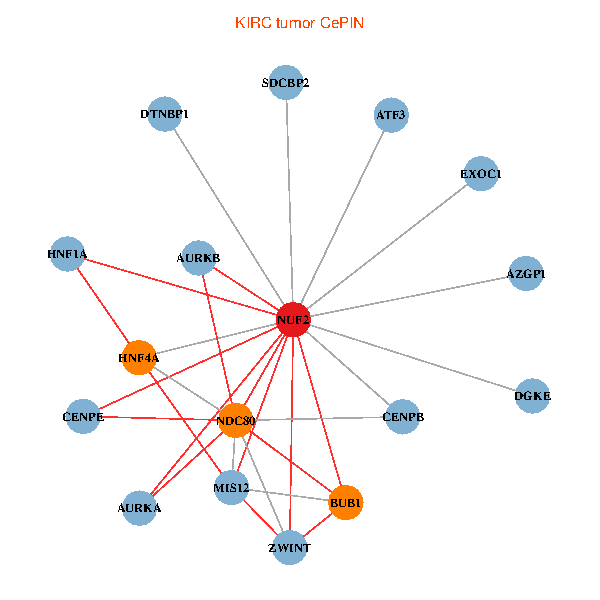
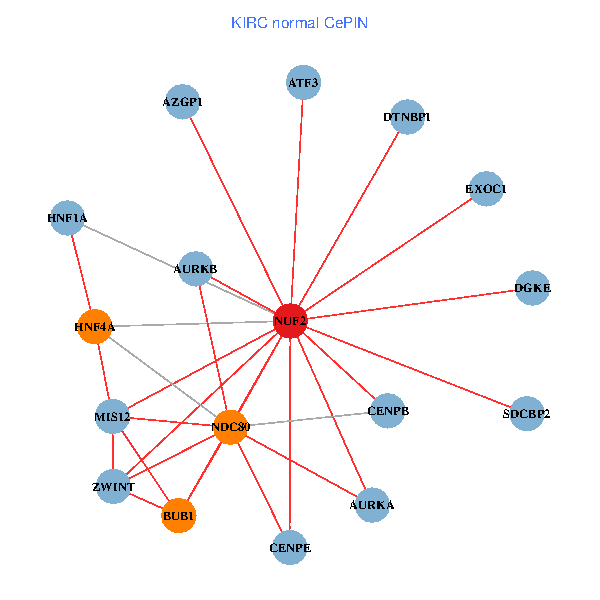
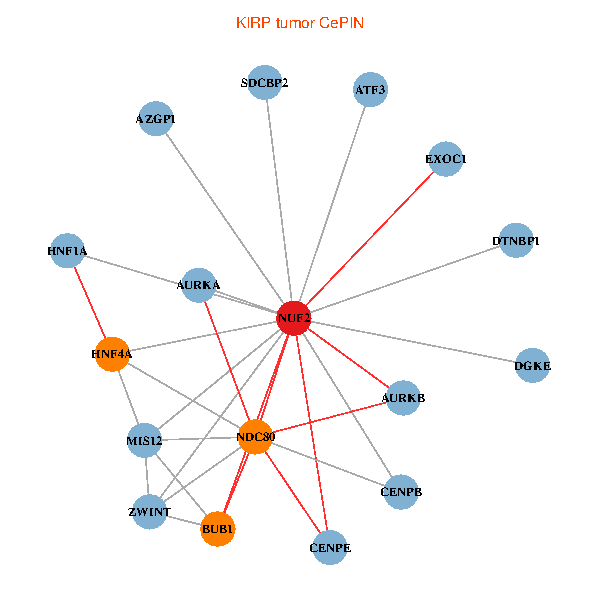
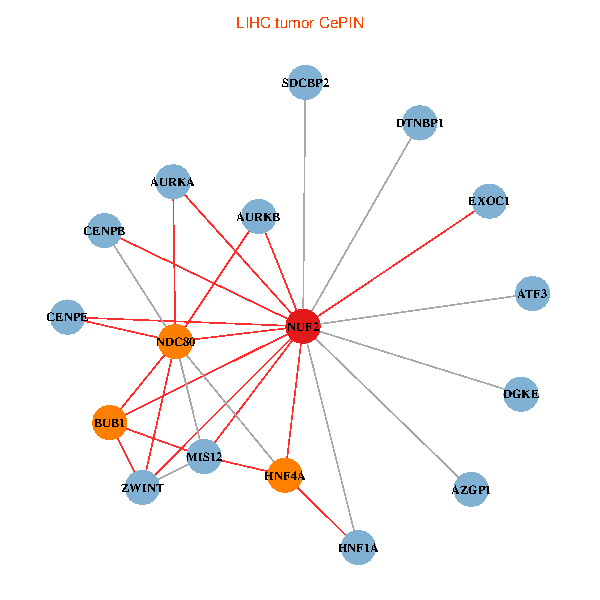
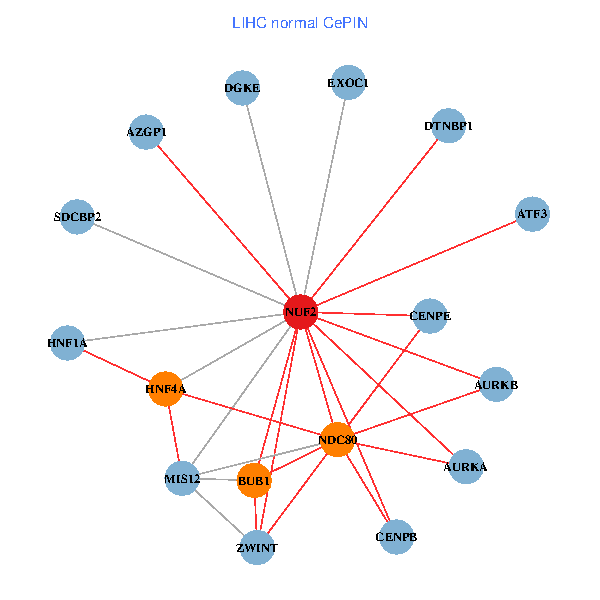
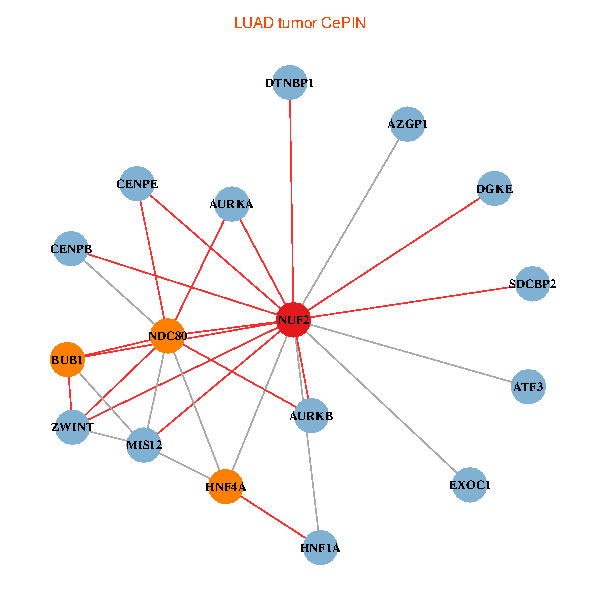
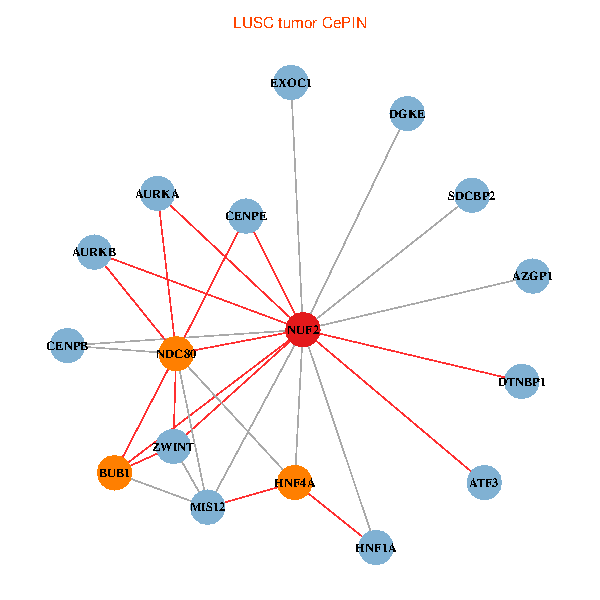
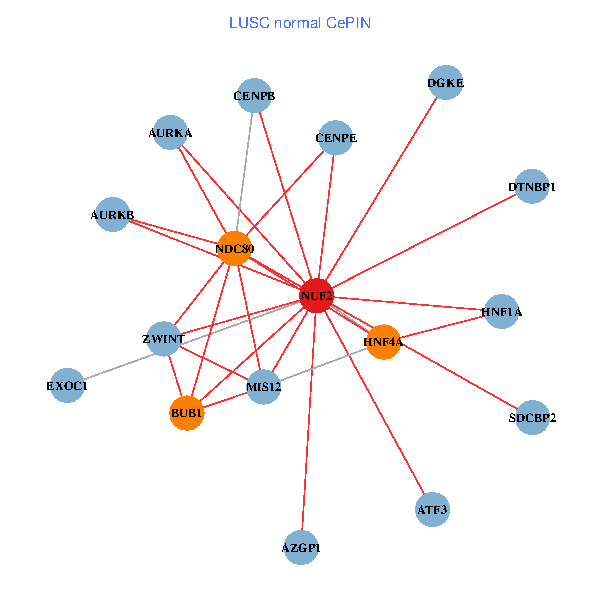
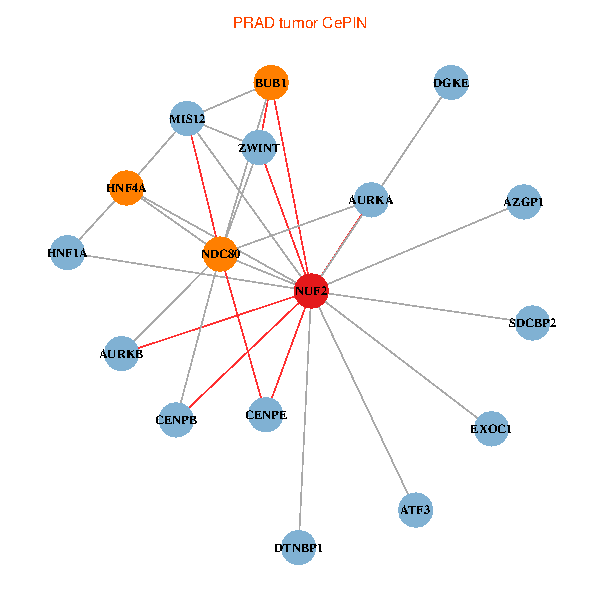
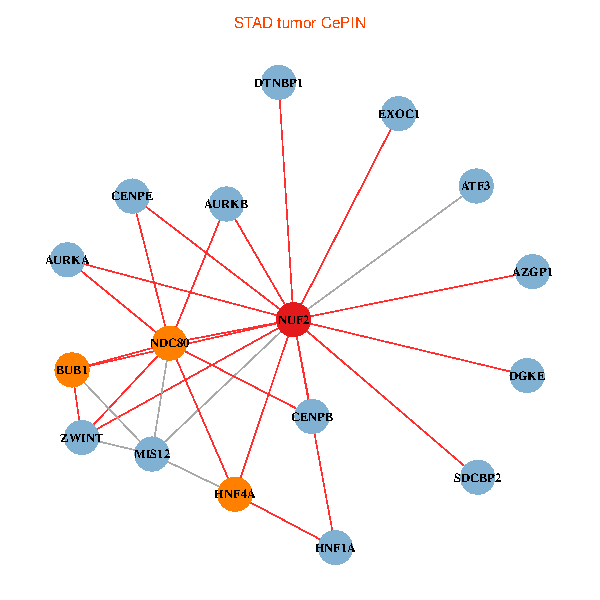
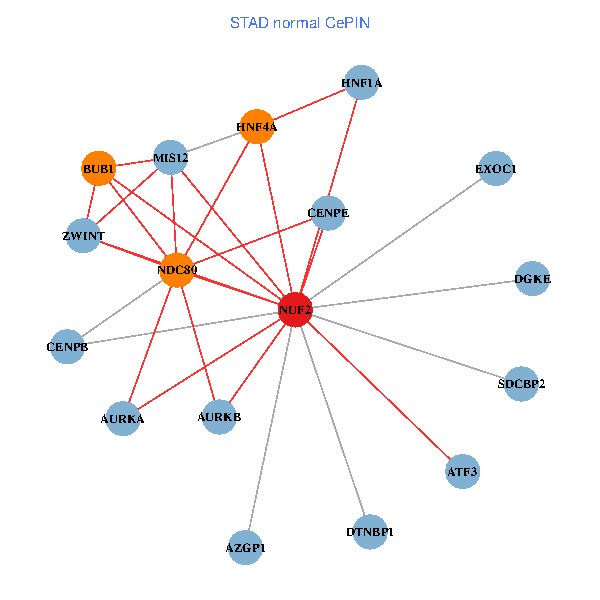
| Co-expressed gene networks based on protein-protein interaction data (CePIN) (TCGA IlluminaHiSeq_RNASeqV2, pan-cancer normalized log2(norm_counts+1) data, version 2016-08-16) (PINA2 ppi data) |
| BRCA (tumor) | BRCA (normal) |
| NUF2, HNF4A, ATF3, AURKA, EXOC1, NDC80, DGKE, HNF1A, DTNBP1, ZWINT, BUB1, AURKB, CENPB, SDCBP2, MIS12, CENPE, AZGP1 (tumor) | NUF2, HNF4A, ATF3, AURKA, EXOC1, NDC80, DGKE, HNF1A, DTNBP1, ZWINT, BUB1, AURKB, CENPB, SDCBP2, MIS12, CENPE, AZGP1 (normal) |
 |  |
| COAD (tumor) | COAD (normal) |
| NUF2, HNF4A, ATF3, AURKA, EXOC1, NDC80, DGKE, HNF1A, DTNBP1, ZWINT, BUB1, AURKB, CENPB, SDCBP2, MIS12, CENPE, AZGP1 (tumor) | NUF2, HNF4A, ATF3, AURKA, EXOC1, NDC80, DGKE, HNF1A, DTNBP1, ZWINT, BUB1, AURKB, CENPB, SDCBP2, MIS12, CENPE, AZGP1 (normal) |
 |  |
| HNSC (tumor) | HNSC (normal) |
| NUF2, HNF4A, ATF3, AURKA, EXOC1, NDC80, DGKE, HNF1A, DTNBP1, ZWINT, BUB1, AURKB, CENPB, SDCBP2, MIS12, CENPE, AZGP1 (tumor) | NUF2, HNF4A, ATF3, AURKA, EXOC1, NDC80, DGKE, HNF1A, DTNBP1, ZWINT, BUB1, AURKB, CENPB, SDCBP2, MIS12, CENPE, AZGP1 (normal) |
 |  |
| KICH (tumor) | KICH (normal) |
| NUF2, HNF4A, ATF3, AURKA, EXOC1, NDC80, DGKE, HNF1A, DTNBP1, ZWINT, BUB1, AURKB, CENPB, SDCBP2, MIS12, CENPE, AZGP1 (tumor) | NUF2, HNF4A, ATF3, AURKA, EXOC1, NDC80, DGKE, HNF1A, DTNBP1, ZWINT, BUB1, AURKB, CENPB, SDCBP2, MIS12, CENPE, AZGP1 (normal) |
 |  |
| KIRC (tumor) | KIRC (normal) |
| NUF2, HNF4A, ATF3, AURKA, EXOC1, NDC80, DGKE, HNF1A, DTNBP1, ZWINT, BUB1, AURKB, CENPB, SDCBP2, MIS12, CENPE, AZGP1 (tumor) | NUF2, HNF4A, ATF3, AURKA, EXOC1, NDC80, DGKE, HNF1A, DTNBP1, ZWINT, BUB1, AURKB, CENPB, SDCBP2, MIS12, CENPE, AZGP1 (normal) |
 |  |
| KIRP (tumor) | KIRP (normal) |
| NUF2, HNF4A, ATF3, AURKA, EXOC1, NDC80, DGKE, HNF1A, DTNBP1, ZWINT, BUB1, AURKB, CENPB, SDCBP2, MIS12, CENPE, AZGP1 (tumor) | NUF2, HNF4A, ATF3, AURKA, EXOC1, NDC80, DGKE, HNF1A, DTNBP1, ZWINT, BUB1, AURKB, CENPB, SDCBP2, MIS12, CENPE, AZGP1 (normal) |
 |  |
| LIHC (tumor) | LIHC (normal) |
| NUF2, HNF4A, ATF3, AURKA, EXOC1, NDC80, DGKE, HNF1A, DTNBP1, ZWINT, BUB1, AURKB, CENPB, SDCBP2, MIS12, CENPE, AZGP1 (tumor) | NUF2, HNF4A, ATF3, AURKA, EXOC1, NDC80, DGKE, HNF1A, DTNBP1, ZWINT, BUB1, AURKB, CENPB, SDCBP2, MIS12, CENPE, AZGP1 (normal) |
 |  |
| LUAD (tumor) | LUAD (normal) |
| NUF2, HNF4A, ATF3, AURKA, EXOC1, NDC80, DGKE, HNF1A, DTNBP1, ZWINT, BUB1, AURKB, CENPB, SDCBP2, MIS12, CENPE, AZGP1 (tumor) | NUF2, HNF4A, ATF3, AURKA, EXOC1, NDC80, DGKE, HNF1A, DTNBP1, ZWINT, BUB1, AURKB, CENPB, SDCBP2, MIS12, CENPE, AZGP1 (normal) |
 |  |
| LUSC (tumor) | LUSC (normal) |
| NUF2, HNF4A, ATF3, AURKA, EXOC1, NDC80, DGKE, HNF1A, DTNBP1, ZWINT, BUB1, AURKB, CENPB, SDCBP2, MIS12, CENPE, AZGP1 (tumor) | NUF2, HNF4A, ATF3, AURKA, EXOC1, NDC80, DGKE, HNF1A, DTNBP1, ZWINT, BUB1, AURKB, CENPB, SDCBP2, MIS12, CENPE, AZGP1 (normal) |
 |  |
| PRAD (tumor) | PRAD (normal) |
| NUF2, HNF4A, ATF3, AURKA, EXOC1, NDC80, DGKE, HNF1A, DTNBP1, ZWINT, BUB1, AURKB, CENPB, SDCBP2, MIS12, CENPE, AZGP1 (tumor) | NUF2, HNF4A, ATF3, AURKA, EXOC1, NDC80, DGKE, HNF1A, DTNBP1, ZWINT, BUB1, AURKB, CENPB, SDCBP2, MIS12, CENPE, AZGP1 (normal) |
 |  |
| STAD (tumor) | STAD (normal) |
| NUF2, HNF4A, ATF3, AURKA, EXOC1, NDC80, DGKE, HNF1A, DTNBP1, ZWINT, BUB1, AURKB, CENPB, SDCBP2, MIS12, CENPE, AZGP1 (tumor) | NUF2, HNF4A, ATF3, AURKA, EXOC1, NDC80, DGKE, HNF1A, DTNBP1, ZWINT, BUB1, AURKB, CENPB, SDCBP2, MIS12, CENPE, AZGP1 (normal) |
 |  |
| THCA (tumor) | THCA (normal) |
| NUF2, HNF4A, ATF3, AURKA, EXOC1, NDC80, DGKE, HNF1A, DTNBP1, ZWINT, BUB1, AURKB, CENPB, SDCBP2, MIS12, CENPE, AZGP1 (tumor) | NUF2, HNF4A, ATF3, AURKA, EXOC1, NDC80, DGKE, HNF1A, DTNBP1, ZWINT, BUB1, AURKB, CENPB, SDCBP2, MIS12, CENPE, AZGP1 (normal) |
 |  |
| Top |
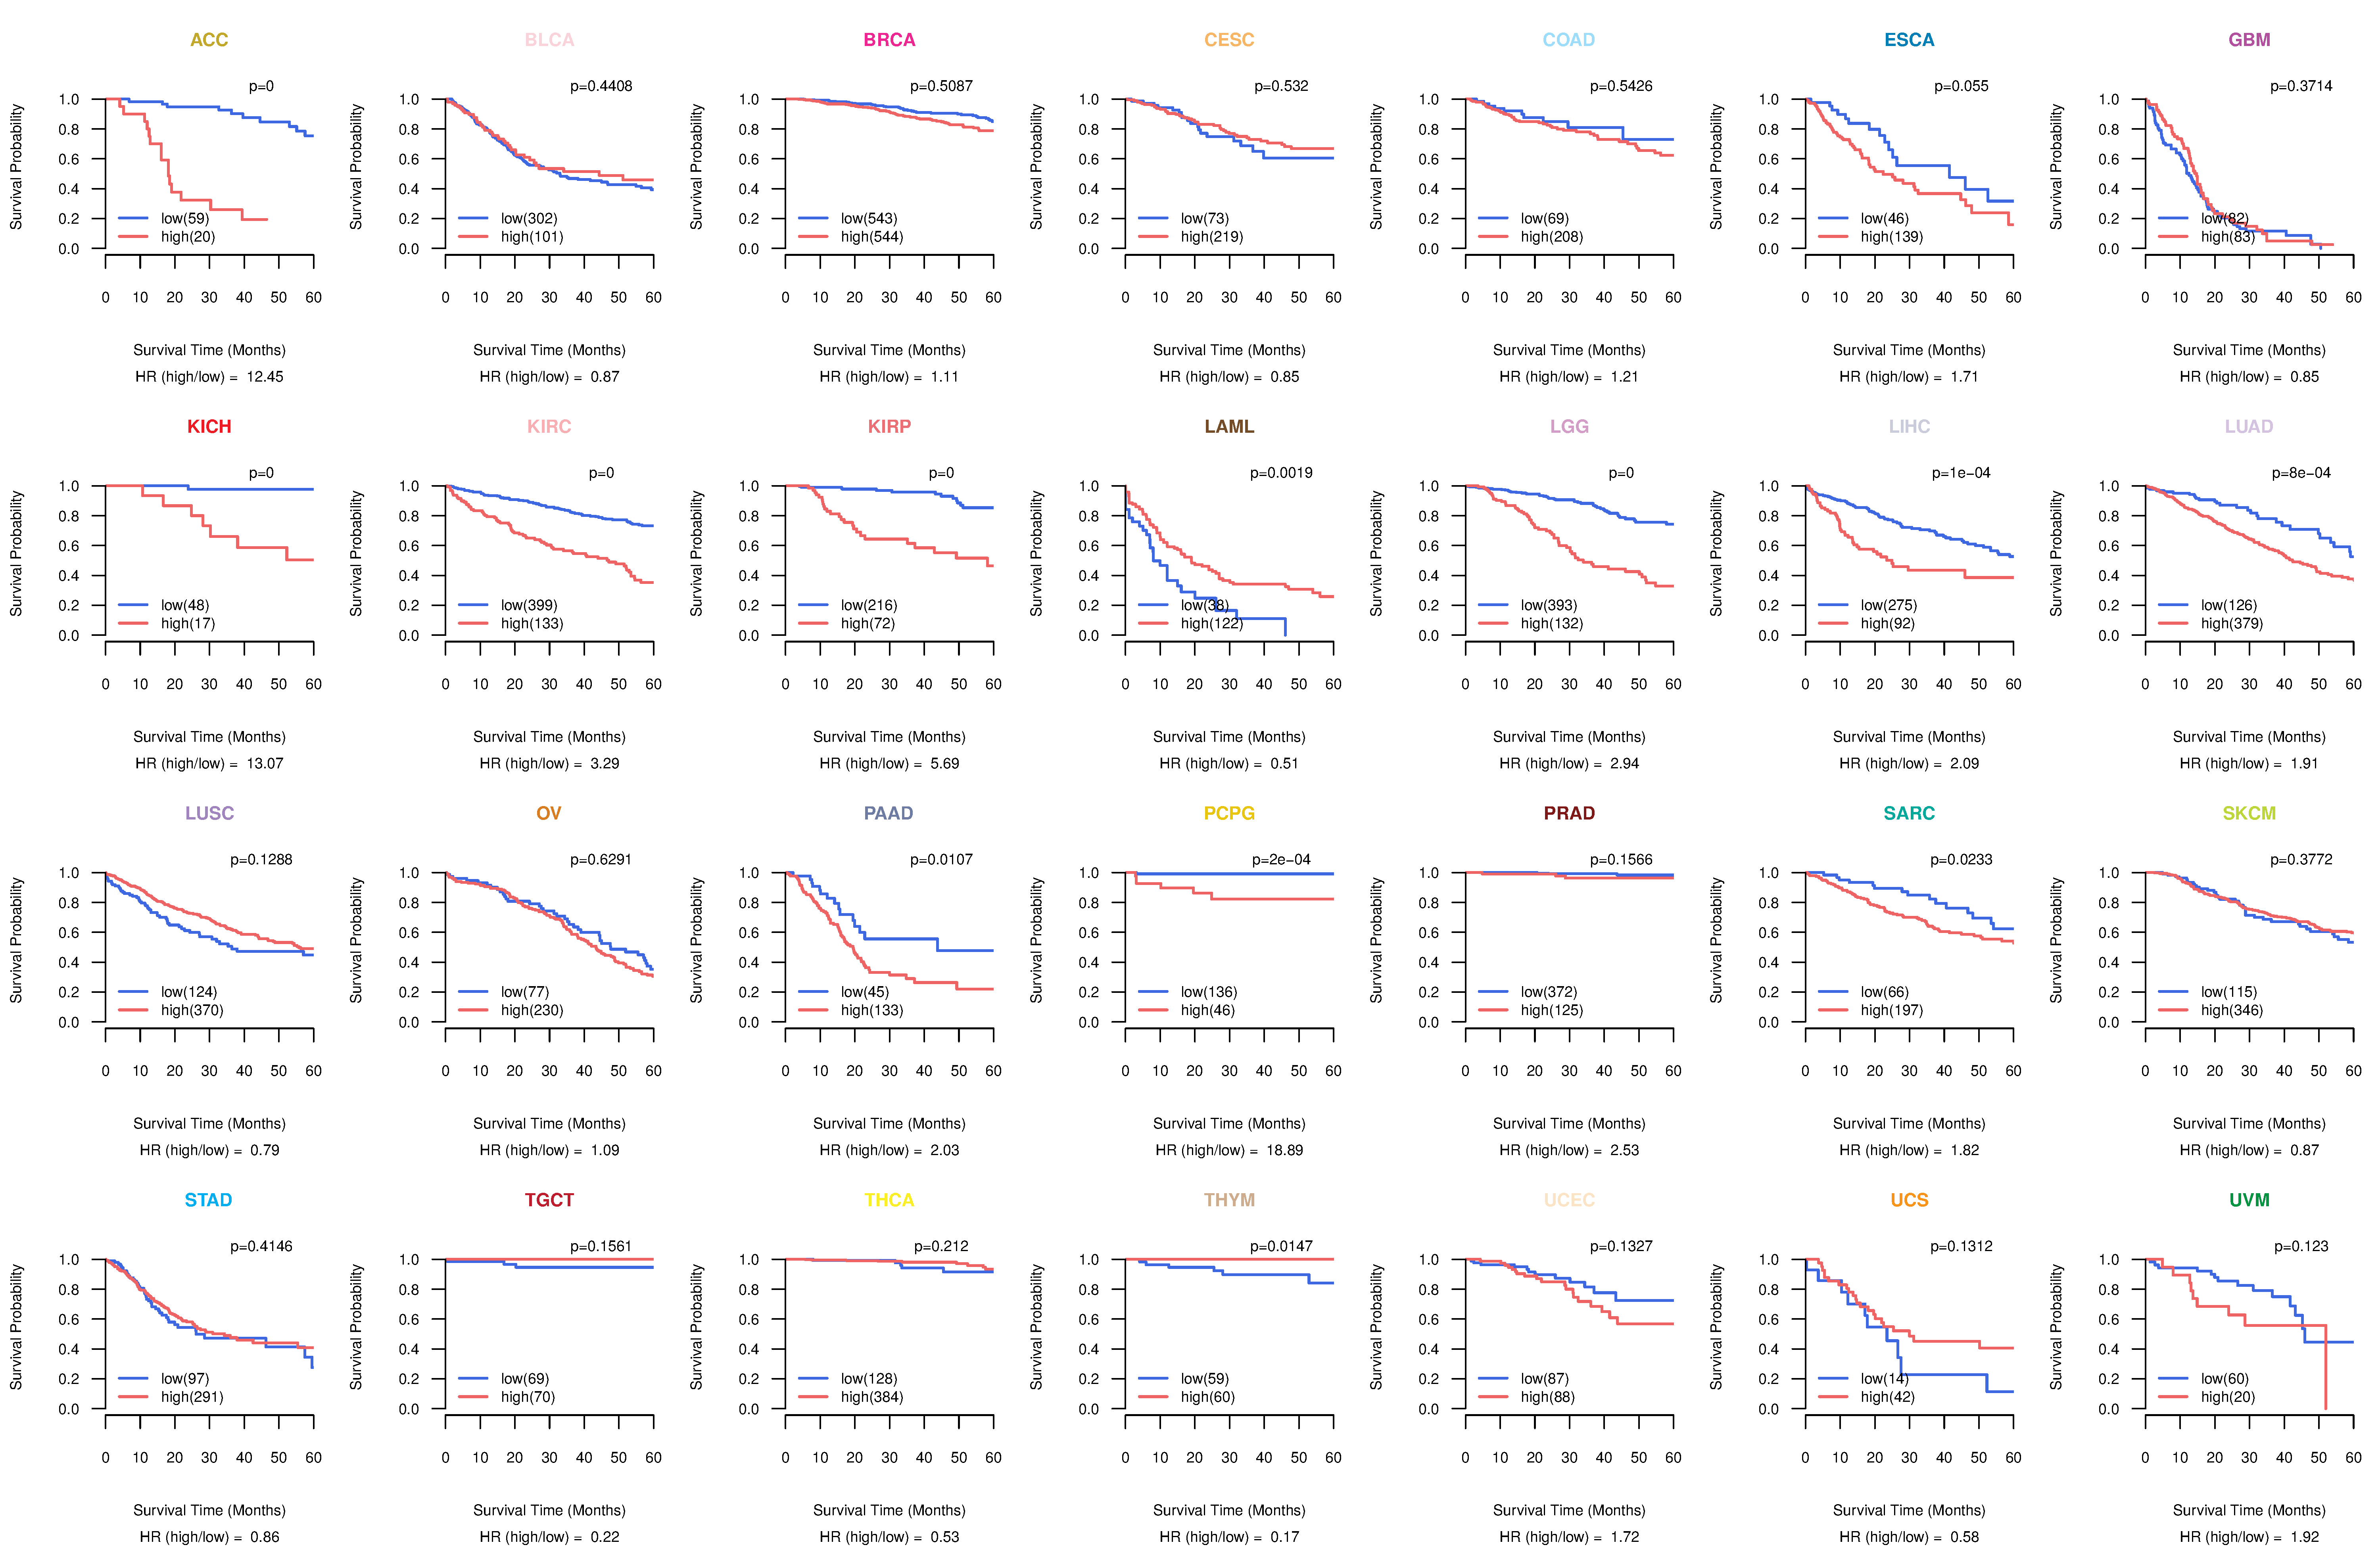
| TissGeneProg for NUF2 |
| Kaplan-Meier plots with logrank tests of overall survival (OS) using 28 cancer types (TCGA IlluminaHiSeq_RNASeqV2, pan-cancer normalized log2(norm_counts+1) data, version 2016-08-16) (TCGA clinicalMatrix, phenotype data, version 2016-04-27) * Click on the image to enlarge it in a new window. |
 |
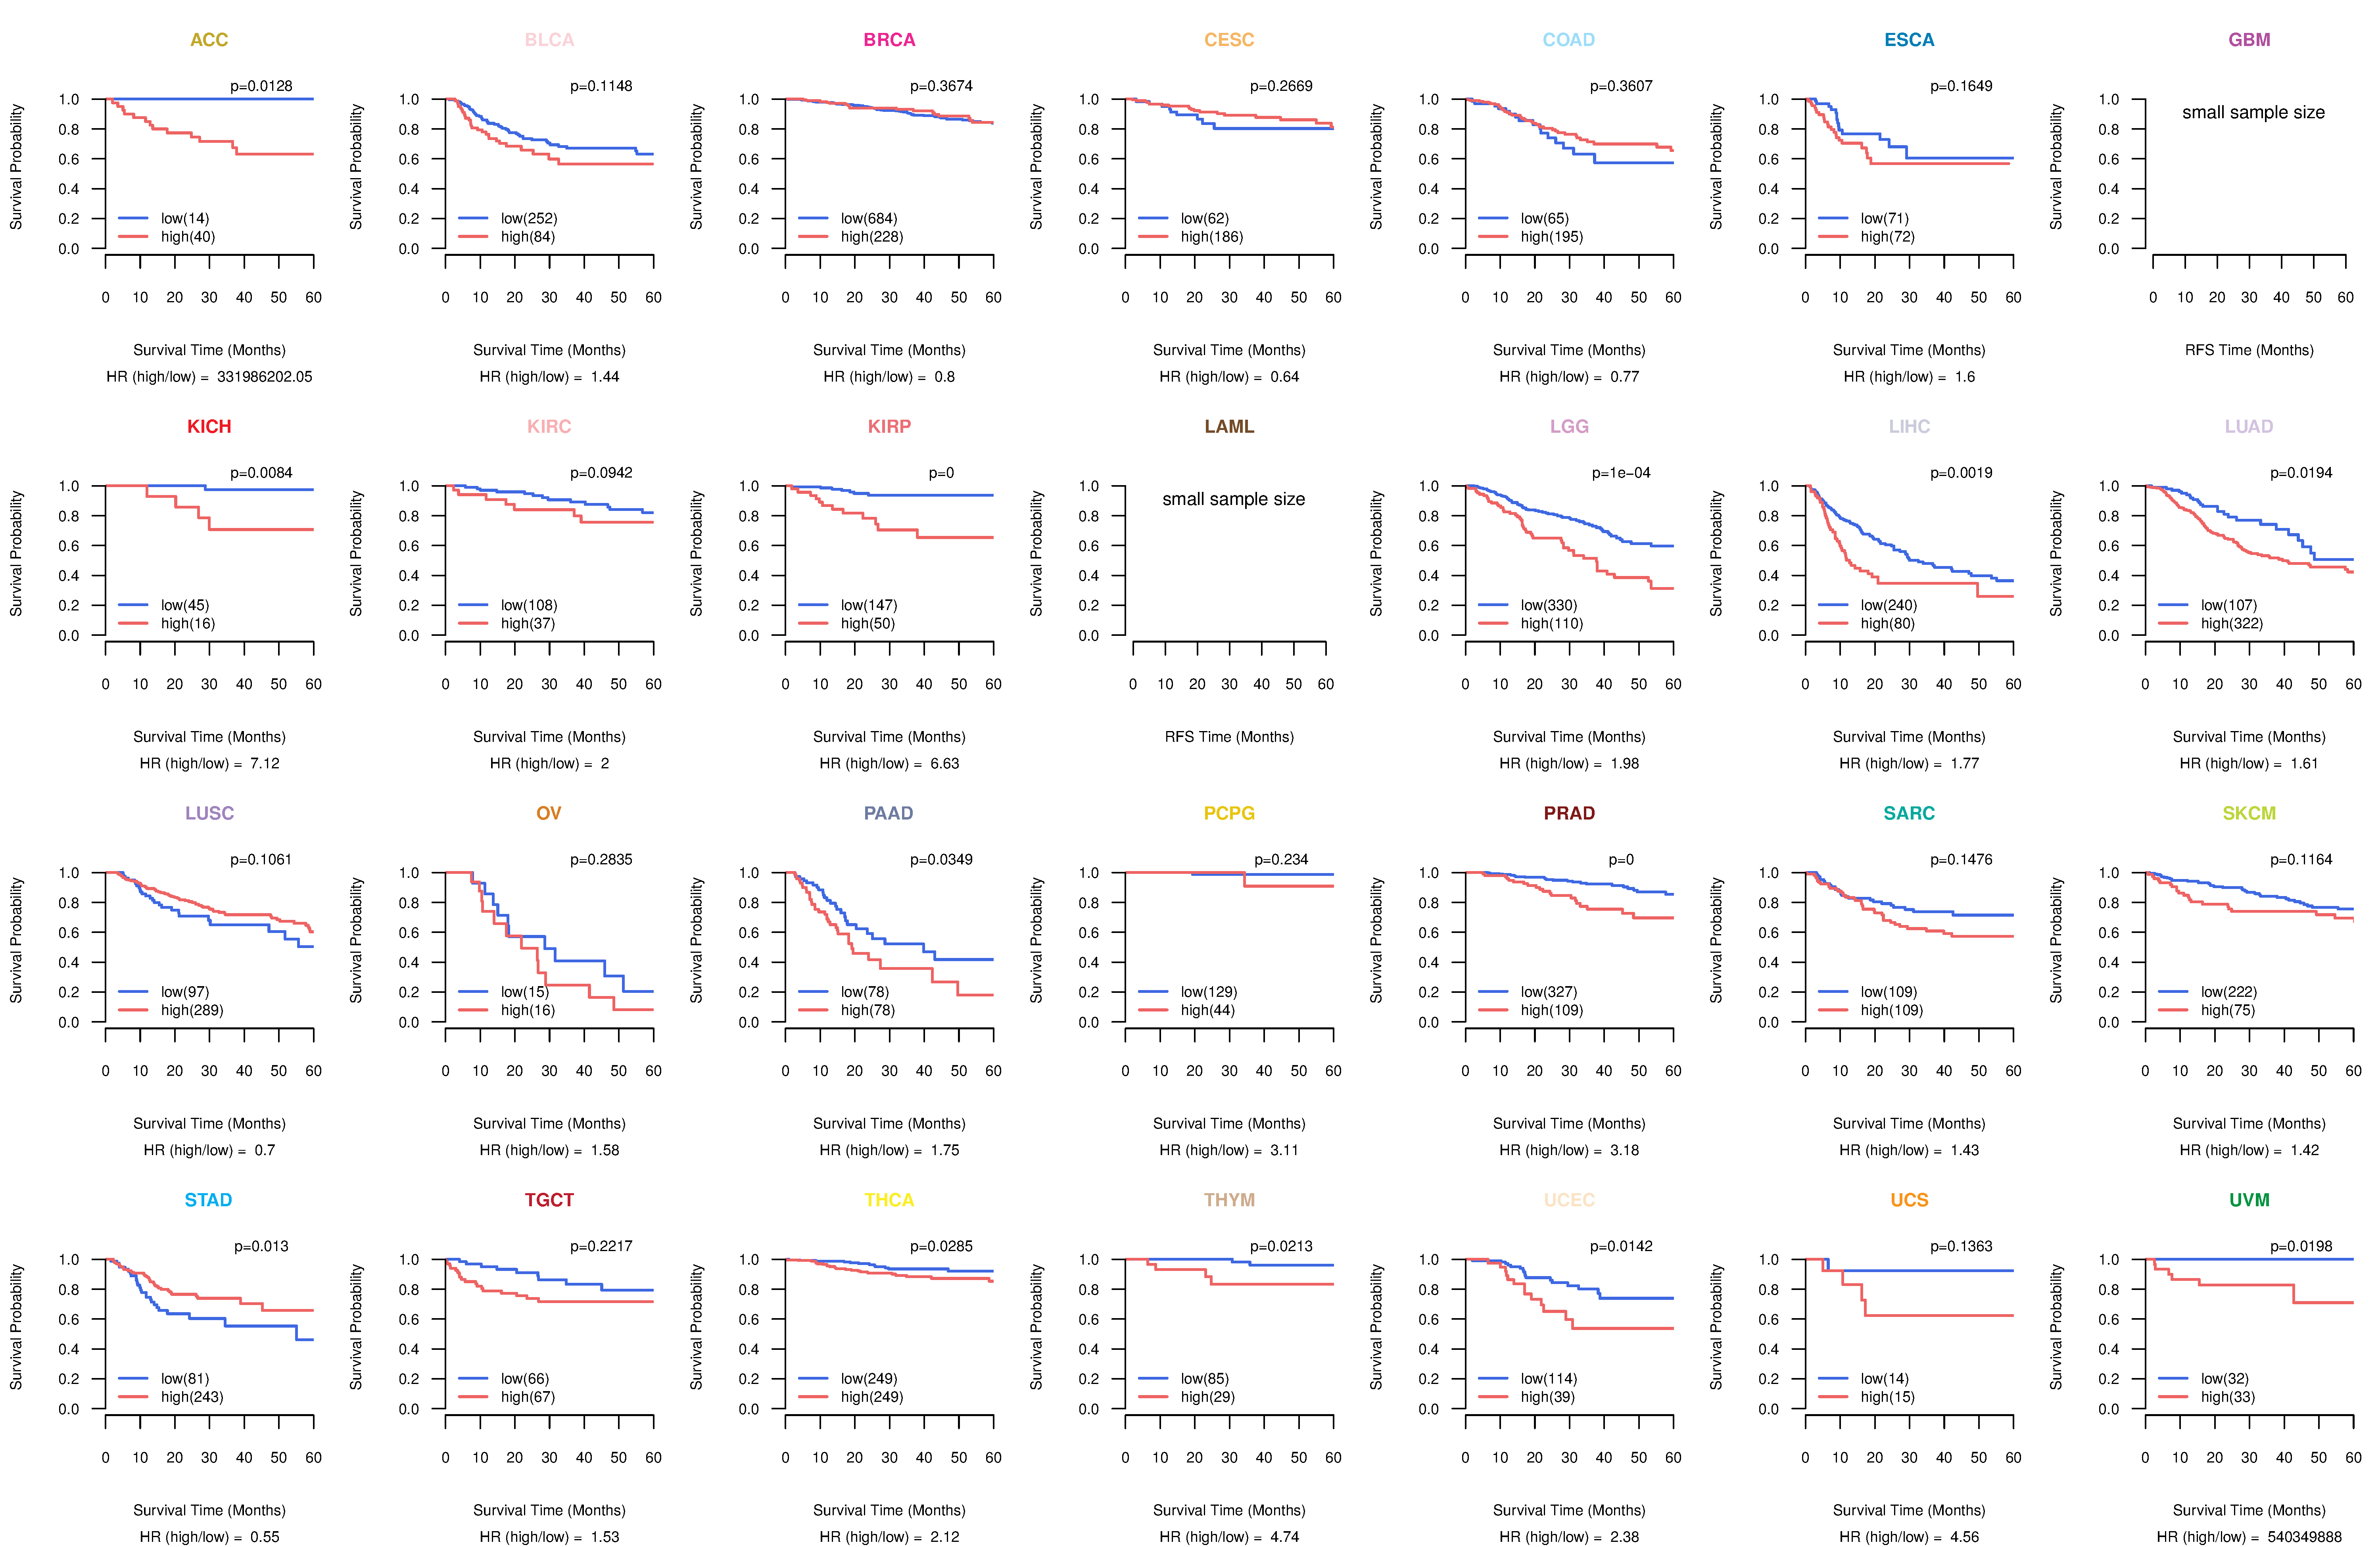
| Kaplan-Meier plots with logrank test of relapse free survival (RFS) using 28 cancer types (TCGA IlluminaHiSeq_RNASeqV2, pan-cancer normalized log2(norm_counts+1) data, version 2016-08-16) (TCGA clinicalMatrix, phenotype data, version 2016-04-27) * Click on the image enlarge it in a new window. |
 |
| Forest plot of Cox proportional hazard ratio (HR) and 95% CI of overall survival (OS) using 28 cancer types (TCGA IlluminaHiSeq_RNASeqV2, pan-cancer normalized log2(norm_counts+1) data, version 2016-08-16) (TCGA clinicalMatrix, phenotype data, version 2016-04-27) * Click on the image enlarge it in a new window. |
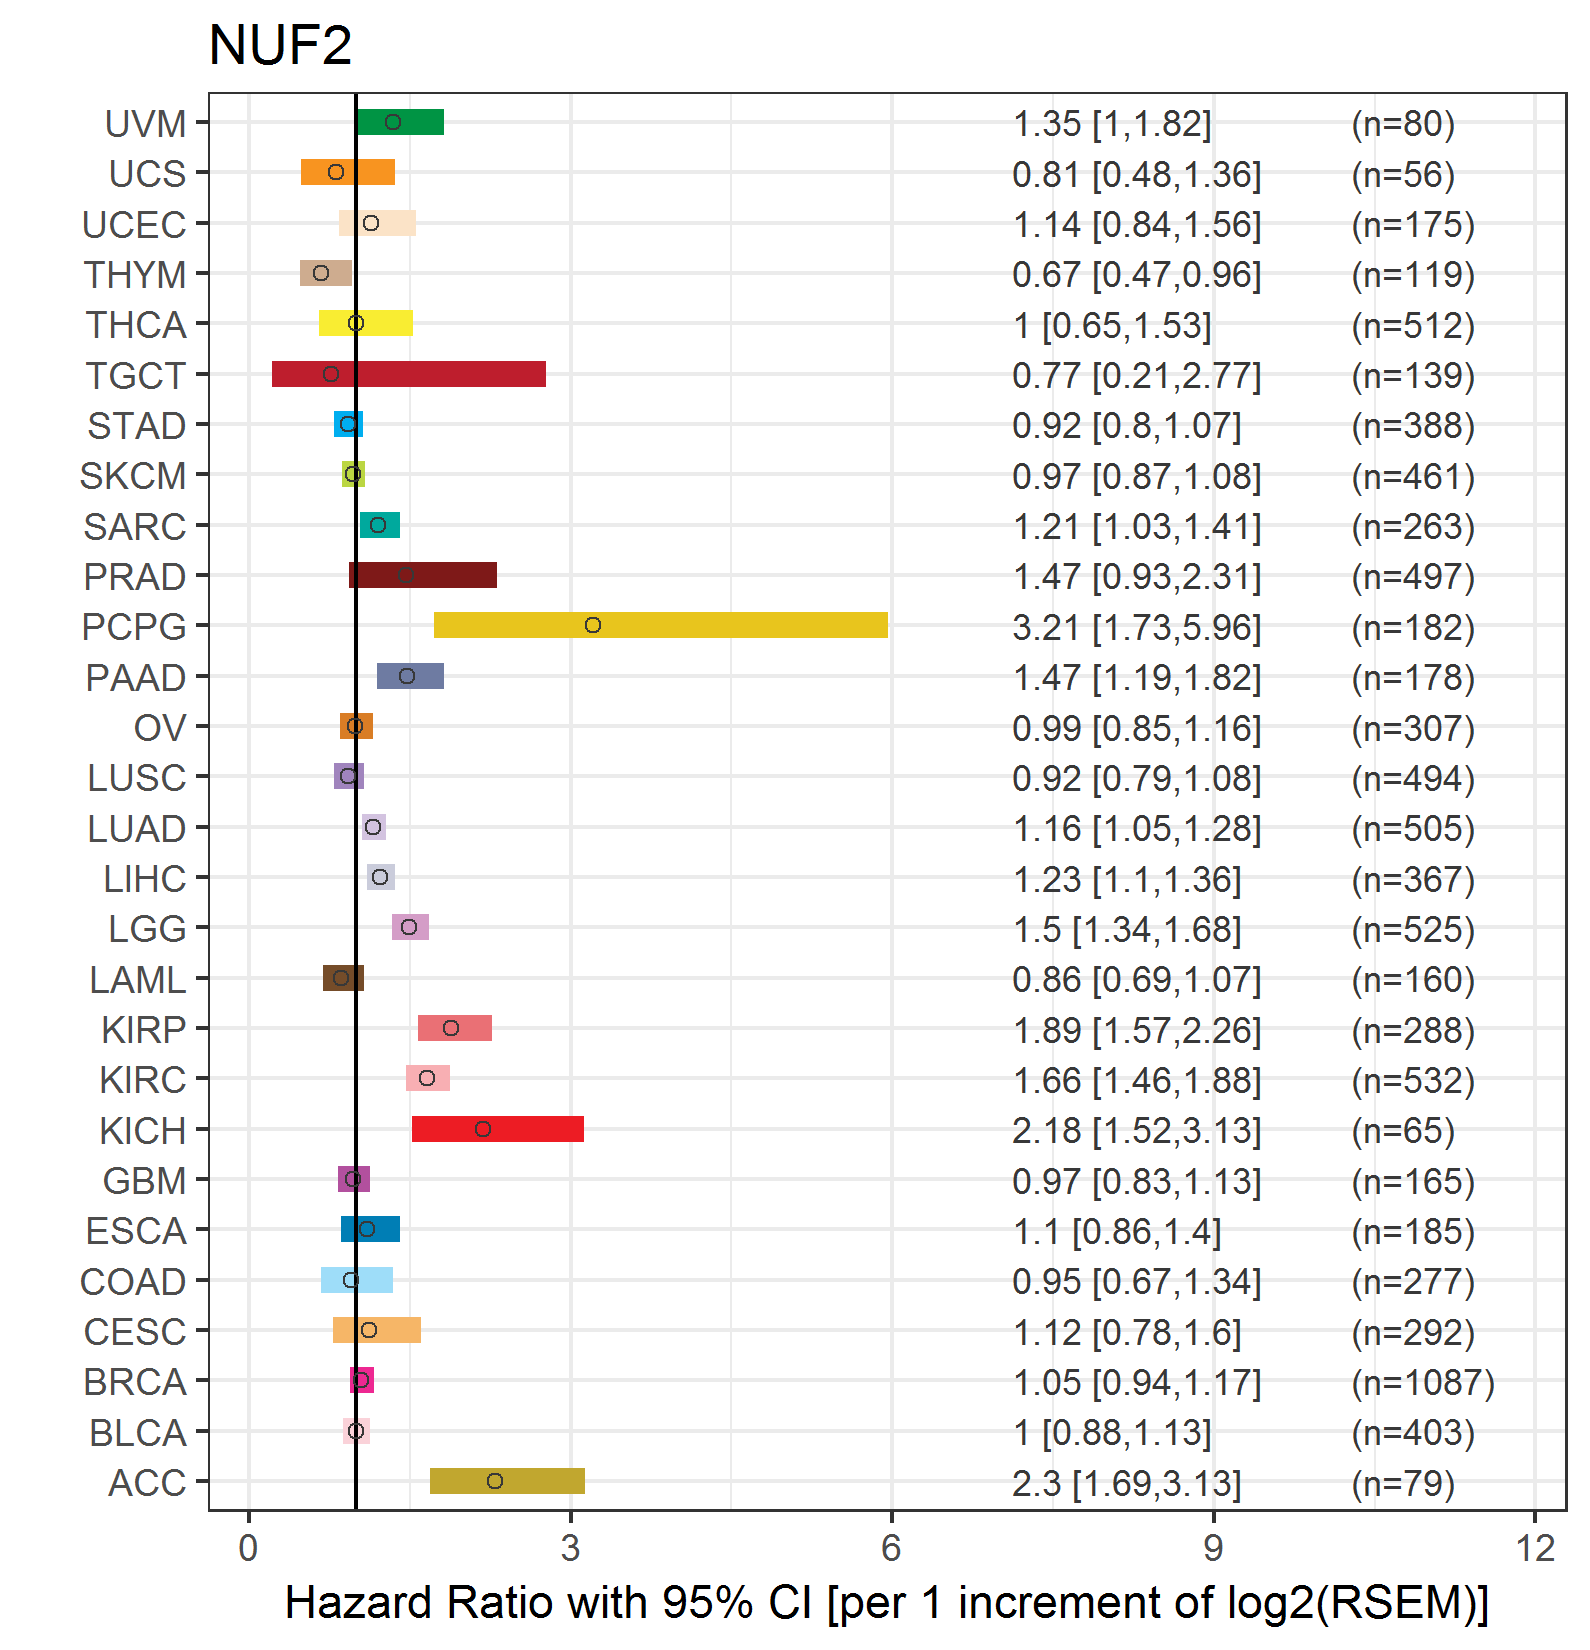 |
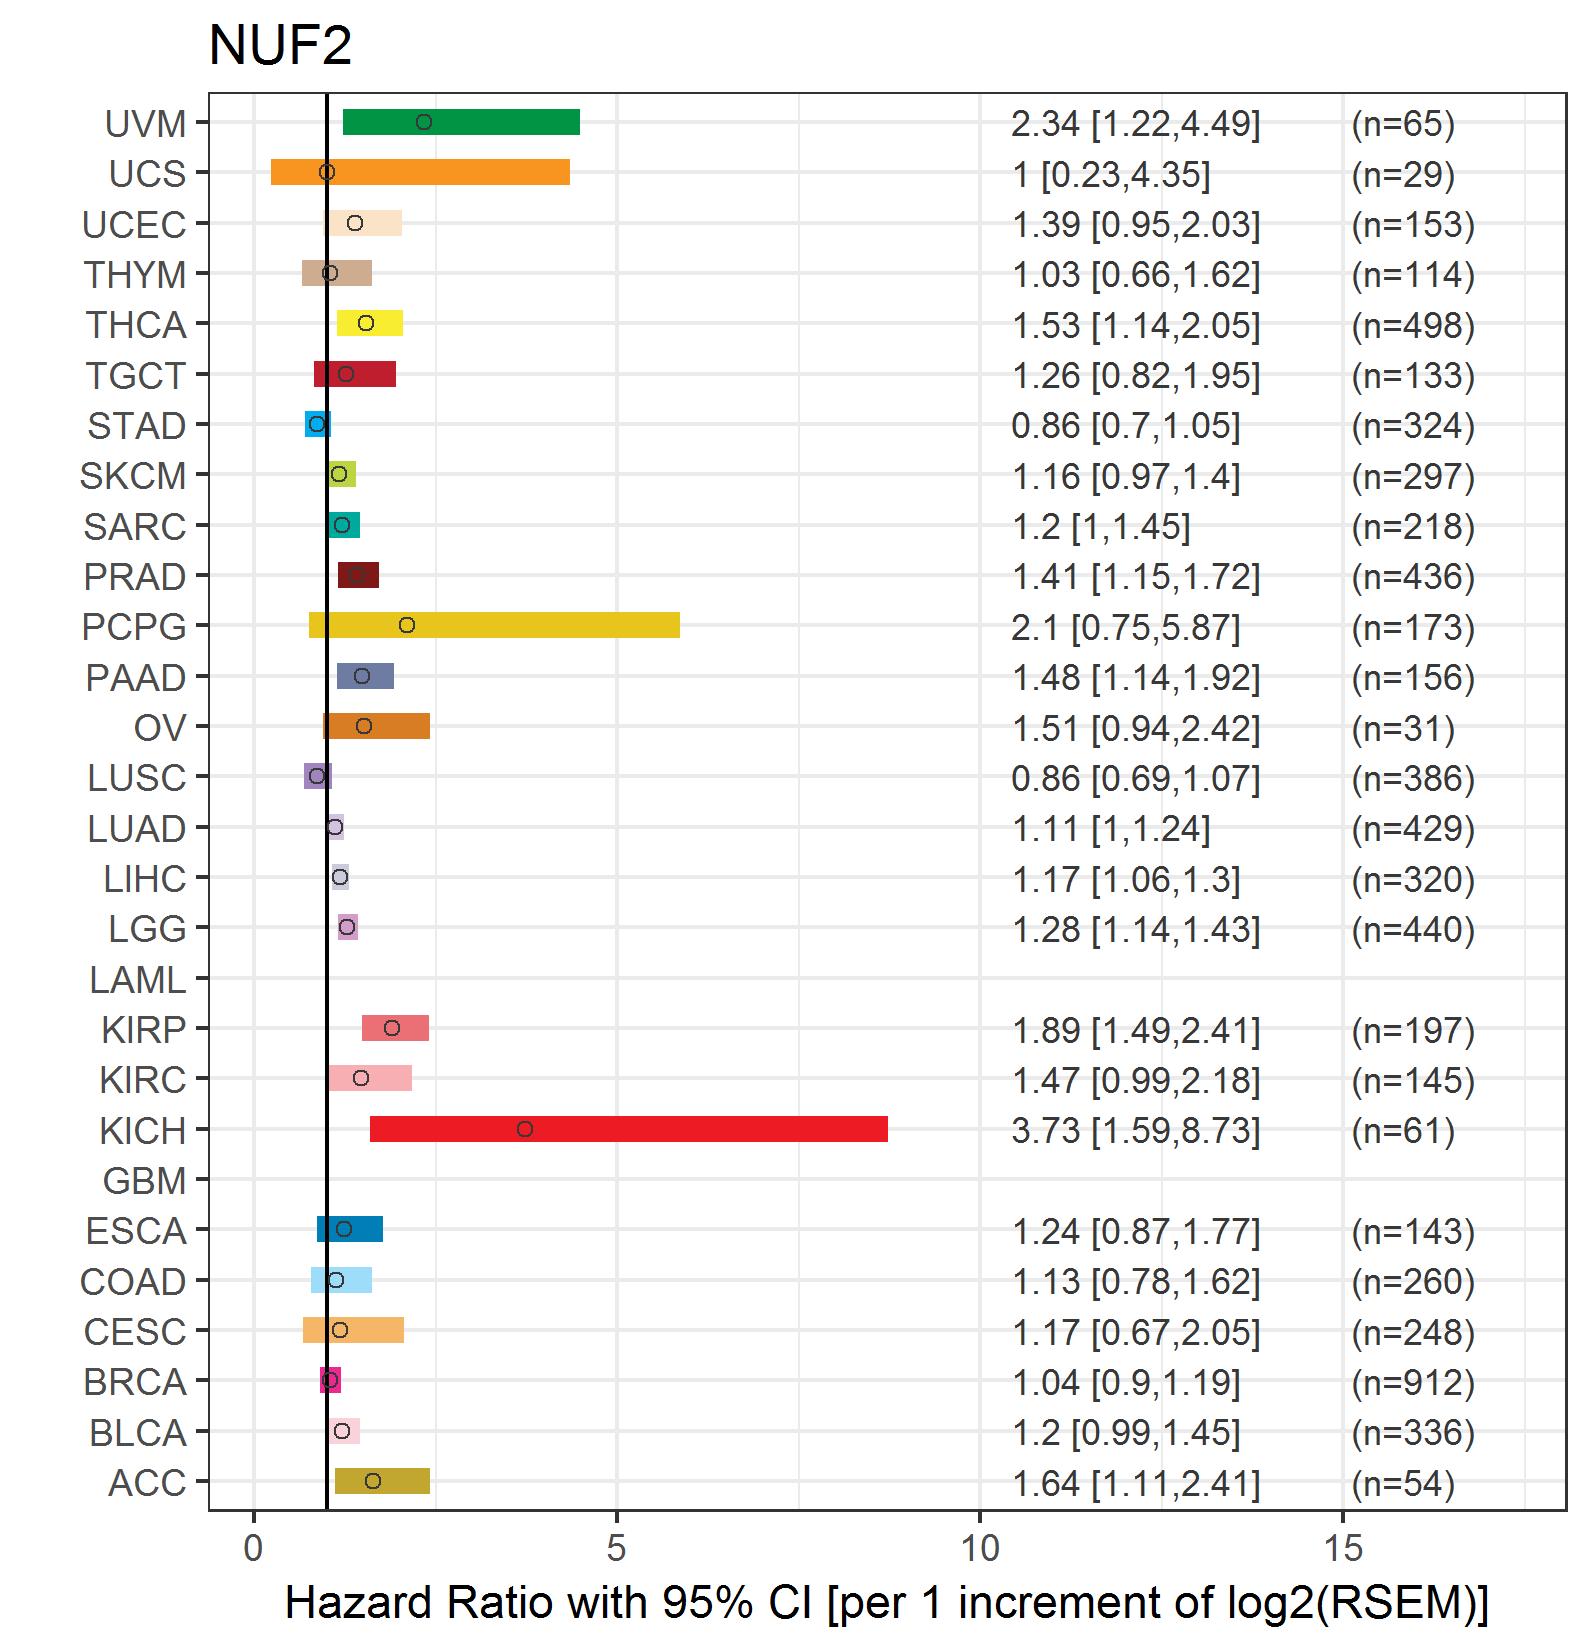
| Forest plot of Cox proportional hazard ratio (HR) and 95% CI of relapse free survival (RFS) using 28 cancer types (TCGA IlluminaHiSeq_RNASeqV2, pan-cancer normalized log2(norm_counts+1) data, version 2016-08-16) (TCGA clinicalMatrix, phenotype data, version 2016-04-27) * Click on the image enlarge it in a new window. |
 |
| Top |
| TissGeneClin for NUF2 |
| TissGeneDrug for NUF2 |
| Drug information targeting TissGene (DrugBank Version 5.0.6, 2017-04-01) |
| DrugBank ID | Drug name | Drug activity | Drug type | Drug status |
| Top |
| TissGeneDisease for NUF2 |
| Disease information associated with TissGene (DisGeNet, 2016-06-01) |
| Disease ID | Disease name | # pubmeds | Source |
| umls:C0007131 | Non-Small Cell Lung Carcinoma | 2 | BeFree |
| umls:C0017638 | Glioma | 2 | BeFree |
| umls:C0024623 | Malignant neoplasm of stomach | 2 | BeFree |
| umls:C0153594 | Malignant neoplasm of testis | 2 | BeFree |
| umls:C0242379 | Malignant neoplasm of lung | 2 | BeFree |
| umls:C0684249 | Carcinoma of lung | 2 | BeFree |
| umls:C0001418 | Adenocarcinoma | 1 | BeFree |
| umls:C0006142 | Malignant neoplasm of breast | 1 | GAD |
| umls:C0007102 | Malignant tumor of colon | 1 | BeFree |
| umls:C0007134 | Renal Cell Carcinoma | 1 | BeFree |
| umls:C0020538 | Hypertensive disease | 1 | GAD |
| umls:C0162872 | Aortic Aneurysm, Thoracic | 1 | BeFree |
| umls:C0235974 | Pancreatic carcinoma | 1 | BeFree |
| umls:C0346647 | Malignant neoplasm of pancreas | 1 | BeFree |
| umls:C0699790 | Colon Carcinoma | 1 | BeFree |
| umls:C0699791 | Stomach Carcinoma | 1 | BeFree |
| umls:C1527249 | Colorectal Cancer | 1 | BeFree |
| umls:C2239176 | Liver carcinoma | 1 | BeFree |
|
Copyright 2016-Present - The University of Texas Health Science Center at Houston (UTHealth) Web File Viewing | How to Report, Fraud, Waste and Abuse | State of Texas | Statewide Search | Texas Homeland Security | Site Policies |