 |
| |
| |
| |
| |
| |
| |
|

| TissGeneSummary for INHBE |
 Gene summary Gene summary |
| Basic gene information | Gene symbol | INHBE |
| Gene name | inhibin, beta E | |
| Synonyms | - | |
| Cytomap | UCSC genome browser: 12q13.3 | |
| Type of gene | protein-coding | |
| RefGenes | NM_031479.3, | |
| Description | activin beta Eactivin beta-E chaininhibin beta E chain | |
| Modification date | 20141207 | |
| dbXrefs | MIM : 612031 | |
| HGNC : HGNC | ||
| Ensembl : ENSG00000139269 | ||
| HPRD : 11047 | ||
| Vega : OTTHUMG00000169995 | ||
| Protein | UniProt: go to UniProt's Cross Reference DB Table | |
| Expression | CleanEX: HS_INHBE | |
| BioGPS: 83729 | ||
| Pathway | NCI Pathway Interaction Database: INHBE | |
| KEGG: INHBE | ||
| REACTOME: INHBE | ||
| Pathway Commons: INHBE | ||
| Context | iHOP: INHBE | |
| ligand binding site mutation search in PubMed: INHBE | ||
| UCL Cancer Institute: INHBE | ||
| Assigned class in TissGDB* | C | |
| Included tissue-specific gene expression resources | HPA,GTEx | |
| Specific-tissues in normal samples (assigned by TissGDB using HPA, TiGER, and GTEx) | Liver | |
| Cancer types related to the specific-tissues in cancer samples (assigned by TissGDB using TCGA) | LIHC | |
| Reference showing the relevant tissue of INHBE | ||
| Description by TissGene annotations | Cancer gene TissgsKTS | |
| * Class A consists of genes with literature evidence and is part of the cTissGenes. Class B consists of only cTissGenes without additional evidence. The remaining genes belong to Class C. |
| Gene ontology having evidence of Inferred from Direct Assay (IDA) from Entrez |
| GO ID | GO term | PubMed ID |
| Top |
| TissGeneExp for INHBE |
| Gene expressions across 28 cancer types (X-axis: cancer type and Y-axis: log2(norm_counts+1)) (TCGA IlluminaHiSeq_RNASeqV2, pan-cancer normalized log2(norm_counts+1) data, version 2016-08-16) |
 |
| Gene isoform expressions across 28 cancer types (X-axis: cancer type and Y-axis: log2(norm_counts+1)) (TCGA pan-cancer tcga_rsem_isoform_tpm, version 2016-09-01) |
 |
| Gene expressions across normal tissues of GTEx data (GTEx GTEx_Analysis_v6_RNA-seq_RNA-SeQCv1.1.8_gene_rpkm.gct) - Here, we shows the matched tissue types only among our 28 cancer types. |
 |
| Different expressions across 14 cancer types with more than 10 samples between matched tumors and normals (X-axis: cancer type and Y-axis: log2(norm_counts+1)) (TCGA IlluminaHiSeq_RNASeqV2, pan-cancer normalized log2(norm_counts+1) data, version 2016-08-16) |
 |
| - Significantly differentially expressed cancer types and information. (|Fold change|>1 and FDR<0.05) |
| Cancer type | Mean(exp) in tumor | Mean(exp) in matched normal | Log2FC | P-val. | FDR |
| COAD | -0.914042741 | -2.284238895 | 1.370196154 | 1.03E-06 | 5.82E-06 |
| LUSC | -0.40778437 | -2.457262802 | 2.049478431 | 1.31E-11 | 5.38E-11 |
| KIRC | 0.560709502 | -1.74033772 | 2.301047222 | 3.08E-12 | 1.27E-11 |
| LUAD | -1.449405871 | -2.642464492 | 1.193058621 | 3.04E-07 | 1.11E-06 |
| ESCA | -1.54947421 | -2.983419664 | 1.433945455 | 0.00212 | 0.02334099 |
| KICH | -0.348483664 | -1.859843664 | 1.51136 | 0.00841 | 0.015318711 |
| HNSC | -0.80642199 | -1.856594083 | 1.050172093 | 0.00544 | 0.014571429 |
| LIHC | 6.113652336 | 7.216332336 | -1.10268 | 0.00318 | 0.007676935 |
| KIRP | 0.765614711 | -1.226088414 | 1.991703125 | 4.68E-05 | 0.000172859 |
| Top |
| TissGene-miRNA for INHBE |
| Significantly anti-correlated miRNAs of TissGene across 28 cancer types (Gene-miRNA relations from TargetScanHuman Relsease 7.1, Conserved_Site_Context_Scores.txt.zip, 06.01.2016) (TCGA IlluminaHiSeq_miRNASeq, log2(RPM+1) data, version 2016-11-21) (TCGA IlluminaHiSeq_RNASeqV2, log2(normalized_count+1) data, version 2016-08-16) (Spearman’s Rank Correlation (p-value<0.05 and coefficient<-0.25)) |
| Cancer type | miRNA id | miRNA accession | P-val. | Coeff. | # samples |
| Top |
| TissGeneMut for INHBE |
| TissGeneSNV for INHBE |
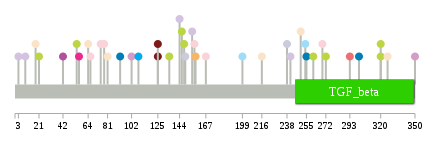
| nsSNV counts per each loci. Different colors of circles represent different cancer types. Circle size denotes number of samples. (TCGA somatic mutation (SNPs and small INDELs) data, version 2016-04-25) * Click on the image to enlarge it in a new window. |
 |
 |
| Somatic nucleotide variants of TissGene across 28 cancer types (X-axis: cancer type and Y-axis: % of mutated samples) The numbers in parentheses are numbers of samples with mutation (nsSNVs). (TCGA somatic mutation (SNPs and small INDELs) data, version 2016-04-25) |
 |
| - nsSNVs sorted by frequency. |
| AAchange | Cancer type | # samples |
| p.W9R | LUAD | 1 |
| p.G21R | SKCM | 1 |
| p.R320* | SKCM | 1 |
| p.T64N | UCEC | 1 |
| p.L108P | STAD | 1 |
| p.Q272* | SKCM | 1 |
| p.R320X | SKCM | 1 |
| p.P66T | BLCA | 1 |
| p.V92F | ESCA | 1 |
| p.G167S | BLCA | 1 |
| p.R125S | PRAD | 1 |
| p.E269K | BLCA | 1 |
| p.V254I | COAD | 1 |
| p.E269K | HNSC | 1 |
| p.R18Q | UCEC | 1 |
| p.L301F | ESCA | 1 |
| p.A75V | BLCA | 1 |
| p.S293C | KIRP | 1 |
| p.L157F | BLCA | 1 |
| p.H56P | BRCA | 1 |
| p.R125H | PRAD | 1 |
| p.L326I | UCEC | 1 |
| p.Q216R | UCEC | 1 |
| p.S199N | COAD | 1 |
| p.R149G | LIHC | 1 |
| p.L42V | GBM | 1 |
| p.G146E | SKCM | 1 |
| p.R78K | BLCA | 1 |
| p.D255V | ESCA | 1 |
| p.R148K | SKCM | 1 |
| p.R155C | LUAD | 1 |
| p.S350C | LGG | 1 |
| p.L3I | LUAD | 1 |
| p.E241V | LUAD | 1 |
| p.P81S | UCEC | 1 |
| p.G54E | SKCM | 1 |
| p.L158M | CESC | 1 |
| p.W261R | SKCM | 1 |
| p.P238T | LIHC | 1 |
| p.P135S | SKCM | 1 |
| p.R144L | LUAD | 1 |
| p.T102A | LGG | 1 |
| p.R250Q | UCEC | 1 |
| Top |
| TissGeneCNV for INHBE |
| Copy number variations of TissGene across 28 cancer types (X-axis: cancer type and Y-axis: % of CNV samples) (TCGA Gistic2_CopyNumber_Gistic2_all_data_by_genes, Gistic2 copy number data, version 2016-08-16) |
 |
| Top |
| TissGeneFusions for INHBE |
| Fusion genes including TissGene (ChimerDB 3.0, 2016-12-01 and TCGA fusion Portal 2015-12-01) |
| Database | Src | Cancer type | Sample | Fusion gene | ORF | 5'-gene BP | 3'-gene BP |
| Top |
| TissGeneNet for INHBE |
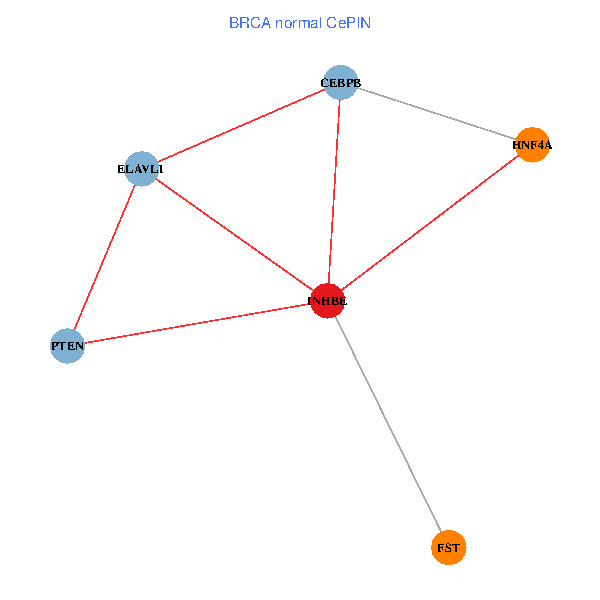
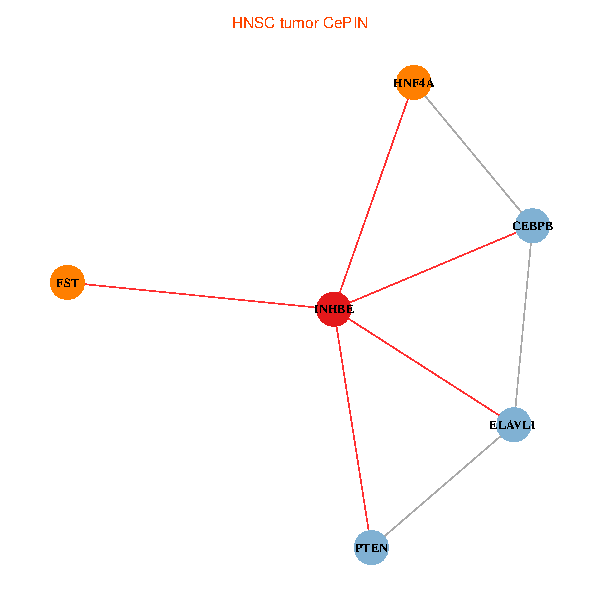
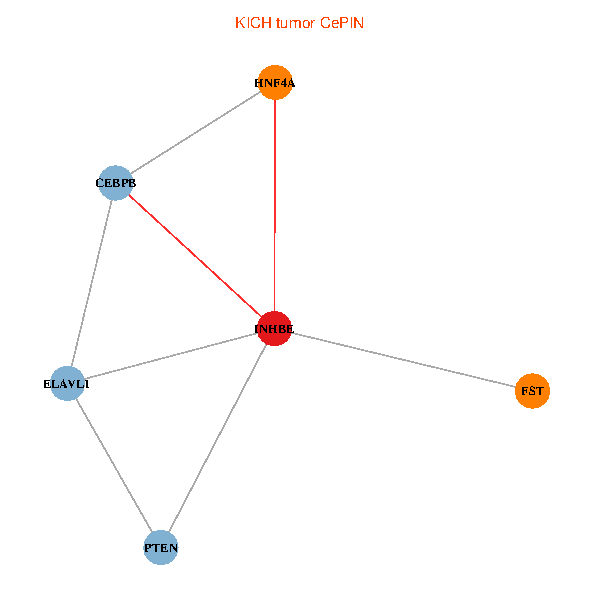
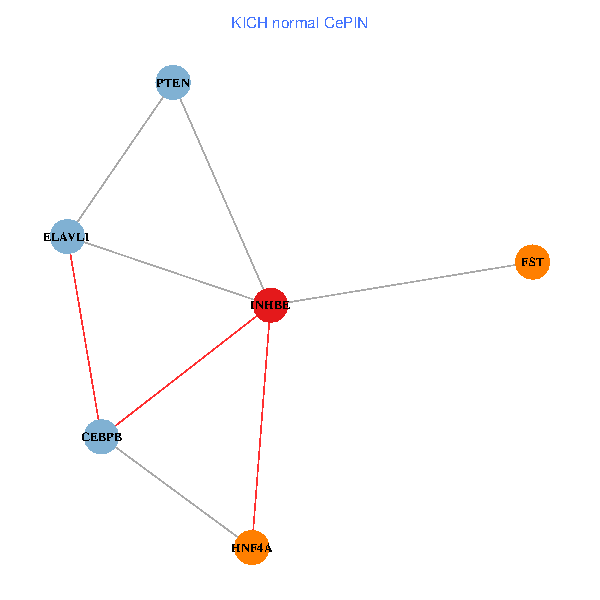
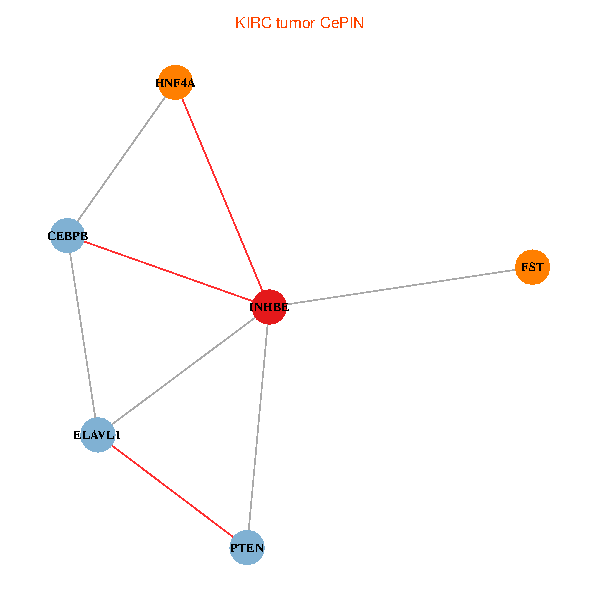
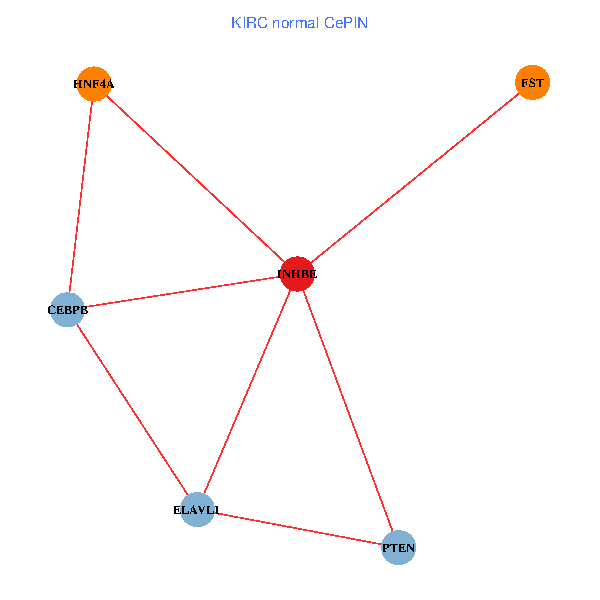
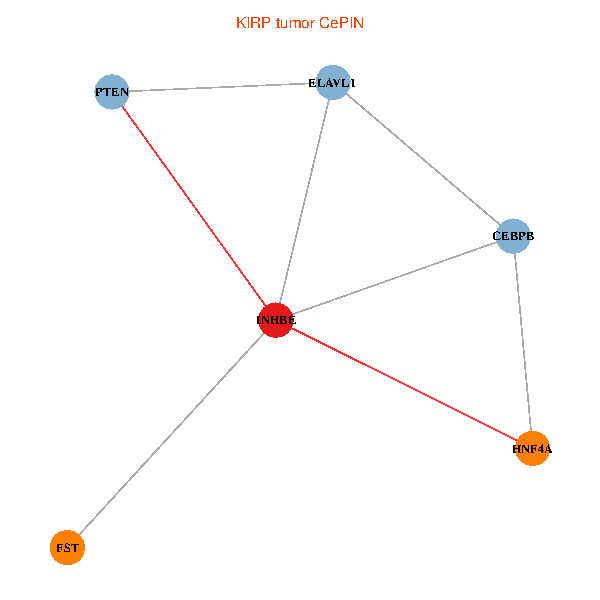
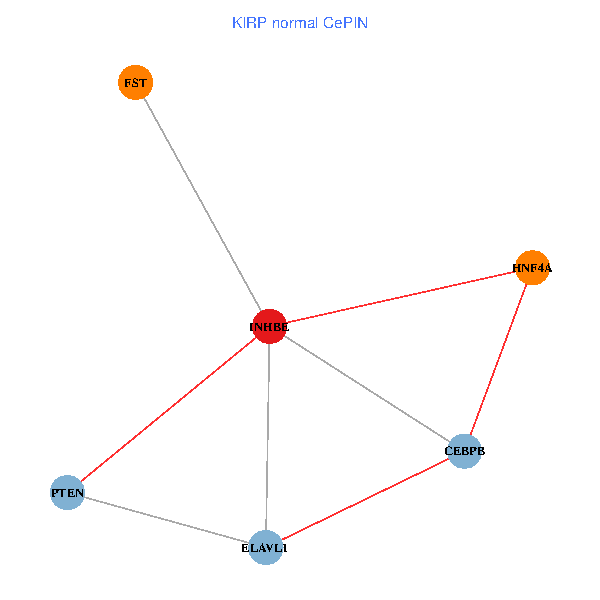
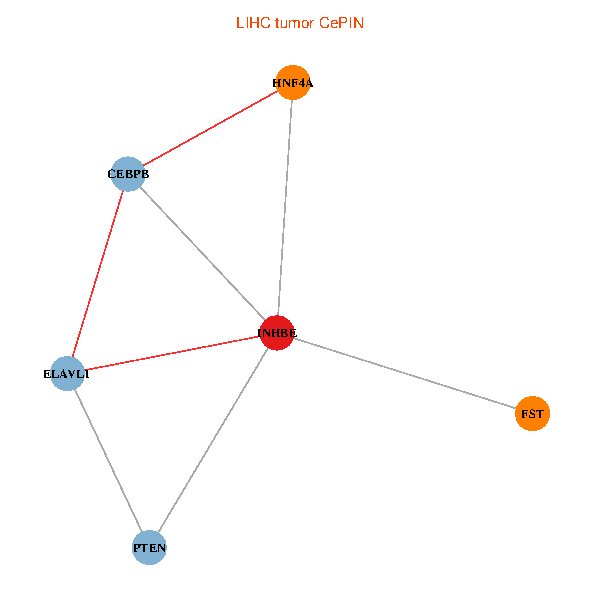
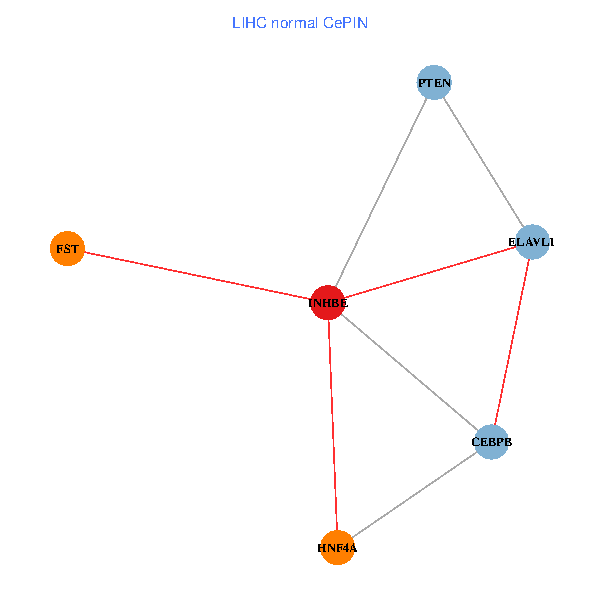
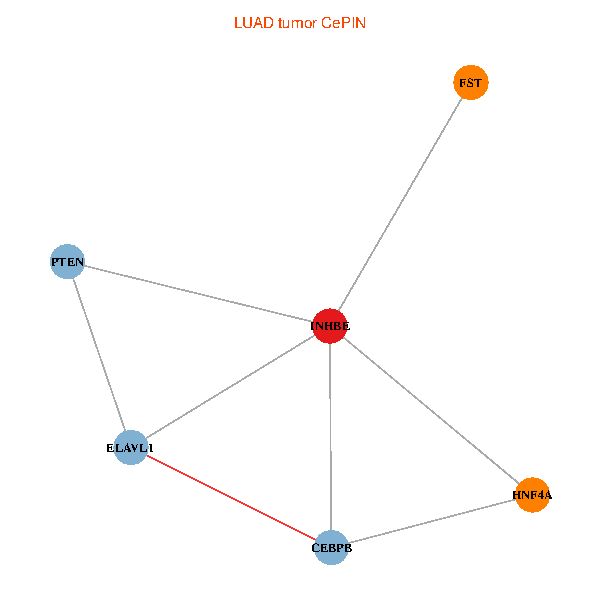
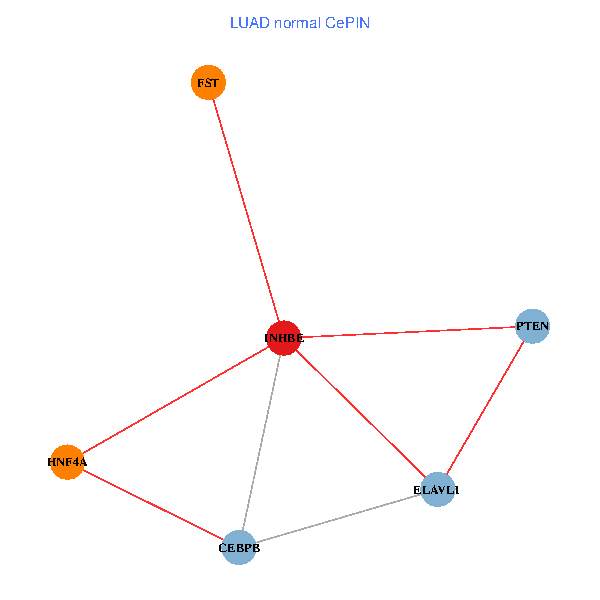
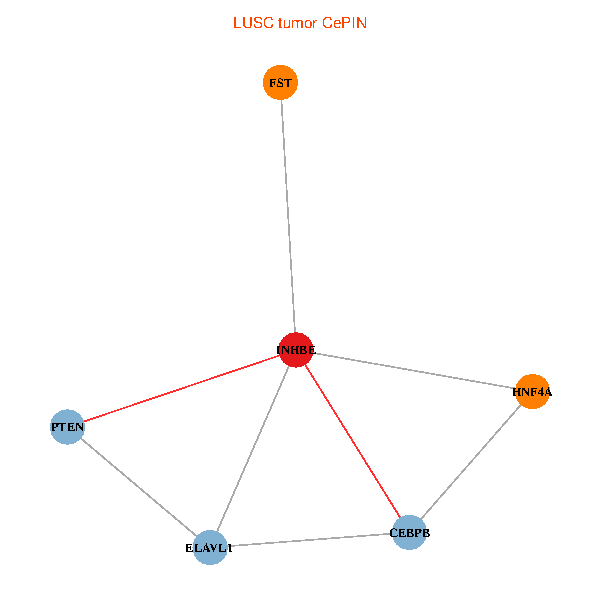
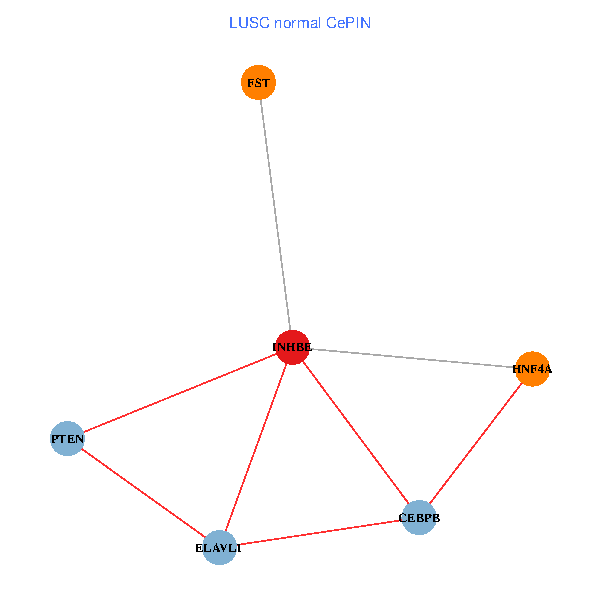
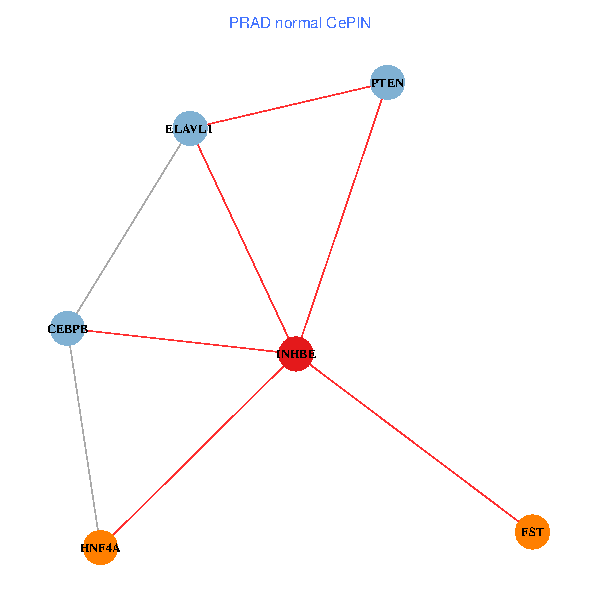
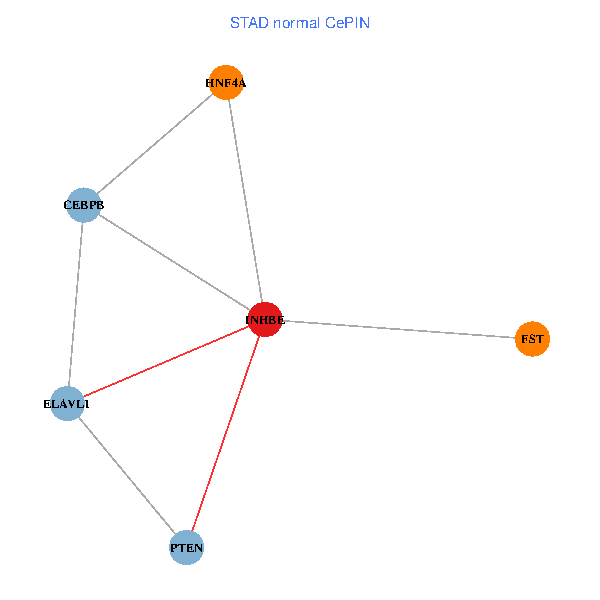
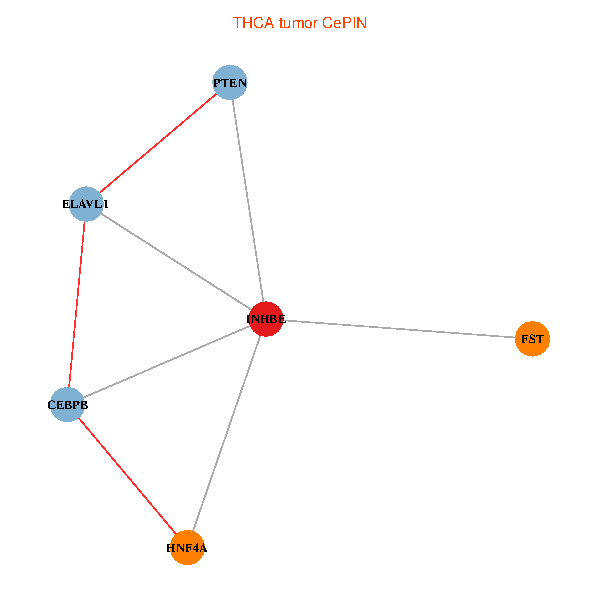
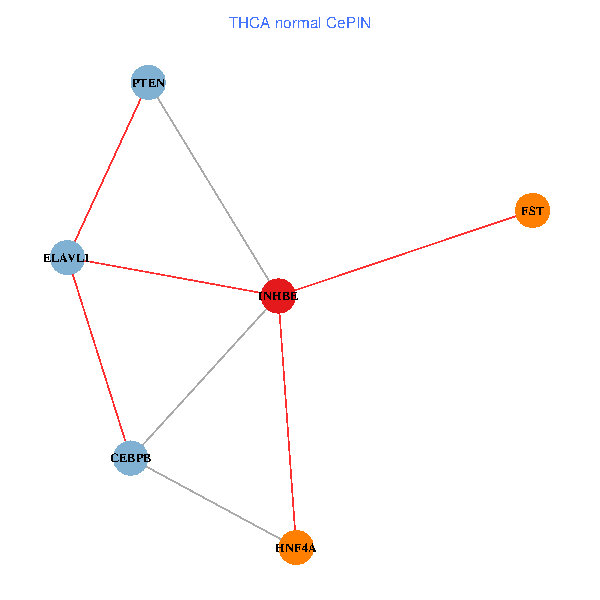
| Co-expressed gene networks based on protein-protein interaction data (CePIN) (TCGA IlluminaHiSeq_RNASeqV2, pan-cancer normalized log2(norm_counts+1) data, version 2016-08-16) (PINA2 ppi data) |
| BRCA (tumor) | BRCA (normal) |
| INHBE, HNF4A, ELAVL1, CEBPB, PTEN, FST (tumor) | INHBE, HNF4A, ELAVL1, CEBPB, PTEN, FST (normal) |
 |  |
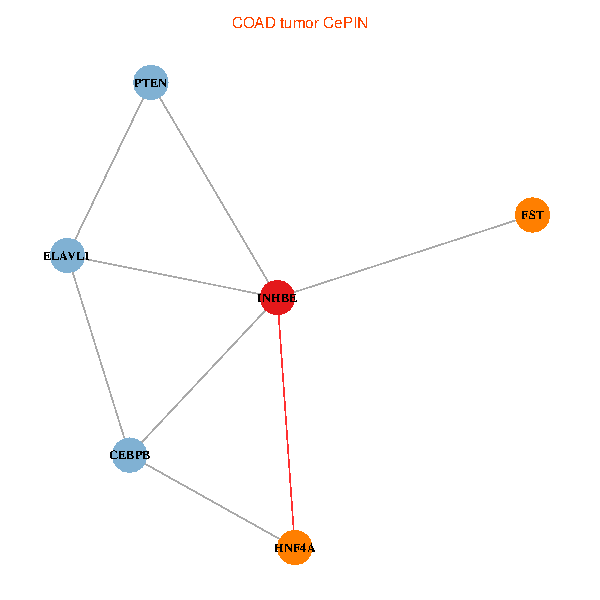
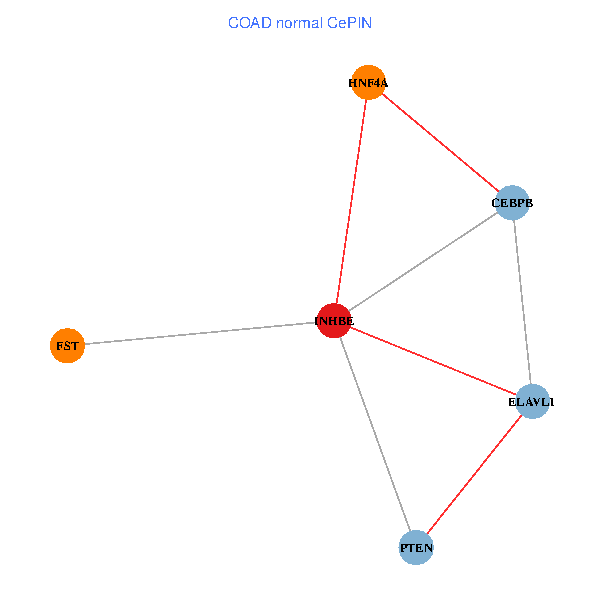
| COAD (tumor) | COAD (normal) |
| INHBE, HNF4A, ELAVL1, CEBPB, PTEN, FST (tumor) | INHBE, HNF4A, ELAVL1, CEBPB, PTEN, FST (normal) |
 |  |
| HNSC (tumor) | HNSC (normal) |
| INHBE, HNF4A, ELAVL1, CEBPB, PTEN, FST (tumor) | INHBE, HNF4A, ELAVL1, CEBPB, PTEN, FST (normal) |
 |  |
| KICH (tumor) | KICH (normal) |
| INHBE, HNF4A, ELAVL1, CEBPB, PTEN, FST (tumor) | INHBE, HNF4A, ELAVL1, CEBPB, PTEN, FST (normal) |
 |  |
| KIRC (tumor) | KIRC (normal) |
| INHBE, HNF4A, ELAVL1, CEBPB, PTEN, FST (tumor) | INHBE, HNF4A, ELAVL1, CEBPB, PTEN, FST (normal) |
 |  |
| KIRP (tumor) | KIRP (normal) |
| INHBE, HNF4A, ELAVL1, CEBPB, PTEN, FST (tumor) | INHBE, HNF4A, ELAVL1, CEBPB, PTEN, FST (normal) |
 |  |
| LIHC (tumor) | LIHC (normal) |
| INHBE, HNF4A, ELAVL1, CEBPB, PTEN, FST (tumor) | INHBE, HNF4A, ELAVL1, CEBPB, PTEN, FST (normal) |
 |  |
| LUAD (tumor) | LUAD (normal) |
| INHBE, HNF4A, ELAVL1, CEBPB, PTEN, FST (tumor) | INHBE, HNF4A, ELAVL1, CEBPB, PTEN, FST (normal) |
 |  |
| LUSC (tumor) | LUSC (normal) |
| INHBE, HNF4A, ELAVL1, CEBPB, PTEN, FST (tumor) | INHBE, HNF4A, ELAVL1, CEBPB, PTEN, FST (normal) |
 |  |
| PRAD (tumor) | PRAD (normal) |
| INHBE, HNF4A, ELAVL1, CEBPB, PTEN, FST (tumor) | INHBE, HNF4A, ELAVL1, CEBPB, PTEN, FST (normal) |
 |  |
| STAD (tumor) | STAD (normal) |
| INHBE, HNF4A, ELAVL1, CEBPB, PTEN, FST (tumor) | INHBE, HNF4A, ELAVL1, CEBPB, PTEN, FST (normal) |
 |  |
| THCA (tumor) | THCA (normal) |
| INHBE, HNF4A, ELAVL1, CEBPB, PTEN, FST (tumor) | INHBE, HNF4A, ELAVL1, CEBPB, PTEN, FST (normal) |
 |  |
| Top |
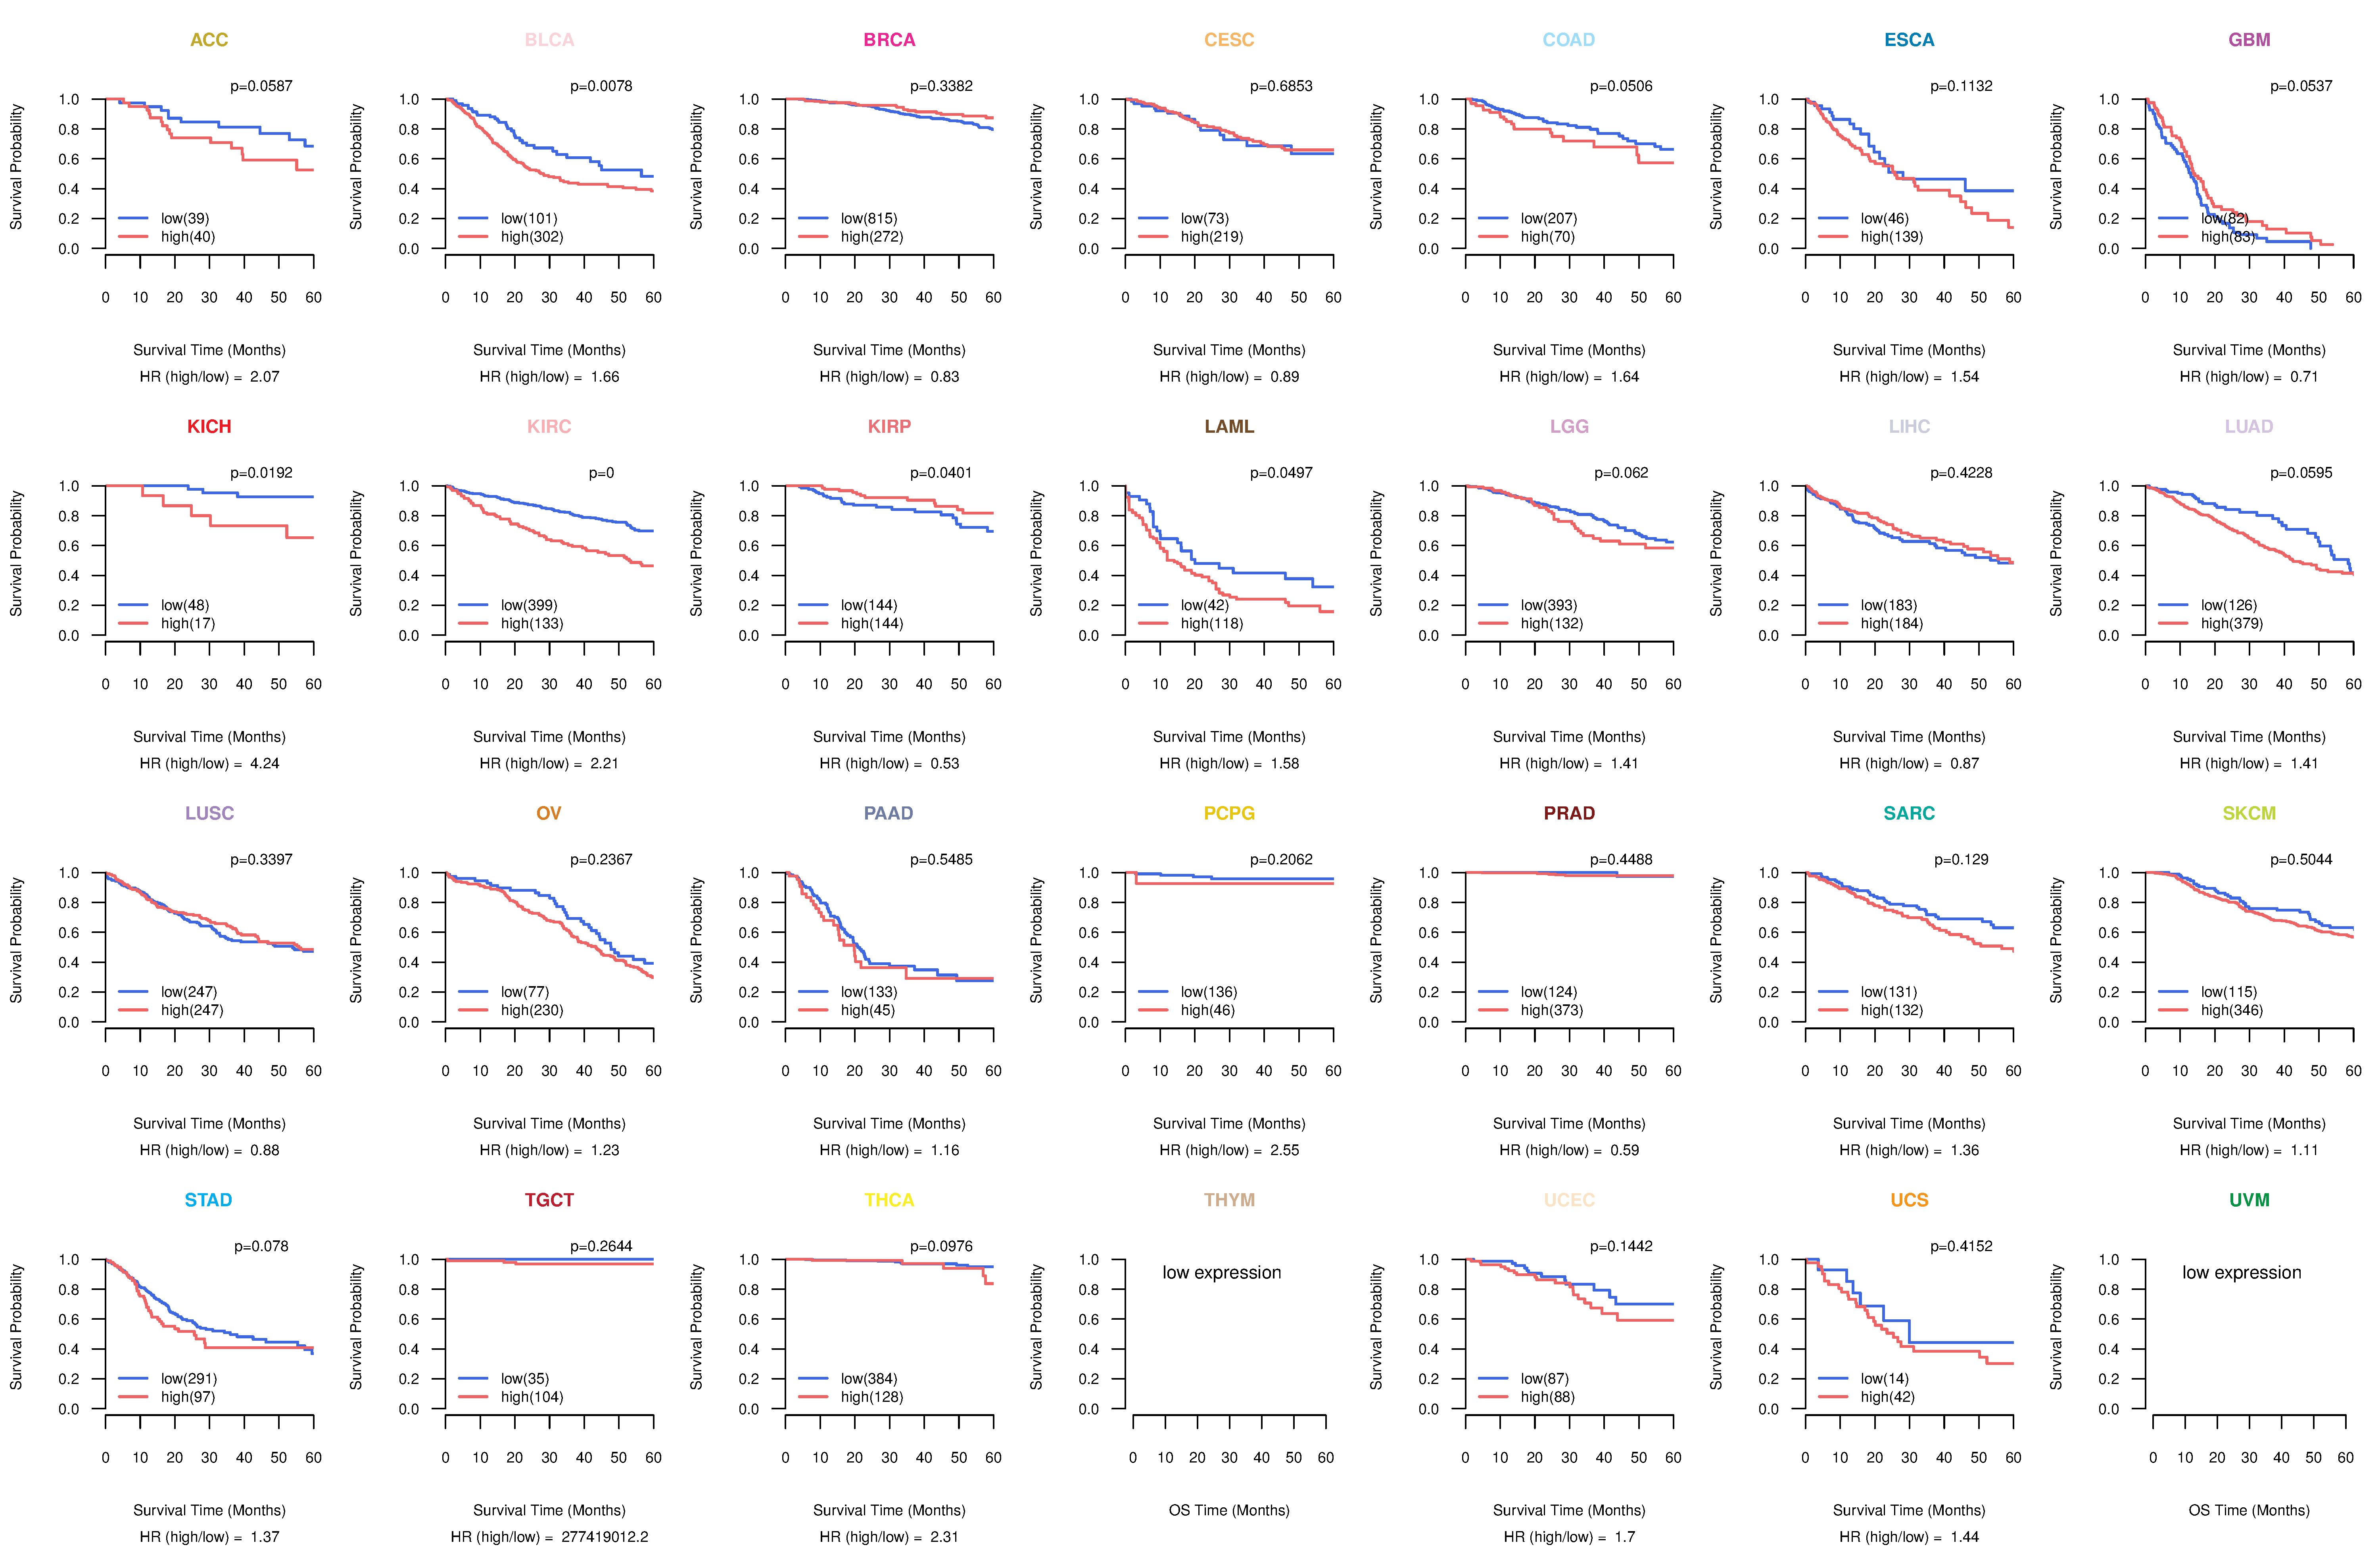
| TissGeneProg for INHBE |
| Kaplan-Meier plots with logrank tests of overall survival (OS) using 28 cancer types (TCGA IlluminaHiSeq_RNASeqV2, pan-cancer normalized log2(norm_counts+1) data, version 2016-08-16) (TCGA clinicalMatrix, phenotype data, version 2016-04-27) * Click on the image to enlarge it in a new window. |
 |
| Kaplan-Meier plots with logrank test of relapse free survival (RFS) using 28 cancer types (TCGA IlluminaHiSeq_RNASeqV2, pan-cancer normalized log2(norm_counts+1) data, version 2016-08-16) (TCGA clinicalMatrix, phenotype data, version 2016-04-27) * Click on the image enlarge it in a new window. |
 |
| Forest plot of Cox proportional hazard ratio (HR) and 95% CI of overall survival (OS) using 28 cancer types (TCGA IlluminaHiSeq_RNASeqV2, pan-cancer normalized log2(norm_counts+1) data, version 2016-08-16) (TCGA clinicalMatrix, phenotype data, version 2016-04-27) * Click on the image enlarge it in a new window. |
 |
| Forest plot of Cox proportional hazard ratio (HR) and 95% CI of relapse free survival (RFS) using 28 cancer types (TCGA IlluminaHiSeq_RNASeqV2, pan-cancer normalized log2(norm_counts+1) data, version 2016-08-16) (TCGA clinicalMatrix, phenotype data, version 2016-04-27) * Click on the image enlarge it in a new window. |
 |
| Top |
| TissGeneClin for INHBE |
| TissGeneDrug for INHBE |
| Drug information targeting TissGene (DrugBank Version 5.0.6, 2017-04-01) |
| DrugBank ID | Drug name | Drug activity | Drug type | Drug status |
| Top |
| TissGeneDisease for INHBE |
| Disease information associated with TissGene (DisGeNet, 2016-06-01) |
| Disease ID | Disease name | # pubmeds | Source |
| umls:C0016037 | Fibrodysplasia Ossificans Progressiva | 5 | BeFree |
| umls:C0029925 | Ovarian Carcinoma | 3 | BeFree |
| umls:C0677886 | Epithelial ovarian cancer | 3 | BeFree |
| umls:C0919267 | ovarian neoplasm | 3 | BeFree |
| umls:C0007102 | Malignant tumor of colon | 2 | BeFree |
| umls:C0032002 | Pituitary Diseases | 2 | BeFree |
| umls:C0039445 | Hereditary hemorrhagic telangiectasia | 2 | BeFree |
| umls:C0152171 | Idiopathic pulmonary hypertension | 2 | BeFree |
| umls:C1140680 | Malignant neoplasm of ovary | 2 | BeFree |
| umls:C1368683 | Epithelioma | 2 | BeFree |
| umls:C0001430 | Adenoma | 1 | BeFree |
| umls:C0001624 | Adrenal Gland Neoplasms | 1 | BeFree |
| umls:C0003857 | Congenital arteriovenous malformation | 1 | BeFree |
| umls:C0005283 | beta Thalassemia | 1 | BeFree |
| umls:C0007115 | Malignant neoplasm of thyroid | 1 | BeFree |
| umls:C0008479 | Chondrosarcoma | 1 | BeFree |
| umls:C0014175 | Endometriosis | 1 | BeFree |
| umls:C0018206 | granulosa cell tumor | 1 | BeFree |
| umls:C0023440 | Acute Erythroblastic Leukemia | 1 | BeFree |
| umls:C0023794 | Lipoidosis | 1 | CTD_human |
| umls:C0023893 | Liver Cirrhosis, Experimental | 1 | CTD_human |
| umls:C0025202 | melanoma | 1 | BeFree |
| umls:C0026846 | Muscular Atrophy | 1 | BeFree |
| umls:C0026847 | Spinal Muscular Atrophy | 1 | BeFree |
| umls:C0027051 | Myocardial Infarction | 1 | BeFree |
| umls:C0027658 | Neoplasms, Germ Cell and Embryonal | 1 | GAD |
| umls:C0029928 | Ovarian Diseases | 1 | BeFree |
| umls:C0031511 | Pheochromocytoma | 1 | BeFree |
| umls:C0032000 | Pituitary Adenoma | 1 | BeFree |
| umls:C0035335 | Retinoblastoma | 1 | BeFree |
| umls:C0039590 | Testicular Neoplasms | 1 | GAD |
| umls:C0235974 | Pancreatic carcinoma | 1 | BeFree |
| umls:C0269102 | Endometrioma | 1 | BeFree |
| umls:C0278883 | Metastatic melanoma | 1 | BeFree |
| umls:C0334533 | Arteriovenous hemangioma | 1 | BeFree |
| umls:C0346647 | Malignant neoplasm of pancreas | 1 | BeFree |
| umls:C0549473 | Thyroid carcinoma | 1 | BeFree |
| umls:C0596263 | Carcinogenesis | 1 | BeFree |
| umls:C1335302 | Pancreatic Ductal Adenocarcinoma | 1 | BeFree |
| umls:C1519670 | Tumor Angiogenesis | 1 | BeFree |
| umls:C2973725 | Pulmonary arterial hypertension | 1 | BeFree |
| umls:C3203102 | Idiopathic pulmonary arterial hypertension | 1 | BeFree |
| umls:C3714844 | Pulmonary Hypertension, Primary, 1, With Hereditary Hemorrhagic Telangiectasia | 1 | BeFree |
|
Copyright 2016-Present - The University of Texas Health Science Center at Houston (UTHealth) Web File Viewing | How to Report, Fraud, Waste and Abuse | State of Texas | Statewide Search | Texas Homeland Security | Site Policies |