 |
| |
| |
| |
| |
| |
| |
|

| TissGeneSummary for NME5 |
 Gene summary Gene summary |
| Basic gene information | Gene symbol | NME5 |
| Gene name | NME/NM23 family member 5 | |
| Synonyms | NM23-H5|NM23H5|RSPH23 | |
| Cytomap | UCSC genome browser: 5q31 | |
| Type of gene | protein-coding | |
| RefGenes | NM_003551.2, | |
| Description | IPIA-betaNDK-H 5NDP kinase homolog 5inhibitor of p53-induced apoptosis-betanon-metastatic cells 5, protein expressed in (nucleoside-diphosphate kinase)nucleoside diphosphate kinase homolog 5radial spoke 23 homologtestis-specific nm23 homolog | |
| Modification date | 20141207 | |
| dbXrefs | MIM : 603575 | |
| HGNC : HGNC | ||
| Ensembl : ENSG00000112981 | ||
| HPRD : 04655 | ||
| Vega : OTTHUMG00000129207 | ||
| Protein | UniProt: go to UniProt's Cross Reference DB Table | |
| Expression | CleanEX: HS_NME5 | |
| BioGPS: 8382 | ||
| Pathway | NCI Pathway Interaction Database: NME5 | |
| KEGG: NME5 | ||
| REACTOME: NME5 | ||
| Pathway Commons: NME5 | ||
| Context | iHOP: NME5 | |
| ligand binding site mutation search in PubMed: NME5 | ||
| UCL Cancer Institute: NME5 | ||
| Assigned class in TissGDB* | C | |
| Included tissue-specific gene expression resources | TiGER,GTEx | |
| Specific-tissues in normal samples (assigned by TissGDB using HPA, TiGER, and GTEx) | Testis | |
| Cancer types related to the specific-tissues in cancer samples (assigned by TissGDB using TCGA) | TGCT | |
| Reference showing the relevant tissue of NME5 | ||
| Description by TissGene annotations | Protective TissGene in OS | |
| * Class A consists of genes with literature evidence and is part of the cTissGenes. Class B consists of only cTissGenes without additional evidence. The remaining genes belong to Class C. |
| Gene ontology having evidence of Inferred from Direct Assay (IDA) from Entrez |
| GO ID | GO term | PubMed ID |
| Top |
| TissGeneExp for NME5 |
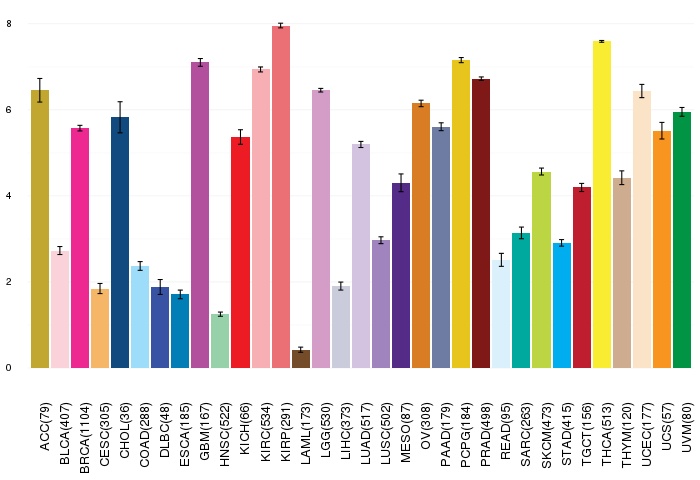
| Gene expressions across 28 cancer types (X-axis: cancer type and Y-axis: log2(norm_counts+1)) (TCGA IlluminaHiSeq_RNASeqV2, pan-cancer normalized log2(norm_counts+1) data, version 2016-08-16) |
 |
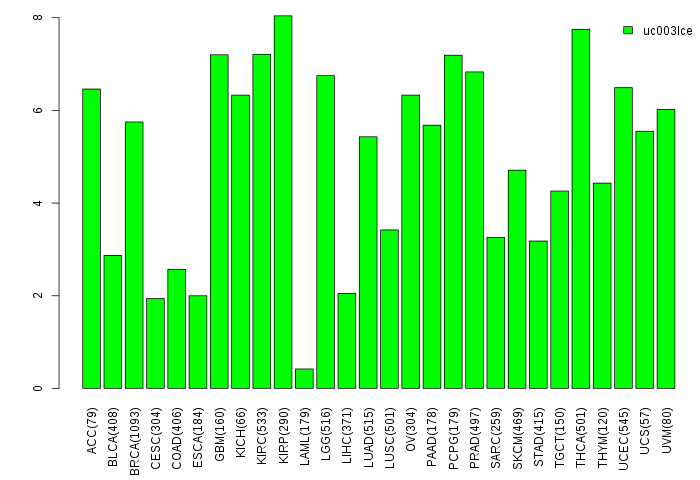
| Gene isoform expressions across 28 cancer types (X-axis: cancer type and Y-axis: log2(norm_counts+1)) (TCGA pan-cancer tcga_rsem_isoform_tpm, version 2016-09-01) |
 |
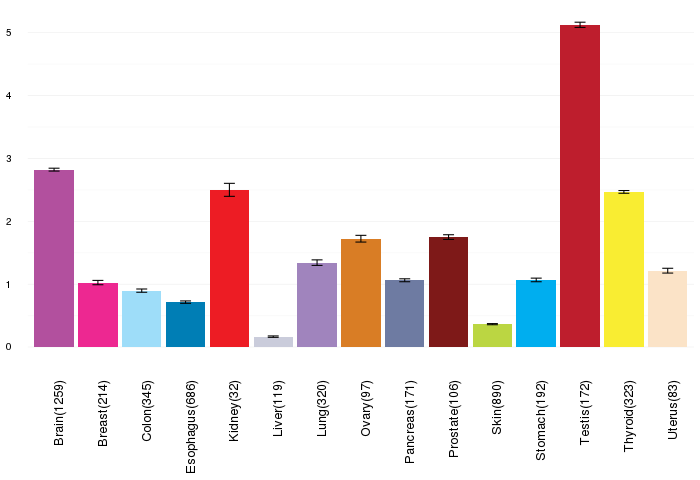
| Gene expressions across normal tissues of GTEx data (GTEx GTEx_Analysis_v6_RNA-seq_RNA-SeQCv1.1.8_gene_rpkm.gct) - Here, we shows the matched tissue types only among our 28 cancer types. |
 |
| Different expressions across 14 cancer types with more than 10 samples between matched tumors and normals (X-axis: cancer type and Y-axis: log2(norm_counts+1)) (TCGA IlluminaHiSeq_RNASeqV2, pan-cancer normalized log2(norm_counts+1) data, version 2016-08-16) |
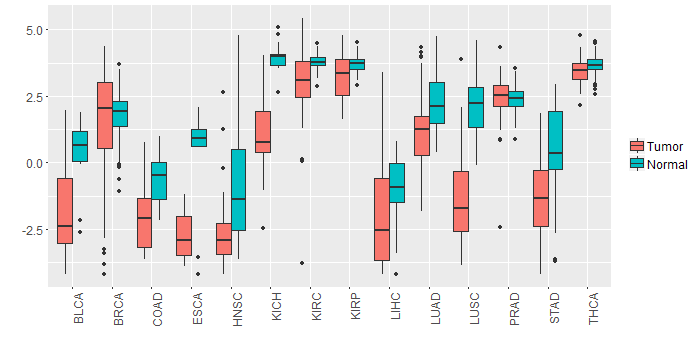 |
| - Significantly differentially expressed cancer types and information. (|Fold change|>1 and FDR<0.05) |
| Cancer type | Mean(exp) in tumor | Mean(exp) in matched normal | Log2FC | P-val. | FDR |
| KICH | 0.879247783 | 3.976883783 | -3.097636 | 9.62E-12 | 9.22E-11 |
| LUAD | 1.223486266 | 2.308672473 | -1.085186207 | 1.67E-05 | 4.76E-05 |
| HNSC | -2.687076124 | -0.838659845 | -1.848416279 | 5.46E-06 | 3.32E-05 |
| LUSC | -1.397091354 | 2.129681195 | -3.526772549 | 8.96E-22 | 1.35E-20 |
| ESCA | -2.738339126 | 0.239242692 | -2.977581818 | 0.00074 | 0.01184 |
| BLCA | -1.796137691 | 0.426325467 | -2.222463158 | 0.000128 | 0.001336488 |
| STAD | -1.296745092 | 0.457014283 | -1.753759375 | 8.90E-05 | 0.000690986 |
| COAD | -2.025590525 | -0.665736678 | -1.359853846 | 0.000121 | 0.000429677 |
| Top |
| TissGene-miRNA for NME5 |
| Significantly anti-correlated miRNAs of TissGene across 28 cancer types (Gene-miRNA relations from TargetScanHuman Relsease 7.1, Conserved_Site_Context_Scores.txt.zip, 06.01.2016) (TCGA IlluminaHiSeq_miRNASeq, log2(RPM+1) data, version 2016-11-21) (TCGA IlluminaHiSeq_RNASeqV2, log2(normalized_count+1) data, version 2016-08-16) (Spearman’s Rank Correlation (p-value<0.05 and coefficient<-0.25)) |
| Cancer type | miRNA id | miRNA accession | P-val. | Coeff. | # samples |
| Top |
| TissGeneMut for NME5 |
| TissGeneSNV for NME5 |
| nsSNV counts per each loci. Different colors of circles represent different cancer types. Circle size denotes number of samples. (TCGA somatic mutation (SNPs and small INDELs) data, version 2016-04-25) * Click on the image to enlarge it in a new window. |
 |
 |
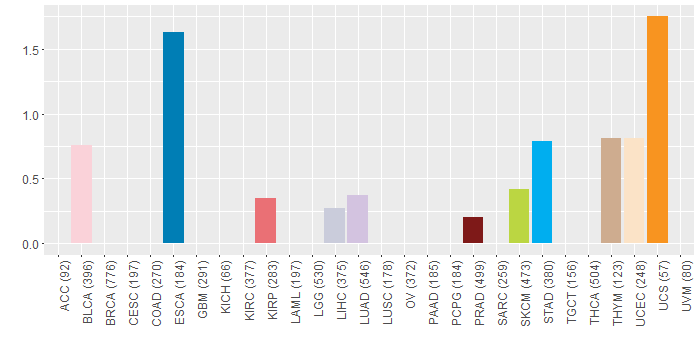
| Somatic nucleotide variants of TissGene across 28 cancer types (X-axis: cancer type and Y-axis: % of mutated samples) The numbers in parentheses are numbers of samples with mutation (nsSNVs). (TCGA somatic mutation (SNPs and small INDELs) data, version 2016-04-25) |
 |
| - nsSNVs sorted by frequency. |
| AAchange | Cancer type | # samples |
| p.K46I | LUAD | 1 |
| p.N198K | BLCA | 1 |
| p.M166I | ESCA | 1 |
| p.E175K | ESCA | 1 |
| p.N162K | STAD | 1 |
| p.P144S | SKCM | 1 |
| p.E27K | BLCA | 1 |
| p.W187* | PRAD | 1 |
| p.E210* | UCEC | 1 |
| p.I34L | BLCA | 1 |
| p.L176R | UCS | 1 |
| p.V24A | UCEC | 1 |
| p.K180R | STAD | 1 |
| p.H204Q | THYM | 1 |
| p.K180T | STAD | 1 |
| p.E29X | KIRP | 1 |
| p.R36K | SKCM | 1 |
| p.A105V | HNSC | 1 |
| p.T40N | ESCA | 1 |
| p.E28D | KIRP | 1 |
| p.D183Y | LUAD | 1 |
| p.M74I | LIHC | 1 |
| Top |
| TissGeneCNV for NME5 |
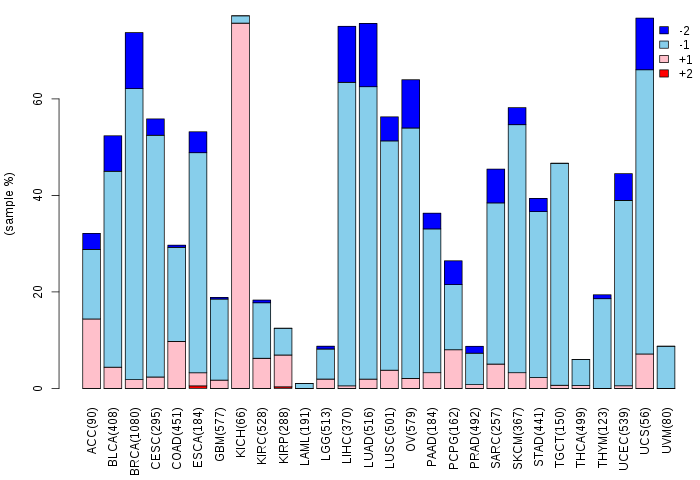
| Copy number variations of TissGene across 28 cancer types (X-axis: cancer type and Y-axis: % of CNV samples) (TCGA Gistic2_CopyNumber_Gistic2_all_data_by_genes, Gistic2 copy number data, version 2016-08-16) |
 |
| Top |
| TissGeneFusions for NME5 |
| Fusion genes including TissGene (ChimerDB 3.0, 2016-12-01 and TCGA fusion Portal 2015-12-01) |
| Database | Src | Cancer type | Sample | Fusion gene | ORF | 5'-gene BP | 3'-gene BP |
| Top |
| TissGeneNet for NME5 |
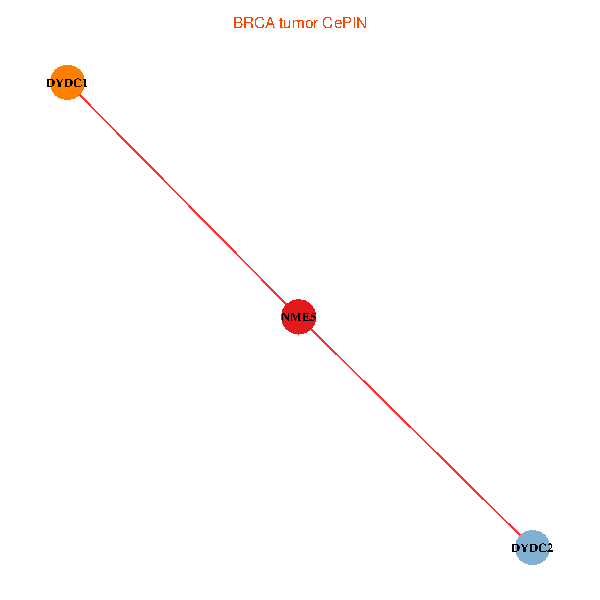
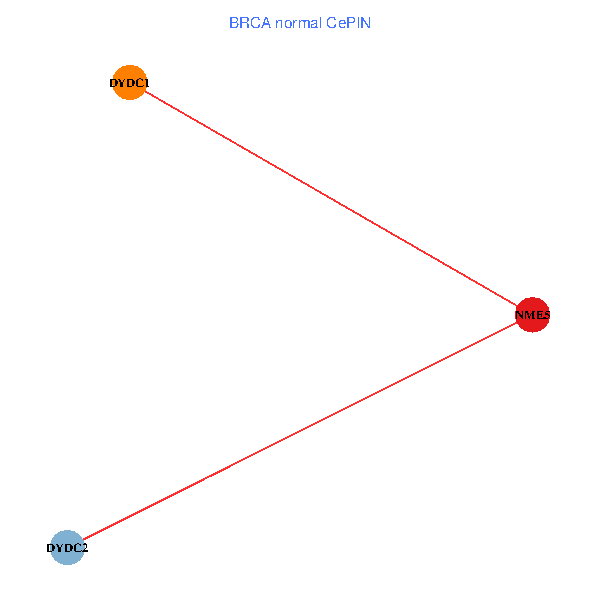
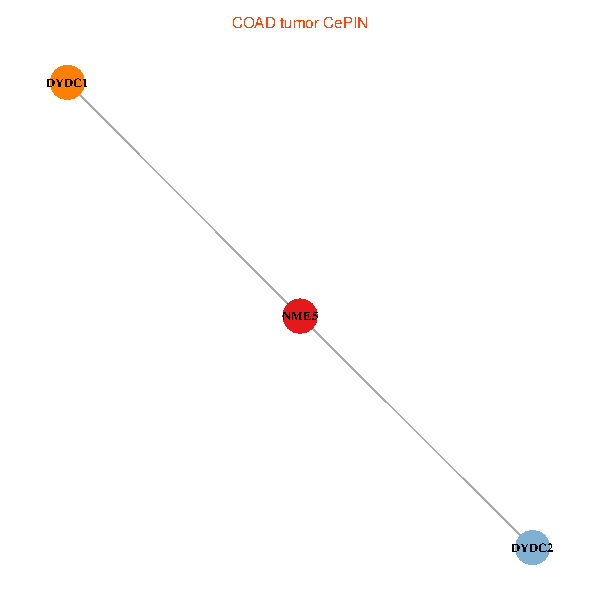
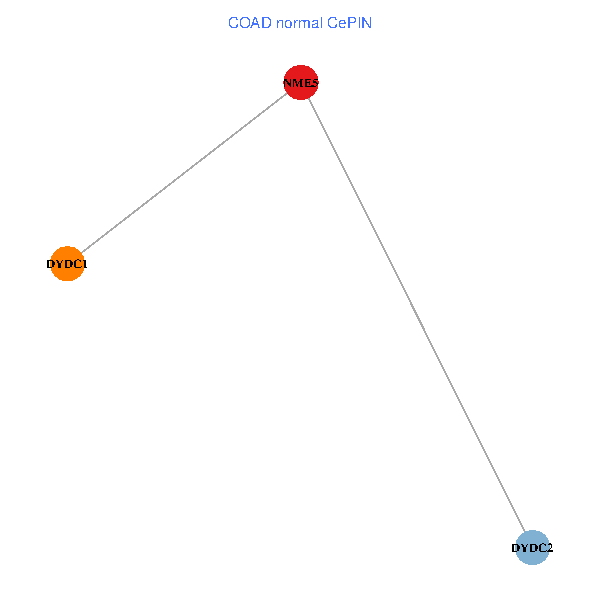
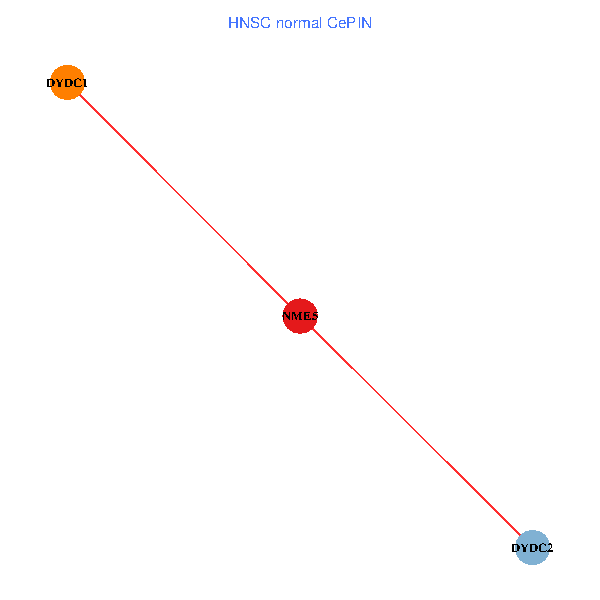
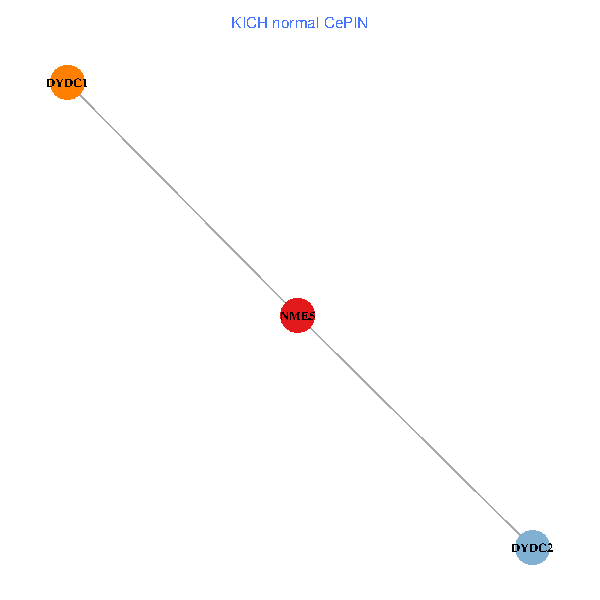
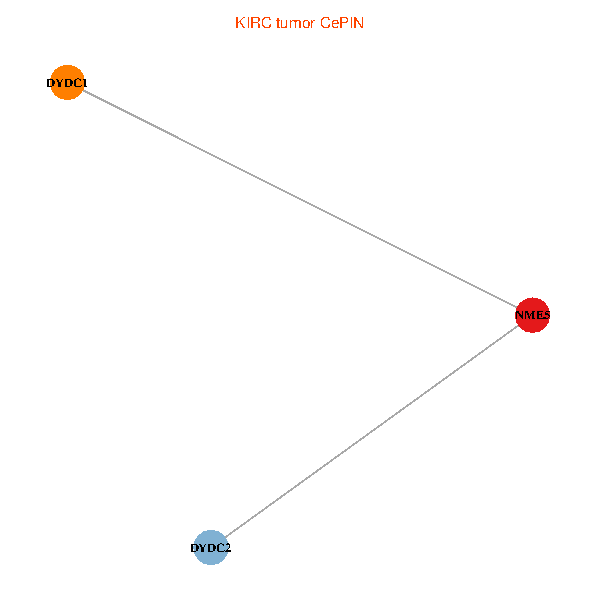
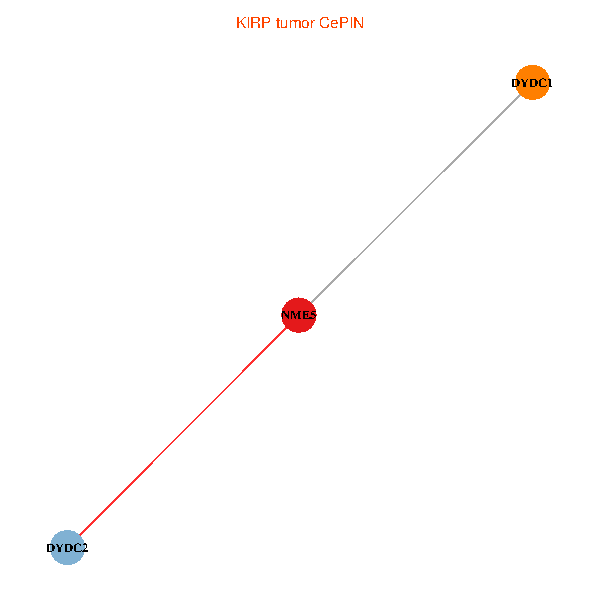
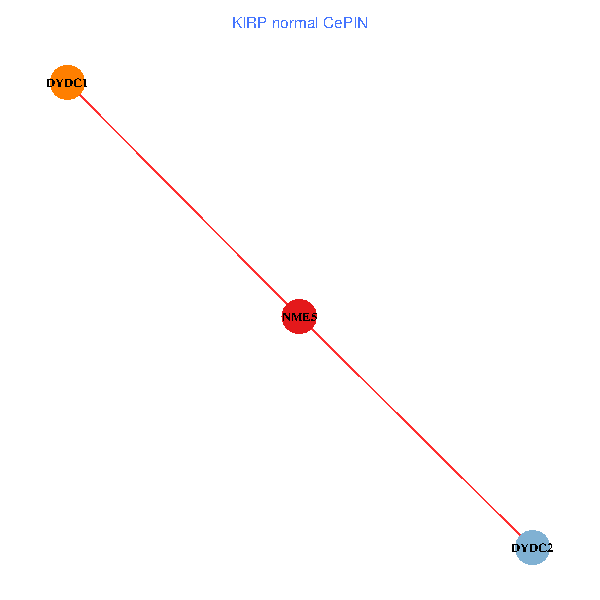
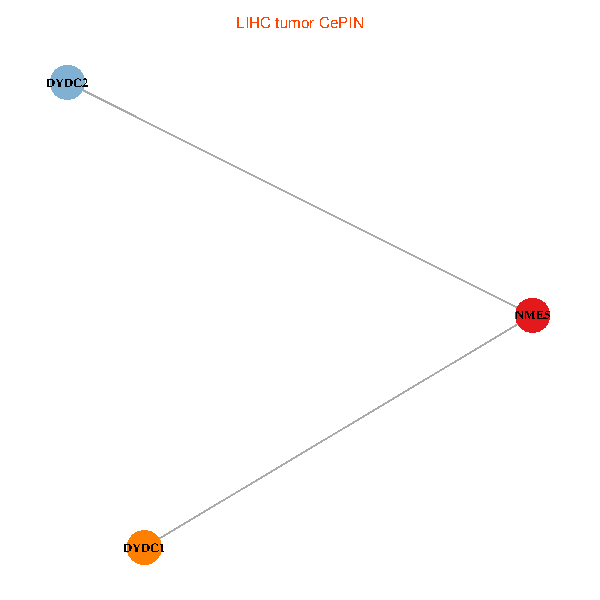
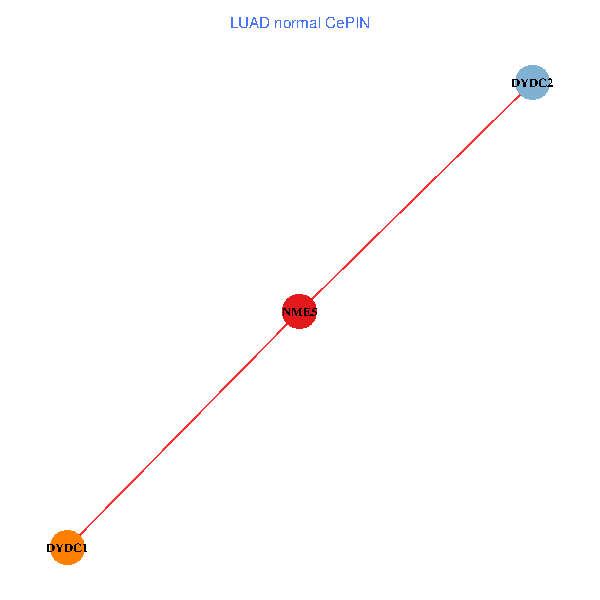
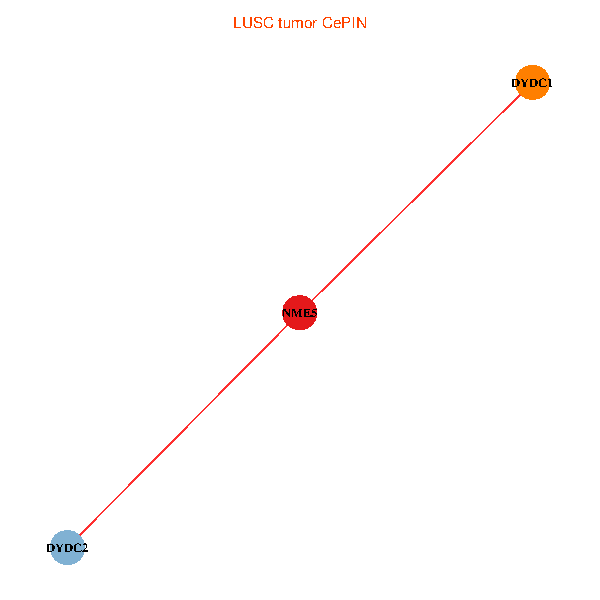
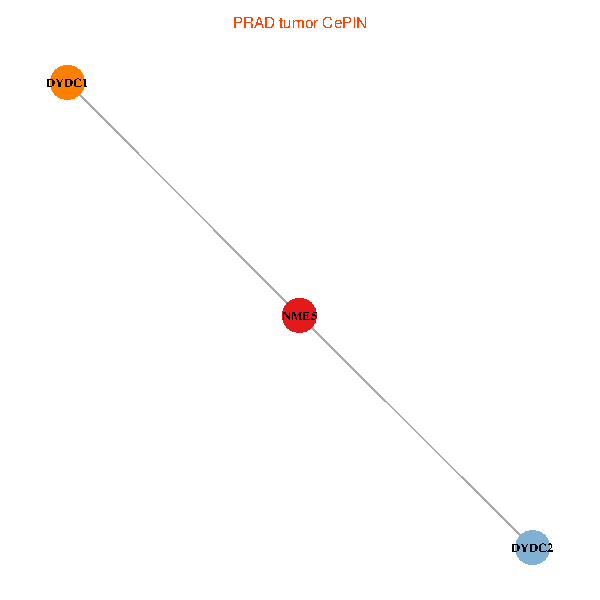
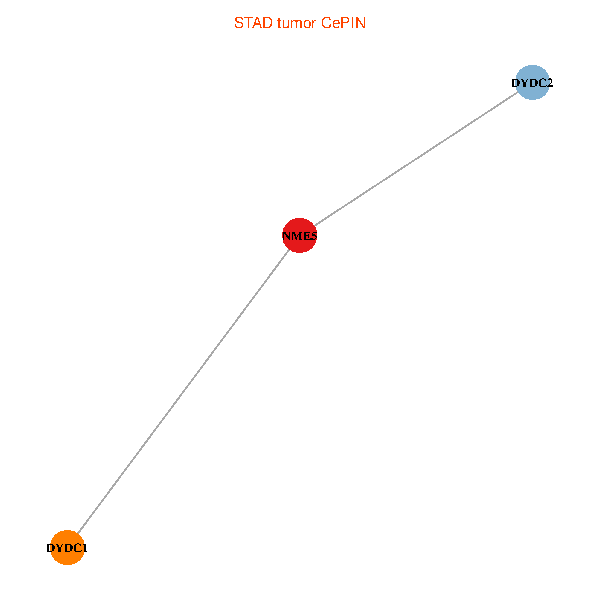
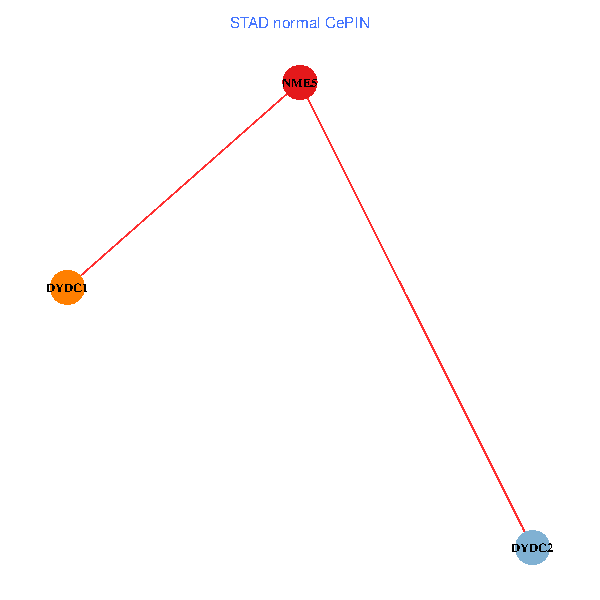
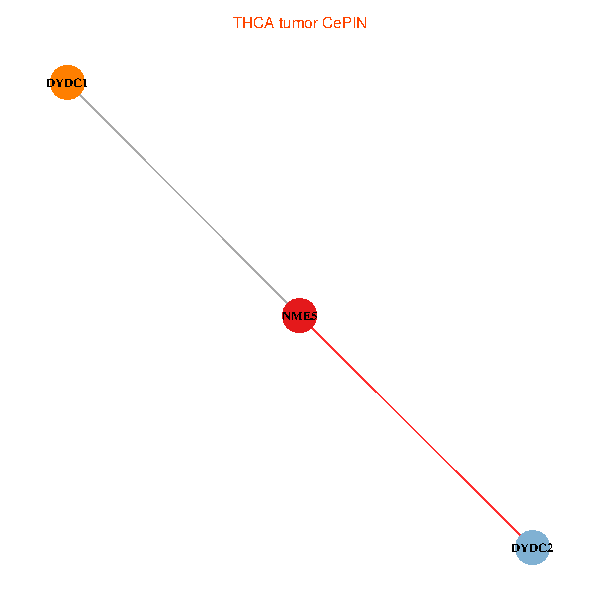
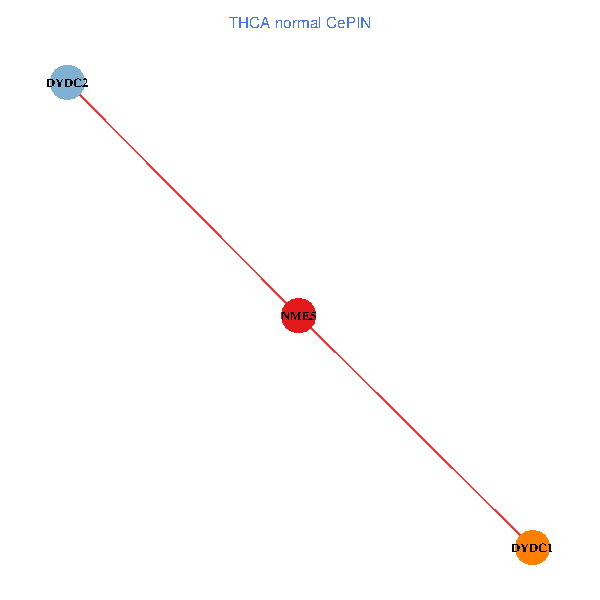
| Co-expressed gene networks based on protein-protein interaction data (CePIN) (TCGA IlluminaHiSeq_RNASeqV2, pan-cancer normalized log2(norm_counts+1) data, version 2016-08-16) (PINA2 ppi data) |
| BRCA (tumor) | BRCA (normal) |
| NME5, DYDC1, DYDC2 (tumor) | NME5, DYDC1, DYDC2 (normal) |
 |  |
| COAD (tumor) | COAD (normal) |
| NME5, DYDC1, DYDC2 (tumor) | NME5, DYDC1, DYDC2 (normal) |
 |  |
| HNSC (tumor) | HNSC (normal) |
| NME5, DYDC1, DYDC2 (tumor) | NME5, DYDC1, DYDC2 (normal) |
 |  |
| KICH (tumor) | KICH (normal) |
| NME5, DYDC1, DYDC2 (tumor) | NME5, DYDC1, DYDC2 (normal) |
 |  |
| KIRC (tumor) | KIRC (normal) |
| NME5, DYDC1, DYDC2 (tumor) | NME5, DYDC1, DYDC2 (normal) |
 |  |
| KIRP (tumor) | KIRP (normal) |
| NME5, DYDC1, DYDC2 (tumor) | NME5, DYDC1, DYDC2 (normal) |
 |  |
| LIHC (tumor) | LIHC (normal) |
| NME5, DYDC1, DYDC2 (tumor) | NME5, DYDC1, DYDC2 (normal) |
 |  |
| LUAD (tumor) | LUAD (normal) |
| NME5, DYDC1, DYDC2 (tumor) | NME5, DYDC1, DYDC2 (normal) |
 |  |
| LUSC (tumor) | LUSC (normal) |
| NME5, DYDC1, DYDC2 (tumor) | NME5, DYDC1, DYDC2 (normal) |
 |  |
| PRAD (tumor) | PRAD (normal) |
| NME5, DYDC1, DYDC2 (tumor) | NME5, DYDC1, DYDC2 (normal) |
 |  |
| STAD (tumor) | STAD (normal) |
| NME5, DYDC1, DYDC2 (tumor) | NME5, DYDC1, DYDC2 (normal) |
 |  |
| THCA (tumor) | THCA (normal) |
| NME5, DYDC1, DYDC2 (tumor) | NME5, DYDC1, DYDC2 (normal) |
 |  |
| Top |
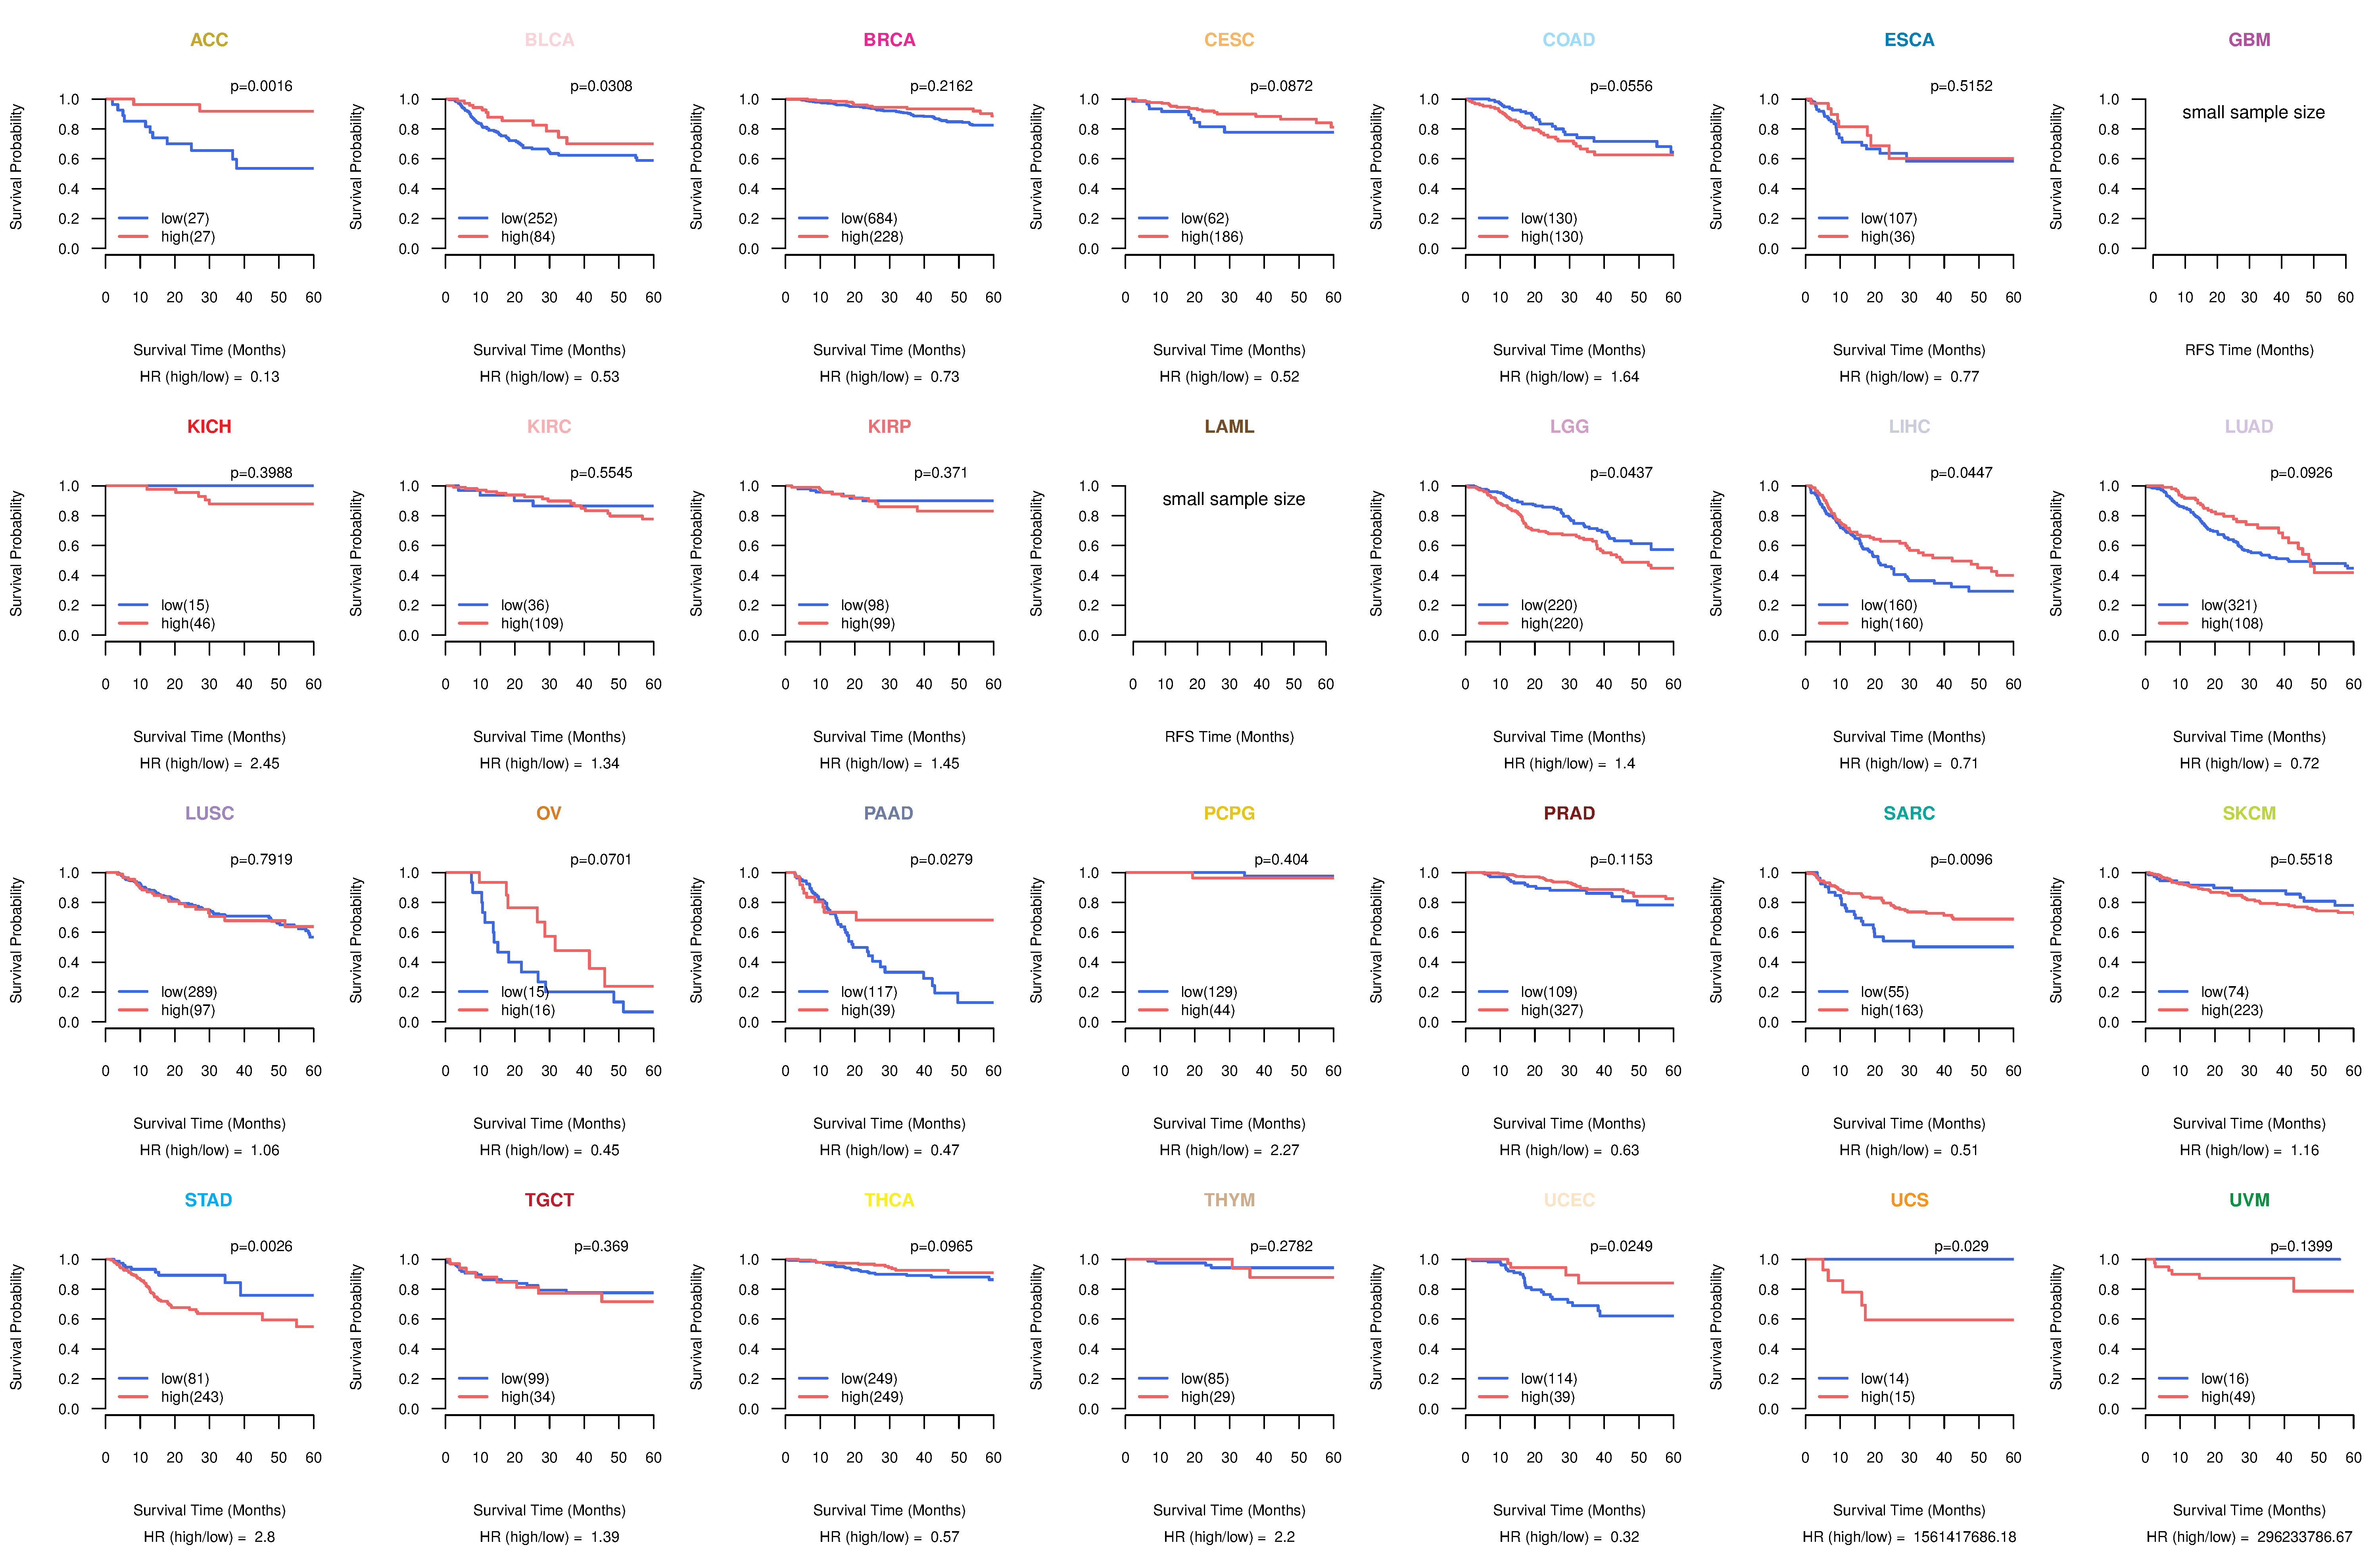
| TissGeneProg for NME5 |
| Kaplan-Meier plots with logrank tests of overall survival (OS) using 28 cancer types (TCGA IlluminaHiSeq_RNASeqV2, pan-cancer normalized log2(norm_counts+1) data, version 2016-08-16) (TCGA clinicalMatrix, phenotype data, version 2016-04-27) * Click on the image to enlarge it in a new window. |
 |
| Kaplan-Meier plots with logrank test of relapse free survival (RFS) using 28 cancer types (TCGA IlluminaHiSeq_RNASeqV2, pan-cancer normalized log2(norm_counts+1) data, version 2016-08-16) (TCGA clinicalMatrix, phenotype data, version 2016-04-27) * Click on the image enlarge it in a new window. |
 |
| Forest plot of Cox proportional hazard ratio (HR) and 95% CI of overall survival (OS) using 28 cancer types (TCGA IlluminaHiSeq_RNASeqV2, pan-cancer normalized log2(norm_counts+1) data, version 2016-08-16) (TCGA clinicalMatrix, phenotype data, version 2016-04-27) * Click on the image enlarge it in a new window. |
 |
| Forest plot of Cox proportional hazard ratio (HR) and 95% CI of relapse free survival (RFS) using 28 cancer types (TCGA IlluminaHiSeq_RNASeqV2, pan-cancer normalized log2(norm_counts+1) data, version 2016-08-16) (TCGA clinicalMatrix, phenotype data, version 2016-04-27) * Click on the image enlarge it in a new window. |
 |
| Top |
| TissGeneClin for NME5 |
| TissGeneDrug for NME5 |
| Drug information targeting TissGene (DrugBank Version 5.0.6, 2017-04-01) |
| DrugBank ID | Drug name | Drug activity | Drug type | Drug status |
| Top |
| TissGeneDisease for NME5 |
| Disease information associated with TissGene (DisGeNet, 2016-06-01) |
| Disease ID | Disease name | # pubmeds | Source |
| umls:C0235974 | Pancreatic carcinoma | 2 | BeFree |
| umls:C0346647 | Malignant neoplasm of pancreas | 2 | BeFree |
| umls:C0007138 | Carcinoma, Transitional Cell | 1 | BeFree |
| umls:C2145472 | Urothelial Carcinoma | 1 | BeFree |
|
Copyright 2016-Present - The University of Texas Health Science Center at Houston (UTHealth) Web File Viewing | How to Report, Fraud, Waste and Abuse | State of Texas | Statewide Search | Texas Homeland Security | Site Policies |