 |
| |
| |
| |
| |
| |
| |
|

| TissGeneSummary for MRO |
 Gene summary Gene summary |
| Basic gene information | Gene symbol | MRO |
| Gene name | maestro | |
| Synonyms | B29|C18orf3 | |
| Cytomap | UCSC genome browser: 18q21 | |
| Type of gene | protein-coding | |
| RefGenes | NM_001127174.1, NM_001127175.1,NM_001127176.1,NM_031939.3, | |
| Description | beside the Ma29 deletionmale-specific transcription in the developing reproductive organsprotein maestro | |
| Modification date | 20141207 | |
| dbXrefs | MIM : 608080 | |
| HGNC : HGNC | ||
| Ensembl : ENSG00000134042 | ||
| HPRD : 16276 | ||
| Vega : OTTHUMG00000132692 | ||
| Protein | UniProt: go to UniProt's Cross Reference DB Table | |
| Expression | CleanEX: HS_MRO | |
| BioGPS: 83876 | ||
| Pathway | NCI Pathway Interaction Database: MRO | |
| KEGG: MRO | ||
| REACTOME: MRO | ||
| Pathway Commons: MRO | ||
| Context | iHOP: MRO | |
| ligand binding site mutation search in PubMed: MRO | ||
| UCL Cancer Institute: MRO | ||
| Assigned class in TissGDB* | C | |
| Included tissue-specific gene expression resources | TiGER,GTEx | |
| Specific-tissues in normal samples (assigned by TissGDB using HPA, TiGER, and GTEx) | KidneyTestis | |
| Cancer types related to the specific-tissues in cancer samples (assigned by TissGDB using TCGA) | KIRC,KIRP,KICHTGCT | |
| Reference showing the relevant tissue of MRO | ||
| Description by TissGene annotations | ||
| * Class A consists of genes with literature evidence and is part of the cTissGenes. Class B consists of only cTissGenes without additional evidence. The remaining genes belong to Class C. |
| Gene ontology having evidence of Inferred from Direct Assay (IDA) from Entrez |
| GO ID | GO term | PubMed ID |
| Top |
| TissGeneExp for MRO |
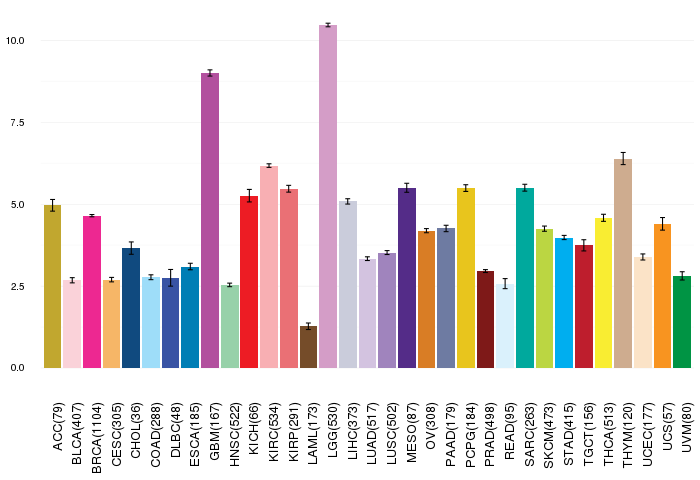
| Gene expressions across 28 cancer types (X-axis: cancer type and Y-axis: log2(norm_counts+1)) (TCGA IlluminaHiSeq_RNASeqV2, pan-cancer normalized log2(norm_counts+1) data, version 2016-08-16) |
 |
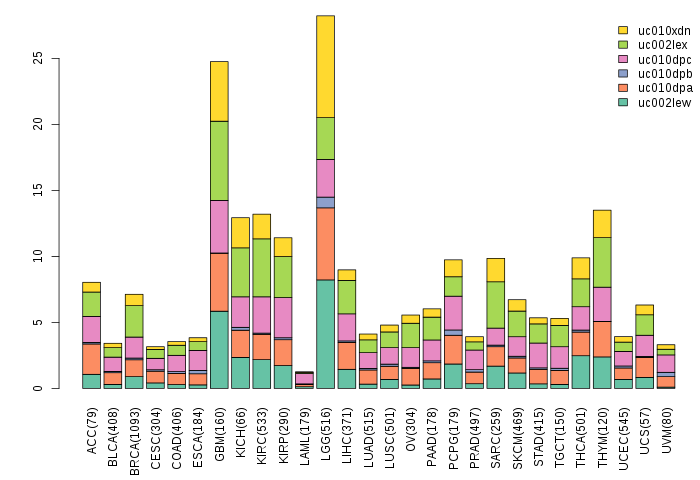
| Gene isoform expressions across 28 cancer types (X-axis: cancer type and Y-axis: log2(norm_counts+1)) (TCGA pan-cancer tcga_rsem_isoform_tpm, version 2016-09-01) |
 |
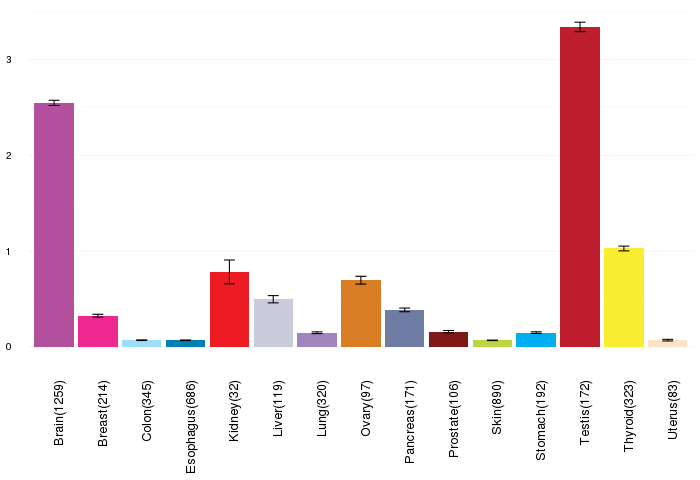
| Gene expressions across normal tissues of GTEx data (GTEx GTEx_Analysis_v6_RNA-seq_RNA-SeQCv1.1.8_gene_rpkm.gct) - Here, we shows the matched tissue types only among our 28 cancer types. |
 |
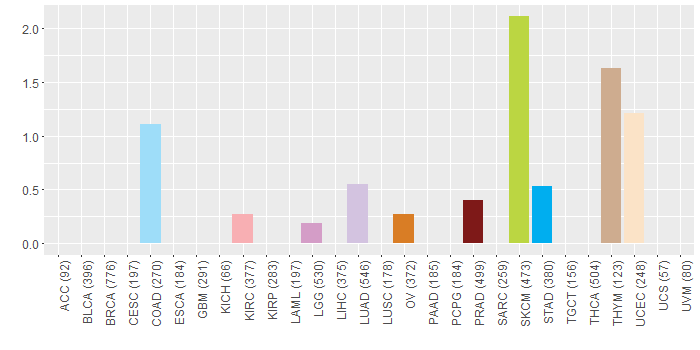
| Different expressions across 14 cancer types with more than 10 samples between matched tumors and normals (X-axis: cancer type and Y-axis: log2(norm_counts+1)) (TCGA IlluminaHiSeq_RNASeqV2, pan-cancer normalized log2(norm_counts+1) data, version 2016-08-16) |
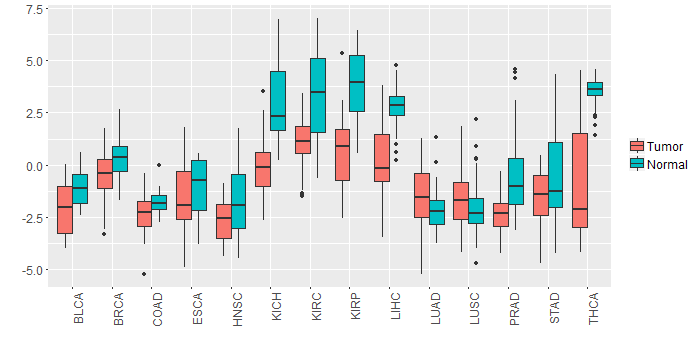 |
| - Significantly differentially expressed cancer types and information. (|Fold change|>1 and FDR<0.05) |
| Cancer type | Mean(exp) in tumor | Mean(exp) in matched normal | Log2FC | P-val. | FDR |
| LIHC | 0.161480229 | 2.716650229 | -2.55517 | 2.14E-13 | 5.06E-12 |
| KIRP | 0.637912979 | 3.841366104 | -3.203453125 | 3.20E-10 | 3.32E-09 |
| KIRC | 1.152474785 | 3.356026174 | -2.203551389 | 4.53E-13 | 1.99E-12 |
| KICH | 0.015420229 | 3.038000229 | -3.02258 | 3.74E-08 | 1.84E-07 |
| THCA | -0.967043906 | 3.523876433 | -4.490920339 | 3.47E-20 | 1.40E-18 |
| PRAD | -2.343492309 | -0.458163463 | -1.885328846 | 8.08E-09 | 1.03E-07 |
| BLCA | -2.151892613 | -1.085755771 | -1.066136842 | 0.00356 | 0.020564779 |
| Top |
| TissGene-miRNA for MRO |
| Significantly anti-correlated miRNAs of TissGene across 28 cancer types (Gene-miRNA relations from TargetScanHuman Relsease 7.1, Conserved_Site_Context_Scores.txt.zip, 06.01.2016) (TCGA IlluminaHiSeq_miRNASeq, log2(RPM+1) data, version 2016-11-21) (TCGA IlluminaHiSeq_RNASeqV2, log2(normalized_count+1) data, version 2016-08-16) (Spearman’s Rank Correlation (p-value<0.05 and coefficient<-0.25)) |
| Cancer type | miRNA id | miRNA accession | P-val. | Coeff. | # samples |
| Top |
| TissGeneMut for MRO |
| TissGeneSNV for MRO |
| nsSNV counts per each loci. Different colors of circles represent different cancer types. Circle size denotes number of samples. (TCGA somatic mutation (SNPs and small INDELs) data, version 2016-04-25) * Click on the image to enlarge it in a new window. |
 |
| Somatic nucleotide variants of TissGene across 28 cancer types (X-axis: cancer type and Y-axis: % of mutated samples) The numbers in parentheses are numbers of samples with mutation (nsSNVs). (TCGA somatic mutation (SNPs and small INDELs) data, version 2016-04-25) |
 |
| - nsSNVs sorted by frequency. |
| AAchange | Cancer type | # samples |
| p.T23N | COAD | 2 |
| p.D106N | UCEC | 2 |
| p.A90T | STAD | 1 |
| p.L253M | THYM | 1 |
| p.D59N | SKCM | 1 |
| p.K120N | LUAD | 1 |
| p.Q202* | SKCM | 1 |
| p.R79C | PRAD | 1 |
| p.P191S | SKCM | 1 |
| p.V116I | LUAD | 1 |
| p.Y150H | HNSC | 1 |
| p.A76T | STAD | 1 |
| p.T151P | UCEC | 1 |
| p.I131L | OV | 1 |
| p.R39S | COAD | 1 |
| p.Q202X | SKCM | 1 |
| p.W36* | SKCM | 1 |
| p.P101S | SKCM | 1 |
| p.T25A | PRAD | 1 |
| p.R65C | PRAD | 1 |
| p.K169T | COAD | 1 |
| p.G164E | SKCM | 1 |
| p.A161V | SKCM | 1 |
| p.S151L | HNSC | 1 |
| p.Q3K | KIRC | 1 |
| p.G125S | HNSC | 1 |
| p.L13F | STAD | 1 |
| p.F170I | LGG | 1 |
| p.W36X | SKCM | 1 |
| p.E144K | SKCM | 1 |
| p.M125I | THYM | 1 |
| p.W167* | SKCM | 1 |
| p.E78K | SKCM | 1 |
| p.L248R | LUAD | 1 |
| p.W167X | SKCM | 1 |
| Top |
| TissGeneCNV for MRO |
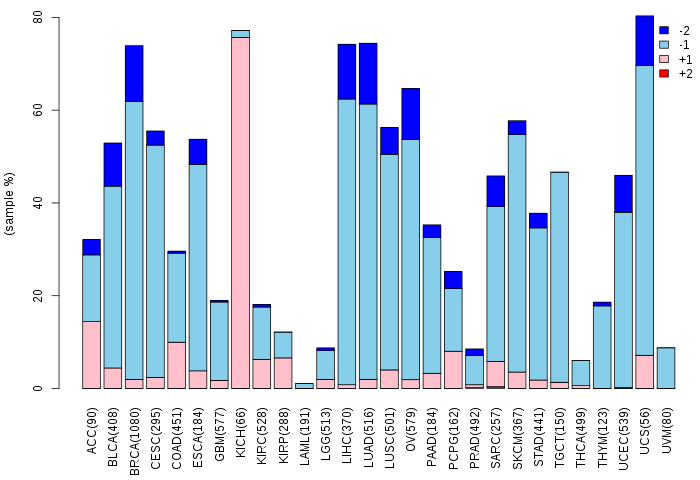
| Copy number variations of TissGene across 28 cancer types (X-axis: cancer type and Y-axis: % of CNV samples) (TCGA Gistic2_CopyNumber_Gistic2_all_data_by_genes, Gistic2 copy number data, version 2016-08-16) |
 |
| Top |
| TissGeneFusions for MRO |
| Fusion genes including TissGene (ChimerDB 3.0, 2016-12-01 and TCGA fusion Portal 2015-12-01) |
| Database | Src | Cancer type | Sample | Fusion gene | ORF | 5'-gene BP | 3'-gene BP |
| Chimerdb3.0 | ChiTaRs | NA | BF091671 | MRO-RORA | chr18:48321967 | chr15:61473945 | |
| Chimerdb3.0 | ChiTaRs | NA | BF362149 | MRO-SLC1A2 | chr18:48345978 | chr11:35385322 | |
| TCGAfusionPortal | PRADA | HNSC | TCGA-CV-5966-01A | SUPT6H-MRO | Out-of-frame | Chr17:27008422 | Chr18:48333220 |
| Top |
| TissGeneNet for MRO |
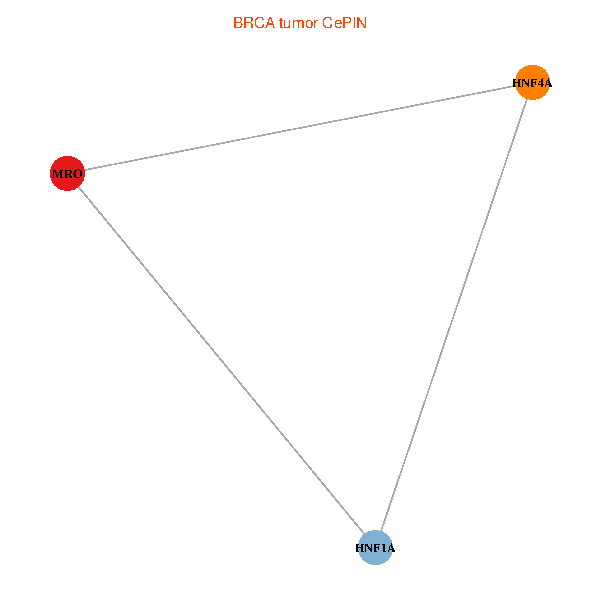
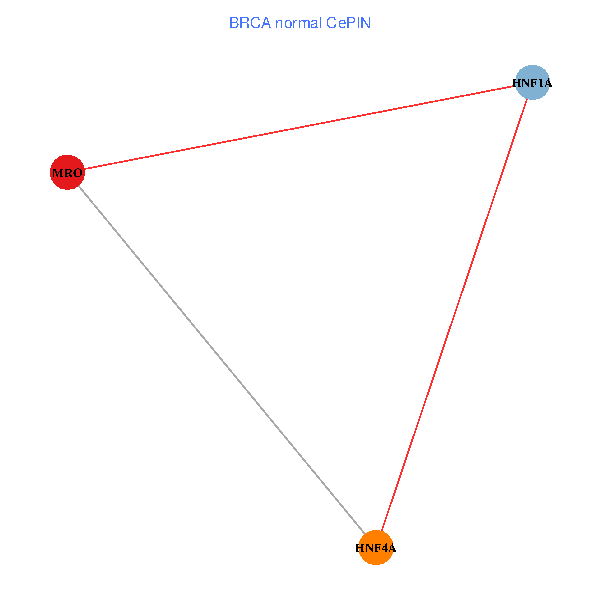
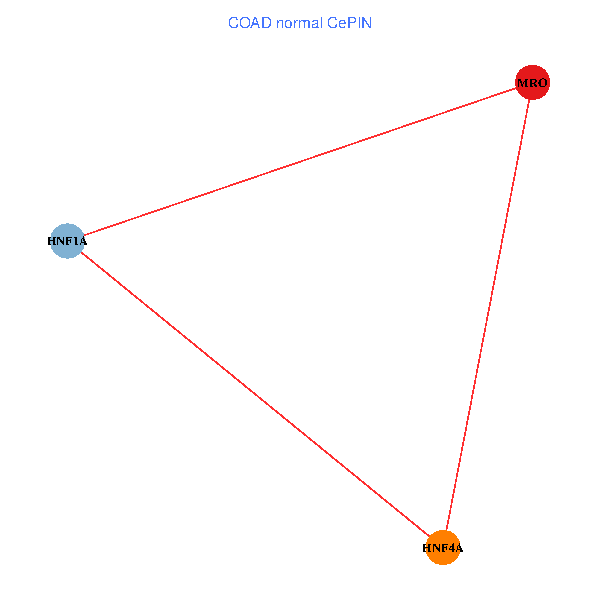
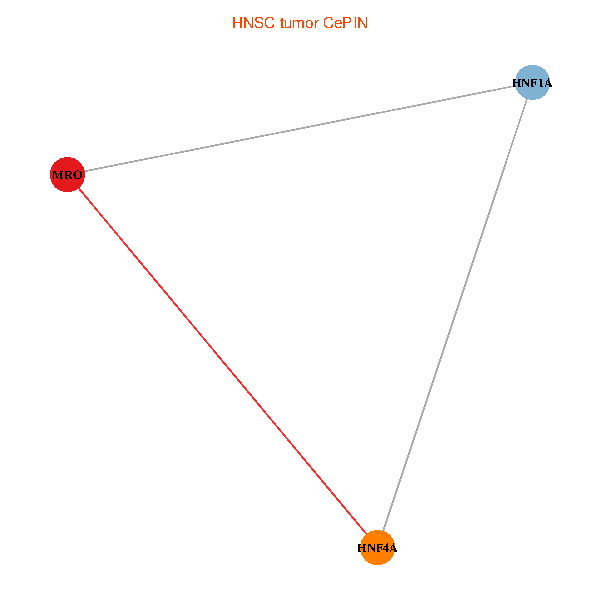
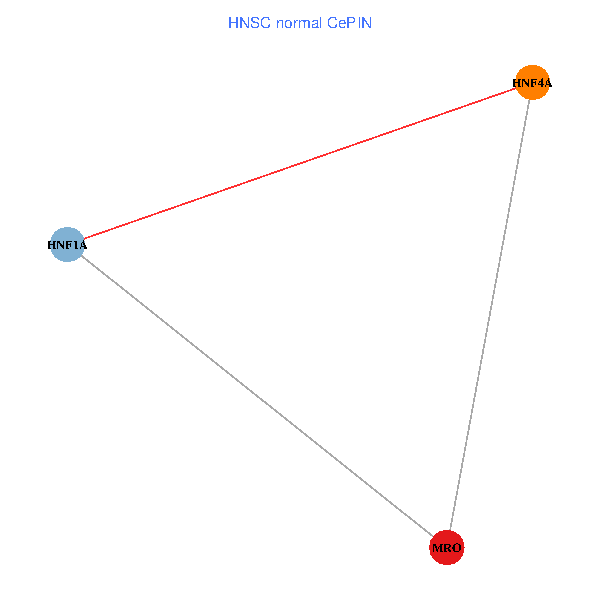
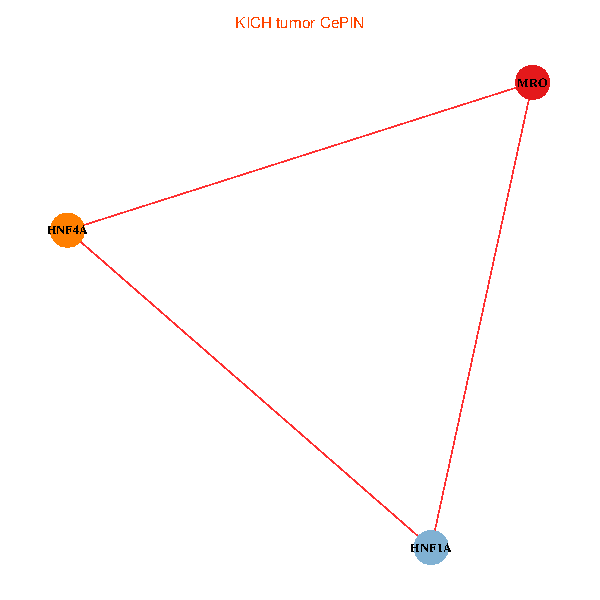
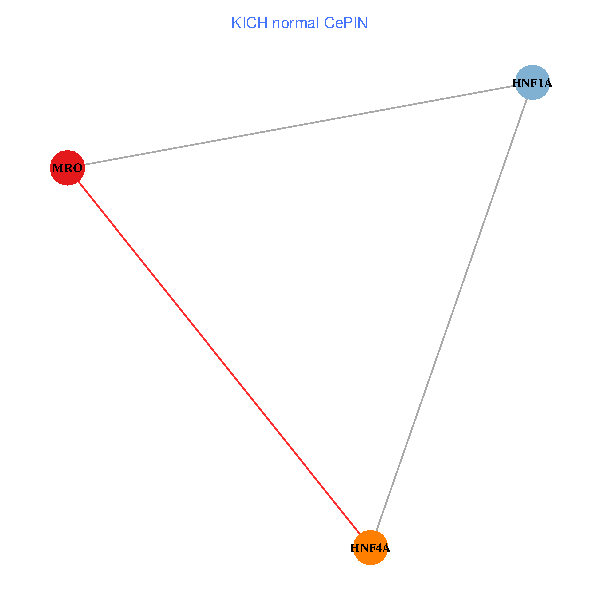
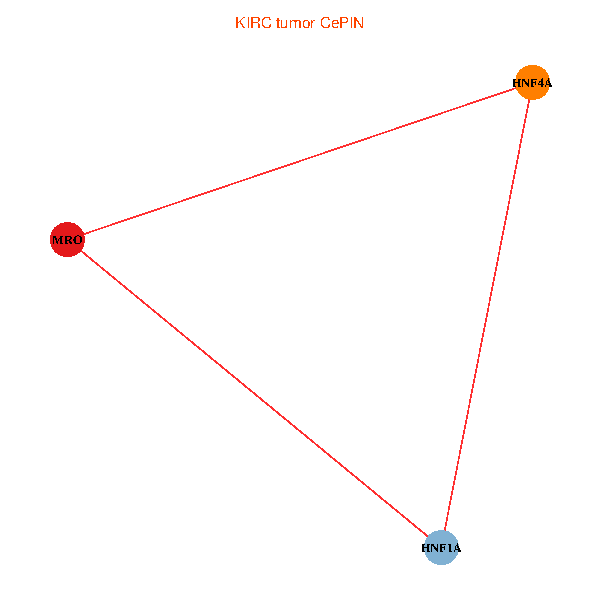
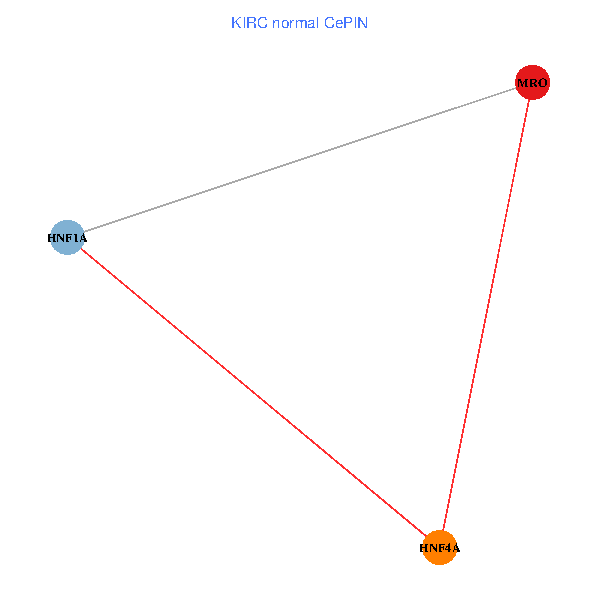
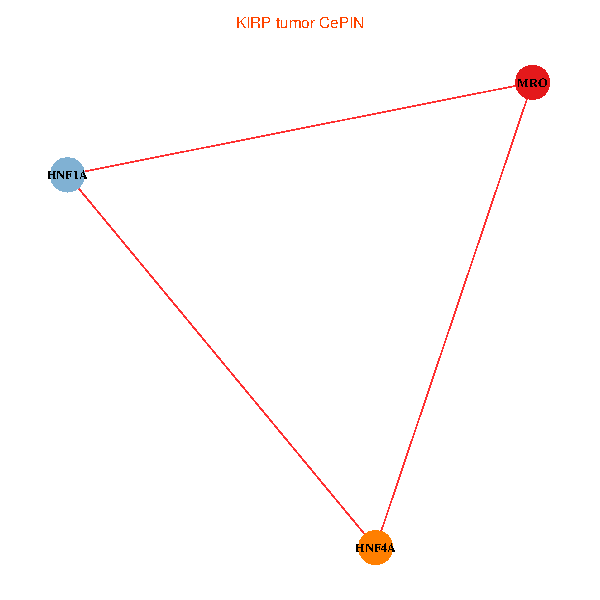
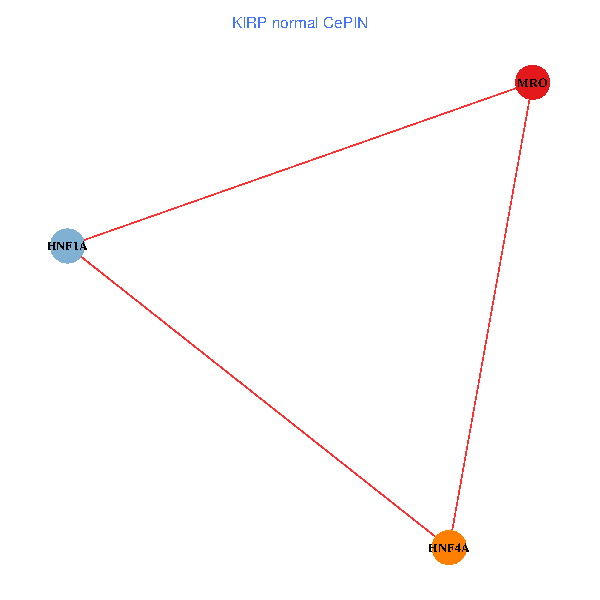
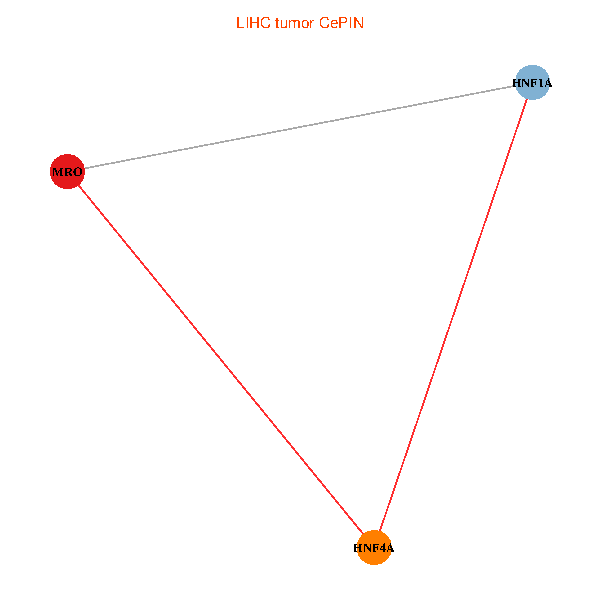
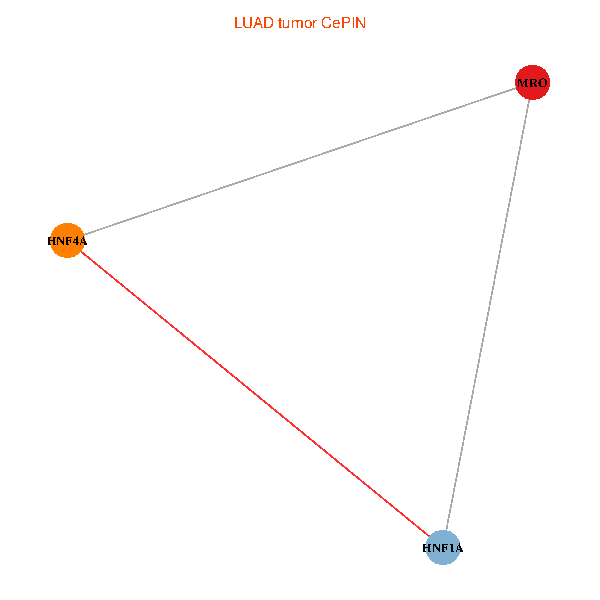
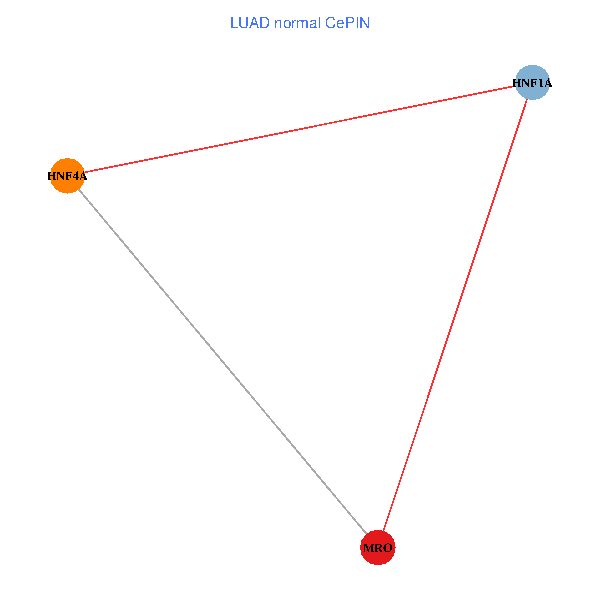
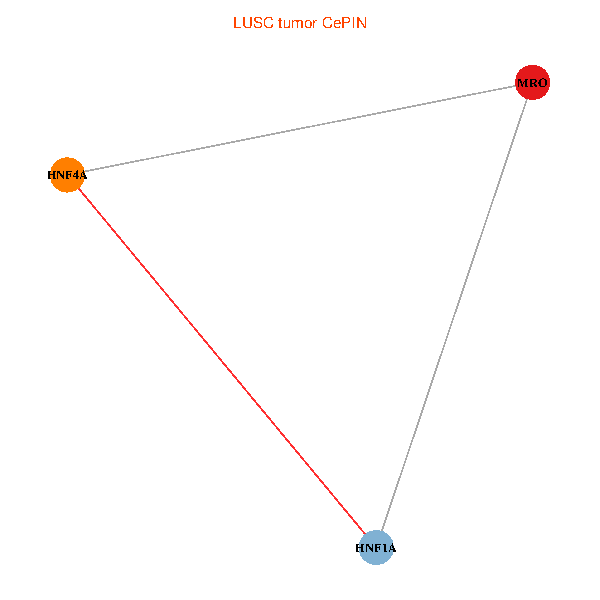
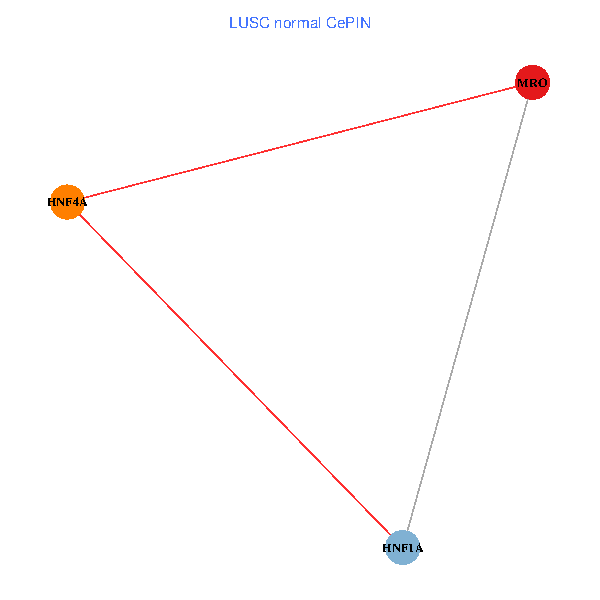
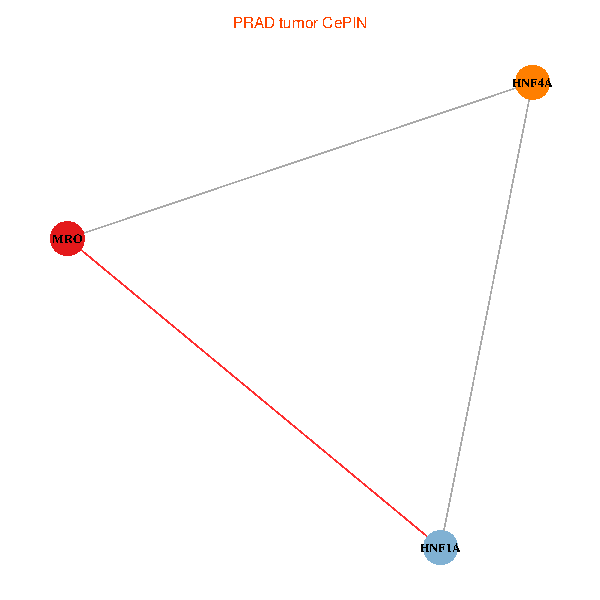
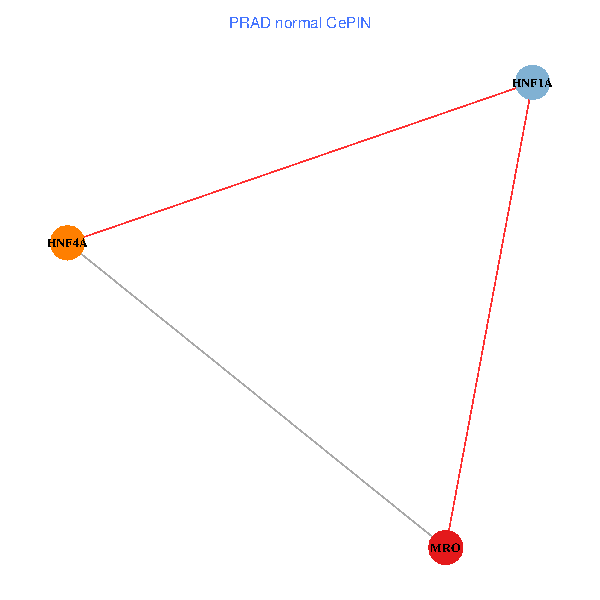
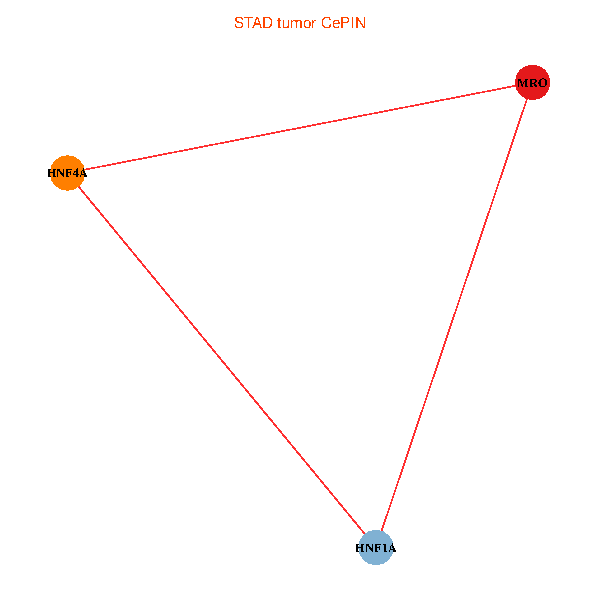
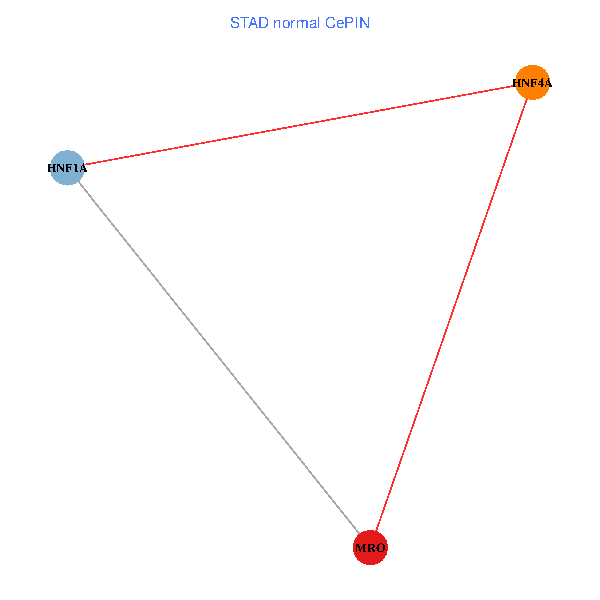
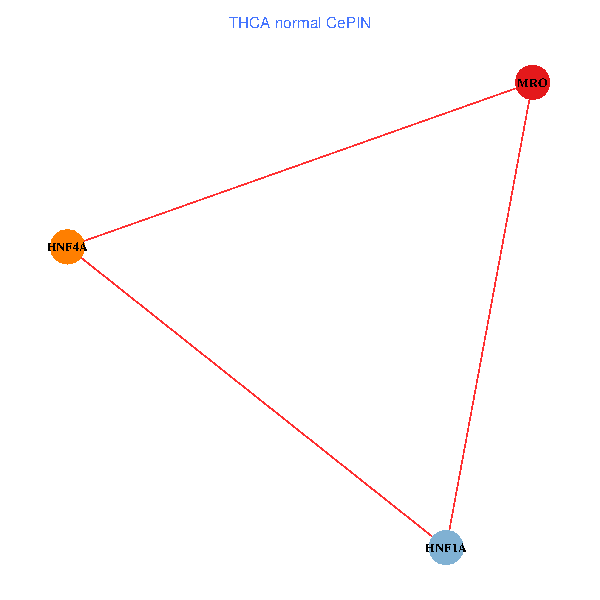
| Co-expressed gene networks based on protein-protein interaction data (CePIN) (TCGA IlluminaHiSeq_RNASeqV2, pan-cancer normalized log2(norm_counts+1) data, version 2016-08-16) (PINA2 ppi data) |
| BRCA (tumor) | BRCA (normal) |
| MRO, HNF4A, HNF1A (tumor) | MRO, HNF4A, HNF1A (normal) |
 |  |
| COAD (tumor) | COAD (normal) |
| MRO, HNF4A, HNF1A (tumor) | MRO, HNF4A, HNF1A (normal) |
 |  |
| HNSC (tumor) | HNSC (normal) |
| MRO, HNF4A, HNF1A (tumor) | MRO, HNF4A, HNF1A (normal) |
 |  |
| KICH (tumor) | KICH (normal) |
| MRO, HNF4A, HNF1A (tumor) | MRO, HNF4A, HNF1A (normal) |
 |  |
| KIRC (tumor) | KIRC (normal) |
| MRO, HNF4A, HNF1A (tumor) | MRO, HNF4A, HNF1A (normal) |
 |  |
| KIRP (tumor) | KIRP (normal) |
| MRO, HNF4A, HNF1A (tumor) | MRO, HNF4A, HNF1A (normal) |
 |  |
| LIHC (tumor) | LIHC (normal) |
| MRO, HNF4A, HNF1A (tumor) | MRO, HNF4A, HNF1A (normal) |
 |  |
| LUAD (tumor) | LUAD (normal) |
| MRO, HNF4A, HNF1A (tumor) | MRO, HNF4A, HNF1A (normal) |
 |  |
| LUSC (tumor) | LUSC (normal) |
| MRO, HNF4A, HNF1A (tumor) | MRO, HNF4A, HNF1A (normal) |
 |  |
| PRAD (tumor) | PRAD (normal) |
| MRO, HNF4A, HNF1A (tumor) | MRO, HNF4A, HNF1A (normal) |
 |  |
| STAD (tumor) | STAD (normal) |
| MRO, HNF4A, HNF1A (tumor) | MRO, HNF4A, HNF1A (normal) |
 |  |
| THCA (tumor) | THCA (normal) |
| MRO, HNF4A, HNF1A (tumor) | MRO, HNF4A, HNF1A (normal) |
 |  |
| Top |
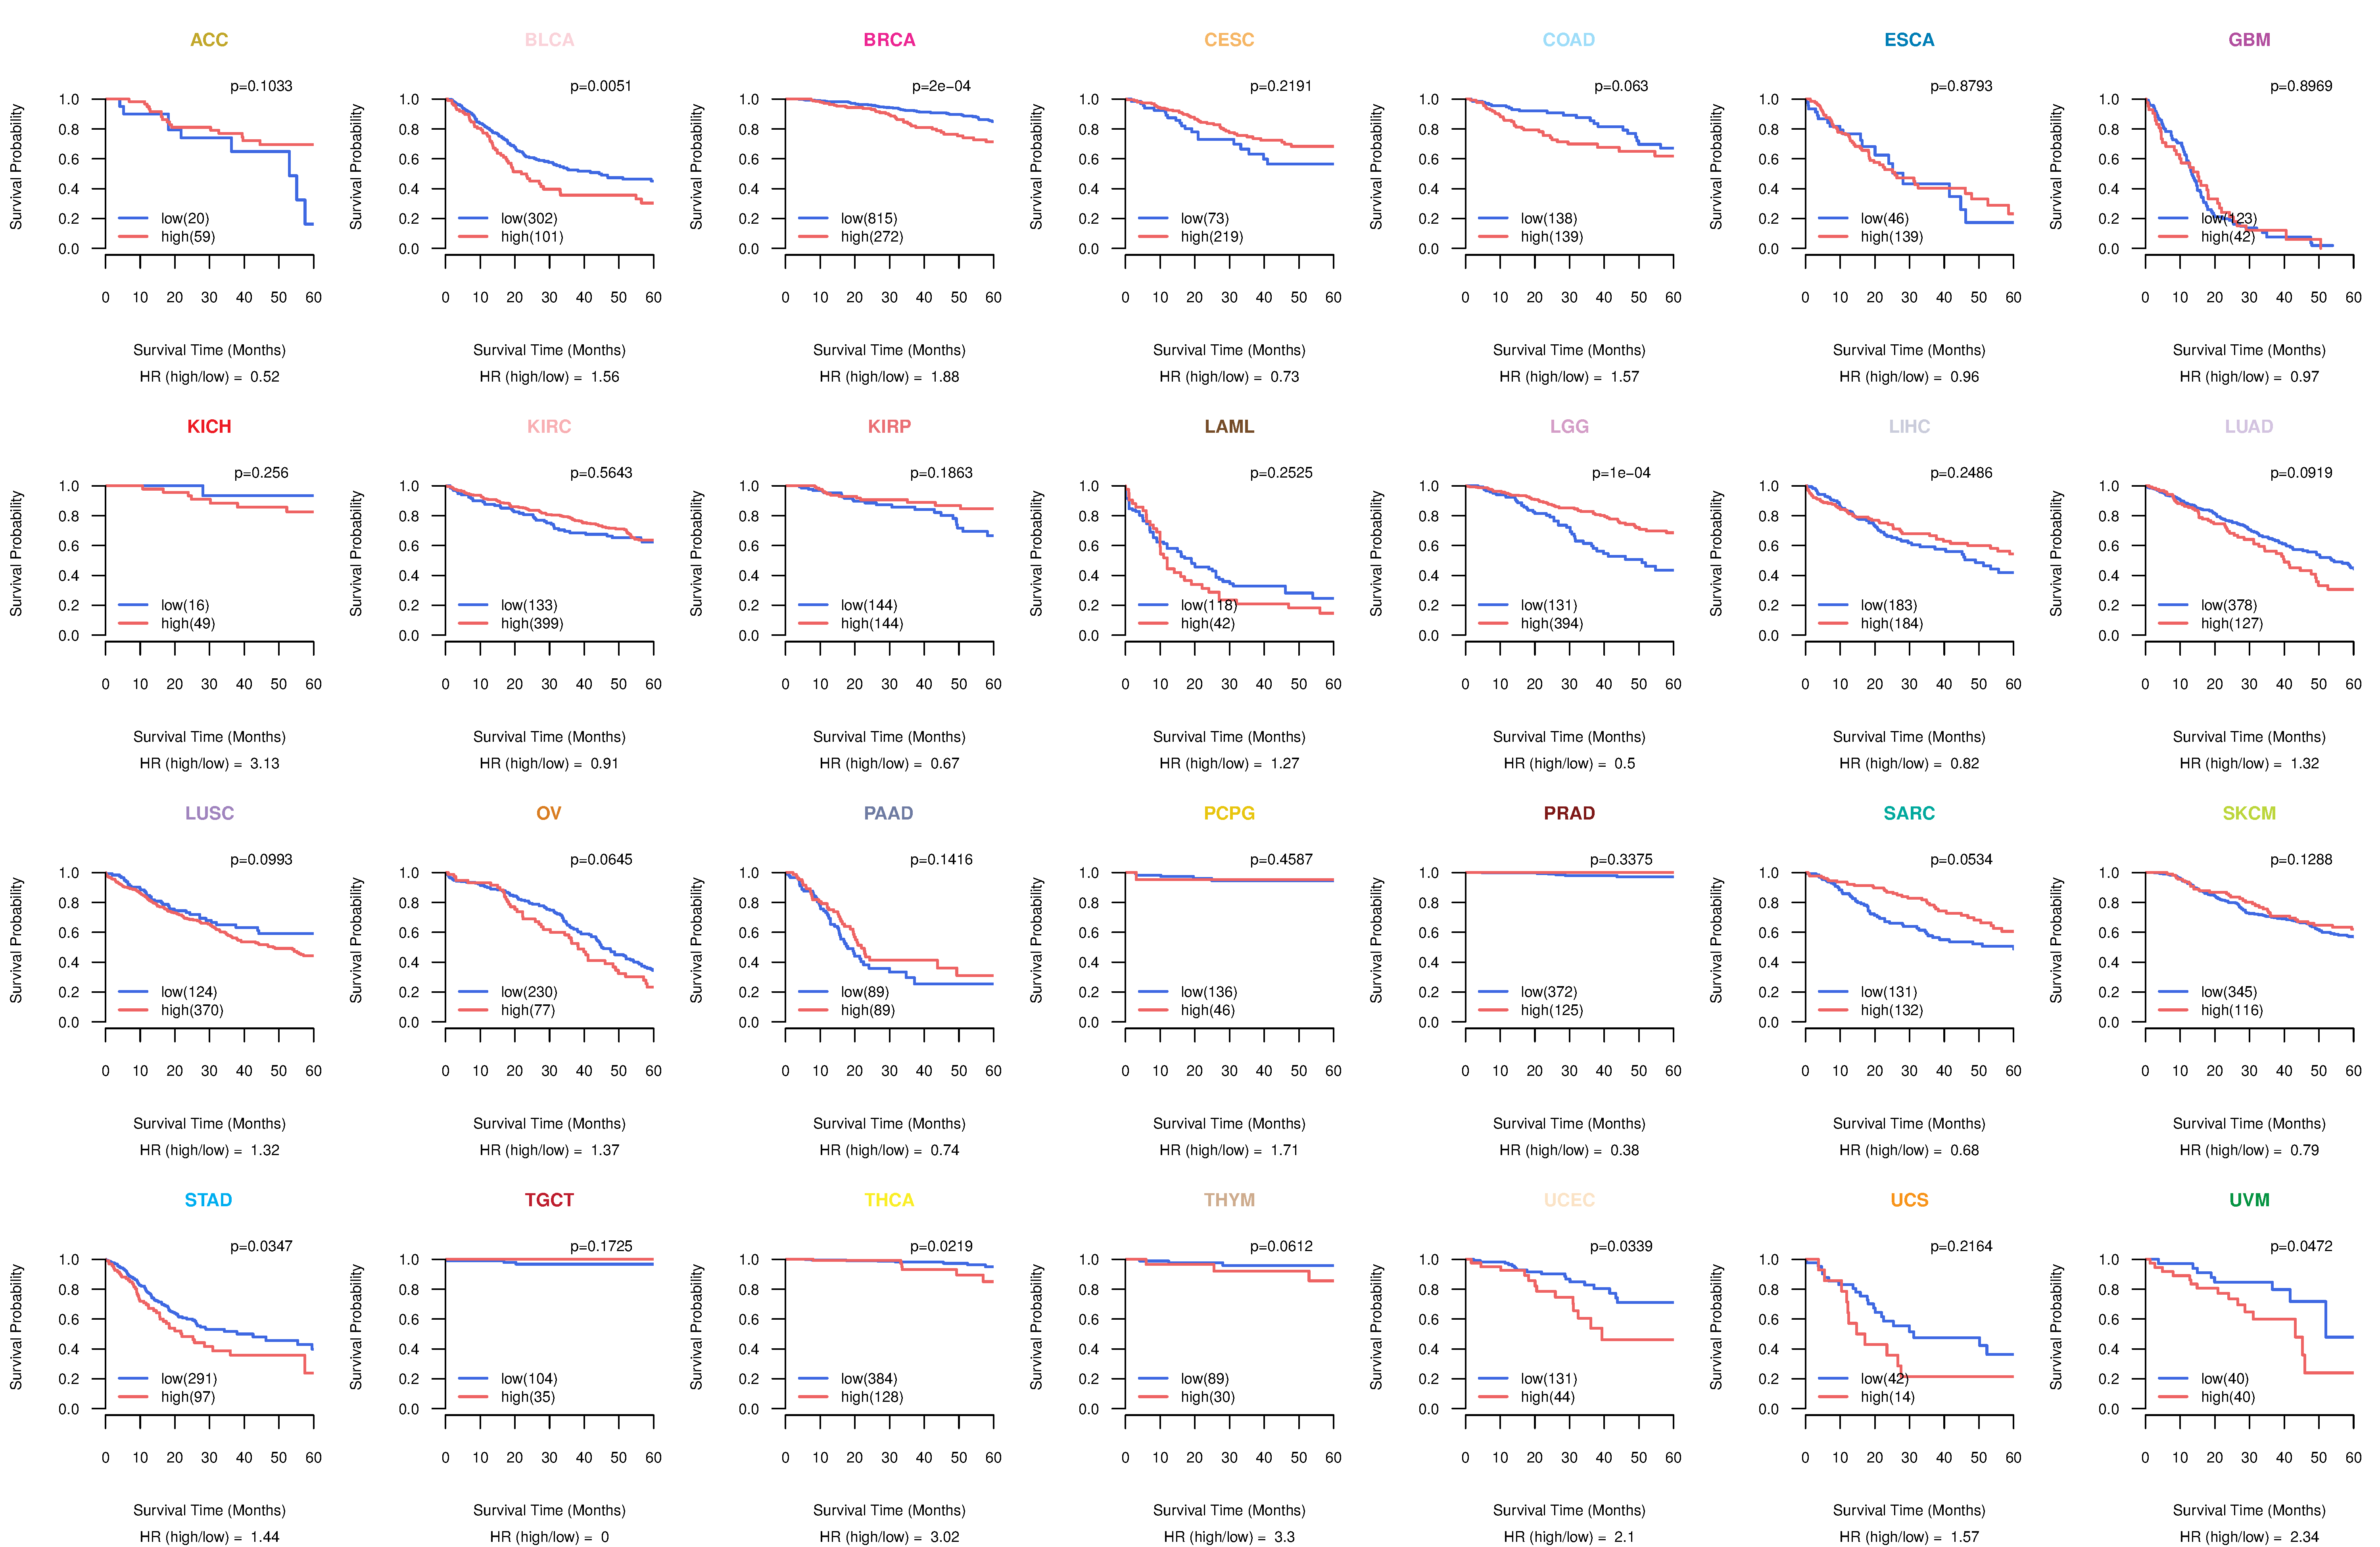
| TissGeneProg for MRO |
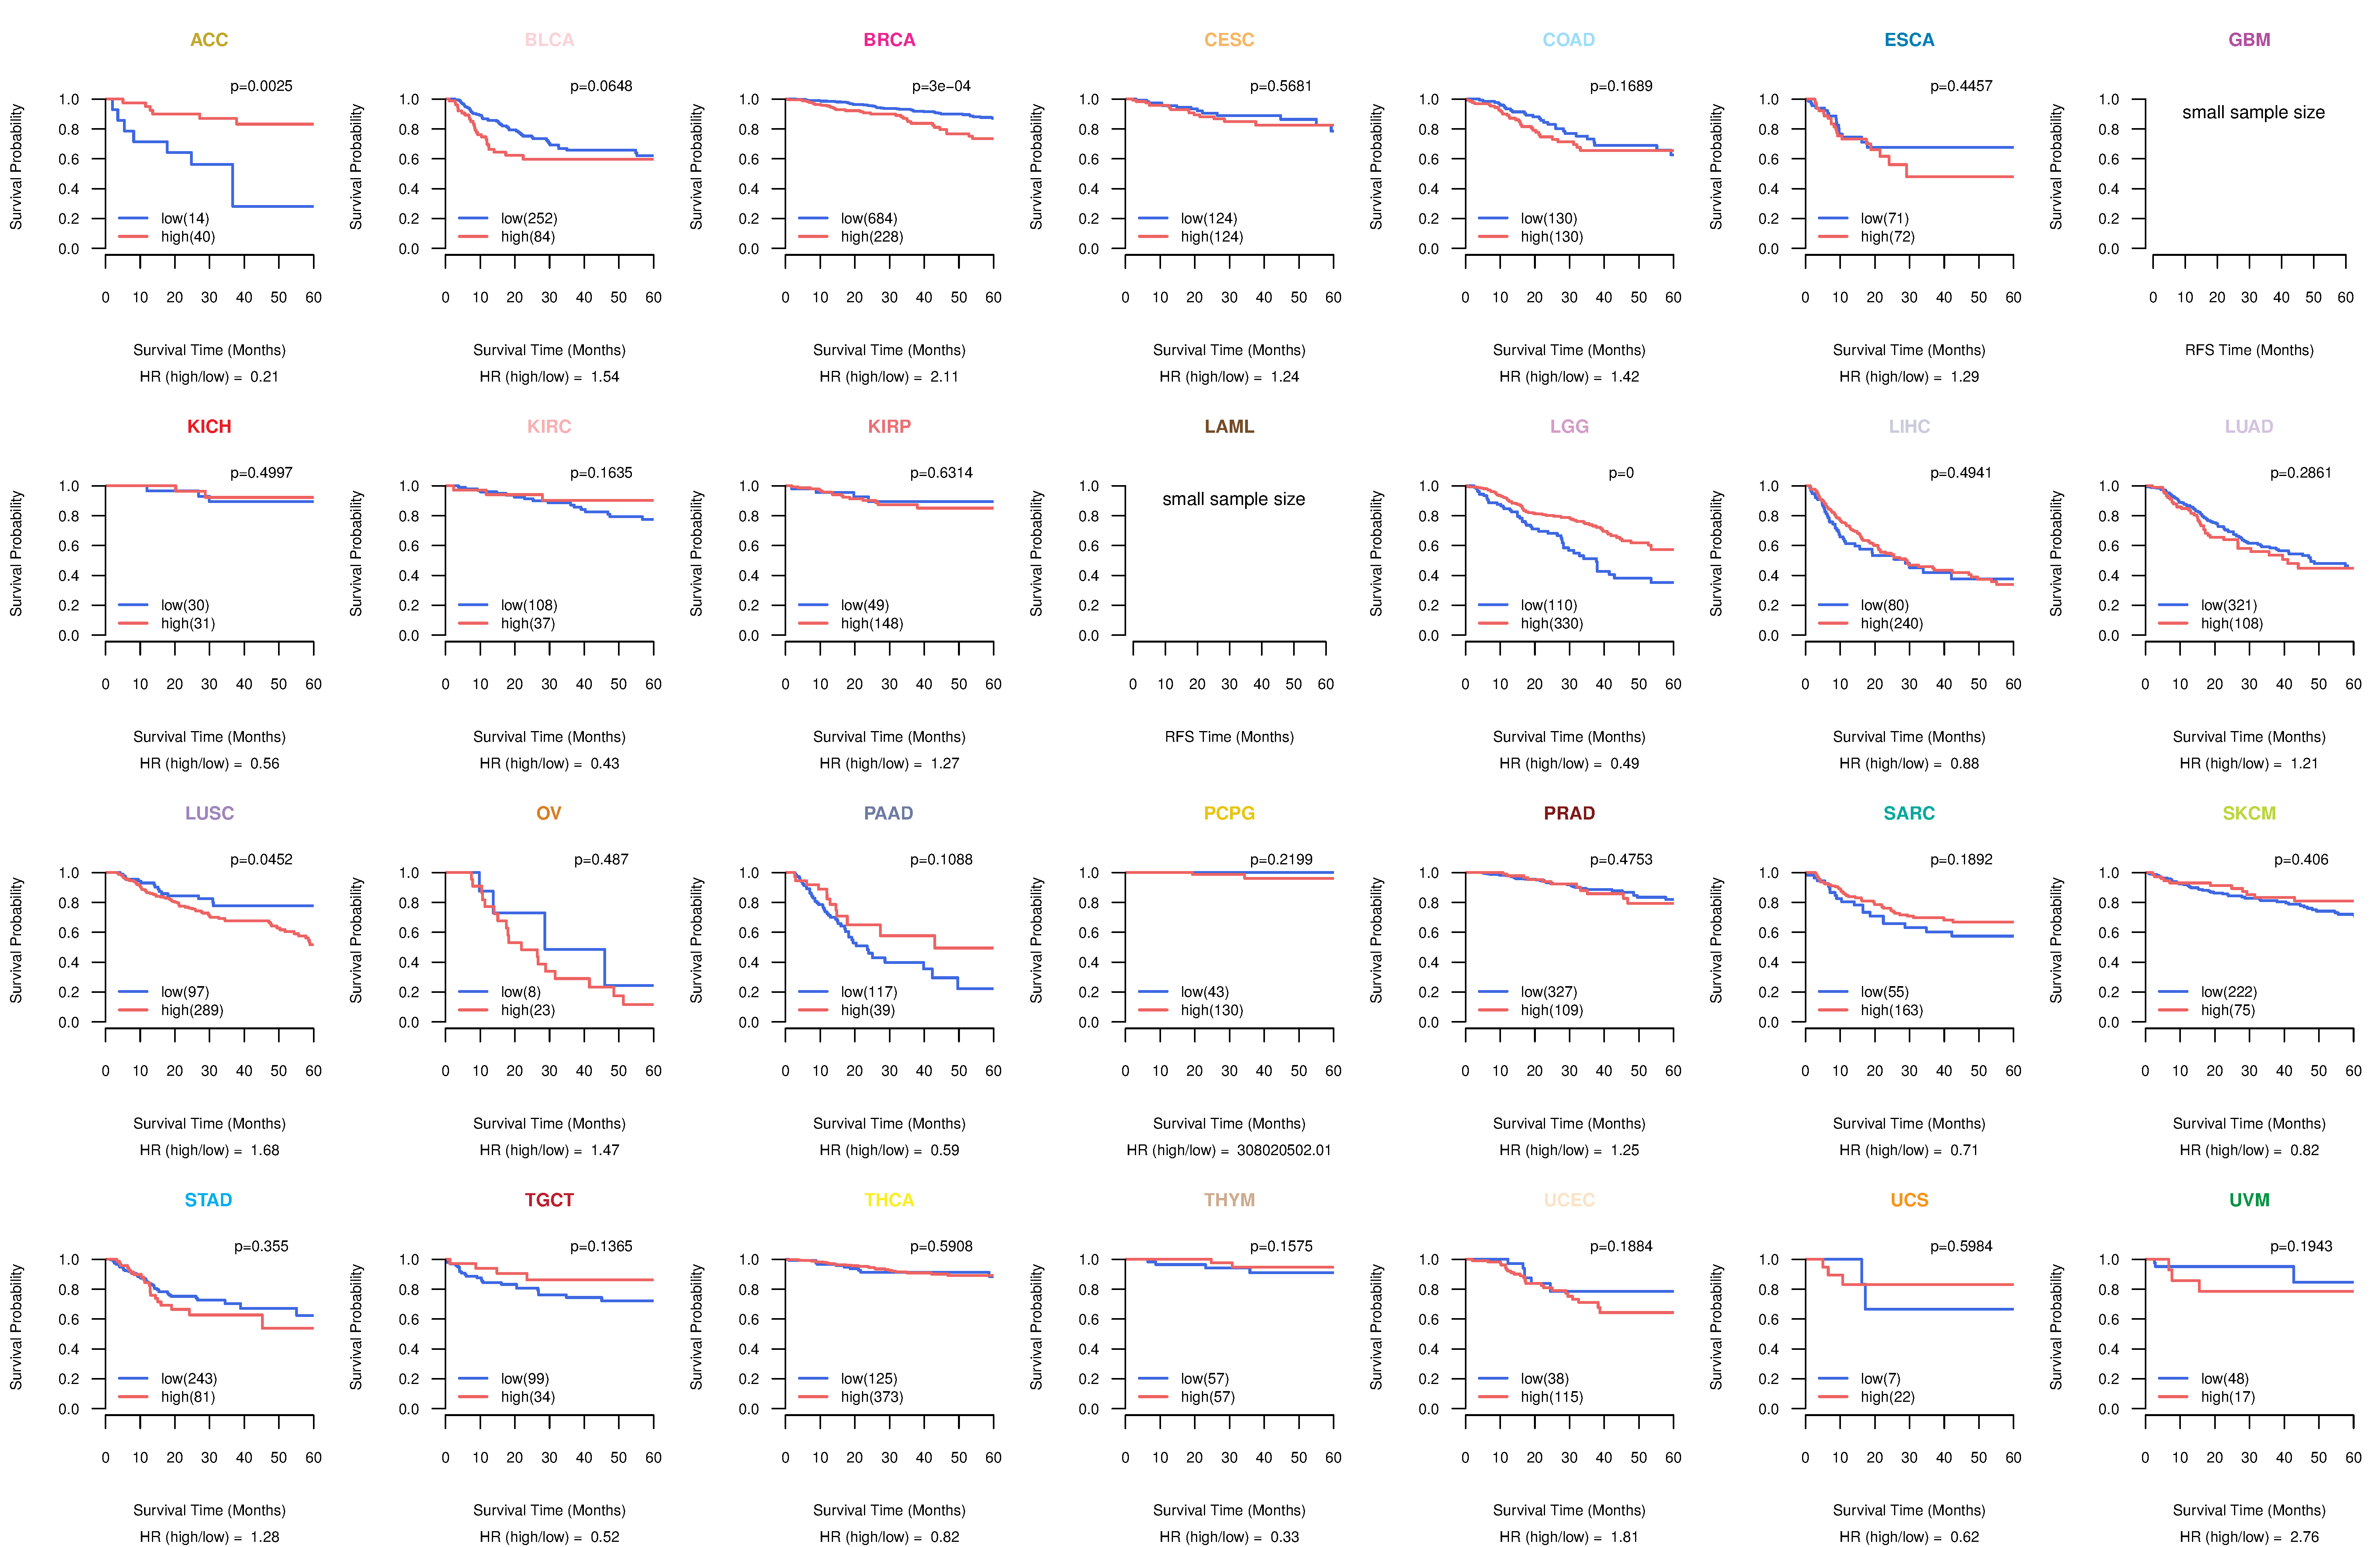
| Kaplan-Meier plots with logrank tests of overall survival (OS) using 28 cancer types (TCGA IlluminaHiSeq_RNASeqV2, pan-cancer normalized log2(norm_counts+1) data, version 2016-08-16) (TCGA clinicalMatrix, phenotype data, version 2016-04-27) * Click on the image to enlarge it in a new window. |
 |
| Kaplan-Meier plots with logrank test of relapse free survival (RFS) using 28 cancer types (TCGA IlluminaHiSeq_RNASeqV2, pan-cancer normalized log2(norm_counts+1) data, version 2016-08-16) (TCGA clinicalMatrix, phenotype data, version 2016-04-27) * Click on the image enlarge it in a new window. |
 |
| Forest plot of Cox proportional hazard ratio (HR) and 95% CI of overall survival (OS) using 28 cancer types (TCGA IlluminaHiSeq_RNASeqV2, pan-cancer normalized log2(norm_counts+1) data, version 2016-08-16) (TCGA clinicalMatrix, phenotype data, version 2016-04-27) * Click on the image enlarge it in a new window. |
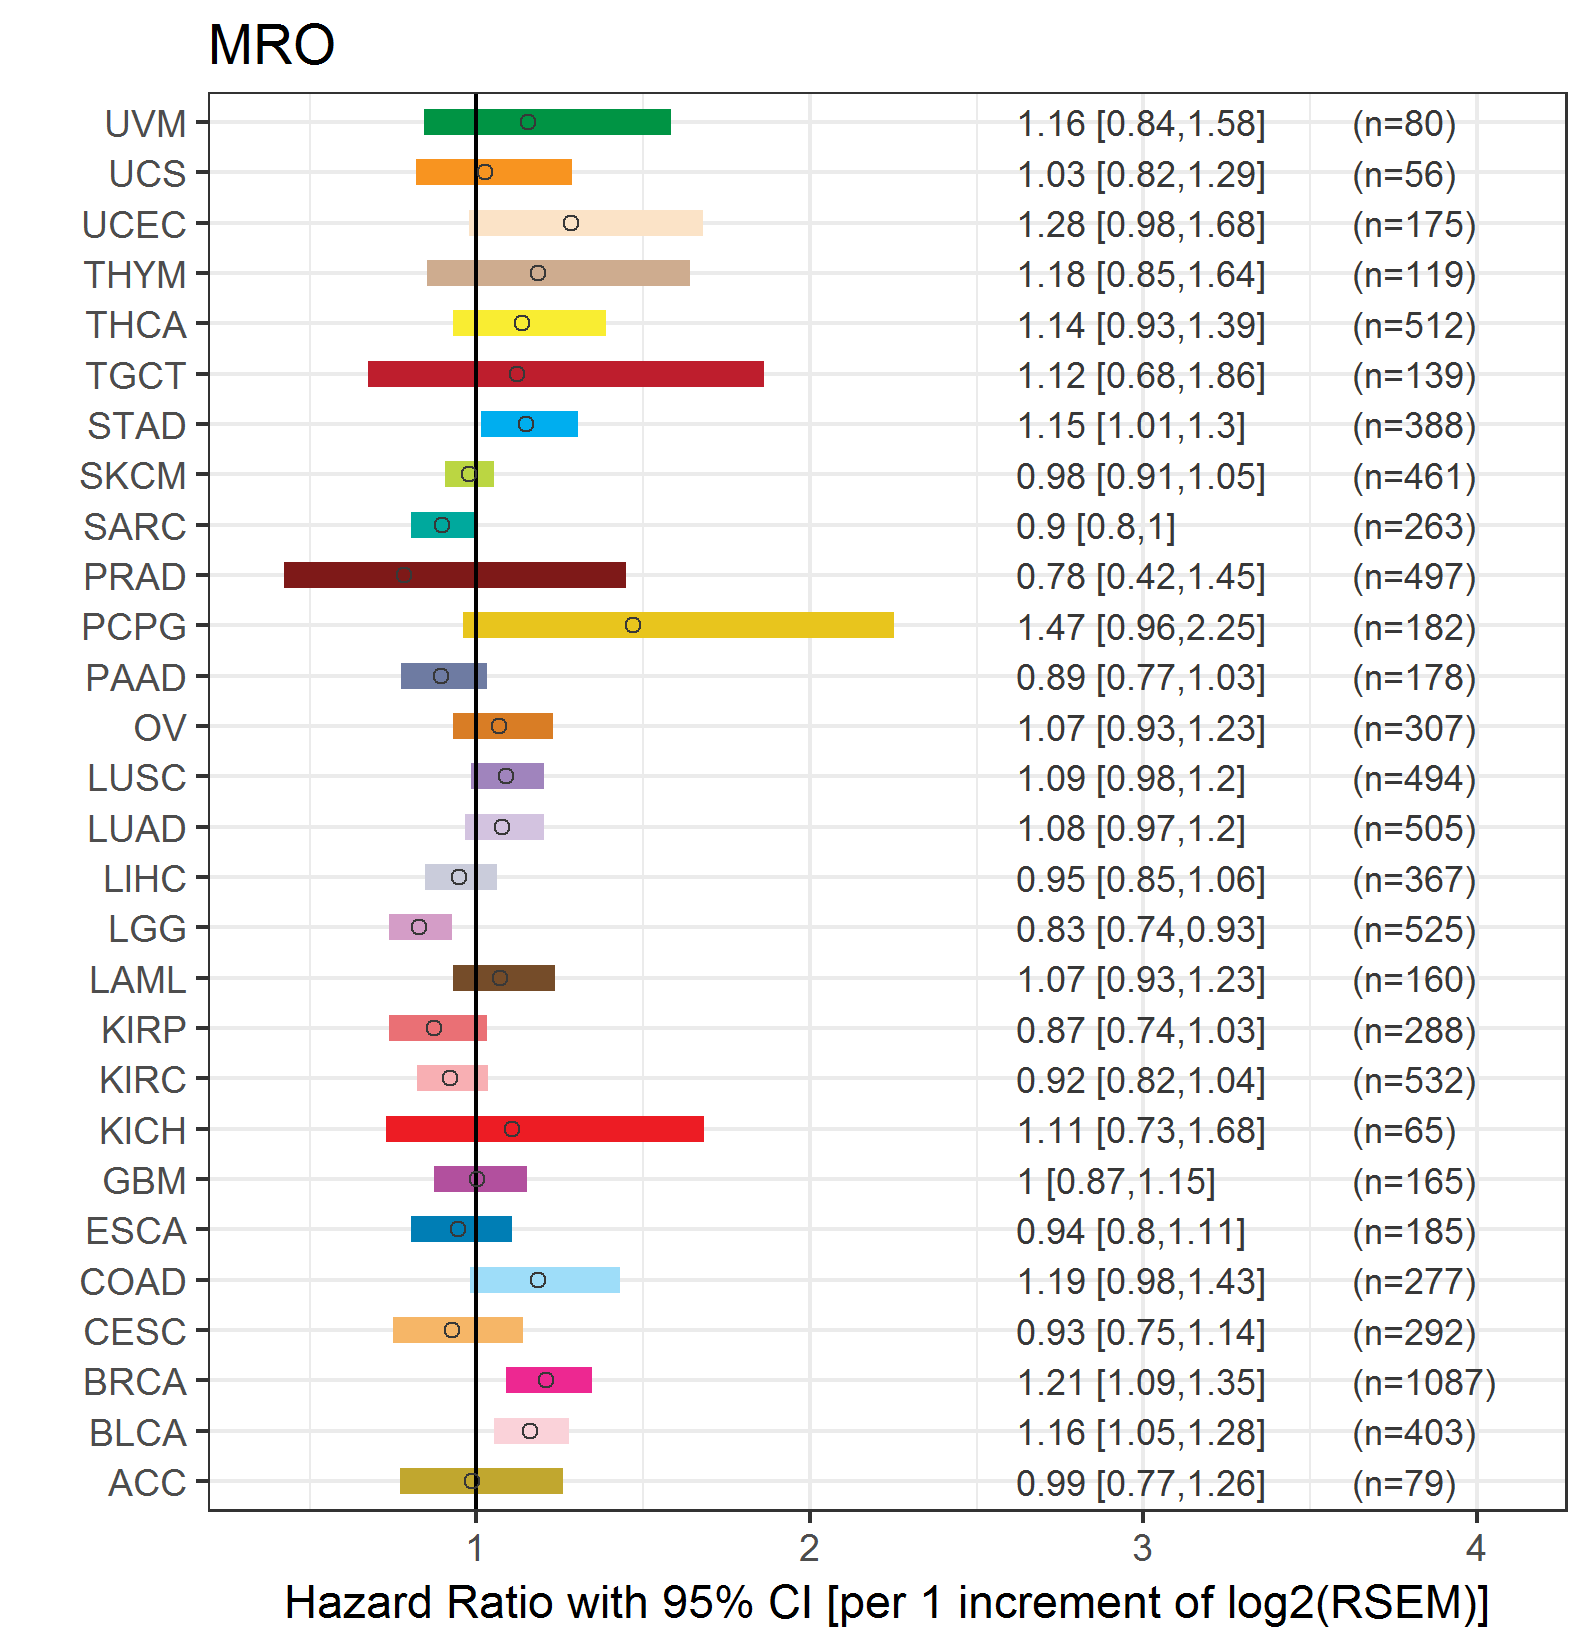 |
| Forest plot of Cox proportional hazard ratio (HR) and 95% CI of relapse free survival (RFS) using 28 cancer types (TCGA IlluminaHiSeq_RNASeqV2, pan-cancer normalized log2(norm_counts+1) data, version 2016-08-16) (TCGA clinicalMatrix, phenotype data, version 2016-04-27) * Click on the image enlarge it in a new window. |
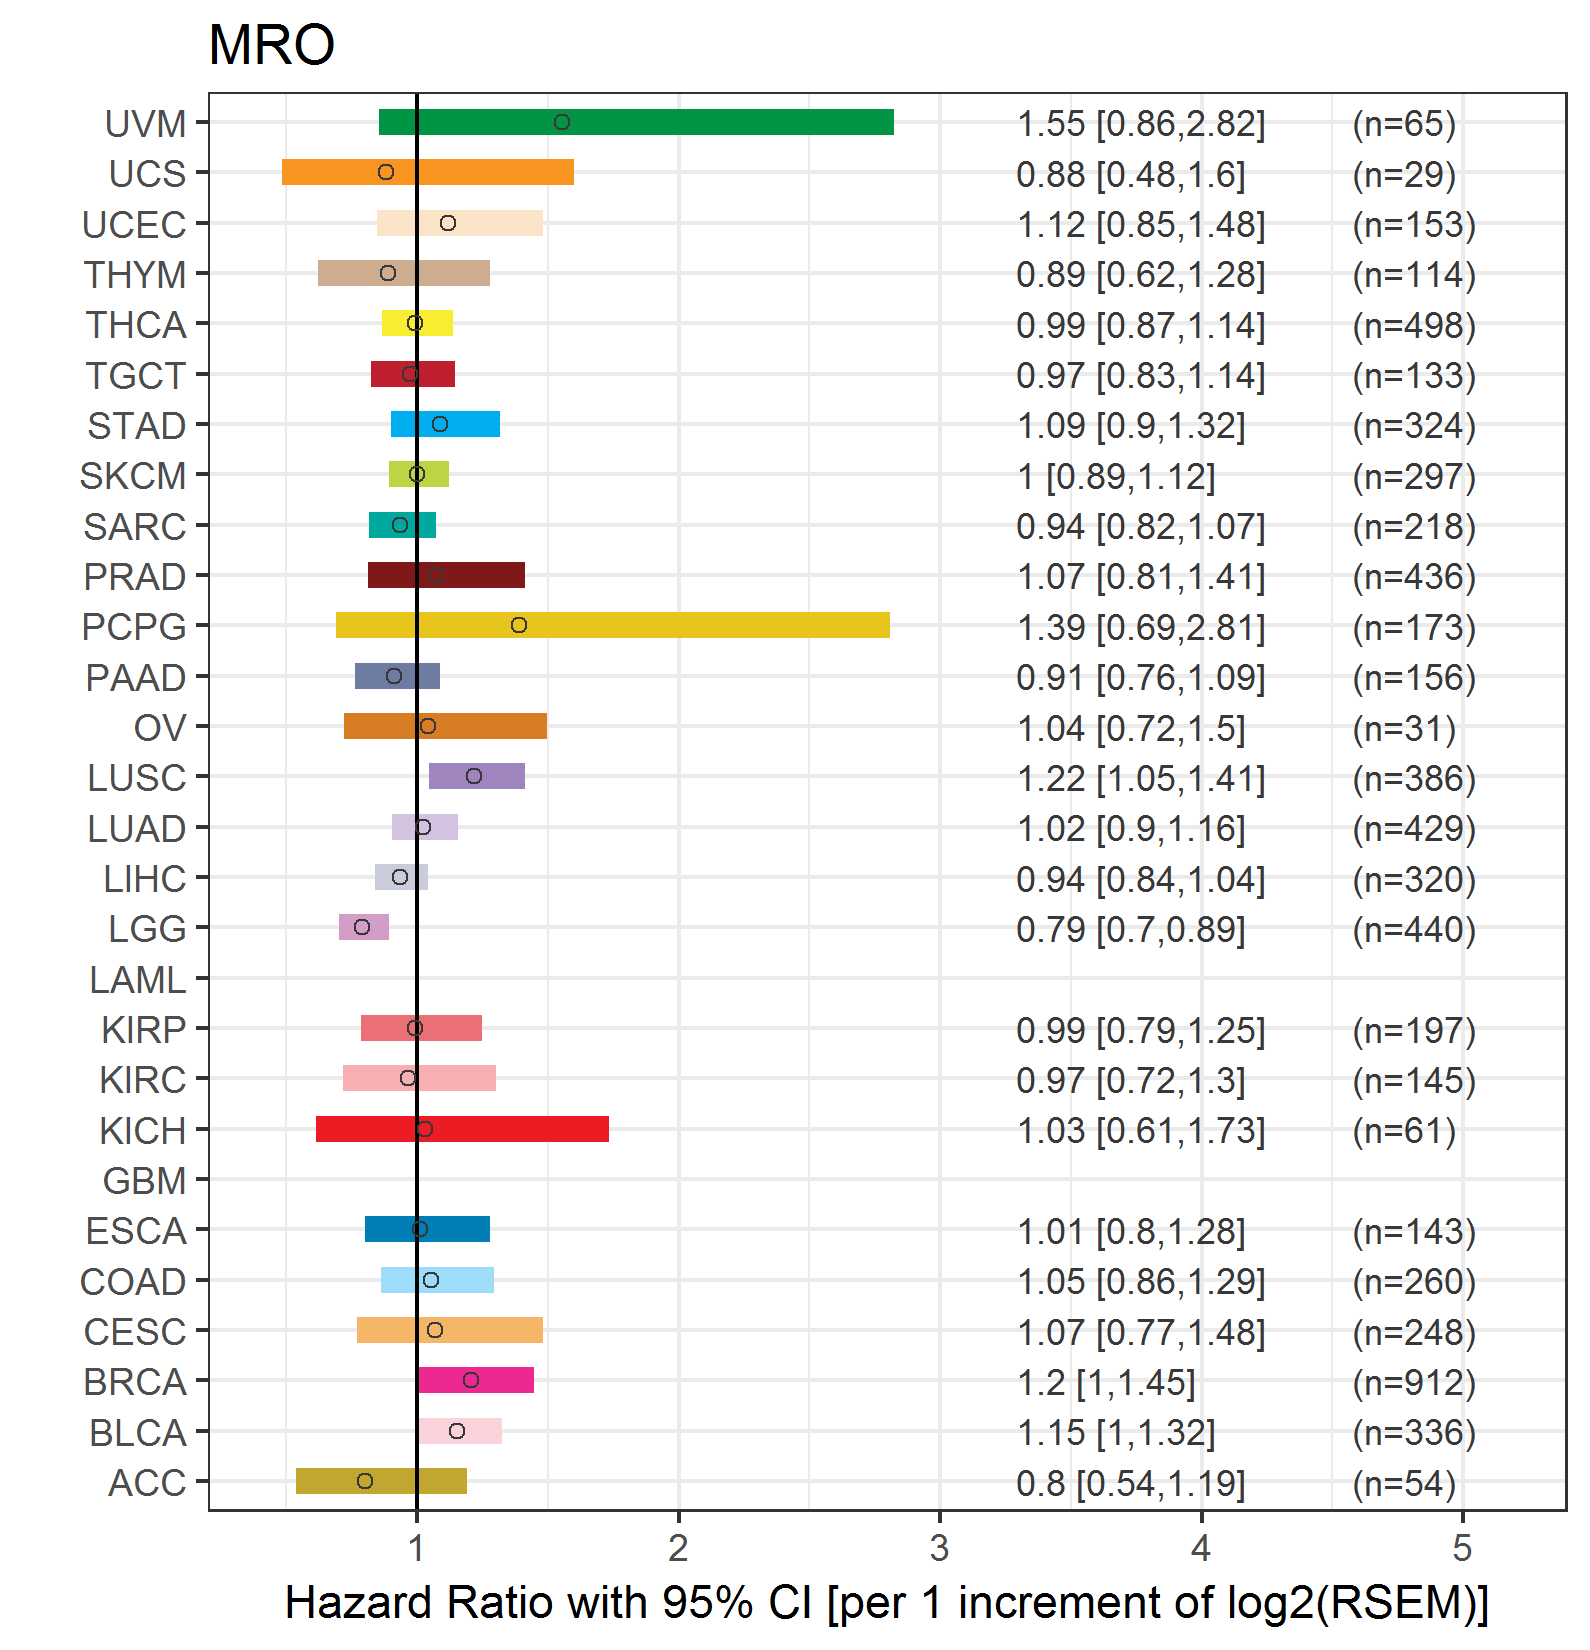 |
| Top |
| TissGeneClin for MRO |
| TissGeneDrug for MRO |
| Drug information targeting TissGene (DrugBank Version 5.0.6, 2017-04-01) |
| DrugBank ID | Drug name | Drug activity | Drug type | Drug status |
| Top |
| TissGeneDisease for MRO |
| Disease information associated with TissGene (DisGeNet, 2016-06-01) |
| Disease ID | Disease name | # pubmeds | Source |
| umls:C0007133 | Carcinoma, Papillary | 2 | BeFree |
| umls:C0023434 | Chronic Lymphocytic Leukemia | 2 | BeFree |
| umls:C0151468 | Thyroid Gland Follicular Adenoma | 1 | BeFree |
| umls:C0205647 | Follicular adenoma | 1 | BeFree |
| umls:C0205696 | Anaplastic carcinoma | 1 | BeFree |
| umls:C0205698 | Undifferentiated carcinoma | 1 | BeFree |
| umls:C0206682 | Follicular thyroid carcinoma | 1 | BeFree |
| umls:C0238461 | Anaplastic thyroid carcinoma | 1 | BeFree |
| umls:C0376544 | Hematopoietic Neoplasms | 1 | BeFree |
|
Copyright 2016-Present - The University of Texas Health Science Center at Houston (UTHealth) Web File Viewing | How to Report, Fraud, Waste and Abuse | State of Texas | Statewide Search | Texas Homeland Security | Site Policies |