 |
| |
| |
| |
| |
| |
| |
|

| TissGeneSummary for STK40 |
 Gene summary Gene summary |
| Basic gene information | Gene symbol | STK40 |
| Gene name | serine/threonine kinase 40 | |
| Synonyms | SHIK|SgK495 | |
| Cytomap | UCSC genome browser: 1p34.3 | |
| Type of gene | protein-coding | |
| RefGenes | NM_001282546.1, NM_001282547.1,NM_032017.2, | |
| Description | SINK-homologous serine/threonine-protein kinaseSer/Thr-like kinaseserine/threonine-protein kinase 40sugen kinase 495 | |
| Modification date | 20141207 | |
| dbXrefs | MIM : 609437 | |
| HGNC : HGNC | ||
| Ensembl : ENSG00000196182 | ||
| HPRD : 11359 | ||
| Vega : OTTHUMG00000008238 | ||
| Protein | UniProt: go to UniProt's Cross Reference DB Table | |
| Expression | CleanEX: HS_STK40 | |
| BioGPS: 83931 | ||
| Pathway | NCI Pathway Interaction Database: STK40 | |
| KEGG: STK40 | ||
| REACTOME: STK40 | ||
| Pathway Commons: STK40 | ||
| Context | iHOP: STK40 | |
| ligand binding site mutation search in PubMed: STK40 | ||
| UCL Cancer Institute: STK40 | ||
| Assigned class in TissGDB* | C | |
| Included tissue-specific gene expression resources | ||
| Specific-tissues in normal samples (assigned by TissGDB using HPA, TiGER, and GTEx) | StomachTestis | |
| Cancer types related to the specific-tissues in cancer samples (assigned by TissGDB using TCGA) | STADTGCT | |
| Reference showing the relevant tissue of STK40 | ||
| Description by TissGene annotations | Cancer gene TissgsLTS Fused withTSGene | |
| * Class A consists of genes with literature evidence and is part of the cTissGenes. Class B consists of only cTissGenes without additional evidence. The remaining genes belong to Class C. |
| Gene ontology having evidence of Inferred from Direct Assay (IDA) from Entrez |
| GO ID | GO term | PubMed ID |
| Top |
| TissGeneExp for STK40 |
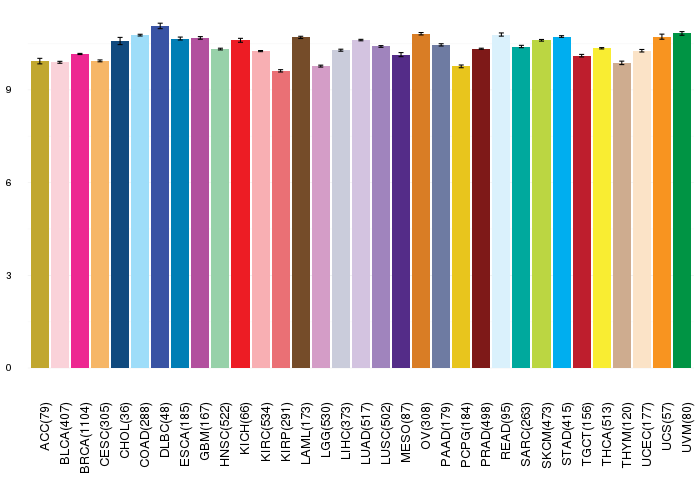
| Gene expressions across 28 cancer types (X-axis: cancer type and Y-axis: log2(norm_counts+1)) (TCGA IlluminaHiSeq_RNASeqV2, pan-cancer normalized log2(norm_counts+1) data, version 2016-08-16) |
 |
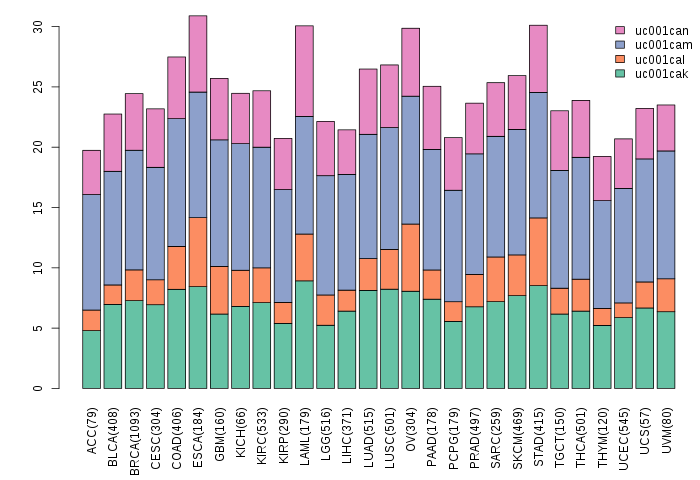
| Gene isoform expressions across 28 cancer types (X-axis: cancer type and Y-axis: log2(norm_counts+1)) (TCGA pan-cancer tcga_rsem_isoform_tpm, version 2016-09-01) |
 |
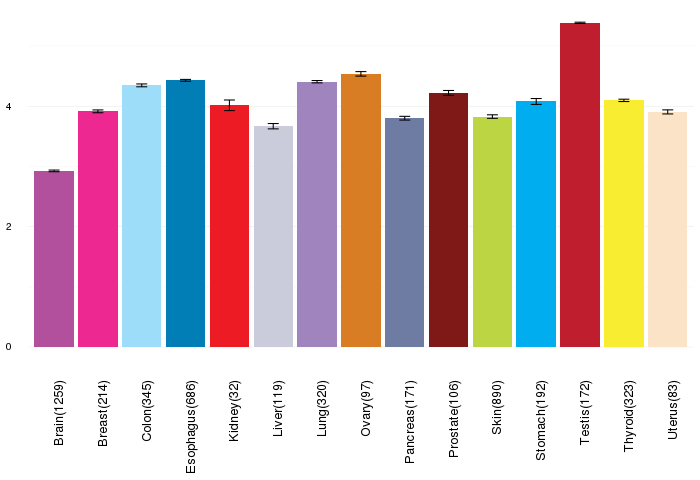
| Gene expressions across normal tissues of GTEx data (GTEx GTEx_Analysis_v6_RNA-seq_RNA-SeQCv1.1.8_gene_rpkm.gct) - Here, we shows the matched tissue types only among our 28 cancer types. |
 |
| Different expressions across 14 cancer types with more than 10 samples between matched tumors and normals (X-axis: cancer type and Y-axis: log2(norm_counts+1)) (TCGA IlluminaHiSeq_RNASeqV2, pan-cancer normalized log2(norm_counts+1) data, version 2016-08-16) |
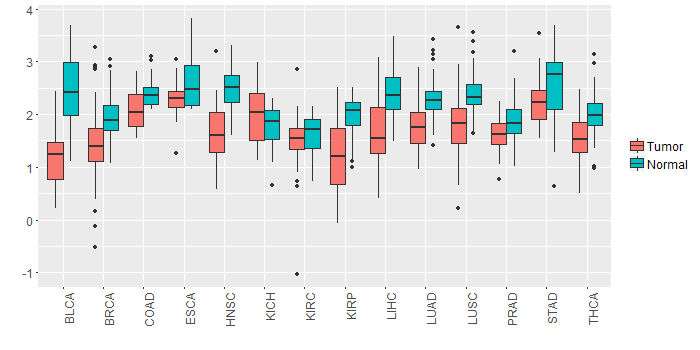 |
| - Significantly differentially expressed cancer types and information. (|Fold change|>1 and FDR<0.05) |
| Cancer type | Mean(exp) in tumor | Mean(exp) in matched normal | Log2FC | P-val. | FDR |
| BLCA | 1.223650949 | 2.488440422 | -1.264789474 | 5.81E-07 | 2.15E-05 |
| Top |
| TissGene-miRNA for STK40 |
| Significantly anti-correlated miRNAs of TissGene across 28 cancer types (Gene-miRNA relations from TargetScanHuman Relsease 7.1, Conserved_Site_Context_Scores.txt.zip, 06.01.2016) (TCGA IlluminaHiSeq_miRNASeq, log2(RPM+1) data, version 2016-11-21) (TCGA IlluminaHiSeq_RNASeqV2, log2(normalized_count+1) data, version 2016-08-16) (Spearman’s Rank Correlation (p-value<0.05 and coefficient<-0.25)) |
| Cancer type | miRNA id | miRNA accession | P-val. | Coeff. | # samples |
| UCS | hsa-miR-146a-5p | MIMAT0000449 | 0.039 | -0.28 | 56 |
| Top |
| TissGeneMut for STK40 |
| TissGeneSNV for STK40 |
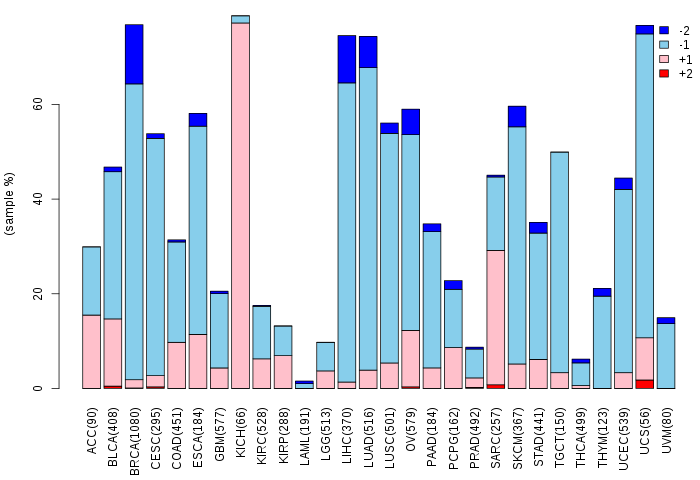
| nsSNV counts per each loci. Different colors of circles represent different cancer types. Circle size denotes number of samples. (TCGA somatic mutation (SNPs and small INDELs) data, version 2016-04-25) * Click on the image to enlarge it in a new window. |
 |
 |
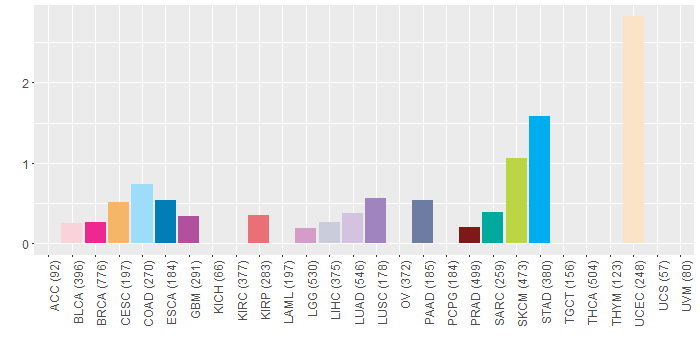
| Somatic nucleotide variants of TissGene across 28 cancer types (X-axis: cancer type and Y-axis: % of mutated samples) The numbers in parentheses are numbers of samples with mutation (nsSNVs). (TCGA somatic mutation (SNPs and small INDELs) data, version 2016-04-25) |
 |
| - nsSNVs sorted by frequency. |
| AAchange | Cancer type | # samples |
| p.S246G | LIHC | 1 |
| p.P249L | SKCM | 1 |
| p.L112F | SKCM | 1 |
| p.S14L | UCEC | 1 |
| p.A358V | READ | 1 |
| p.R308W | SKCM | 1 |
| p.D416N | BRCA | 1 |
| p.R385S | UCEC | 1 |
| p.R136H | CESC | 1 |
| p.K165M | LUSC | 1 |
| p.N158S | GBM | 1 |
| p.R251C | STAD | 1 |
| p.E301V | READ | 1 |
| p.A54V | BLCA | 1 |
| p.P349R | LUAD | 1 |
| p.R116C | SKCM | 1 |
| p.L198R | CHOL | 1 |
| p.R431H | PAAD | 1 |
| p.S48T | UCEC | 1 |
| p.T59M | PRAD | 1 |
| p.R308W | STAD | 1 |
| p.R380C | UCEC | 1 |
| p.A320D | ESCA | 1 |
| p.D60E | SARC | 1 |
| p.L310M | UCEC | 1 |
| p.R211W | STAD | 1 |
| p.R40C | SKCM | 1 |
| p.V244M | COAD | 1 |
| p.R380C | STAD | 1 |
| p.K165E | STAD | 1 |
| p.Q233H | BRCA | 1 |
| p.A327V | UCEC | 1 |
| p.E12K | STAD | 1 |
| p.P249S | SKCM | 1 |
| p.A154T | COAD | 1 |
| p.L156H | KIRP | 1 |
| p.A41S | LUAD | 1 |
| p.S25Y | UCEC | 1 |
| p.D228N | LGG | 1 |
| Top |
| TissGeneCNV for STK40 |
| Copy number variations of TissGene across 28 cancer types (X-axis: cancer type and Y-axis: % of CNV samples) (TCGA Gistic2_CopyNumber_Gistic2_all_data_by_genes, Gistic2 copy number data, version 2016-08-16) |
 |
| Top |
| TissGeneFusions for STK40 |
| Fusion genes including TissGene (ChimerDB 3.0, 2016-12-01 and TCGA fusion Portal 2015-12-01) |
| Database | Src | Cancer type | Sample | Fusion gene | ORF | 5'-gene BP | 3'-gene BP |
| Chimerdb3.0 | ChiTaRs | NA | BF964008 | QDPR-STK40 | chr4:17492324 | chr1:36831846 | |
| Chimerdb3.0 | ChiTaRs | NA | CB529143 | IDI2-AS1-STK40 | chr10:1086345 | chr1:36807142 | |
| Chimerdb3.0 | ChiTaRs | NA | DA570690 | STK40-STK40 | chr1:36807194 | chr1:36851325 | |
| Chimerdb3.0 | ChiTaRs | NA | BF445312 | RHOBTB2-STK40 | chr8:22877951 | chr1:36823513 |
| Top |
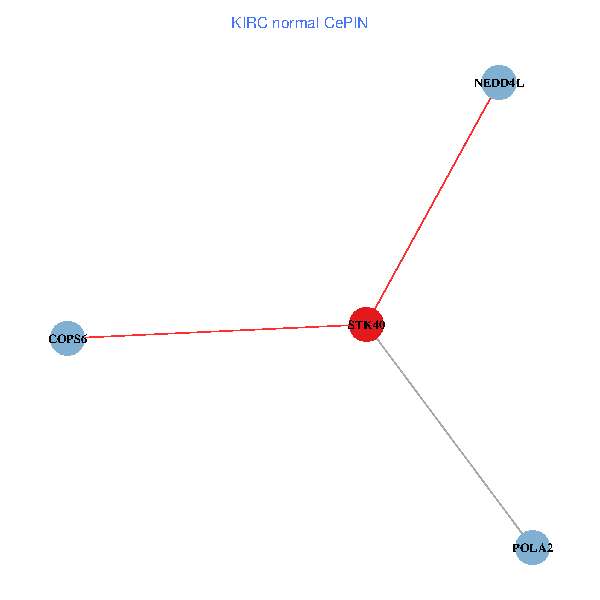
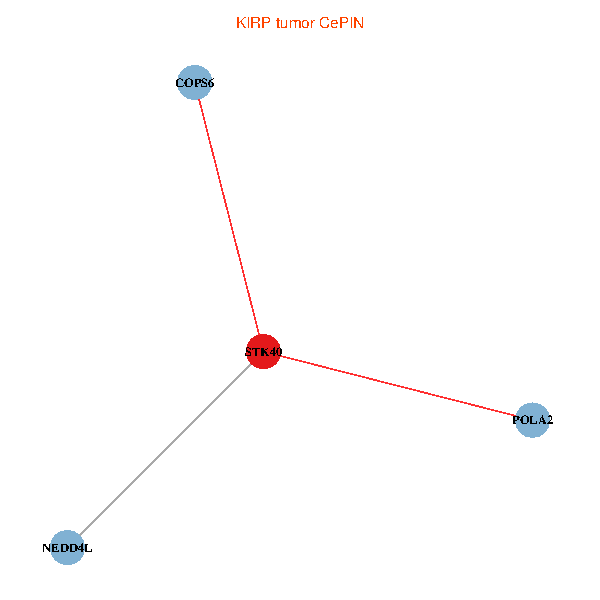
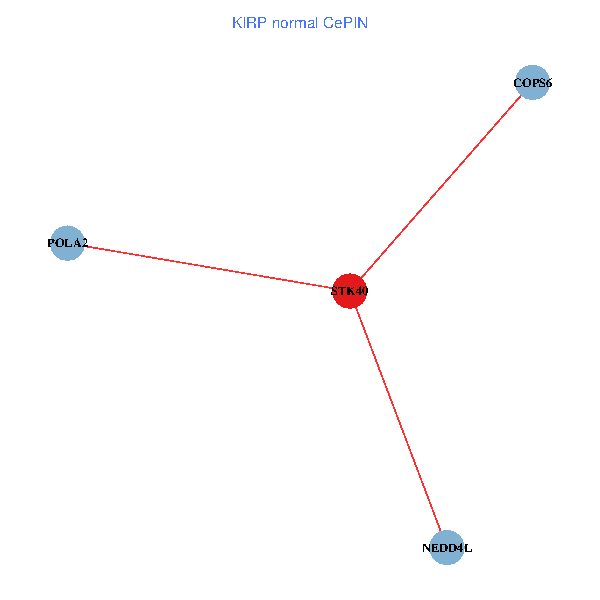
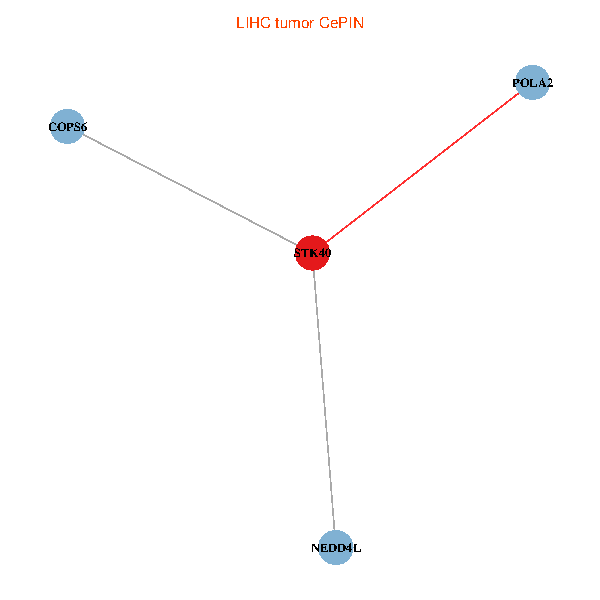
| TissGeneNet for STK40 |
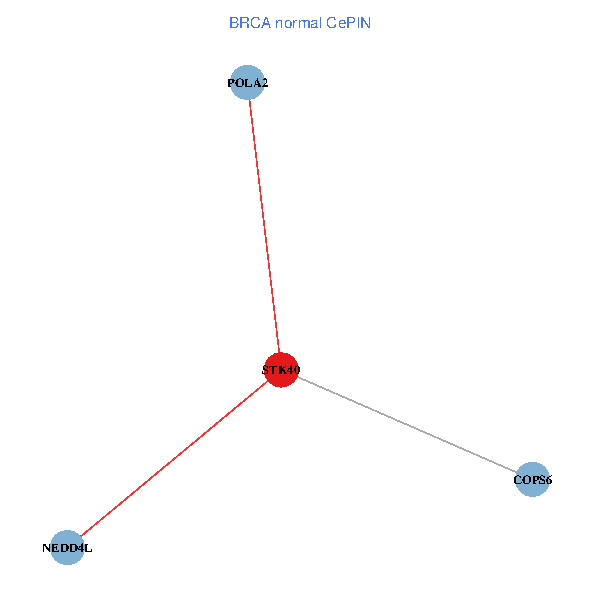
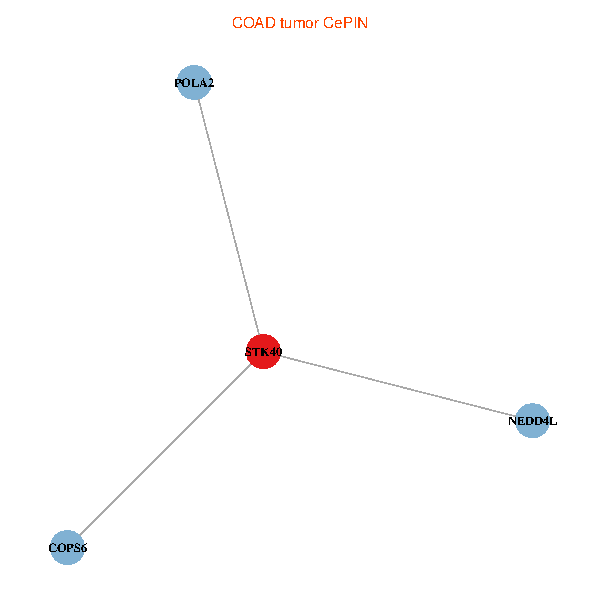
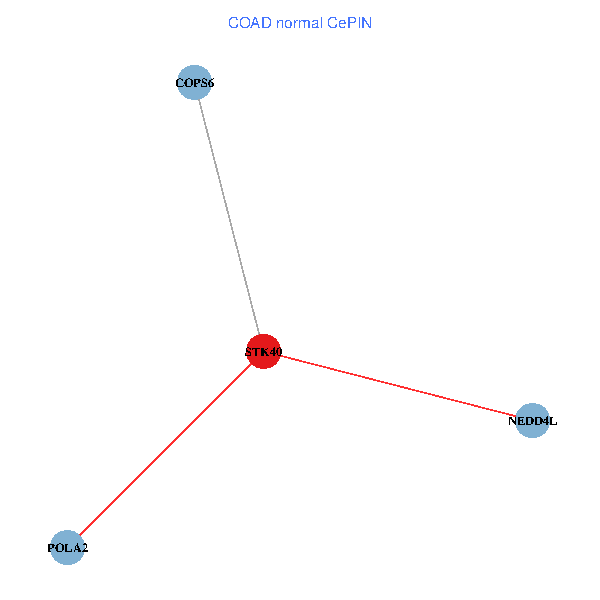
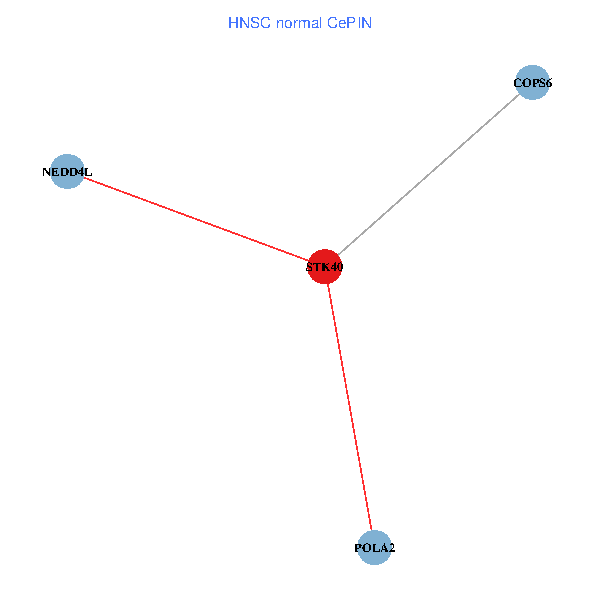
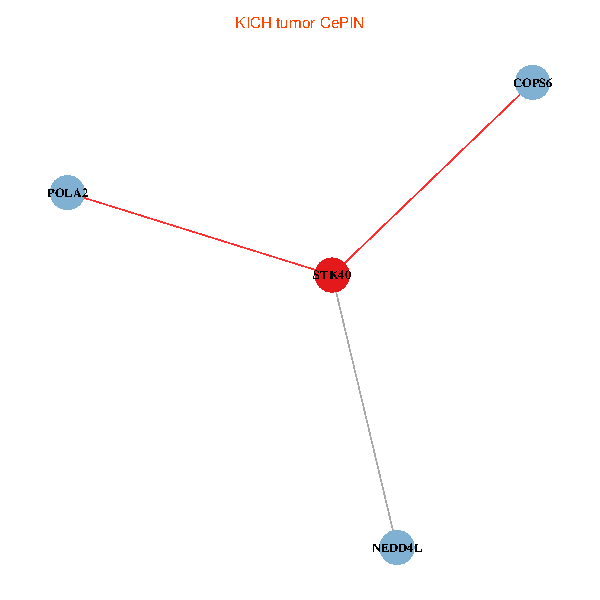
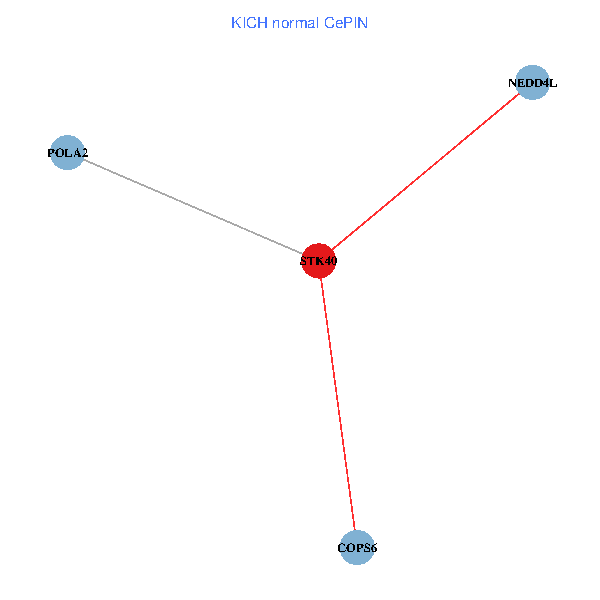
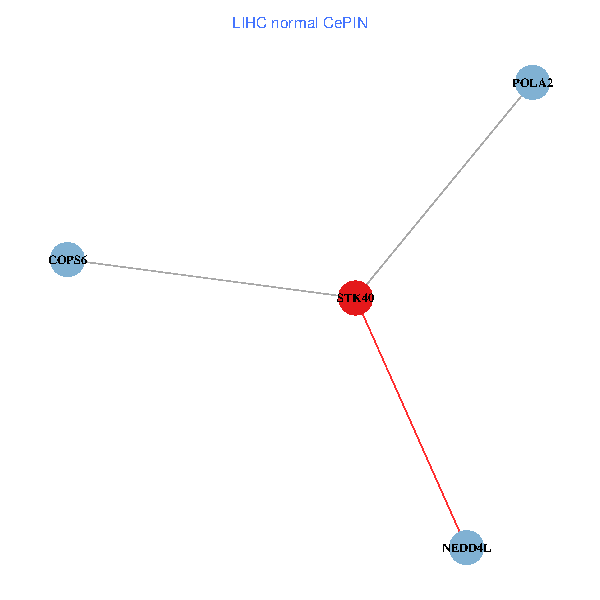
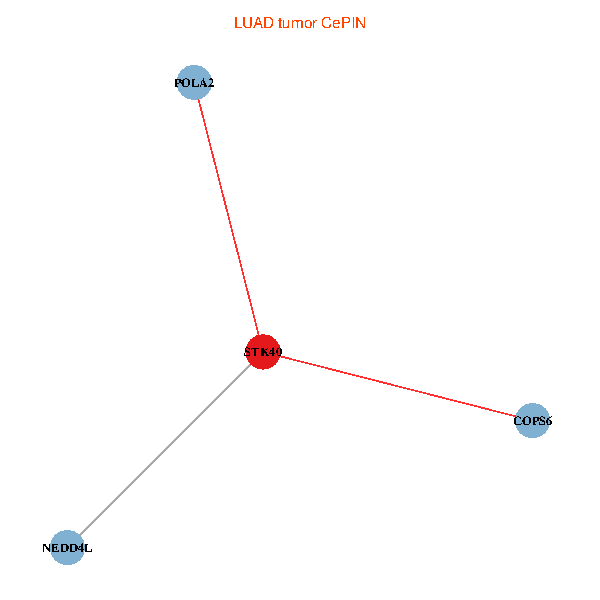
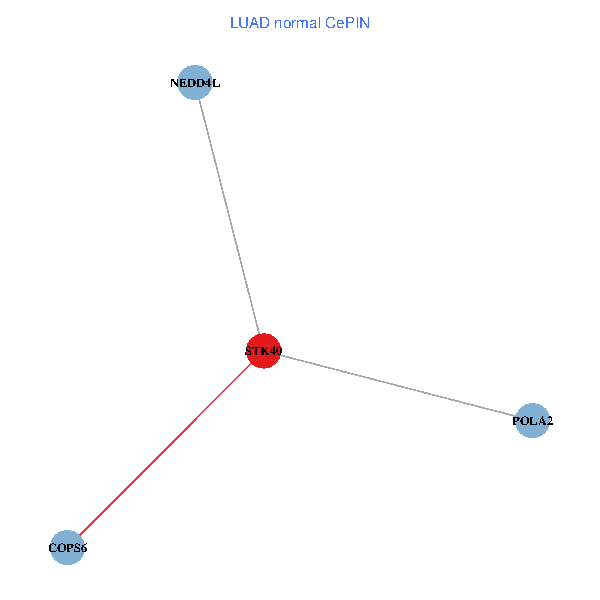
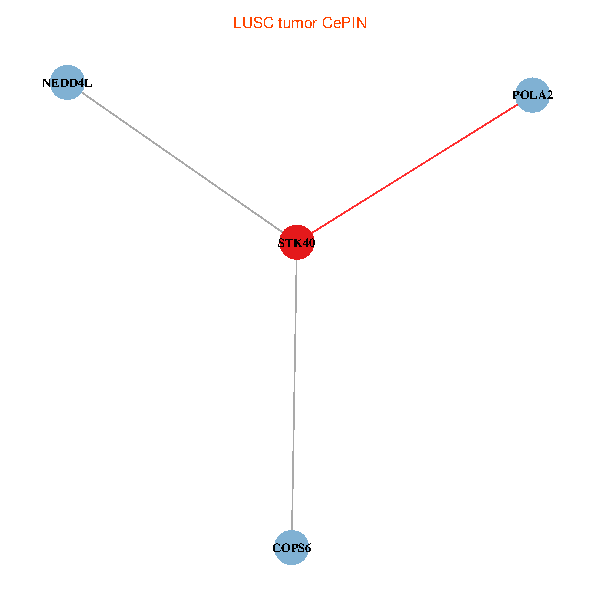
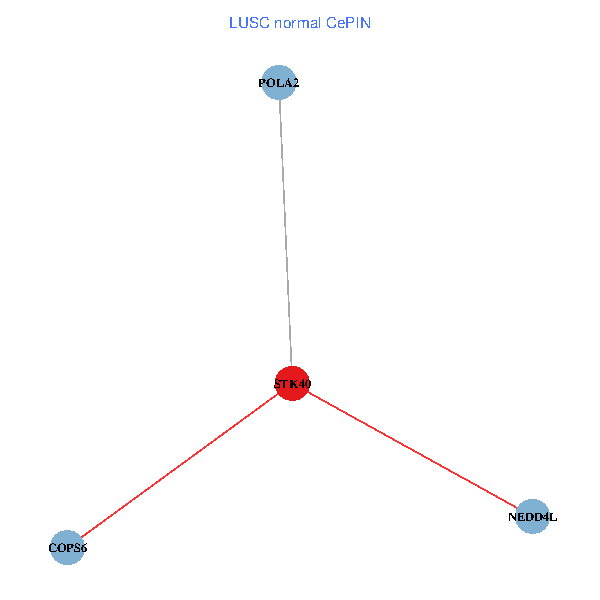
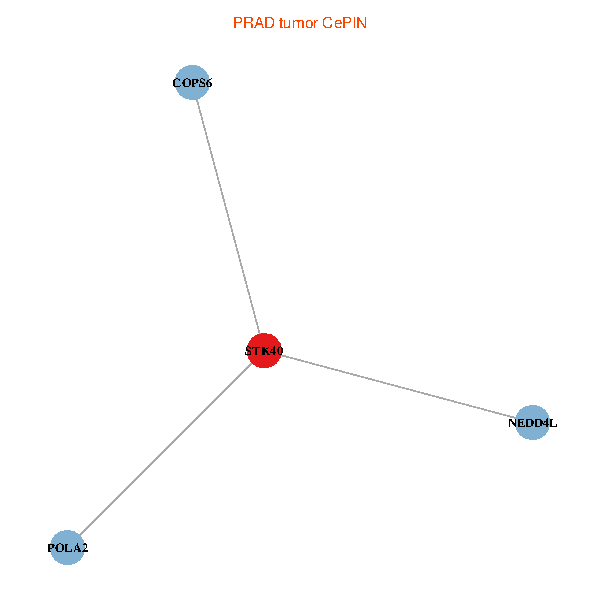
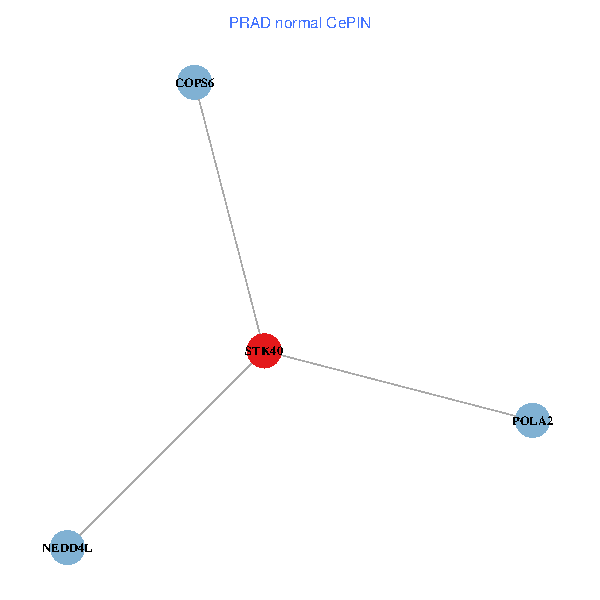
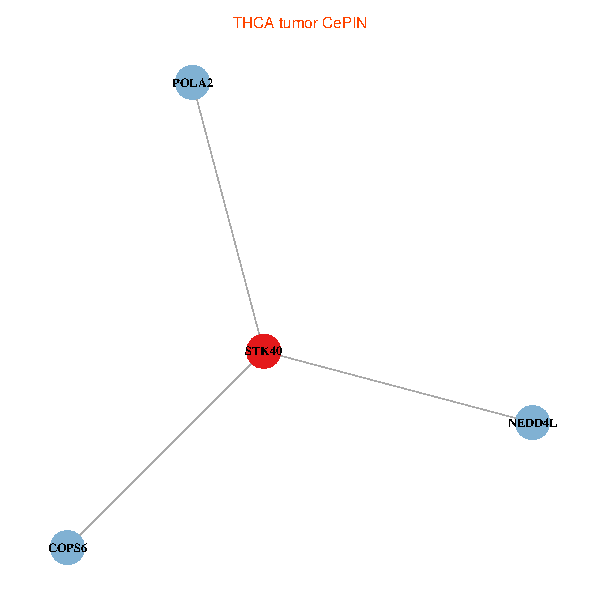
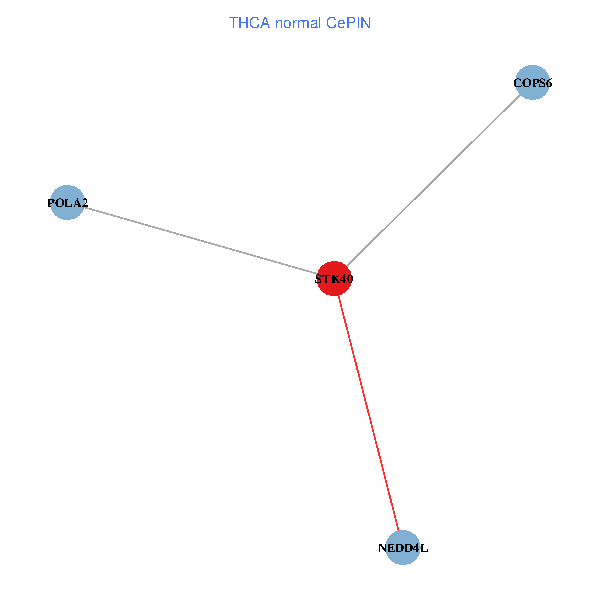
| Co-expressed gene networks based on protein-protein interaction data (CePIN) (TCGA IlluminaHiSeq_RNASeqV2, pan-cancer normalized log2(norm_counts+1) data, version 2016-08-16) (PINA2 ppi data) |
| BRCA (tumor) | BRCA (normal) |
| STK40, COPS6, POLA2, NEDD4L (tumor) | STK40, COPS6, POLA2, NEDD4L (normal) |
 |  |
| COAD (tumor) | COAD (normal) |
| STK40, COPS6, POLA2, NEDD4L (tumor) | STK40, COPS6, POLA2, NEDD4L (normal) |
 |  |
| HNSC (tumor) | HNSC (normal) |
| STK40, COPS6, POLA2, NEDD4L (tumor) | STK40, COPS6, POLA2, NEDD4L (normal) |
 |  |
| KICH (tumor) | KICH (normal) |
| STK40, COPS6, POLA2, NEDD4L (tumor) | STK40, COPS6, POLA2, NEDD4L (normal) |
 |  |
| KIRC (tumor) | KIRC (normal) |
| STK40, COPS6, POLA2, NEDD4L (tumor) | STK40, COPS6, POLA2, NEDD4L (normal) |
 |  |
| KIRP (tumor) | KIRP (normal) |
| STK40, COPS6, POLA2, NEDD4L (tumor) | STK40, COPS6, POLA2, NEDD4L (normal) |
 |  |
| LIHC (tumor) | LIHC (normal) |
| STK40, COPS6, POLA2, NEDD4L (tumor) | STK40, COPS6, POLA2, NEDD4L (normal) |
 |  |
| LUAD (tumor) | LUAD (normal) |
| STK40, COPS6, POLA2, NEDD4L (tumor) | STK40, COPS6, POLA2, NEDD4L (normal) |
 |  |
| LUSC (tumor) | LUSC (normal) |
| STK40, COPS6, POLA2, NEDD4L (tumor) | STK40, COPS6, POLA2, NEDD4L (normal) |
 |  |
| PRAD (tumor) | PRAD (normal) |
| STK40, COPS6, POLA2, NEDD4L (tumor) | STK40, COPS6, POLA2, NEDD4L (normal) |
 |  |
| STAD (tumor) | STAD (normal) |
| STK40, COPS6, POLA2, NEDD4L (tumor) | STK40, COPS6, POLA2, NEDD4L (normal) |
 |  |
| THCA (tumor) | THCA (normal) |
| STK40, COPS6, POLA2, NEDD4L (tumor) | STK40, COPS6, POLA2, NEDD4L (normal) |
 |  |
| Top |
| TissGeneProg for STK40 |
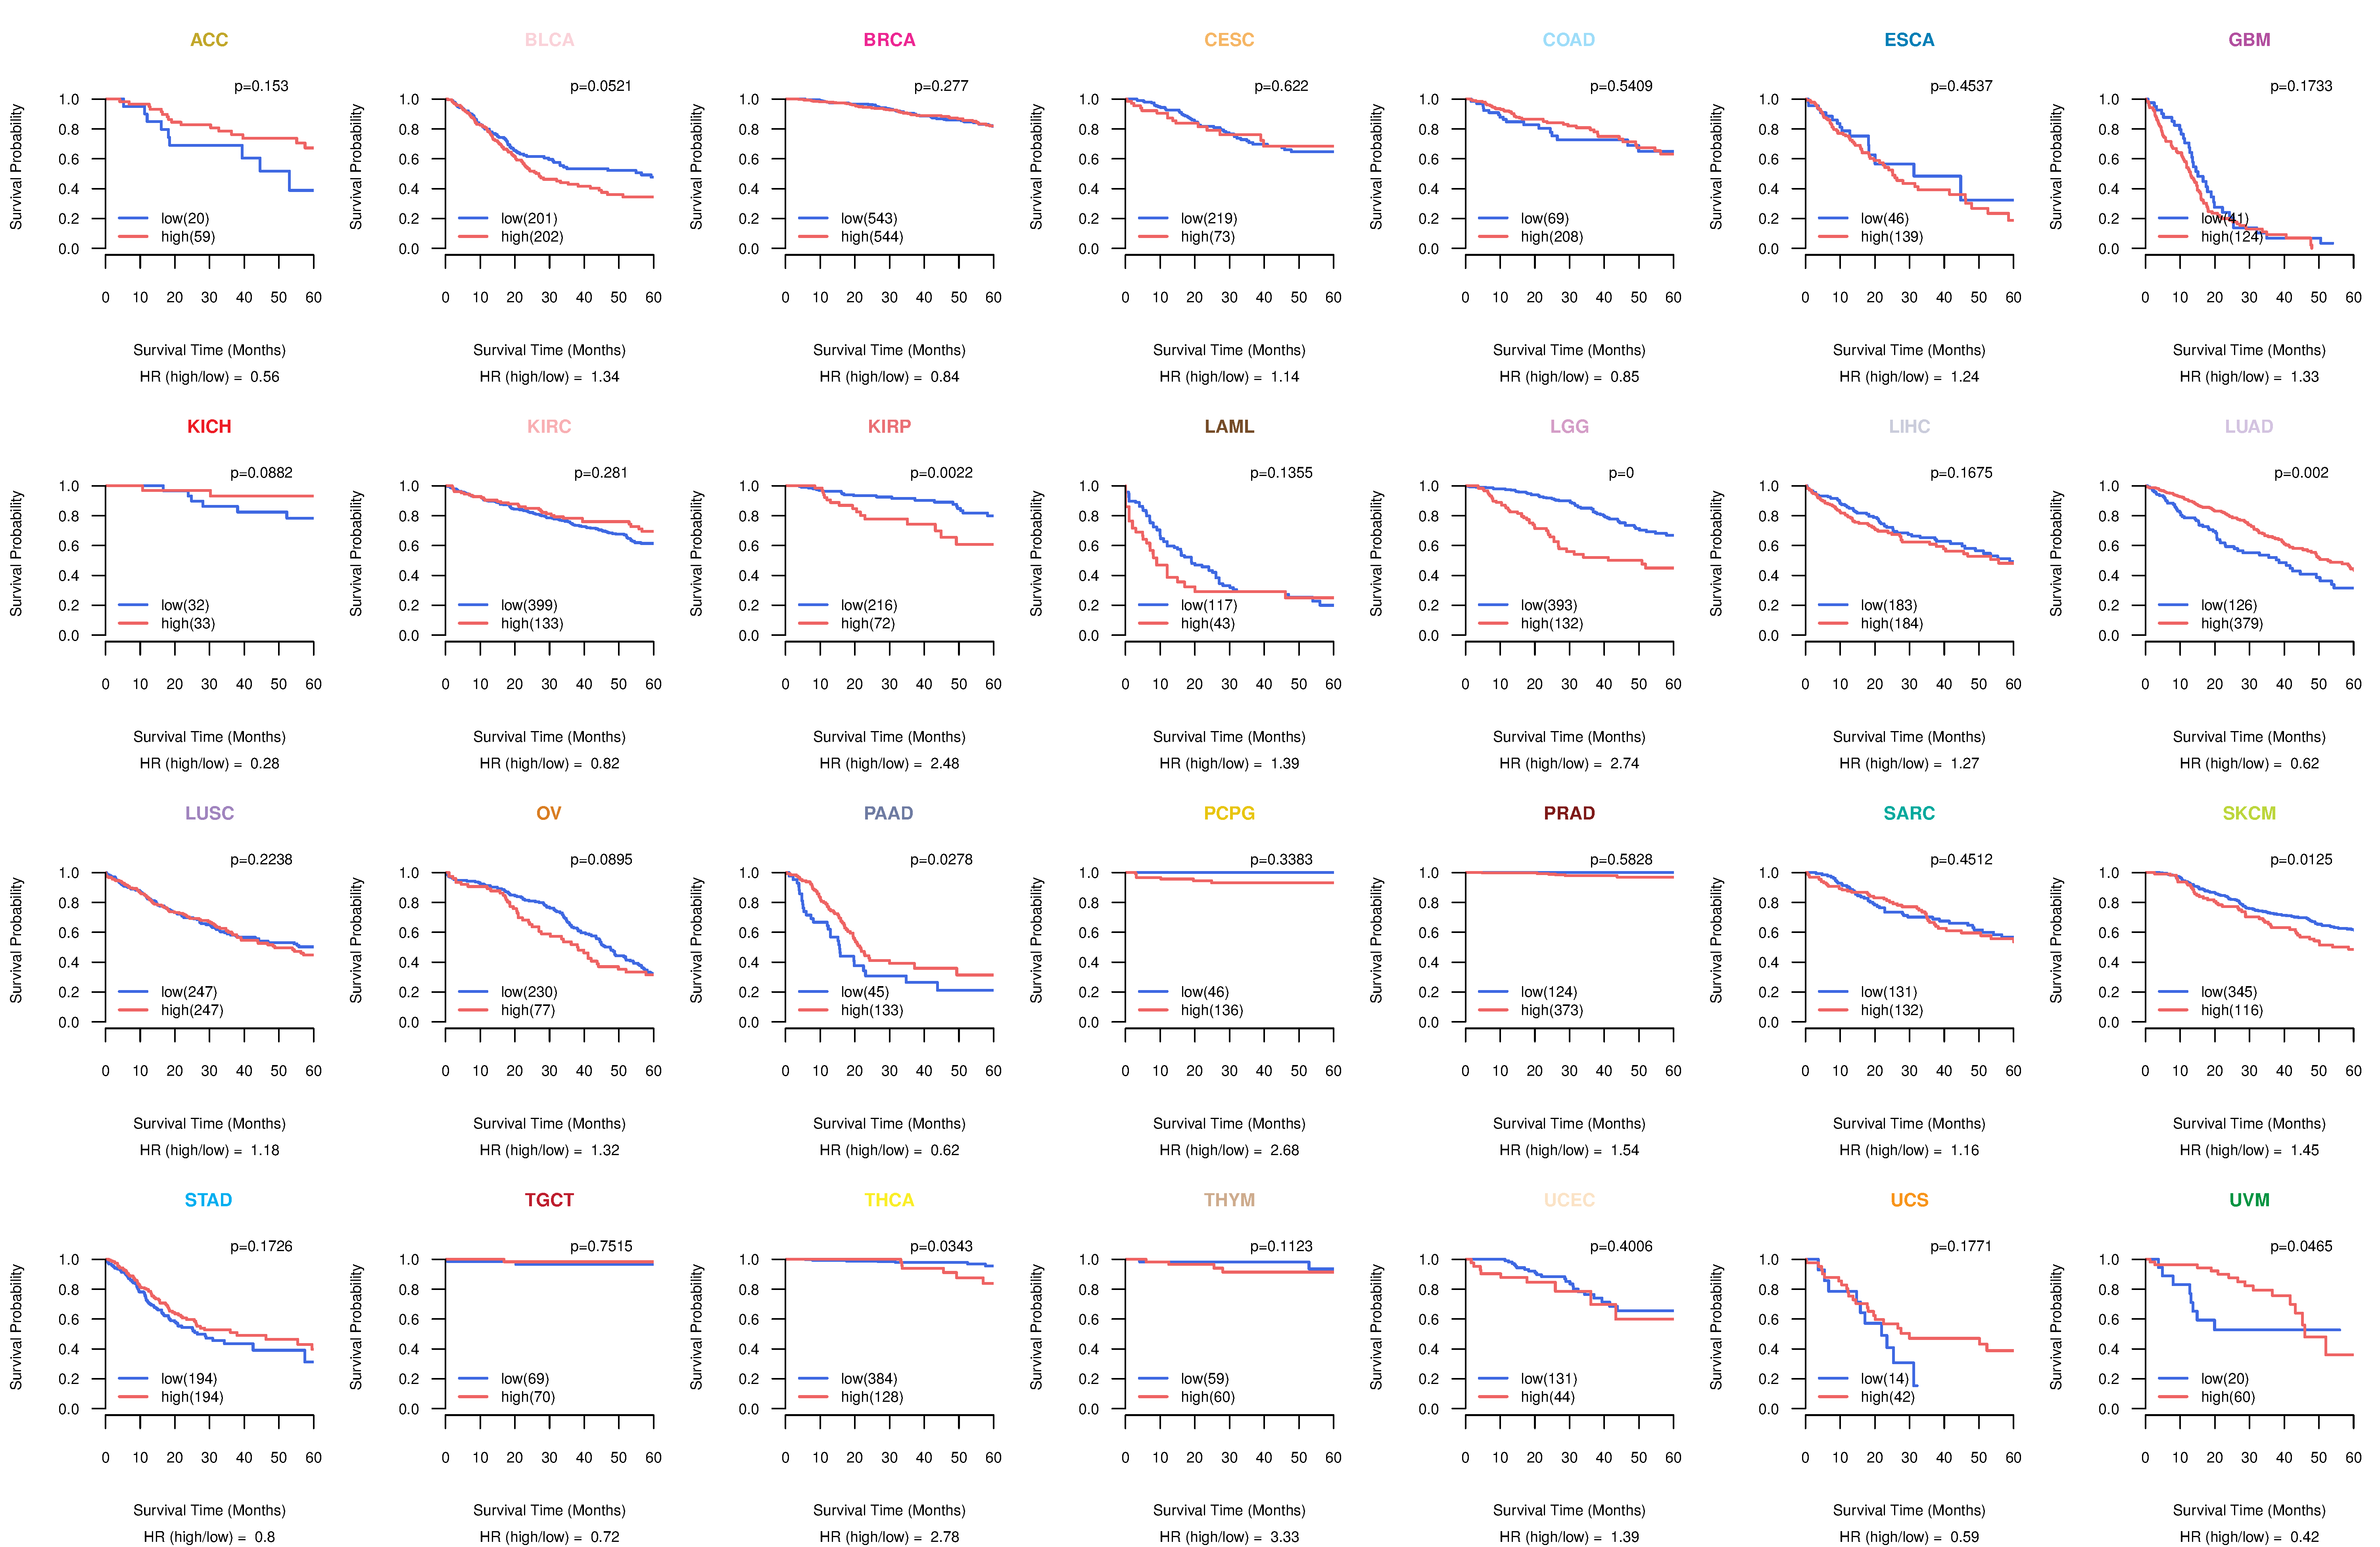
| Kaplan-Meier plots with logrank tests of overall survival (OS) using 28 cancer types (TCGA IlluminaHiSeq_RNASeqV2, pan-cancer normalized log2(norm_counts+1) data, version 2016-08-16) (TCGA clinicalMatrix, phenotype data, version 2016-04-27) * Click on the image to enlarge it in a new window. |
 |
| Kaplan-Meier plots with logrank test of relapse free survival (RFS) using 28 cancer types (TCGA IlluminaHiSeq_RNASeqV2, pan-cancer normalized log2(norm_counts+1) data, version 2016-08-16) (TCGA clinicalMatrix, phenotype data, version 2016-04-27) * Click on the image enlarge it in a new window. |
 |
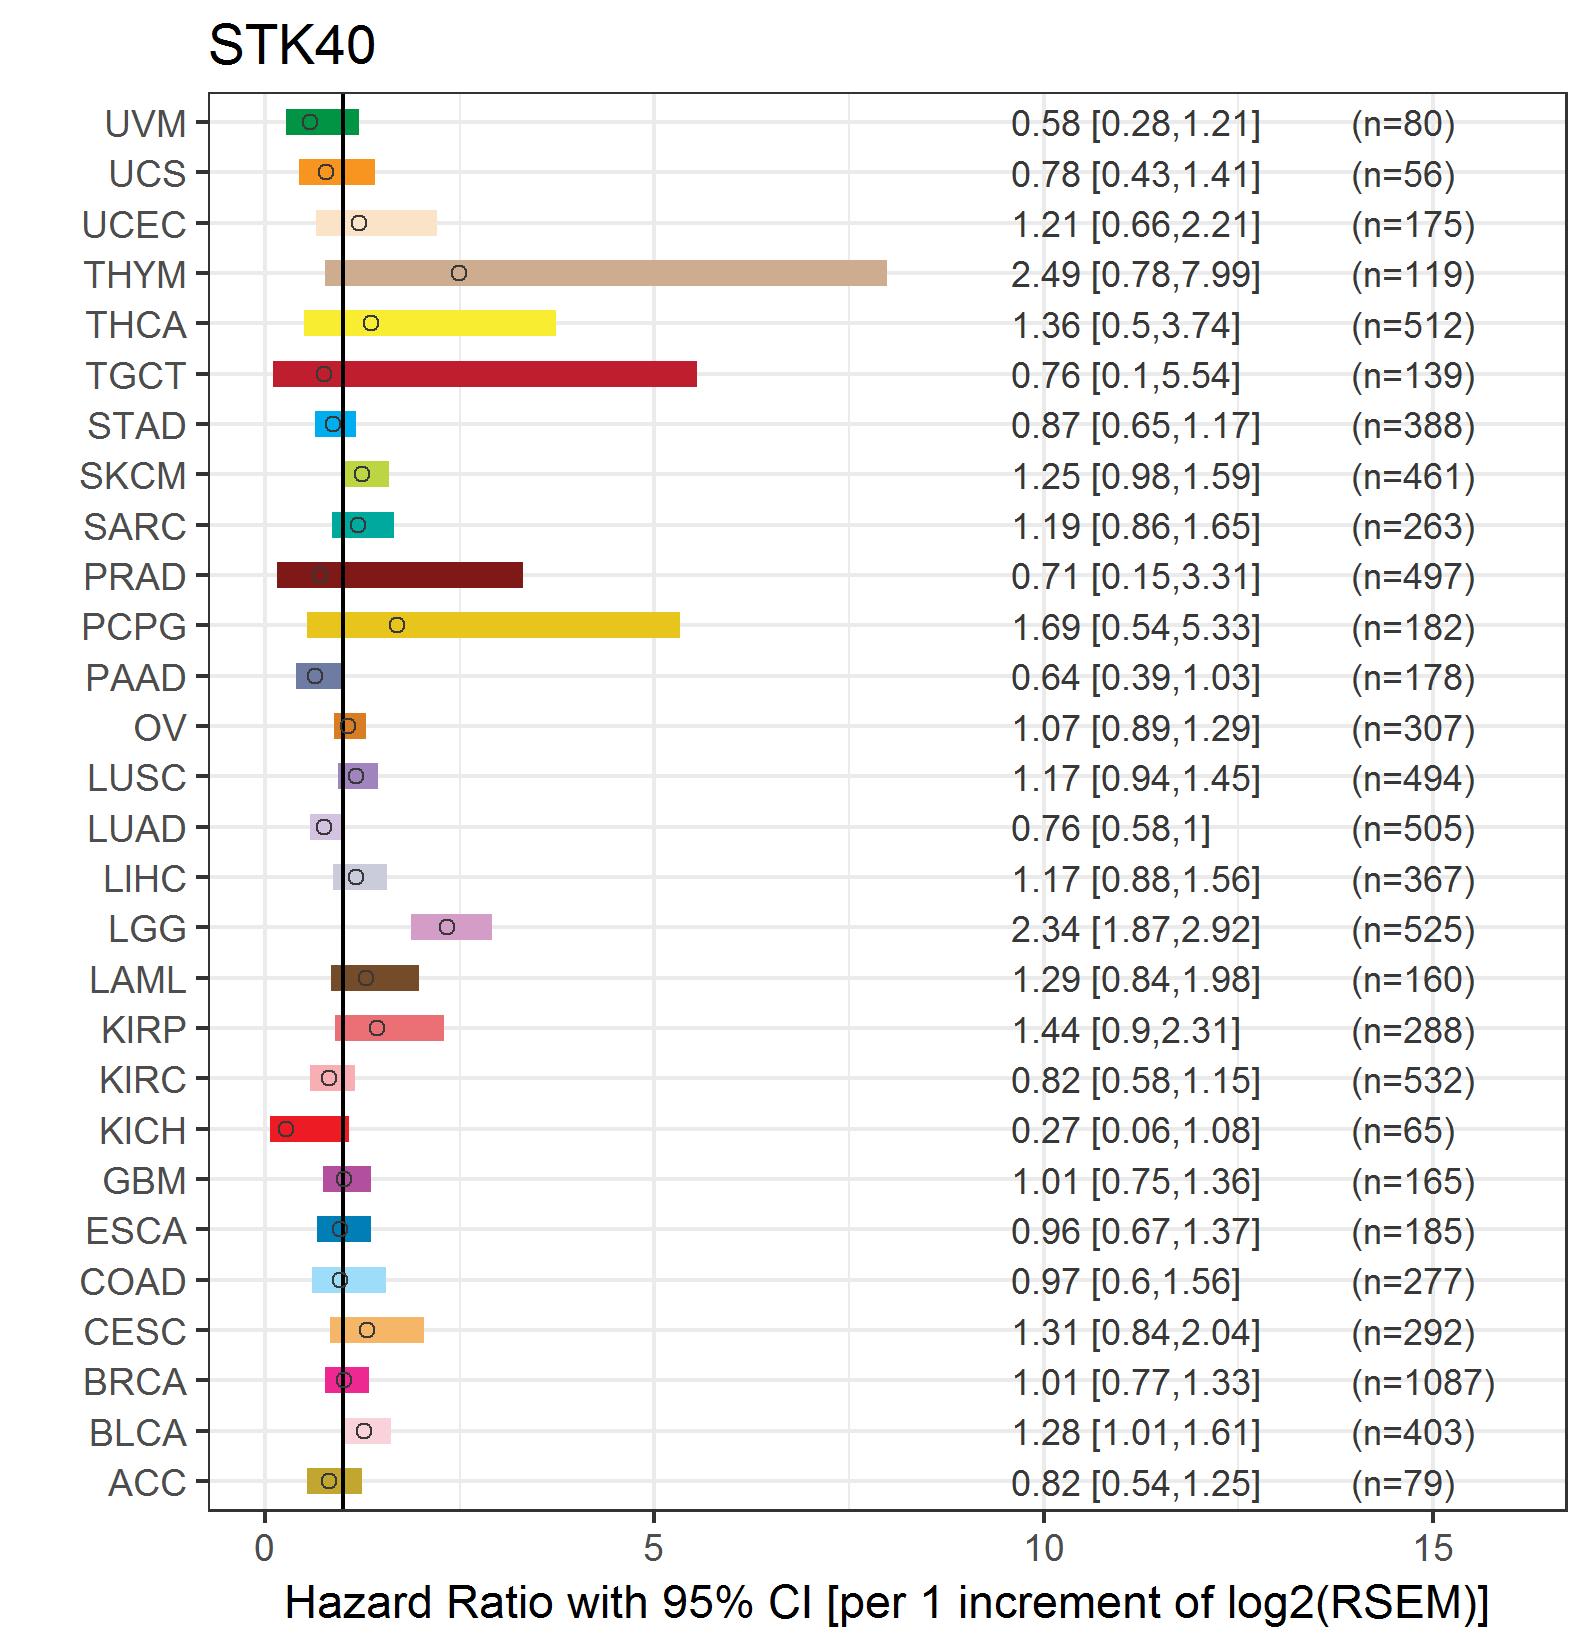
| Forest plot of Cox proportional hazard ratio (HR) and 95% CI of overall survival (OS) using 28 cancer types (TCGA IlluminaHiSeq_RNASeqV2, pan-cancer normalized log2(norm_counts+1) data, version 2016-08-16) (TCGA clinicalMatrix, phenotype data, version 2016-04-27) * Click on the image enlarge it in a new window. |
 |
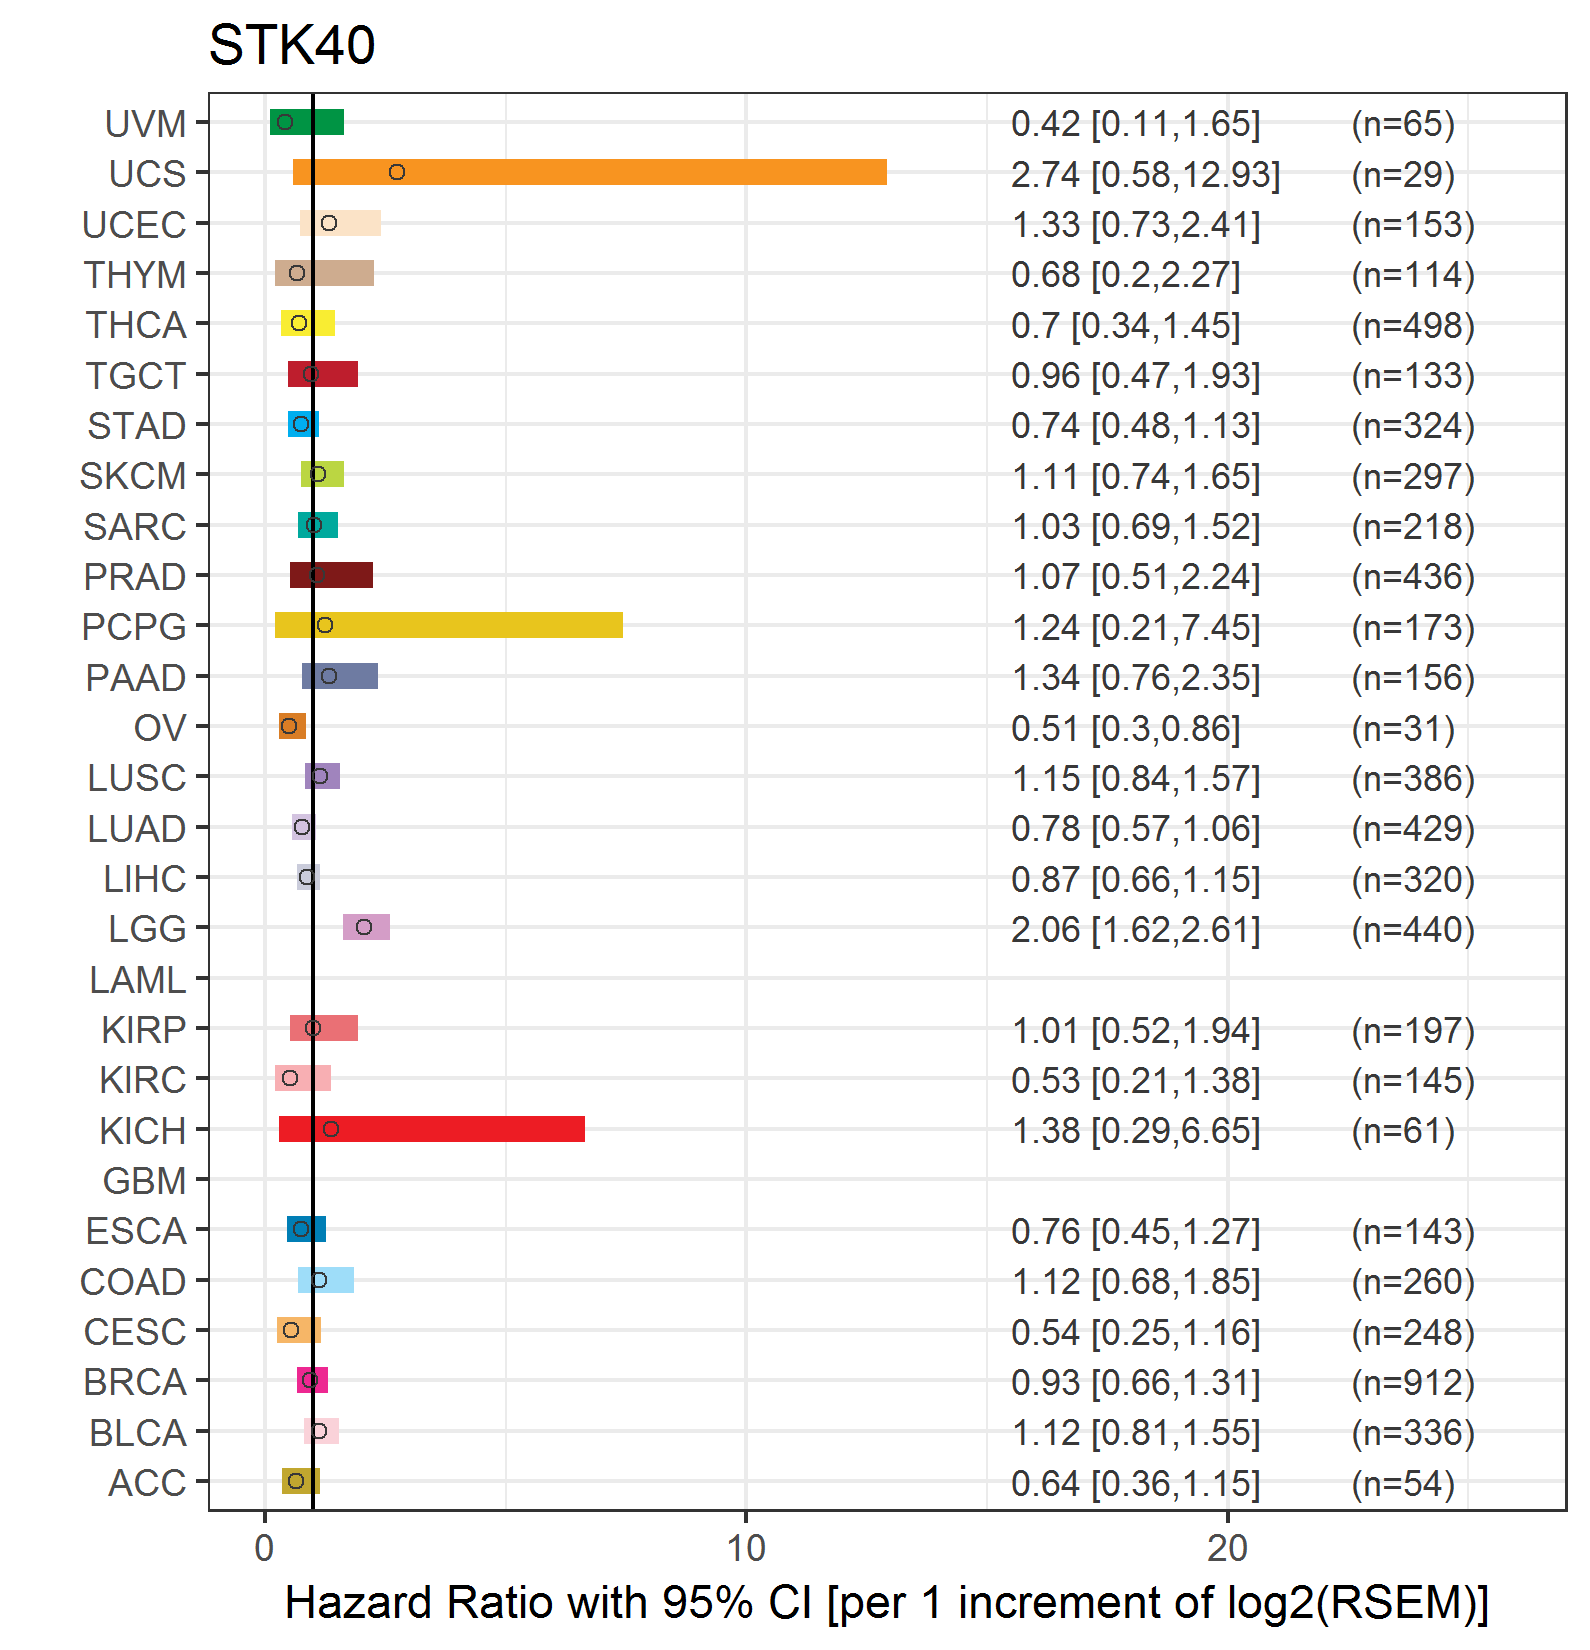
| Forest plot of Cox proportional hazard ratio (HR) and 95% CI of relapse free survival (RFS) using 28 cancer types (TCGA IlluminaHiSeq_RNASeqV2, pan-cancer normalized log2(norm_counts+1) data, version 2016-08-16) (TCGA clinicalMatrix, phenotype data, version 2016-04-27) * Click on the image enlarge it in a new window. |
 |
| Top |
| TissGeneClin for STK40 |
| TissGeneDrug for STK40 |
| Drug information targeting TissGene (DrugBank Version 5.0.6, 2017-04-01) |
| DrugBank ID | Drug name | Drug activity | Drug type | Drug status |
| Top |
| TissGeneDisease for STK40 |
| Disease information associated with TissGene (DisGeNet, 2016-06-01) |
| Disease ID | Disease name | # pubmeds | Source |
| umls:C0033860 | Psoriasis | 1 | BeFree |
|
Copyright 2016-Present - The University of Texas Health Science Center at Houston (UTHealth) Web File Viewing | How to Report, Fraud, Waste and Abuse | State of Texas | Statewide Search | Texas Homeland Security | Site Policies |