 |
| |
| |
| |
| |
| |
| |
|

| TissGeneSummary for FCAMR |
 Gene summary Gene summary |
| Basic gene information | Gene symbol | FCAMR |
| Gene name | Fc receptor, IgA, IgM, high affinity | |
| Synonyms | CD351|FCA/MR | |
| Cytomap | UCSC genome browser: 1q32.1 | |
| Type of gene | protein-coding | |
| RefGenes | NM_001122980.1, NM_001122979.2,NM_001170631.1,NM_032029.4, | |
| Description | Fc alpha/mu receptorhigh affinity immunoglobulin alpha and immunoglobulin mu Fc receptorimmunity related factorreceptor for Fc fragment of IgA and IgM | |
| Modification date | 20141207 | |
| dbXrefs | MIM : 605484 | |
| HGNC : HGNC | ||
| Ensembl : ENSG00000162897 | ||
| HPRD : 12020 | ||
| Vega : OTTHUMG00000036579 | ||
| Protein | UniProt: go to UniProt's Cross Reference DB Table | |
| Expression | CleanEX: HS_FCAMR | |
| BioGPS: 83953 | ||
| Pathway | NCI Pathway Interaction Database: FCAMR | |
| KEGG: FCAMR | ||
| REACTOME: FCAMR | ||
| Pathway Commons: FCAMR | ||
| Context | iHOP: FCAMR | |
| ligand binding site mutation search in PubMed: FCAMR | ||
| UCL Cancer Institute: FCAMR | ||
| Assigned class in TissGDB* | C | |
| Included tissue-specific gene expression resources | TiGER,GTEx | |
| Specific-tissues in normal samples (assigned by TissGDB using HPA, TiGER, and GTEx) | Kidney | |
| Cancer types related to the specific-tissues in cancer samples (assigned by TissGDB using TCGA) | KIRC,KIRP,KICH | |
| Reference showing the relevant tissue of FCAMR | ||
| Description by TissGene annotations | ||
| * Class A consists of genes with literature evidence and is part of the cTissGenes. Class B consists of only cTissGenes without additional evidence. The remaining genes belong to Class C. |
| Gene ontology having evidence of Inferred from Direct Assay (IDA) from Entrez |
| GO ID | GO term | PubMed ID |
| Top |
| TissGeneExp for FCAMR |
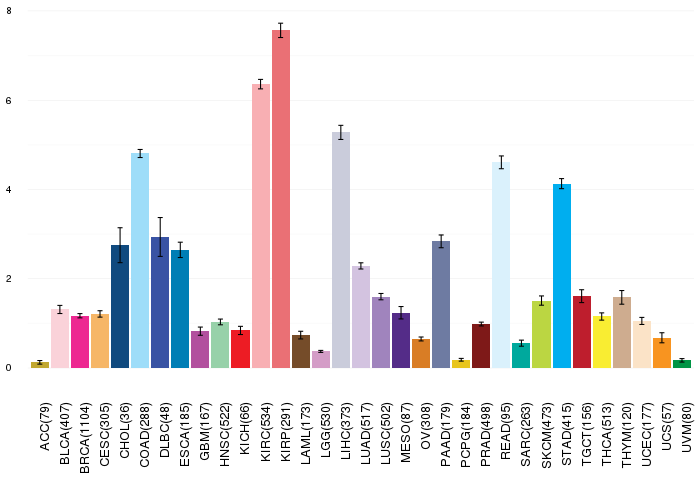
| Gene expressions across 28 cancer types (X-axis: cancer type and Y-axis: log2(norm_counts+1)) (TCGA IlluminaHiSeq_RNASeqV2, pan-cancer normalized log2(norm_counts+1) data, version 2016-08-16) |
 |
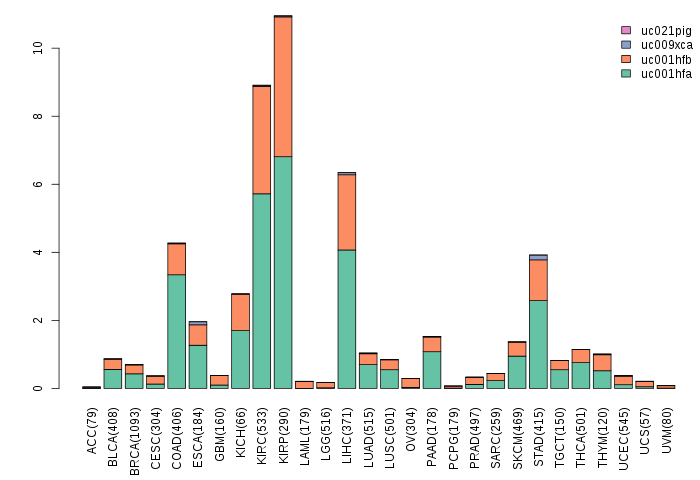
| Gene isoform expressions across 28 cancer types (X-axis: cancer type and Y-axis: log2(norm_counts+1)) (TCGA pan-cancer tcga_rsem_isoform_tpm, version 2016-09-01) |
 |
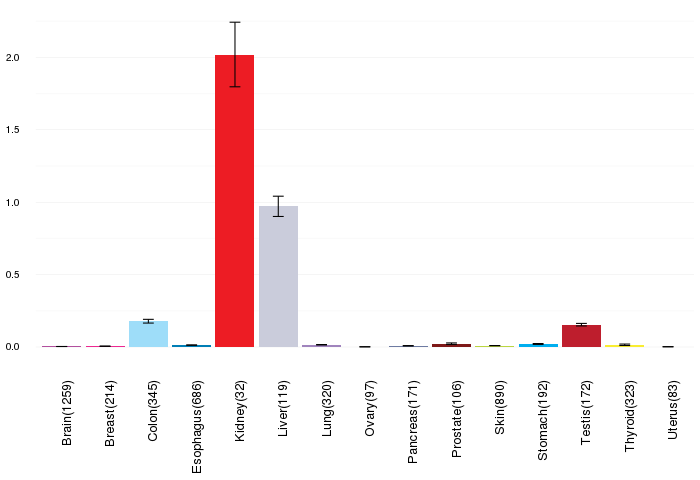
| Gene expressions across normal tissues of GTEx data (GTEx GTEx_Analysis_v6_RNA-seq_RNA-SeQCv1.1.8_gene_rpkm.gct) - Here, we shows the matched tissue types only among our 28 cancer types. |
 |
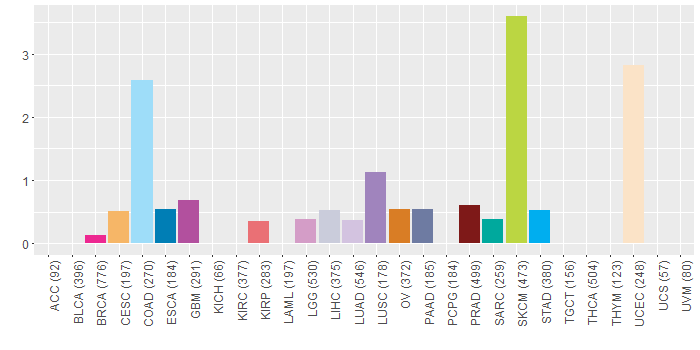
| Different expressions across 14 cancer types with more than 10 samples between matched tumors and normals (X-axis: cancer type and Y-axis: log2(norm_counts+1)) (TCGA IlluminaHiSeq_RNASeqV2, pan-cancer normalized log2(norm_counts+1) data, version 2016-08-16) |
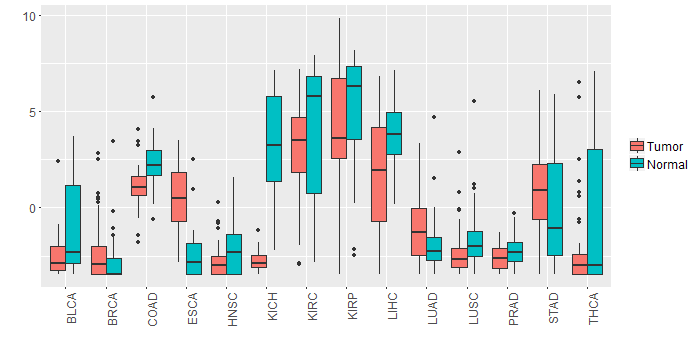 |
| - Significantly differentially expressed cancer types and information. (|Fold change|>1 and FDR<0.05) |
| Cancer type | Mean(exp) in tumor | Mean(exp) in matched normal | Log2FC | P-val. | FDR |
| LIHC | 1.533612886 | 3.826764886 | -2.293152 | 8.56E-06 | 3.68E-05 |
| KICH | -2.759705114 | 3.139538886 | -5.899244 | 3.87E-10 | 2.70E-09 |
| THCA | -2.306004369 | -0.833541657 | -1.472462712 | 0.00568 | 0.011516044 |
| COAD | 1.103245501 | 2.267291655 | -1.164046154 | 0.00252 | 0.006549609 |
| Top |
| TissGene-miRNA for FCAMR |
| Significantly anti-correlated miRNAs of TissGene across 28 cancer types (Gene-miRNA relations from TargetScanHuman Relsease 7.1, Conserved_Site_Context_Scores.txt.zip, 06.01.2016) (TCGA IlluminaHiSeq_miRNASeq, log2(RPM+1) data, version 2016-11-21) (TCGA IlluminaHiSeq_RNASeqV2, log2(normalized_count+1) data, version 2016-08-16) (Spearman’s Rank Correlation (p-value<0.05 and coefficient<-0.25)) |
| Cancer type | miRNA id | miRNA accession | P-val. | Coeff. | # samples |
| Top |
| TissGeneMut for FCAMR |
| TissGeneSNV for FCAMR |
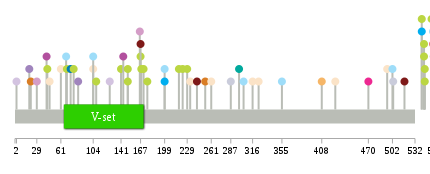
| nsSNV counts per each loci. Different colors of circles represent different cancer types. Circle size denotes number of samples. (TCGA somatic mutation (SNPs and small INDELs) data, version 2016-04-25) * Click on the image to enlarge it in a new window. |
 |
 |
| Somatic nucleotide variants of TissGene across 28 cancer types (X-axis: cancer type and Y-axis: % of mutated samples) The numbers in parentheses are numbers of samples with mutation (nsSNVs). (TCGA somatic mutation (SNPs and small INDELs) data, version 2016-04-25) |
 |
| - nsSNVs sorted by frequency. |
| AAchange | Cancer type | # samples |
| p.A261S | UCEC | 1 |
| p.A298E | SARC | 1 |
| p.L557F | PAAD | 1 |
| p.R167H | PRAD | 1 |
| p.A104V | COAD | 1 |
| p.P78S | SKCM | 1 |
| p.M556K | KIRP | 1 |
| p.R144H | GBM | 1 |
| p.G199D | STAD | 1 |
| p.W150X | SKCM | 1 |
| p.T502A | COAD | 1 |
| p.M556K | HNSC | 1 |
| p.H68P | COAD | 1 |
| p.G199S | COAD | 1 |
| p.P176S | SKCM | 1 |
| p.T287A | LIHC | 1 |
| p.K518R | PRAD | 1 |
| p.Q545X | SKCM | 1 |
| p.E324* | UCEC | 1 |
| p.D168N | SKCM | 1 |
| p.P229L | SKCM | 1 |
| p.A61T | UCEC | 1 |
| p.E74G | ESCA | 1 |
| p.E541G | STAD | 1 |
| p.Q126* | LUAD | 1 |
| p.R40K | DLBC | 1 |
| p.R167C | SKCM | 1 |
| p.S108L | SKCM | 1 |
| p.L242S | PRAD | 1 |
| p.P544T | SKCM | 1 |
| p.E408Q | CESC | 1 |
| p.V218I | SKCM | 1 |
| p.A42V | GBM | 1 |
| p.M46I | UCEC | 1 |
| p.S233Y | UCEC | 1 |
| p.W150* | SKCM | 1 |
| p.Q545* | SKCM | 1 |
| p.D559N | SKCM | 1 |
| p.Y141C | SKCM | 1 |
| p.W426R | UCEC | 1 |
| p.V182L | HNSC | 1 |
| p.P544L | SKCM | 1 |
| p.A104T | UCEC | 1 |
| p.G253* | OV | 1 |
| p.S316N | UCEC | 1 |
| p.S561Y | LGG | 1 |
| p.L470F | BRCA | 1 |
| p.G19E | LUSC | 1 |
| p.M223I | SKCM | 1 |
| p.Y166H | LGG | 1 |
| p.R84L | LUSC | 1 |
| p.P69S | SKCM | 1 |
| p.G43R | SKCM | 1 |
| p.R495Q | UCEC | 1 |
| p.A29T | LGG | 1 |
| p.P355S | READ | 1 |
| p.A304T | COAD | 1 |
| p.P355S | COAD | 1 |
| p.R169C | HNSC | 1 |
| p.E541K | SKCM | 1 |
| p.M556I | COAD | 1 |
| p.R554K | SKCM | 1 |
| p.D2N | LUAD | 1 |
| p.A171V | SKCM | 1 |
| p.M503V | LIHC | 1 |
| p.E21Q | OV | 1 |
| Top |
| TissGeneCNV for FCAMR |
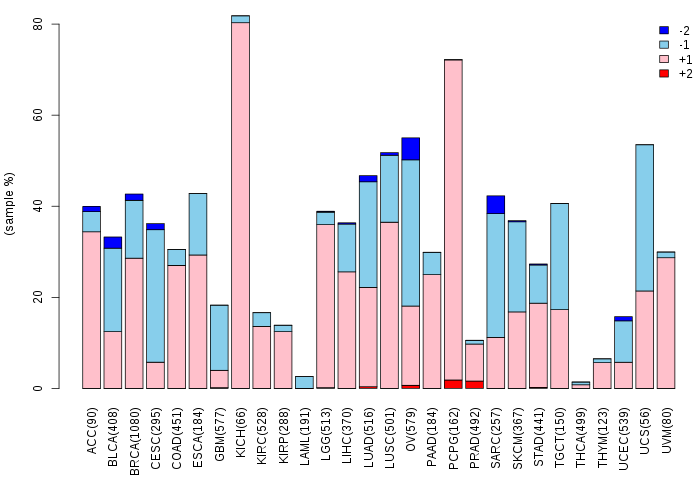
| Copy number variations of TissGene across 28 cancer types (X-axis: cancer type and Y-axis: % of CNV samples) (TCGA Gistic2_CopyNumber_Gistic2_all_data_by_genes, Gistic2 copy number data, version 2016-08-16) |
 |
| Top |
| TissGeneFusions for FCAMR |
| Fusion genes including TissGene (ChimerDB 3.0, 2016-12-01 and TCGA fusion Portal 2015-12-01) |
| Database | Src | Cancer type | Sample | Fusion gene | ORF | 5'-gene BP | 3'-gene BP |
| TCGAfusionPortal | PRADA | BRCA | TCGA-AR-A0U4-01A | PDZRN3-FCAMR | CDS-5UTR | Chr3:73651505 | Chr1:207143565 |
| Top |
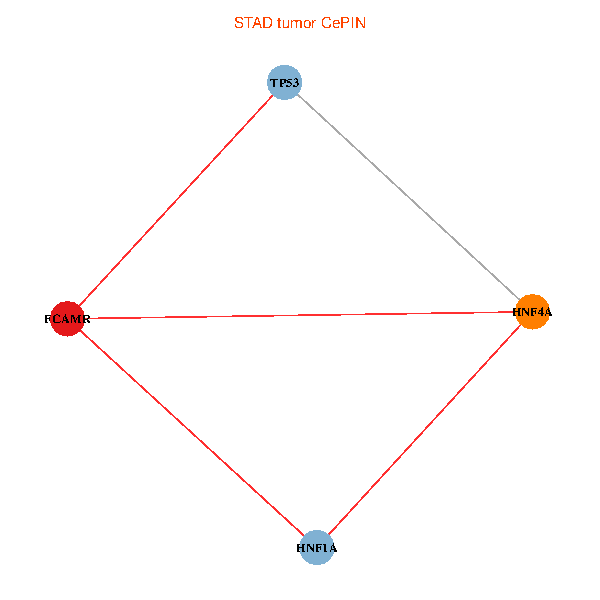
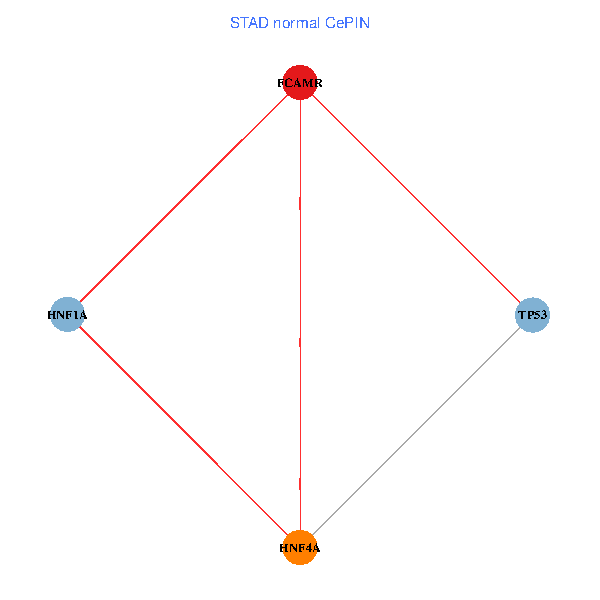
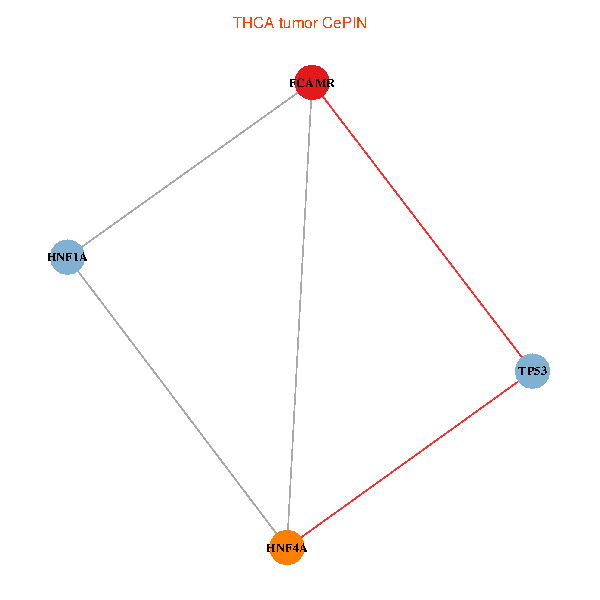
| TissGeneNet for FCAMR |
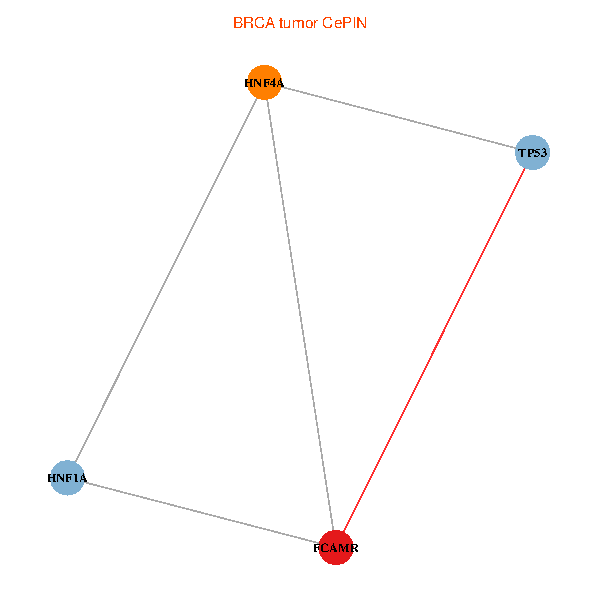
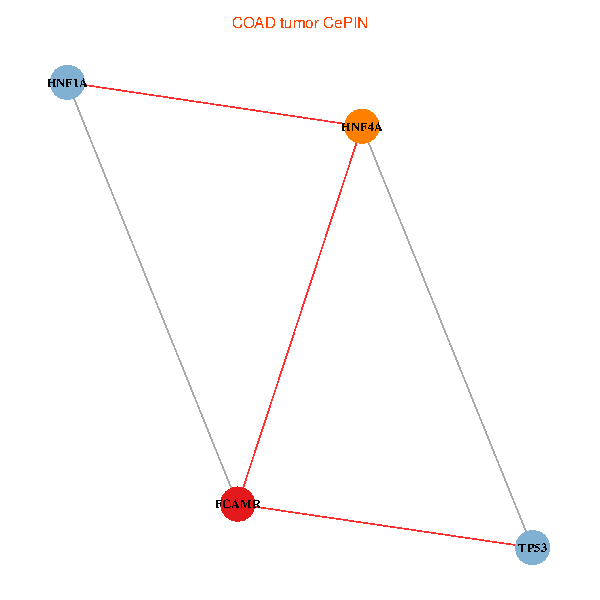
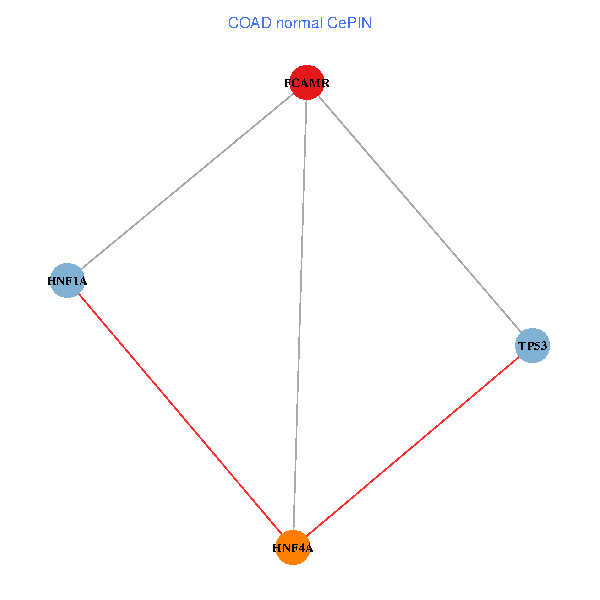
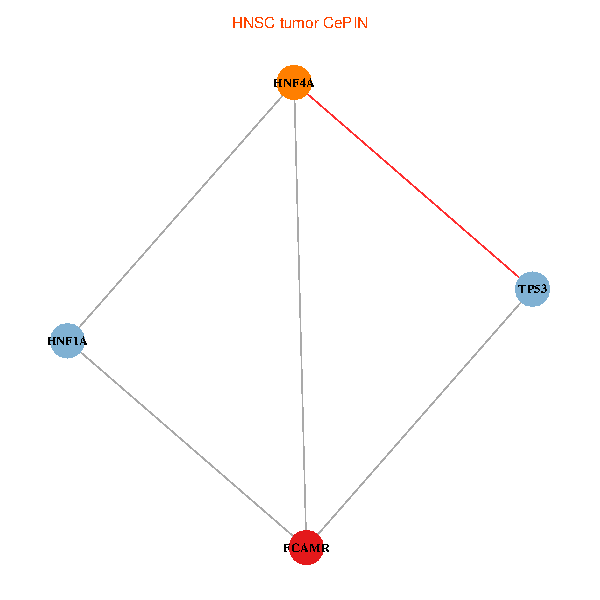
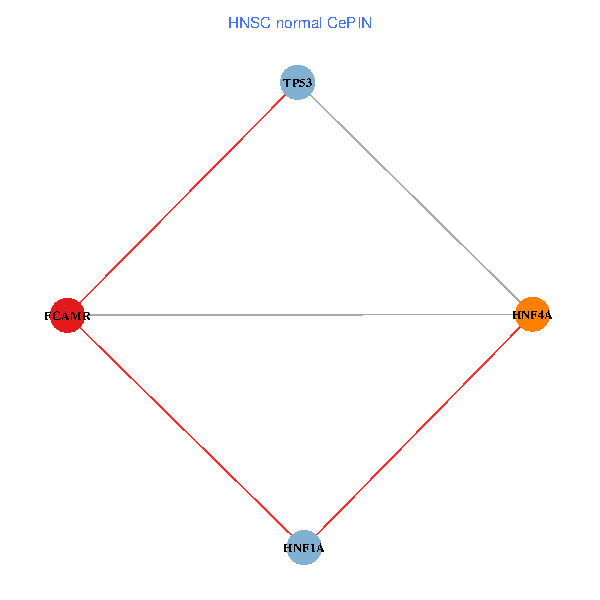
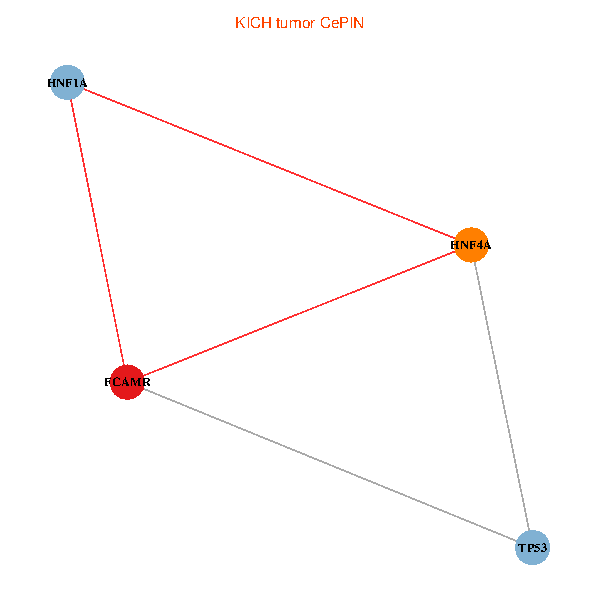
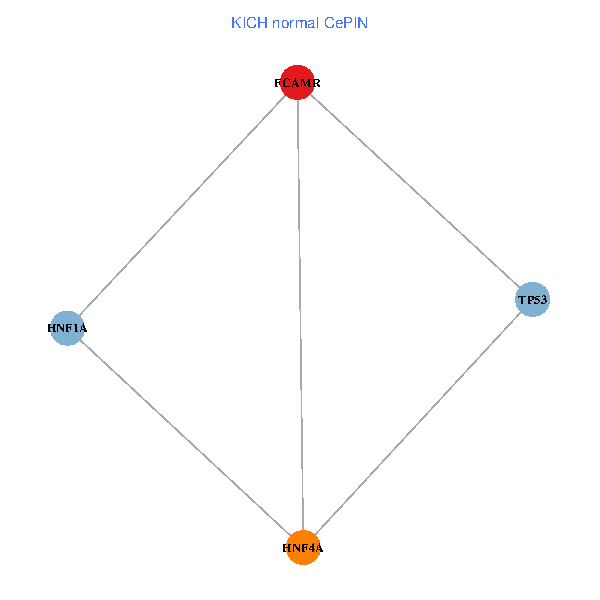
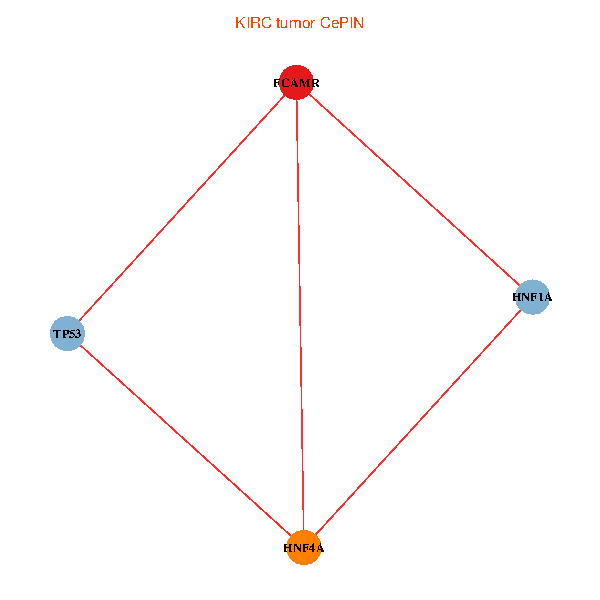
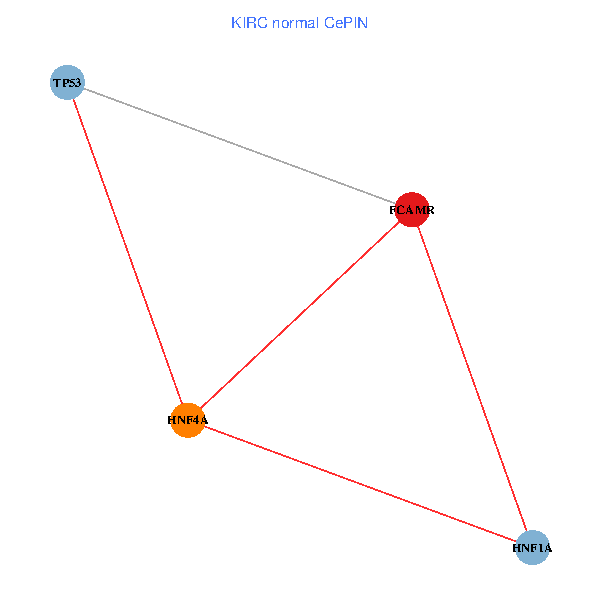
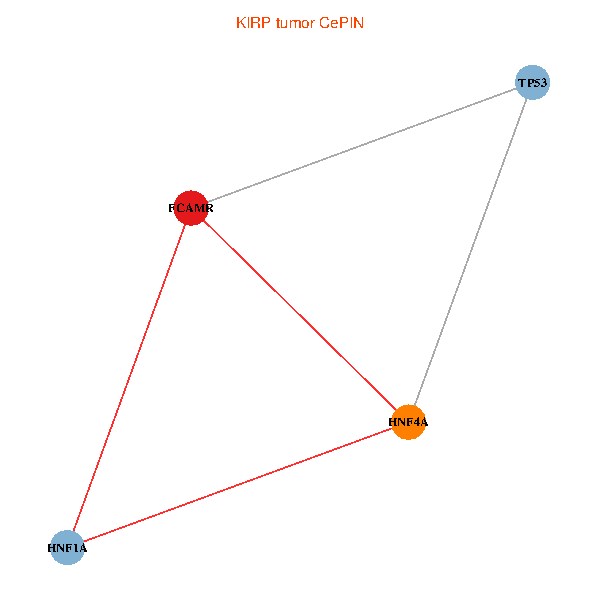
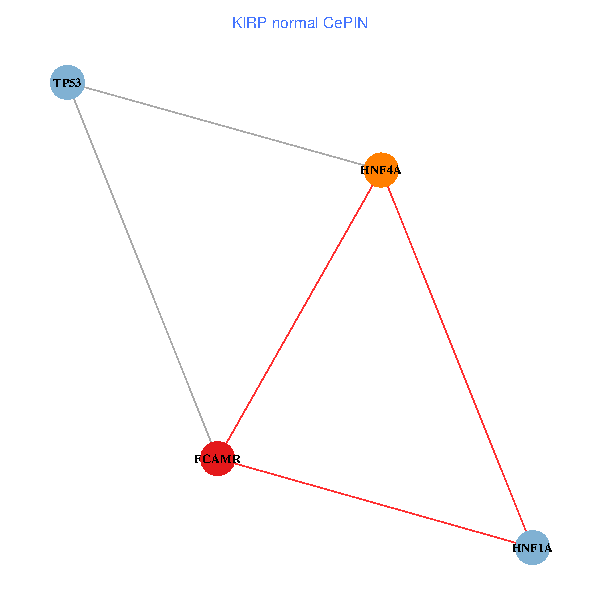
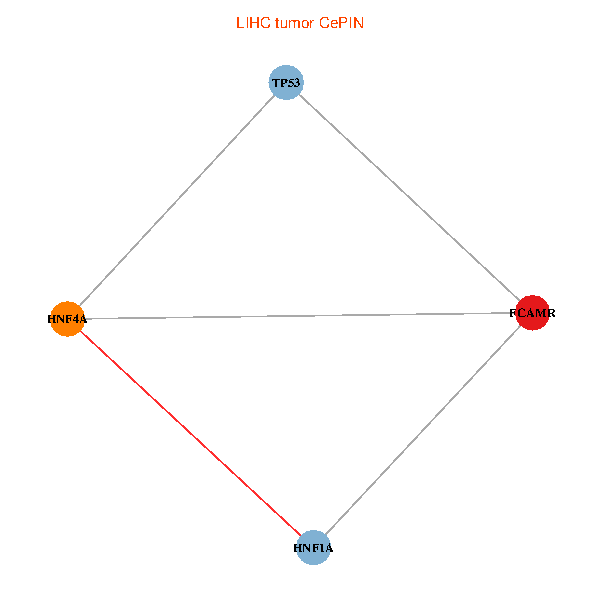
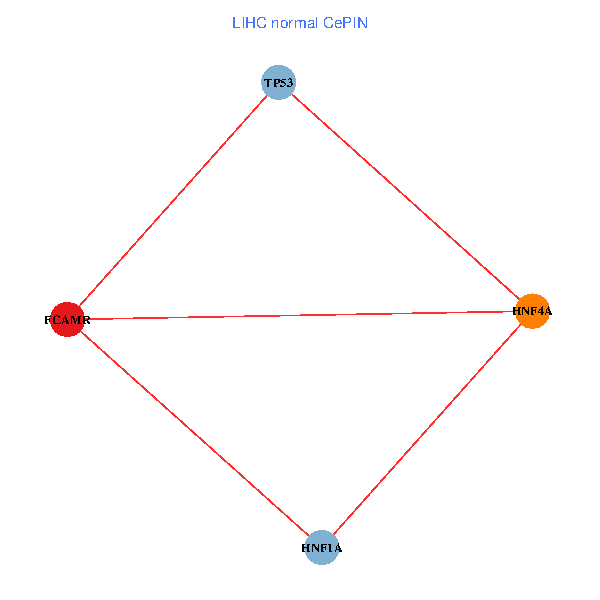
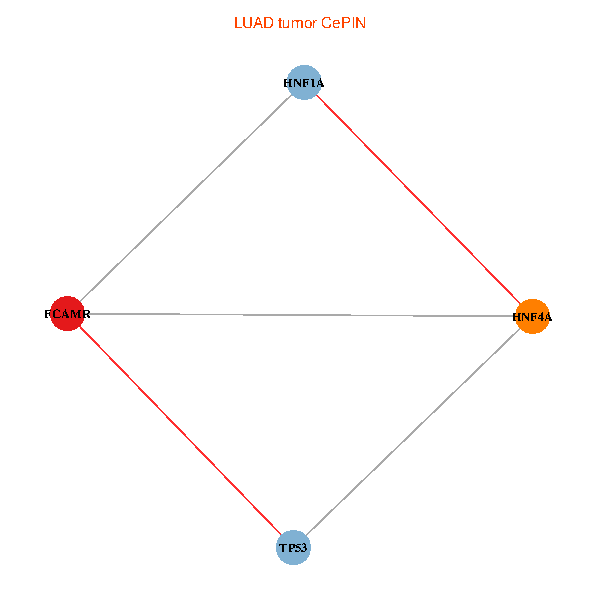
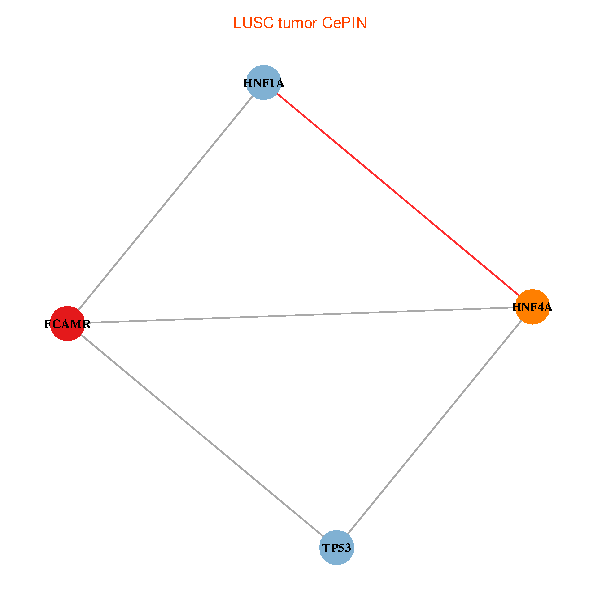
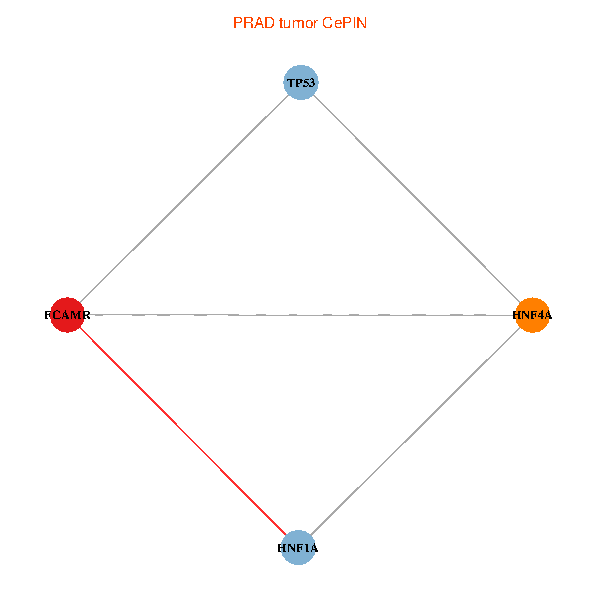
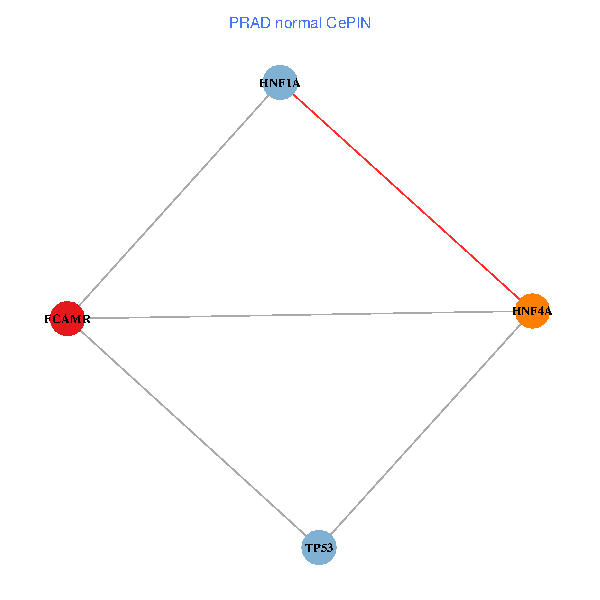
| Co-expressed gene networks based on protein-protein interaction data (CePIN) (TCGA IlluminaHiSeq_RNASeqV2, pan-cancer normalized log2(norm_counts+1) data, version 2016-08-16) (PINA2 ppi data) |
| BRCA (tumor) | BRCA (normal) |
| FCAMR, TP53, HNF4A, HNF1A (tumor) | FCAMR, TP53, HNF4A, HNF1A (normal) |
 |  |
| COAD (tumor) | COAD (normal) |
| FCAMR, TP53, HNF4A, HNF1A (tumor) | FCAMR, TP53, HNF4A, HNF1A (normal) |
 |  |
| HNSC (tumor) | HNSC (normal) |
| FCAMR, TP53, HNF4A, HNF1A (tumor) | FCAMR, TP53, HNF4A, HNF1A (normal) |
 |  |
| KICH (tumor) | KICH (normal) |
| FCAMR, TP53, HNF4A, HNF1A (tumor) | FCAMR, TP53, HNF4A, HNF1A (normal) |
 |  |
| KIRC (tumor) | KIRC (normal) |
| FCAMR, TP53, HNF4A, HNF1A (tumor) | FCAMR, TP53, HNF4A, HNF1A (normal) |
 |  |
| KIRP (tumor) | KIRP (normal) |
| FCAMR, TP53, HNF4A, HNF1A (tumor) | FCAMR, TP53, HNF4A, HNF1A (normal) |
 |  |
| LIHC (tumor) | LIHC (normal) |
| FCAMR, TP53, HNF4A, HNF1A (tumor) | FCAMR, TP53, HNF4A, HNF1A (normal) |
 |  |
| LUAD (tumor) | LUAD (normal) |
| FCAMR, TP53, HNF4A, HNF1A (tumor) | FCAMR, TP53, HNF4A, HNF1A (normal) |
 |  |
| LUSC (tumor) | LUSC (normal) |
| FCAMR, TP53, HNF4A, HNF1A (tumor) | FCAMR, TP53, HNF4A, HNF1A (normal) |
 |  |
| PRAD (tumor) | PRAD (normal) |
| FCAMR, TP53, HNF4A, HNF1A (tumor) | FCAMR, TP53, HNF4A, HNF1A (normal) |
 |  |
| STAD (tumor) | STAD (normal) |
| FCAMR, TP53, HNF4A, HNF1A (tumor) | FCAMR, TP53, HNF4A, HNF1A (normal) |
 |  |
| THCA (tumor) | THCA (normal) |
| FCAMR, TP53, HNF4A, HNF1A (tumor) | FCAMR, TP53, HNF4A, HNF1A (normal) |
 |  |
| Top |
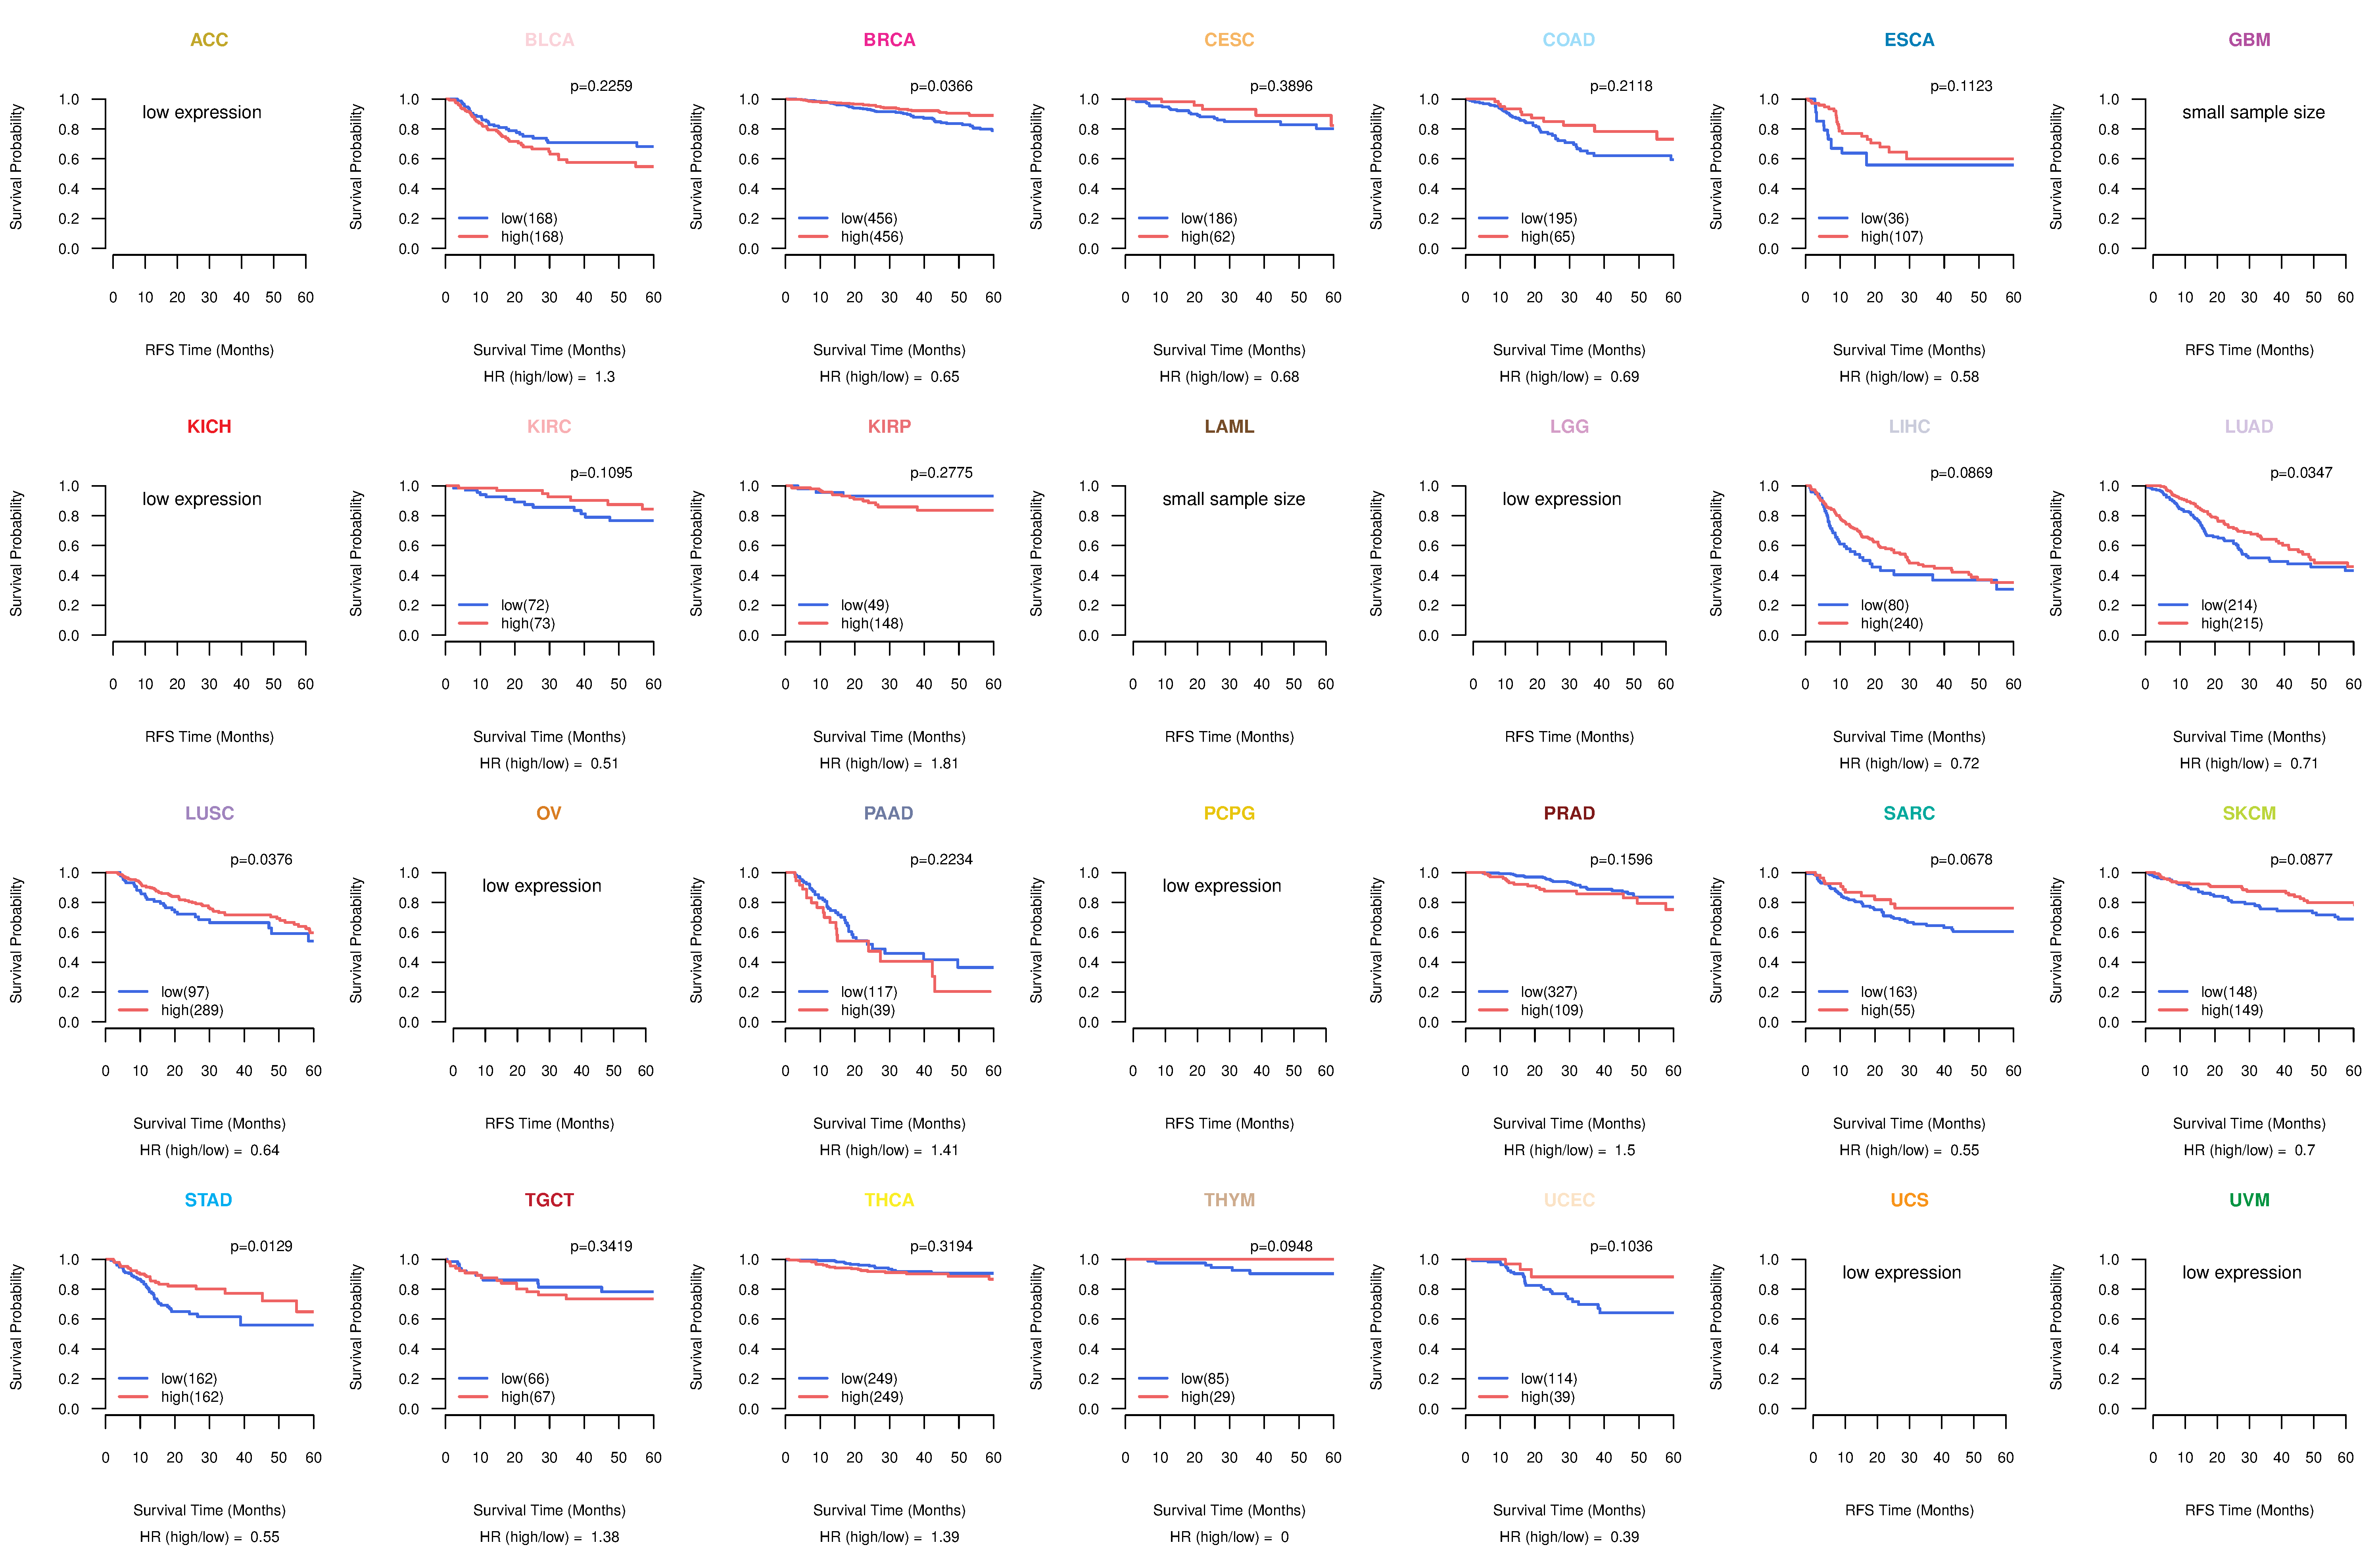
| TissGeneProg for FCAMR |
| Kaplan-Meier plots with logrank tests of overall survival (OS) using 28 cancer types (TCGA IlluminaHiSeq_RNASeqV2, pan-cancer normalized log2(norm_counts+1) data, version 2016-08-16) (TCGA clinicalMatrix, phenotype data, version 2016-04-27) * Click on the image to enlarge it in a new window. |
 |
| Kaplan-Meier plots with logrank test of relapse free survival (RFS) using 28 cancer types (TCGA IlluminaHiSeq_RNASeqV2, pan-cancer normalized log2(norm_counts+1) data, version 2016-08-16) (TCGA clinicalMatrix, phenotype data, version 2016-04-27) * Click on the image enlarge it in a new window. |
 |
| Forest plot of Cox proportional hazard ratio (HR) and 95% CI of overall survival (OS) using 28 cancer types (TCGA IlluminaHiSeq_RNASeqV2, pan-cancer normalized log2(norm_counts+1) data, version 2016-08-16) (TCGA clinicalMatrix, phenotype data, version 2016-04-27) * Click on the image enlarge it in a new window. |
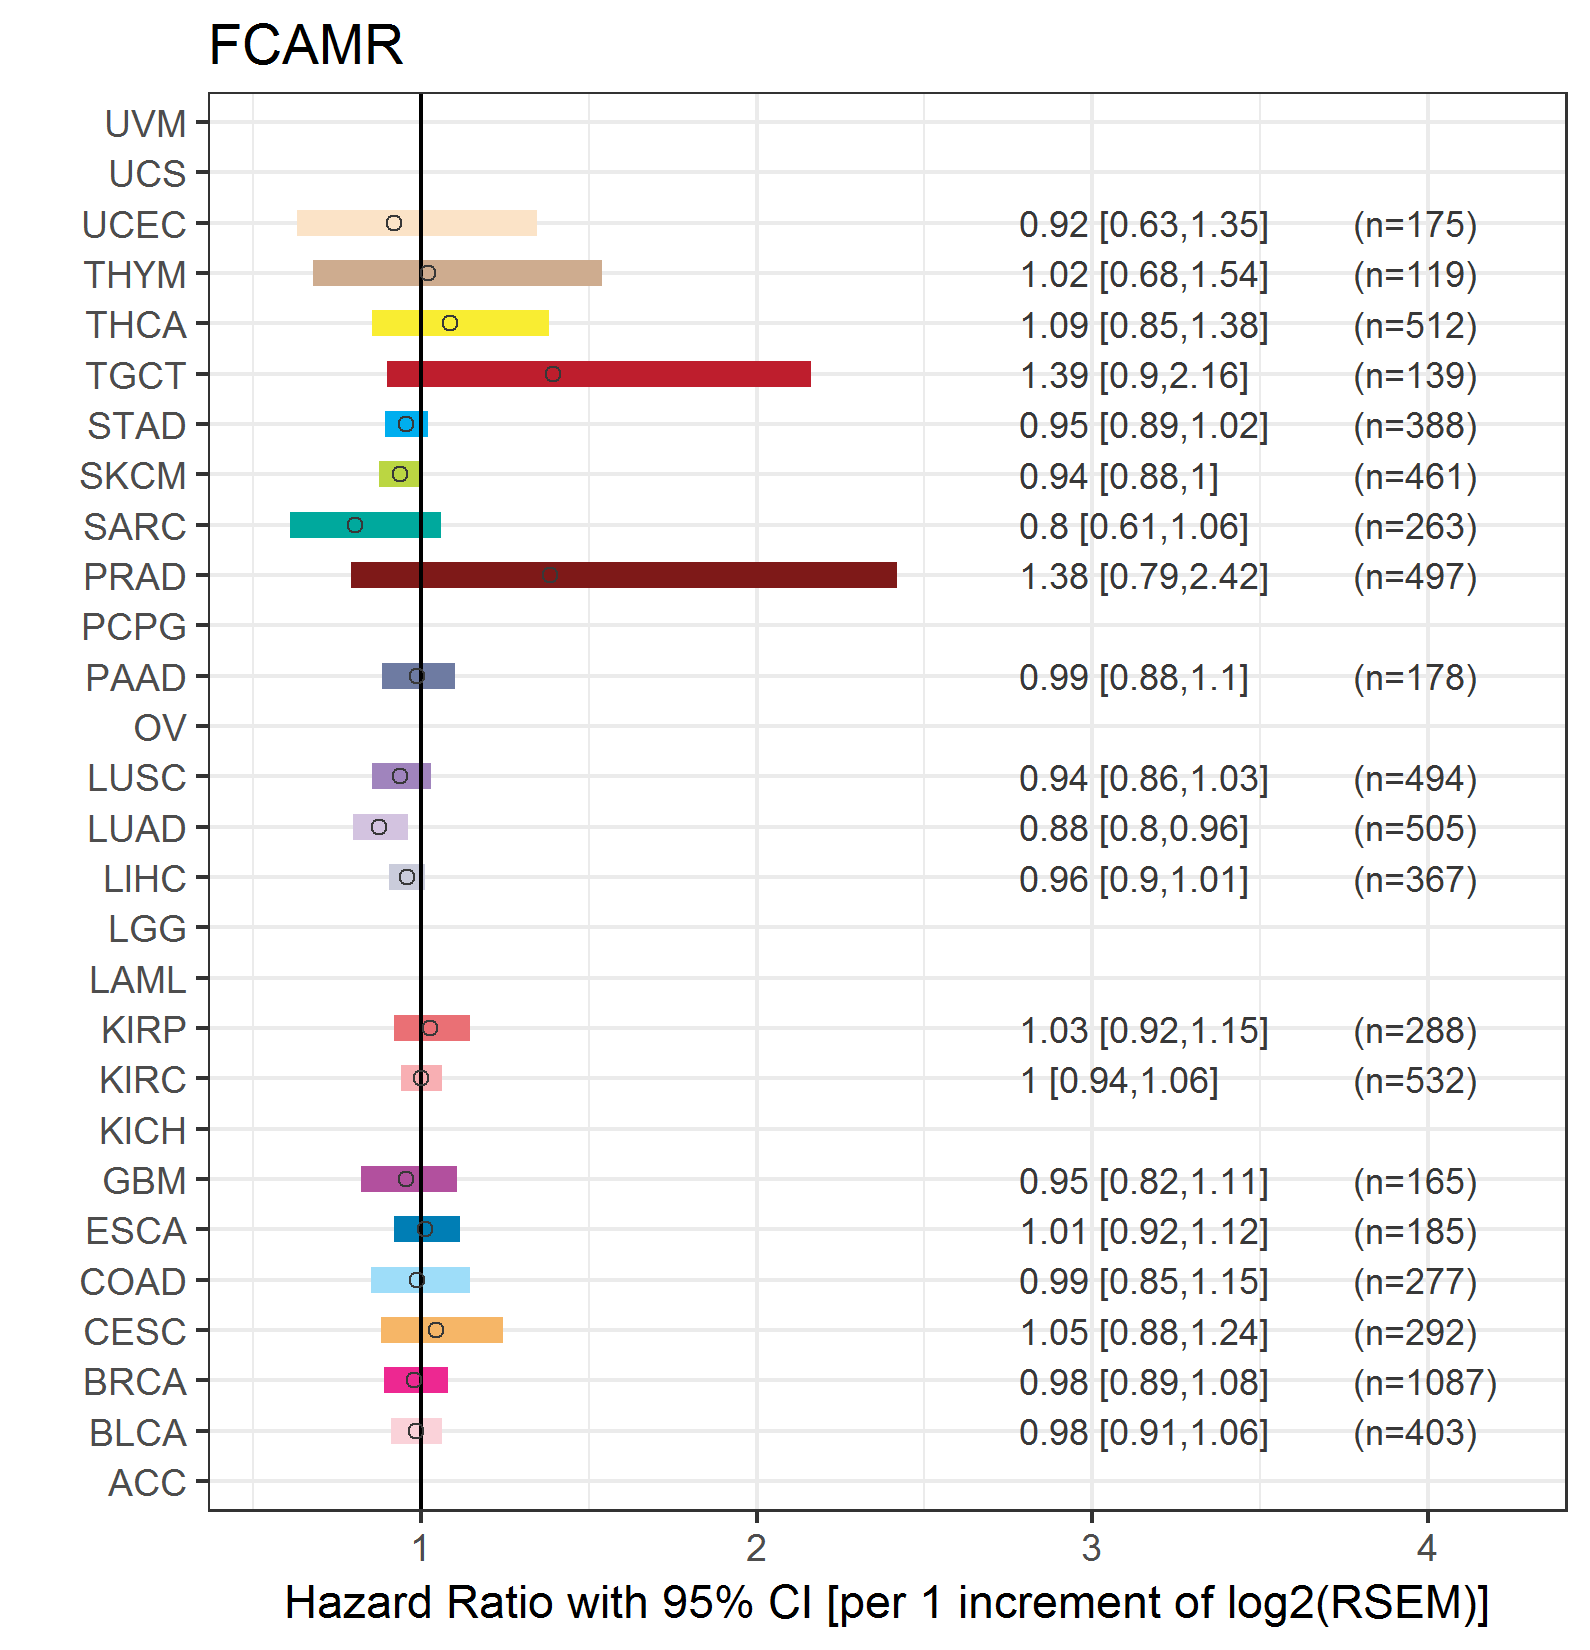 |
| Forest plot of Cox proportional hazard ratio (HR) and 95% CI of relapse free survival (RFS) using 28 cancer types (TCGA IlluminaHiSeq_RNASeqV2, pan-cancer normalized log2(norm_counts+1) data, version 2016-08-16) (TCGA clinicalMatrix, phenotype data, version 2016-04-27) * Click on the image enlarge it in a new window. |
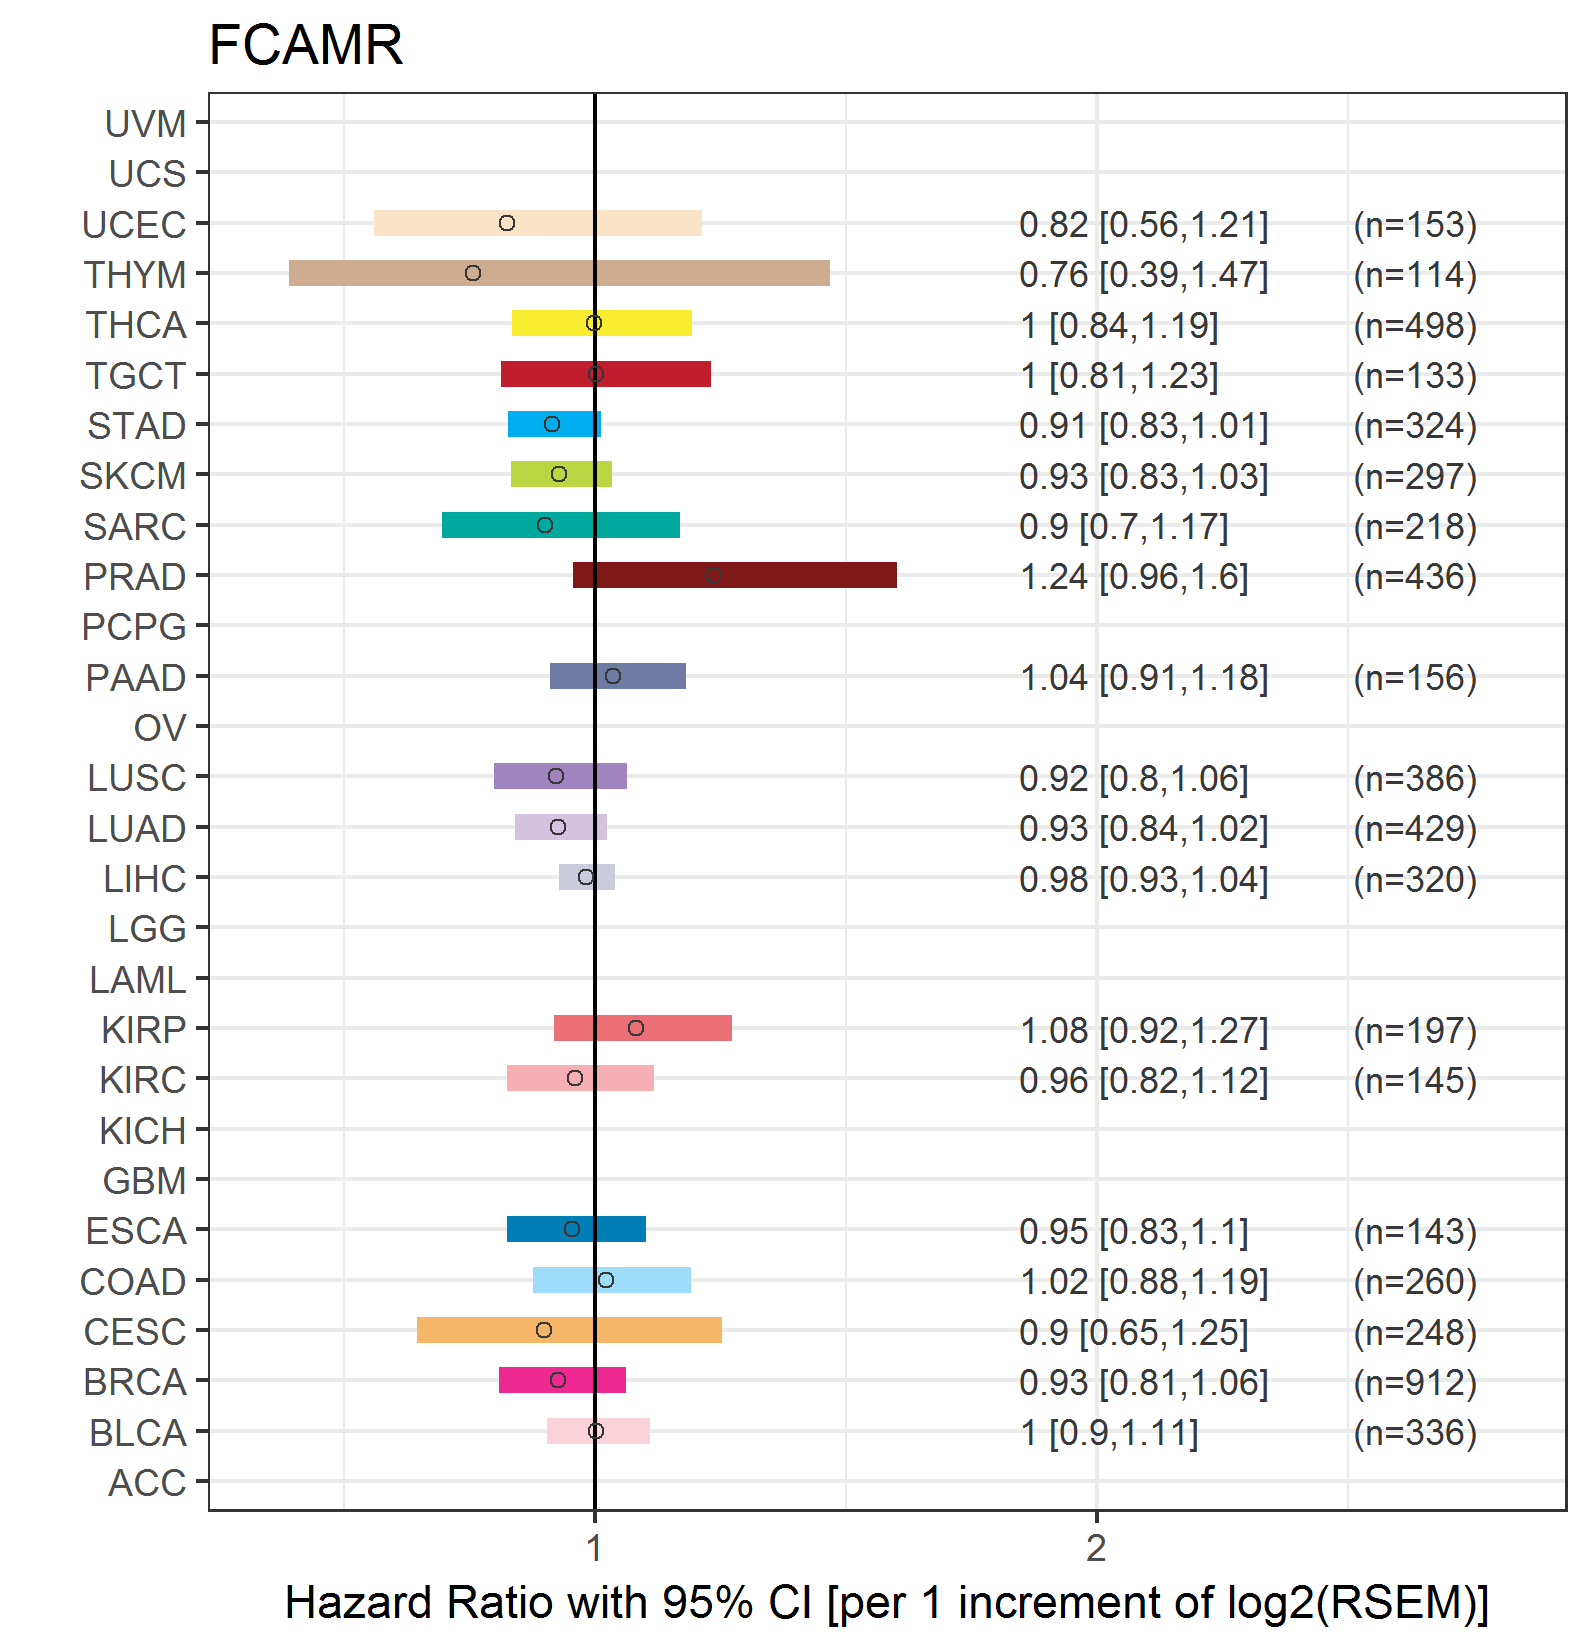 |
| Top |
| TissGeneClin for FCAMR |
| TissGeneDrug for FCAMR |
| Drug information targeting TissGene (DrugBank Version 5.0.6, 2017-04-01) |
| DrugBank ID | Drug name | Drug activity | Drug type | Drug status |
| Top |
| TissGeneDisease for FCAMR |
| Disease information associated with TissGene (DisGeNet, 2016-06-01) |
| Disease ID | Disease name | # pubmeds | Source |
| umls:C0040336 | Tobacco Use Disorder | 1 | GAD |
|
Copyright 2016-Present - The University of Texas Health Science Center at Houston (UTHealth) Web File Viewing | How to Report, Fraud, Waste and Abuse | State of Texas | Statewide Search | Texas Homeland Security | Site Policies |