 |
| |
| |
| |
| |
| |
| |
|

| TissGeneSummary for USP44 |
 Gene summary Gene summary |
| Basic gene information | Gene symbol | USP44 |
| Gene name | ubiquitin specific peptidase 44 | |
| Synonyms | - | |
| Cytomap | UCSC genome browser: 12q22 | |
| Type of gene | protein-coding | |
| RefGenes | NM_001042403.2, NM_001278393.1,NM_032147.4,NR_125360.1, | |
| Description | deubiquitinating enzyme 44ubiquitin carboxyl-terminal hydrolase 44ubiquitin specific protease 44ubiquitin thioesterase 44ubiquitin thiolesterase 44ubiquitin-specific-processing protease 44 | |
| Modification date | 20141207 | |
| dbXrefs | MIM : 610993 | |
| HGNC : HGNC | ||
| Ensembl : ENSG00000136014 | ||
| HPRD : 15636 | ||
| Vega : OTTHUMG00000170281 | ||
| Protein | UniProt: go to UniProt's Cross Reference DB Table | |
| Expression | CleanEX: HS_USP44 | |
| BioGPS: 84101 | ||
| Pathway | NCI Pathway Interaction Database: USP44 | |
| KEGG: USP44 | ||
| REACTOME: USP44 | ||
| Pathway Commons: USP44 | ||
| Context | iHOP: USP44 | |
| ligand binding site mutation search in PubMed: USP44 | ||
| UCL Cancer Institute: USP44 | ||
| Assigned class in TissGDB* | A | |
| Included tissue-specific gene expression resources | HPA,TiGER,GTEx | |
| Specific-tissues in normal samples (assigned by TissGDB using HPA, TiGER, and GTEx) | Testis | |
| Cancer types related to the specific-tissues in cancer samples (assigned by TissGDB using TCGA) | TGCT | |
| Reference showing the relevant tissue of USP44 | K48- and K63-linked polyubiquitination of deubiquitinating enzyme USP44. Cell Biol Int. 2010 Aug;34(8):799-808. doi: 10.1042/CBI20090144. (pmid:20402667) go to article | |
| Description by TissGene annotations | ||
| * Class A consists of genes with literature evidence and is part of the cTissGenes. Class B consists of only cTissGenes without additional evidence. The remaining genes belong to Class C. |
| Gene ontology having evidence of Inferred from Direct Assay (IDA) from Entrez |
| GO ID | GO term | PubMed ID | GO:0016579 | protein deubiquitination | 14715245 | GO:0016579 | protein deubiquitination | 14715245 |
| Top |
| TissGeneExp for USP44 |
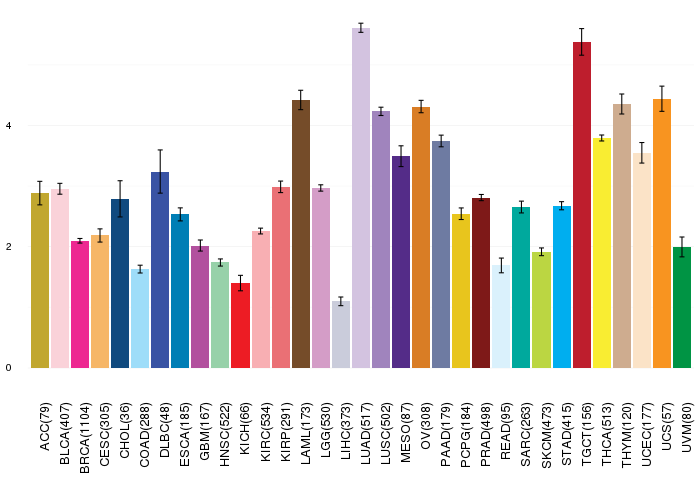
| Gene expressions across 28 cancer types (X-axis: cancer type and Y-axis: log2(norm_counts+1)) (TCGA IlluminaHiSeq_RNASeqV2, pan-cancer normalized log2(norm_counts+1) data, version 2016-08-16) |
 |
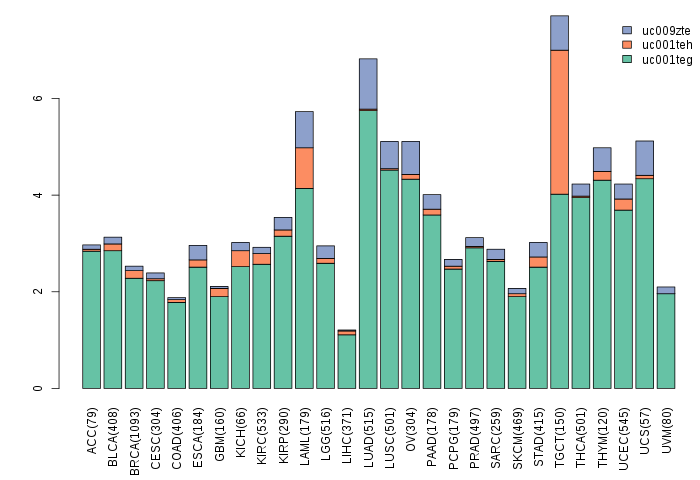
| Gene isoform expressions across 28 cancer types (X-axis: cancer type and Y-axis: log2(norm_counts+1)) (TCGA pan-cancer tcga_rsem_isoform_tpm, version 2016-09-01) |
 |
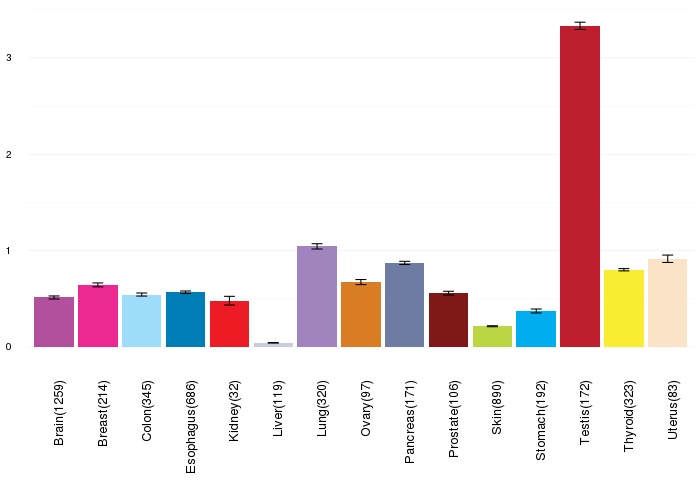
| Gene expressions across normal tissues of GTEx data (GTEx GTEx_Analysis_v6_RNA-seq_RNA-SeQCv1.1.8_gene_rpkm.gct) - Here, we shows the matched tissue types only among our 28 cancer types. |
 |
| Different expressions across 14 cancer types with more than 10 samples between matched tumors and normals (X-axis: cancer type and Y-axis: log2(norm_counts+1)) (TCGA IlluminaHiSeq_RNASeqV2, pan-cancer normalized log2(norm_counts+1) data, version 2016-08-16) |
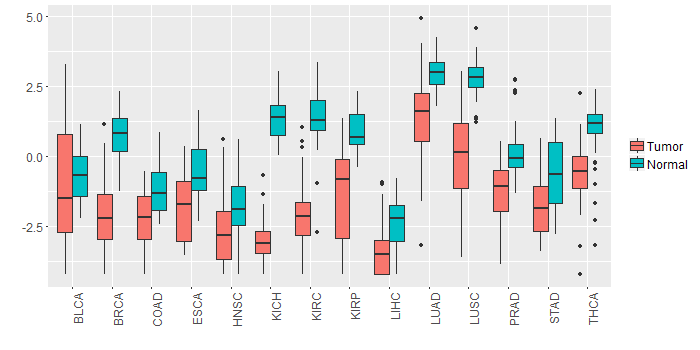 |
| - Significantly differentially expressed cancer types and information. (|Fold change|>1 and FDR<0.05) |
| Cancer type | Mean(exp) in tumor | Mean(exp) in matched normal | Log2FC | P-val. | FDR |
| PRAD | -1.276894982 | 0.192051172 | -1.468946154 | 3.86E-11 | 9.94E-10 |
| THCA | -0.65127963 | 0.946961048 | -1.598240678 | 6.07E-13 | 5.74E-12 |
| KICH | -2.958652443 | 1.381999557 | -4.340652 | 6.24E-21 | 5.50E-19 |
| KIRC | -2.091176499 | 1.385802668 | -3.476979167 | 8.26E-46 | 5.14E-44 |
| BRCA | -2.098406689 | 0.727347697 | -2.825754386 | 1.74E-54 | 3.02E-52 |
| LUAD | 1.404579488 | 2.987531212 | -1.582951724 | 4.74E-11 | 2.96E-10 |
| LUSC | 0.018836655 | 2.806113125 | -2.787276471 | 1.88E-17 | 1.57E-16 |
| KIRP | -1.233905318 | 0.926622807 | -2.160528125 | 2.07E-08 | 1.48E-07 |
| STAD | -1.717430318 | -0.695877193 | -1.021553125 | 0.00134 | 0.006667389 |
| Top |
| TissGene-miRNA for USP44 |
| Significantly anti-correlated miRNAs of TissGene across 28 cancer types (Gene-miRNA relations from TargetScanHuman Relsease 7.1, Conserved_Site_Context_Scores.txt.zip, 06.01.2016) (TCGA IlluminaHiSeq_miRNASeq, log2(RPM+1) data, version 2016-11-21) (TCGA IlluminaHiSeq_RNASeqV2, log2(normalized_count+1) data, version 2016-08-16) (Spearman’s Rank Correlation (p-value<0.05 and coefficient<-0.25)) |
| Cancer type | miRNA id | miRNA accession | P-val. | Coeff. | # samples |
| LUAD | hsa-miR-30a-5p | MIMAT0000087 | 0.03 | -0.28 | 60 |
| THYM | hsa-let-7c-5p | MIMAT0000064 | 0.0013 | -0.29 | 122 |
| Top |
| TissGeneMut for USP44 |
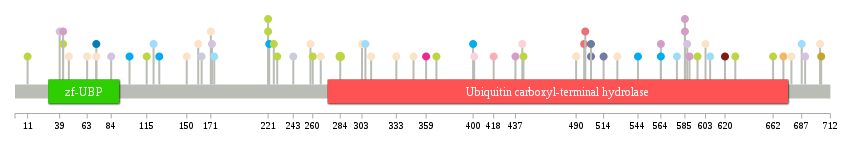
| TissGeneSNV for USP44 |
| nsSNV counts per each loci. Different colors of circles represent different cancer types. Circle size denotes number of samples. (TCGA somatic mutation (SNPs and small INDELs) data, version 2016-04-25) * Click on the image to enlarge it in a new window. |
 |
 |
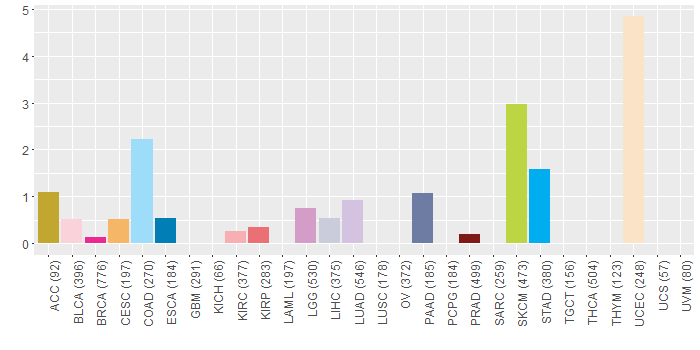
| Somatic nucleotide variants of TissGene across 28 cancer types (X-axis: cancer type and Y-axis: % of mutated samples) The numbers in parentheses are numbers of samples with mutation (nsSNVs). (TCGA somatic mutation (SNPs and small INDELs) data, version 2016-04-25) |
 |
| - nsSNVs sorted by frequency. |
| AAchange | Cancer type | # samples |
| p.M284I | SKCM | 2 |
| p.A703T | UCEC | 1 |
| p.Q221* | SKCM | 1 |
| p.E526* | UCEC | 1 |
| p.W151R | HNSC | 1 |
| p.S222L | STAD | 1 |
| p.K303N | UCEC | 1 |
| p.S260F | SKCM | 1 |
| p.G443S | BLCA | 1 |
| p.R348I | UCEC | 1 |
| p.I267T | UCEC | 1 |
| p.L497F | KIRP | 1 |
| p.D243E | LIHC | 1 |
| p.G589D | LGG | 1 |
| p.R115C | SKCM | 1 |
| p.R678Q | UCEC | 1 |
| p.E498K | KIRP | 1 |
| p.L150R | UCEC | 1 |
| p.P690A | LUAD | 1 |
| p.Q333* | UCEC | 1 |
| p.V400F | STAD | 1 |
| p.S401* | BLCA | 1 |
| p.G629E | SKCM | 1 |
| p.D620Y | PRAD | 1 |
| p.Q221X | SKCM | 1 |
| p.G172E | LUAD | 1 |
| p.C564Y | LGG | 1 |
| p.V47A | UCEC | 1 |
| p.E490* | UCEC | 1 |
| p.S229F | SKCM | 1 |
| p.R578G | COAD | 1 |
| p.E226K | SKCM | 1 |
| p.D704N | ACC | 1 |
| p.I171V | UCEC | 1 |
| p.L288I | READ | 1 |
| p.A311T | UCEC | 1 |
| p.L687P | COAD | 1 |
| p.K160T | UCEC | 1 |
| p.E63* | UCEC | 1 |
| p.G359R | BRCA | 1 |
| p.R585* | LGG | 1 |
| p.K174X | COAD | 1 |
| p.E316Q | DLBC | 1 |
| p.M662I | SKCM | 1 |
| p.G126D | STAD | 1 |
| p.R437H | LGG | 1 |
| p.R585X | LGG | 1 |
| p.Y671H | CESC | 1 |
| p.D84Y | LUAD | 1 |
| p.R544H | STAD | 1 |
| p.L306P | COAD | 1 |
| p.G11E | SKCM | 1 |
| p.Y503* | PAAD | 1 |
| p.K191N | READ | 1 |
| p.R121W | COAD | 1 |
| p.S21T | HNSC | 1 |
| p.T444I | SKCM | 1 |
| p.Y603C | UCEC | 1 |
| p.L42F | SKCM | 1 |
| p.W39C | LUAD | 1 |
| p.S258N | UCEC | 1 |
| p.Q390R | DLBC | 1 |
| p.R163L | LIHC | 1 |
| p.E71Q | ESCA | 1 |
| p.R99Q | READ | 1 |
| p.E607K | COAD | 1 |
| p.C564R | STAD | 1 |
| p.K587T | LUAD | 1 |
| p.Y503X | PAAD | 1 |
| p.P514L | PAAD | 1 |
| p.E74K | HNSC | 1 |
| p.L42F | LGG | 1 |
| p.G418A | KIRC | 1 |
| p.E71K | UCEC | 1 |
| p.L368V | SKCM | 1 |
| p.Q255* | HNSC | 1 |
| p.E596K | SKCM | 1 |
| p.R100H | STAD | 1 |
| Top |
| TissGeneCNV for USP44 |
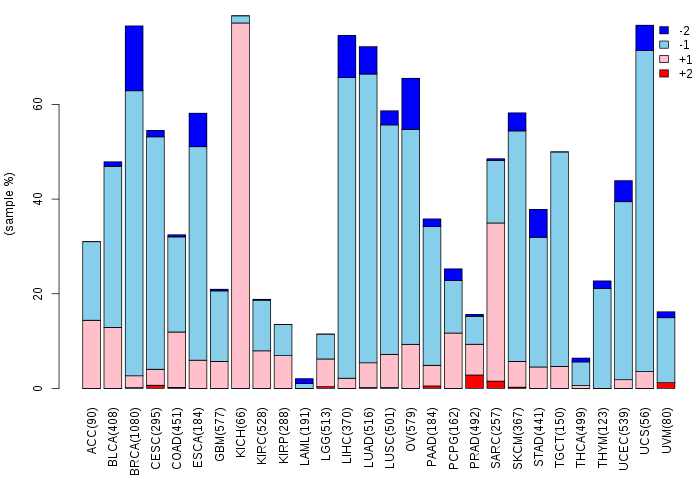
| Copy number variations of TissGene across 28 cancer types (X-axis: cancer type and Y-axis: % of CNV samples) (TCGA Gistic2_CopyNumber_Gistic2_all_data_by_genes, Gistic2 copy number data, version 2016-08-16) |
 |
| Top |
| TissGeneFusions for USP44 |
| Fusion genes including TissGene (ChimerDB 3.0, 2016-12-01 and TCGA fusion Portal 2015-12-01) |
| Database | Src | Cancer type | Sample | Fusion gene | ORF | 5'-gene BP | 3'-gene BP |
| Chimerdb3.0 | ChiTaRs | NA | AW974550 | PRRC2A-USP44 | chr6:2936339 | chr12:95921521 | |
| Chimerdb3.0 | ChiTaRs | NA | DB481807 | USP44-LEPRE1 | chr12:95942591 | chr1:43228011 |
| Top |
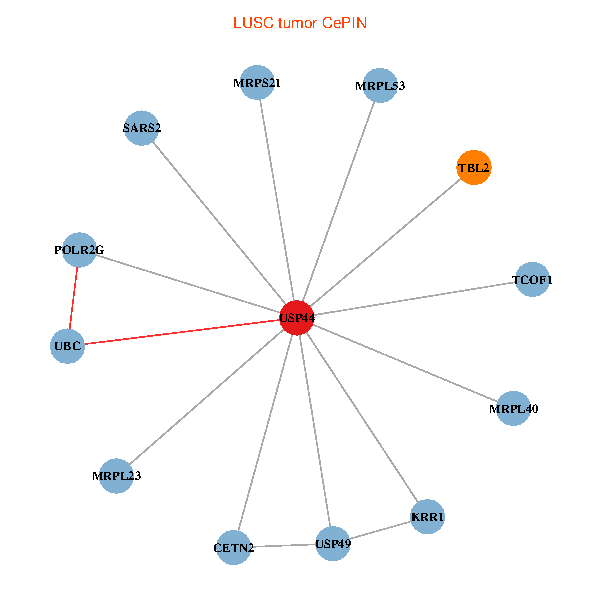
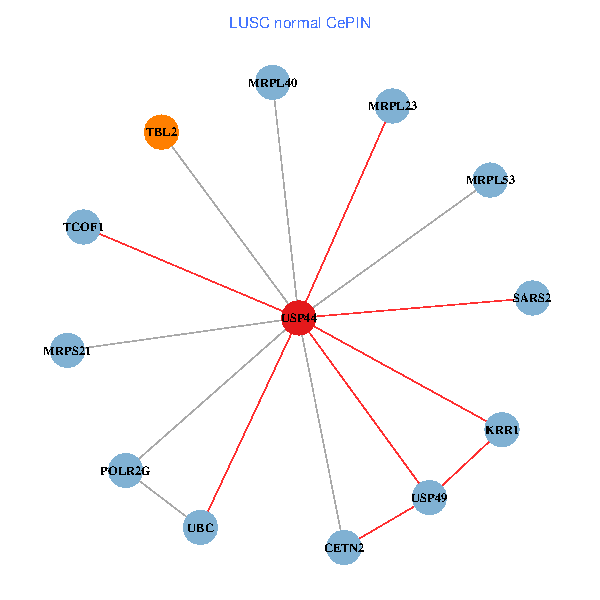
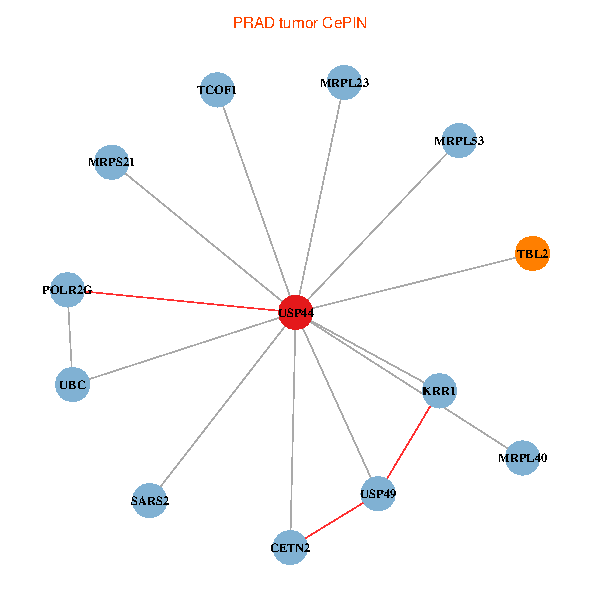
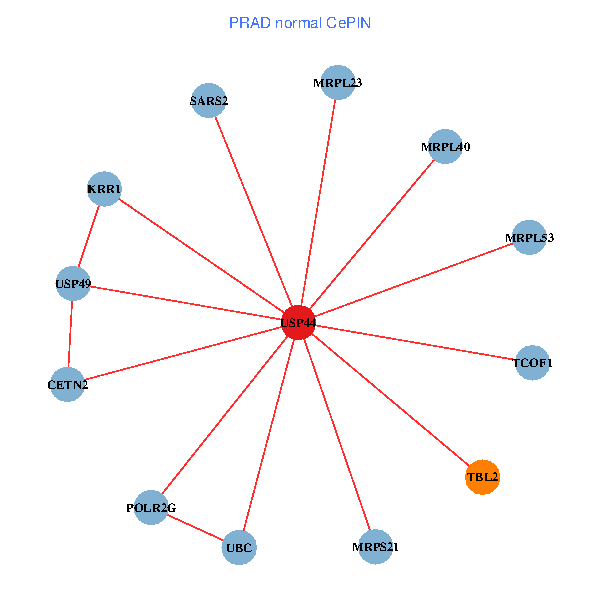
| TissGeneNet for USP44 |
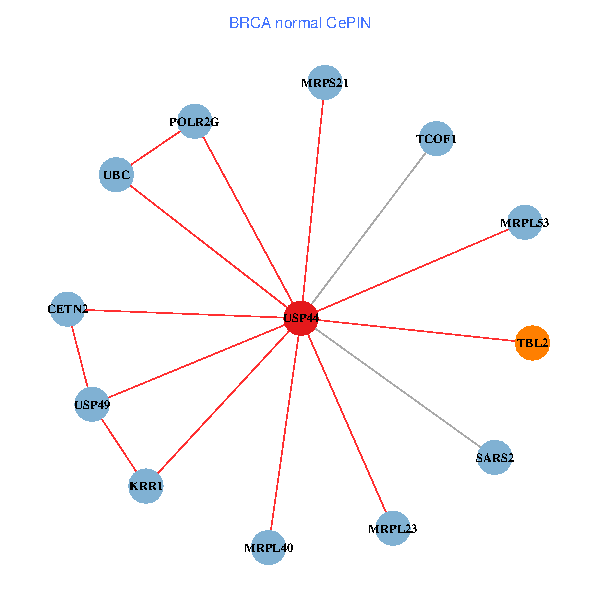
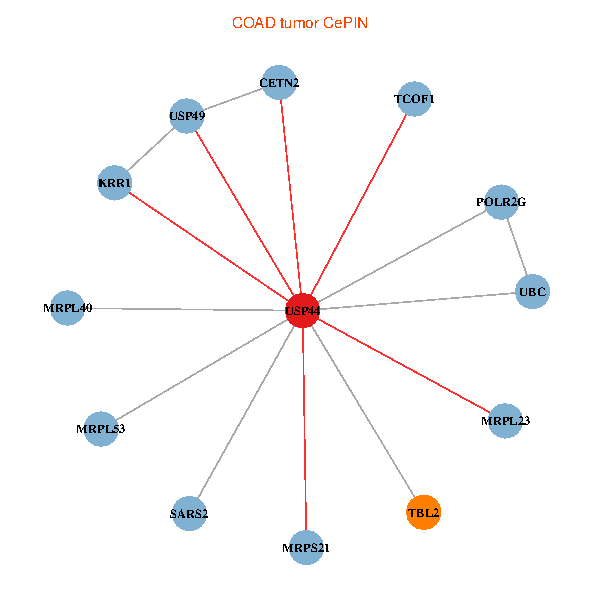
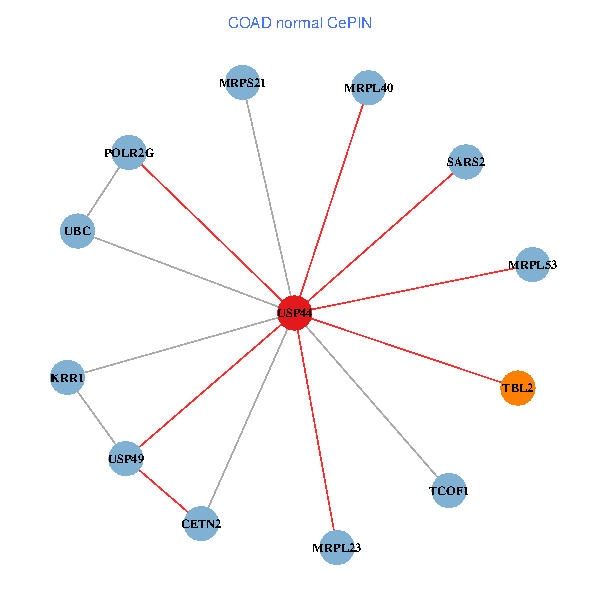
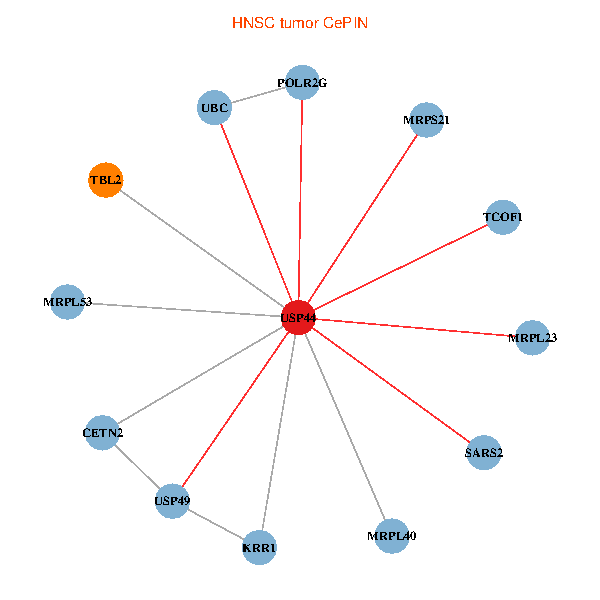
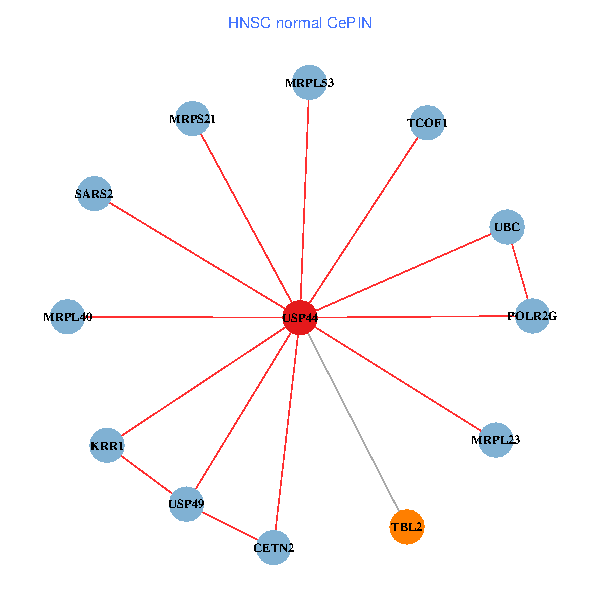
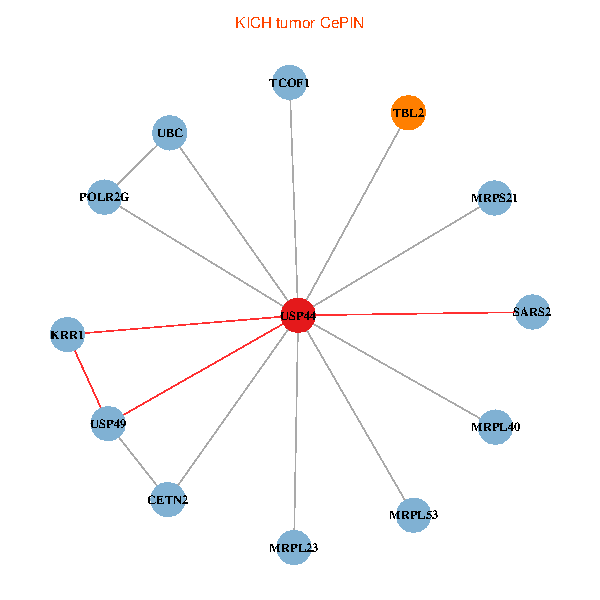
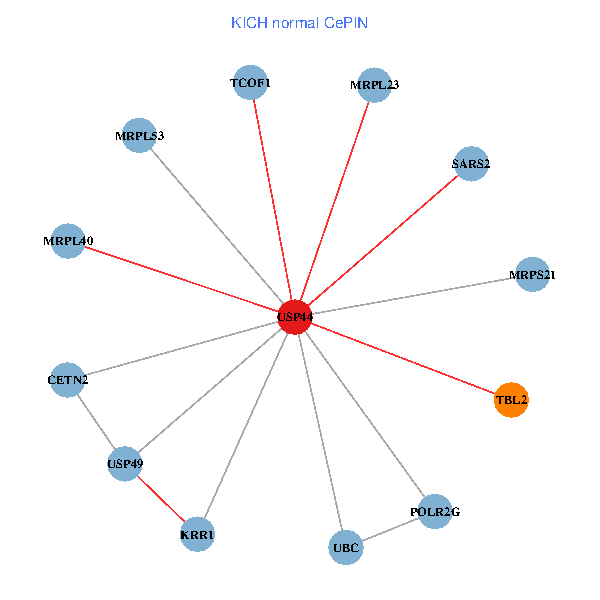
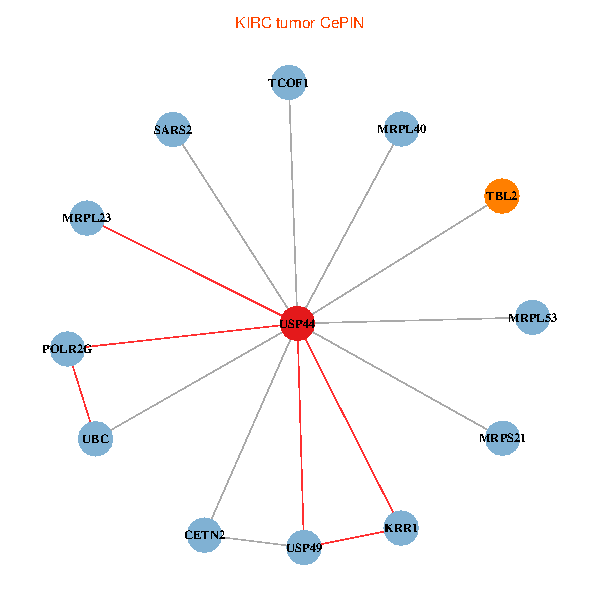
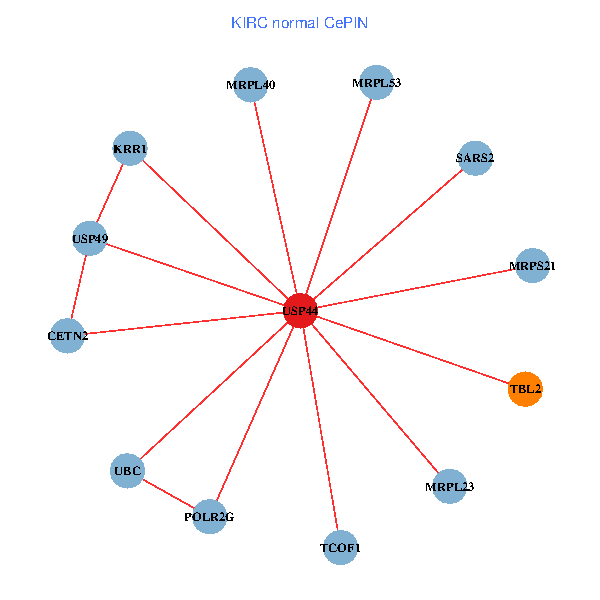
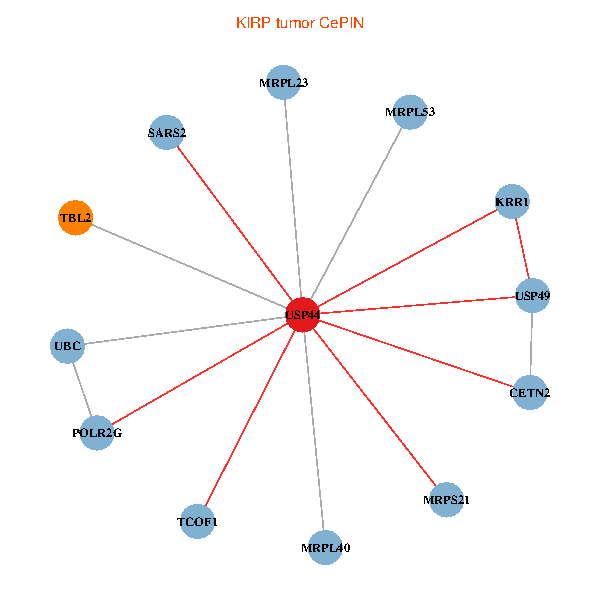
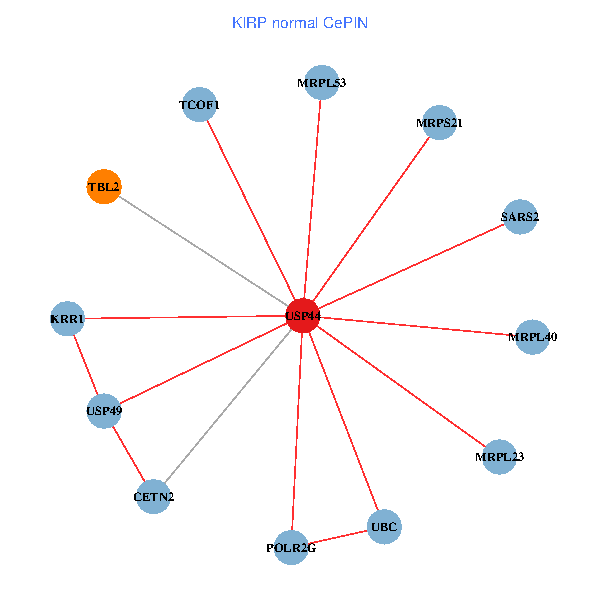
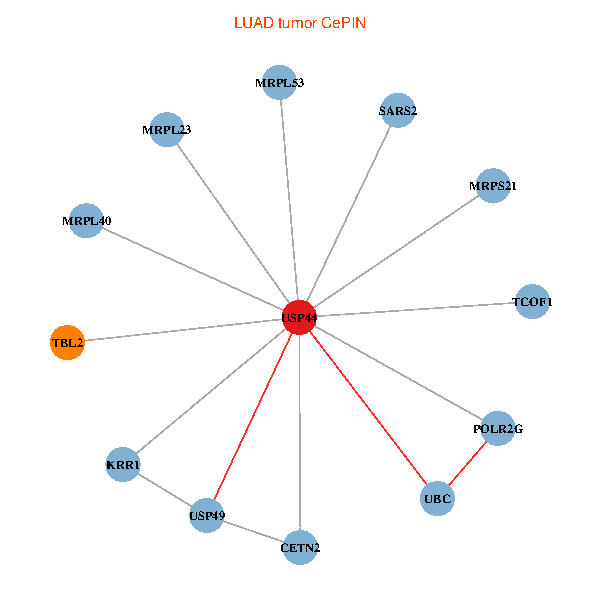
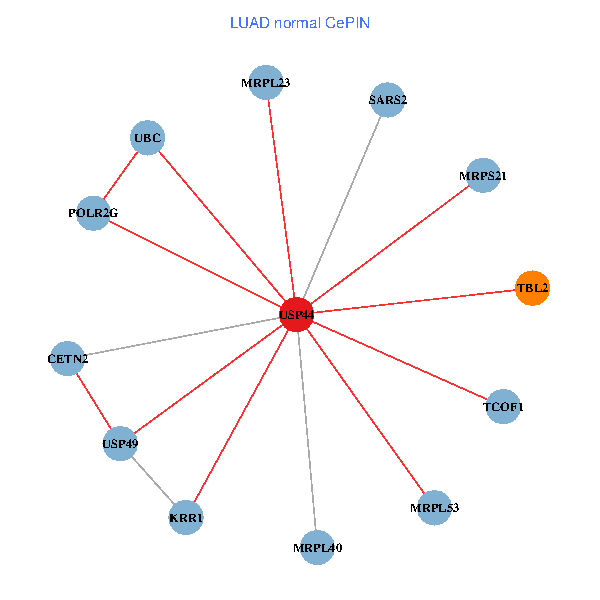
| Co-expressed gene networks based on protein-protein interaction data (CePIN) (TCGA IlluminaHiSeq_RNASeqV2, pan-cancer normalized log2(norm_counts+1) data, version 2016-08-16) (PINA2 ppi data) |
| BRCA (tumor) | BRCA (normal) |
| USP44, UBC, POLR2G, USP49, KRR1, TCOF1, MRPL40, CETN2, MRPL23, SARS2, MRPS21, MRPL53, TBL2 (tumor) | USP44, UBC, POLR2G, USP49, KRR1, TCOF1, MRPL40, CETN2, MRPL23, SARS2, MRPS21, MRPL53, TBL2 (normal) |
 |  |
| COAD (tumor) | COAD (normal) |
| USP44, UBC, POLR2G, USP49, KRR1, TCOF1, MRPL40, CETN2, MRPL23, SARS2, MRPS21, MRPL53, TBL2 (tumor) | USP44, UBC, POLR2G, USP49, KRR1, TCOF1, MRPL40, CETN2, MRPL23, SARS2, MRPS21, MRPL53, TBL2 (normal) |
 |  |
| HNSC (tumor) | HNSC (normal) |
| USP44, UBC, POLR2G, USP49, KRR1, TCOF1, MRPL40, CETN2, MRPL23, SARS2, MRPS21, MRPL53, TBL2 (tumor) | USP44, UBC, POLR2G, USP49, KRR1, TCOF1, MRPL40, CETN2, MRPL23, SARS2, MRPS21, MRPL53, TBL2 (normal) |
 |  |
| KICH (tumor) | KICH (normal) |
| USP44, UBC, POLR2G, USP49, KRR1, TCOF1, MRPL40, CETN2, MRPL23, SARS2, MRPS21, MRPL53, TBL2 (tumor) | USP44, UBC, POLR2G, USP49, KRR1, TCOF1, MRPL40, CETN2, MRPL23, SARS2, MRPS21, MRPL53, TBL2 (normal) |
 |  |
| KIRC (tumor) | KIRC (normal) |
| USP44, UBC, POLR2G, USP49, KRR1, TCOF1, MRPL40, CETN2, MRPL23, SARS2, MRPS21, MRPL53, TBL2 (tumor) | USP44, UBC, POLR2G, USP49, KRR1, TCOF1, MRPL40, CETN2, MRPL23, SARS2, MRPS21, MRPL53, TBL2 (normal) |
 |  |
| KIRP (tumor) | KIRP (normal) |
| USP44, UBC, POLR2G, USP49, KRR1, TCOF1, MRPL40, CETN2, MRPL23, SARS2, MRPS21, MRPL53, TBL2 (tumor) | USP44, UBC, POLR2G, USP49, KRR1, TCOF1, MRPL40, CETN2, MRPL23, SARS2, MRPS21, MRPL53, TBL2 (normal) |
 |  |
| LIHC (tumor) | LIHC (normal) |
| USP44, UBC, POLR2G, USP49, KRR1, TCOF1, MRPL40, CETN2, MRPL23, SARS2, MRPS21, MRPL53, TBL2 (tumor) | USP44, UBC, POLR2G, USP49, KRR1, TCOF1, MRPL40, CETN2, MRPL23, SARS2, MRPS21, MRPL53, TBL2 (normal) |
 |  |
| LUAD (tumor) | LUAD (normal) |
| USP44, UBC, POLR2G, USP49, KRR1, TCOF1, MRPL40, CETN2, MRPL23, SARS2, MRPS21, MRPL53, TBL2 (tumor) | USP44, UBC, POLR2G, USP49, KRR1, TCOF1, MRPL40, CETN2, MRPL23, SARS2, MRPS21, MRPL53, TBL2 (normal) |
 |  |
| LUSC (tumor) | LUSC (normal) |
| USP44, UBC, POLR2G, USP49, KRR1, TCOF1, MRPL40, CETN2, MRPL23, SARS2, MRPS21, MRPL53, TBL2 (tumor) | USP44, UBC, POLR2G, USP49, KRR1, TCOF1, MRPL40, CETN2, MRPL23, SARS2, MRPS21, MRPL53, TBL2 (normal) |
 |  |
| PRAD (tumor) | PRAD (normal) |
| USP44, UBC, POLR2G, USP49, KRR1, TCOF1, MRPL40, CETN2, MRPL23, SARS2, MRPS21, MRPL53, TBL2 (tumor) | USP44, UBC, POLR2G, USP49, KRR1, TCOF1, MRPL40, CETN2, MRPL23, SARS2, MRPS21, MRPL53, TBL2 (normal) |
 |  |
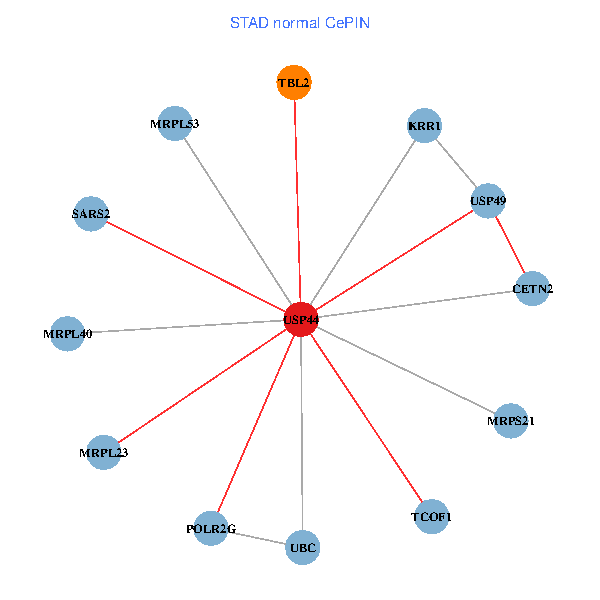
| STAD (tumor) | STAD (normal) |
| USP44, UBC, POLR2G, USP49, KRR1, TCOF1, MRPL40, CETN2, MRPL23, SARS2, MRPS21, MRPL53, TBL2 (tumor) | USP44, UBC, POLR2G, USP49, KRR1, TCOF1, MRPL40, CETN2, MRPL23, SARS2, MRPS21, MRPL53, TBL2 (normal) |
 |  |
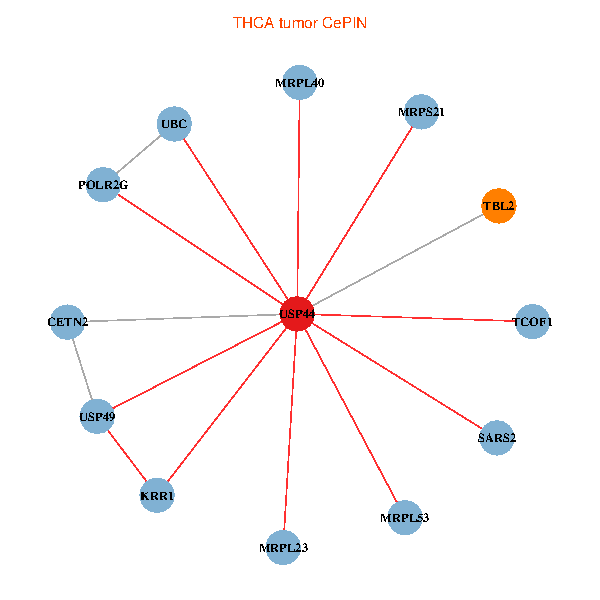
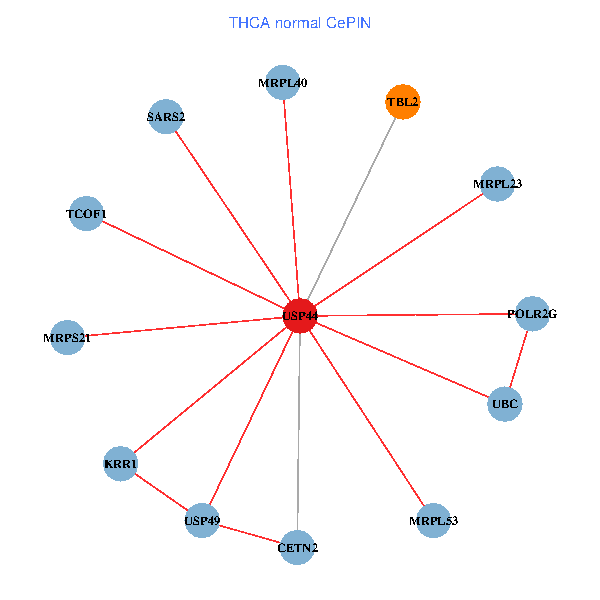
| THCA (tumor) | THCA (normal) |
| USP44, UBC, POLR2G, USP49, KRR1, TCOF1, MRPL40, CETN2, MRPL23, SARS2, MRPS21, MRPL53, TBL2 (tumor) | USP44, UBC, POLR2G, USP49, KRR1, TCOF1, MRPL40, CETN2, MRPL23, SARS2, MRPS21, MRPL53, TBL2 (normal) |
 |  |
| Top |
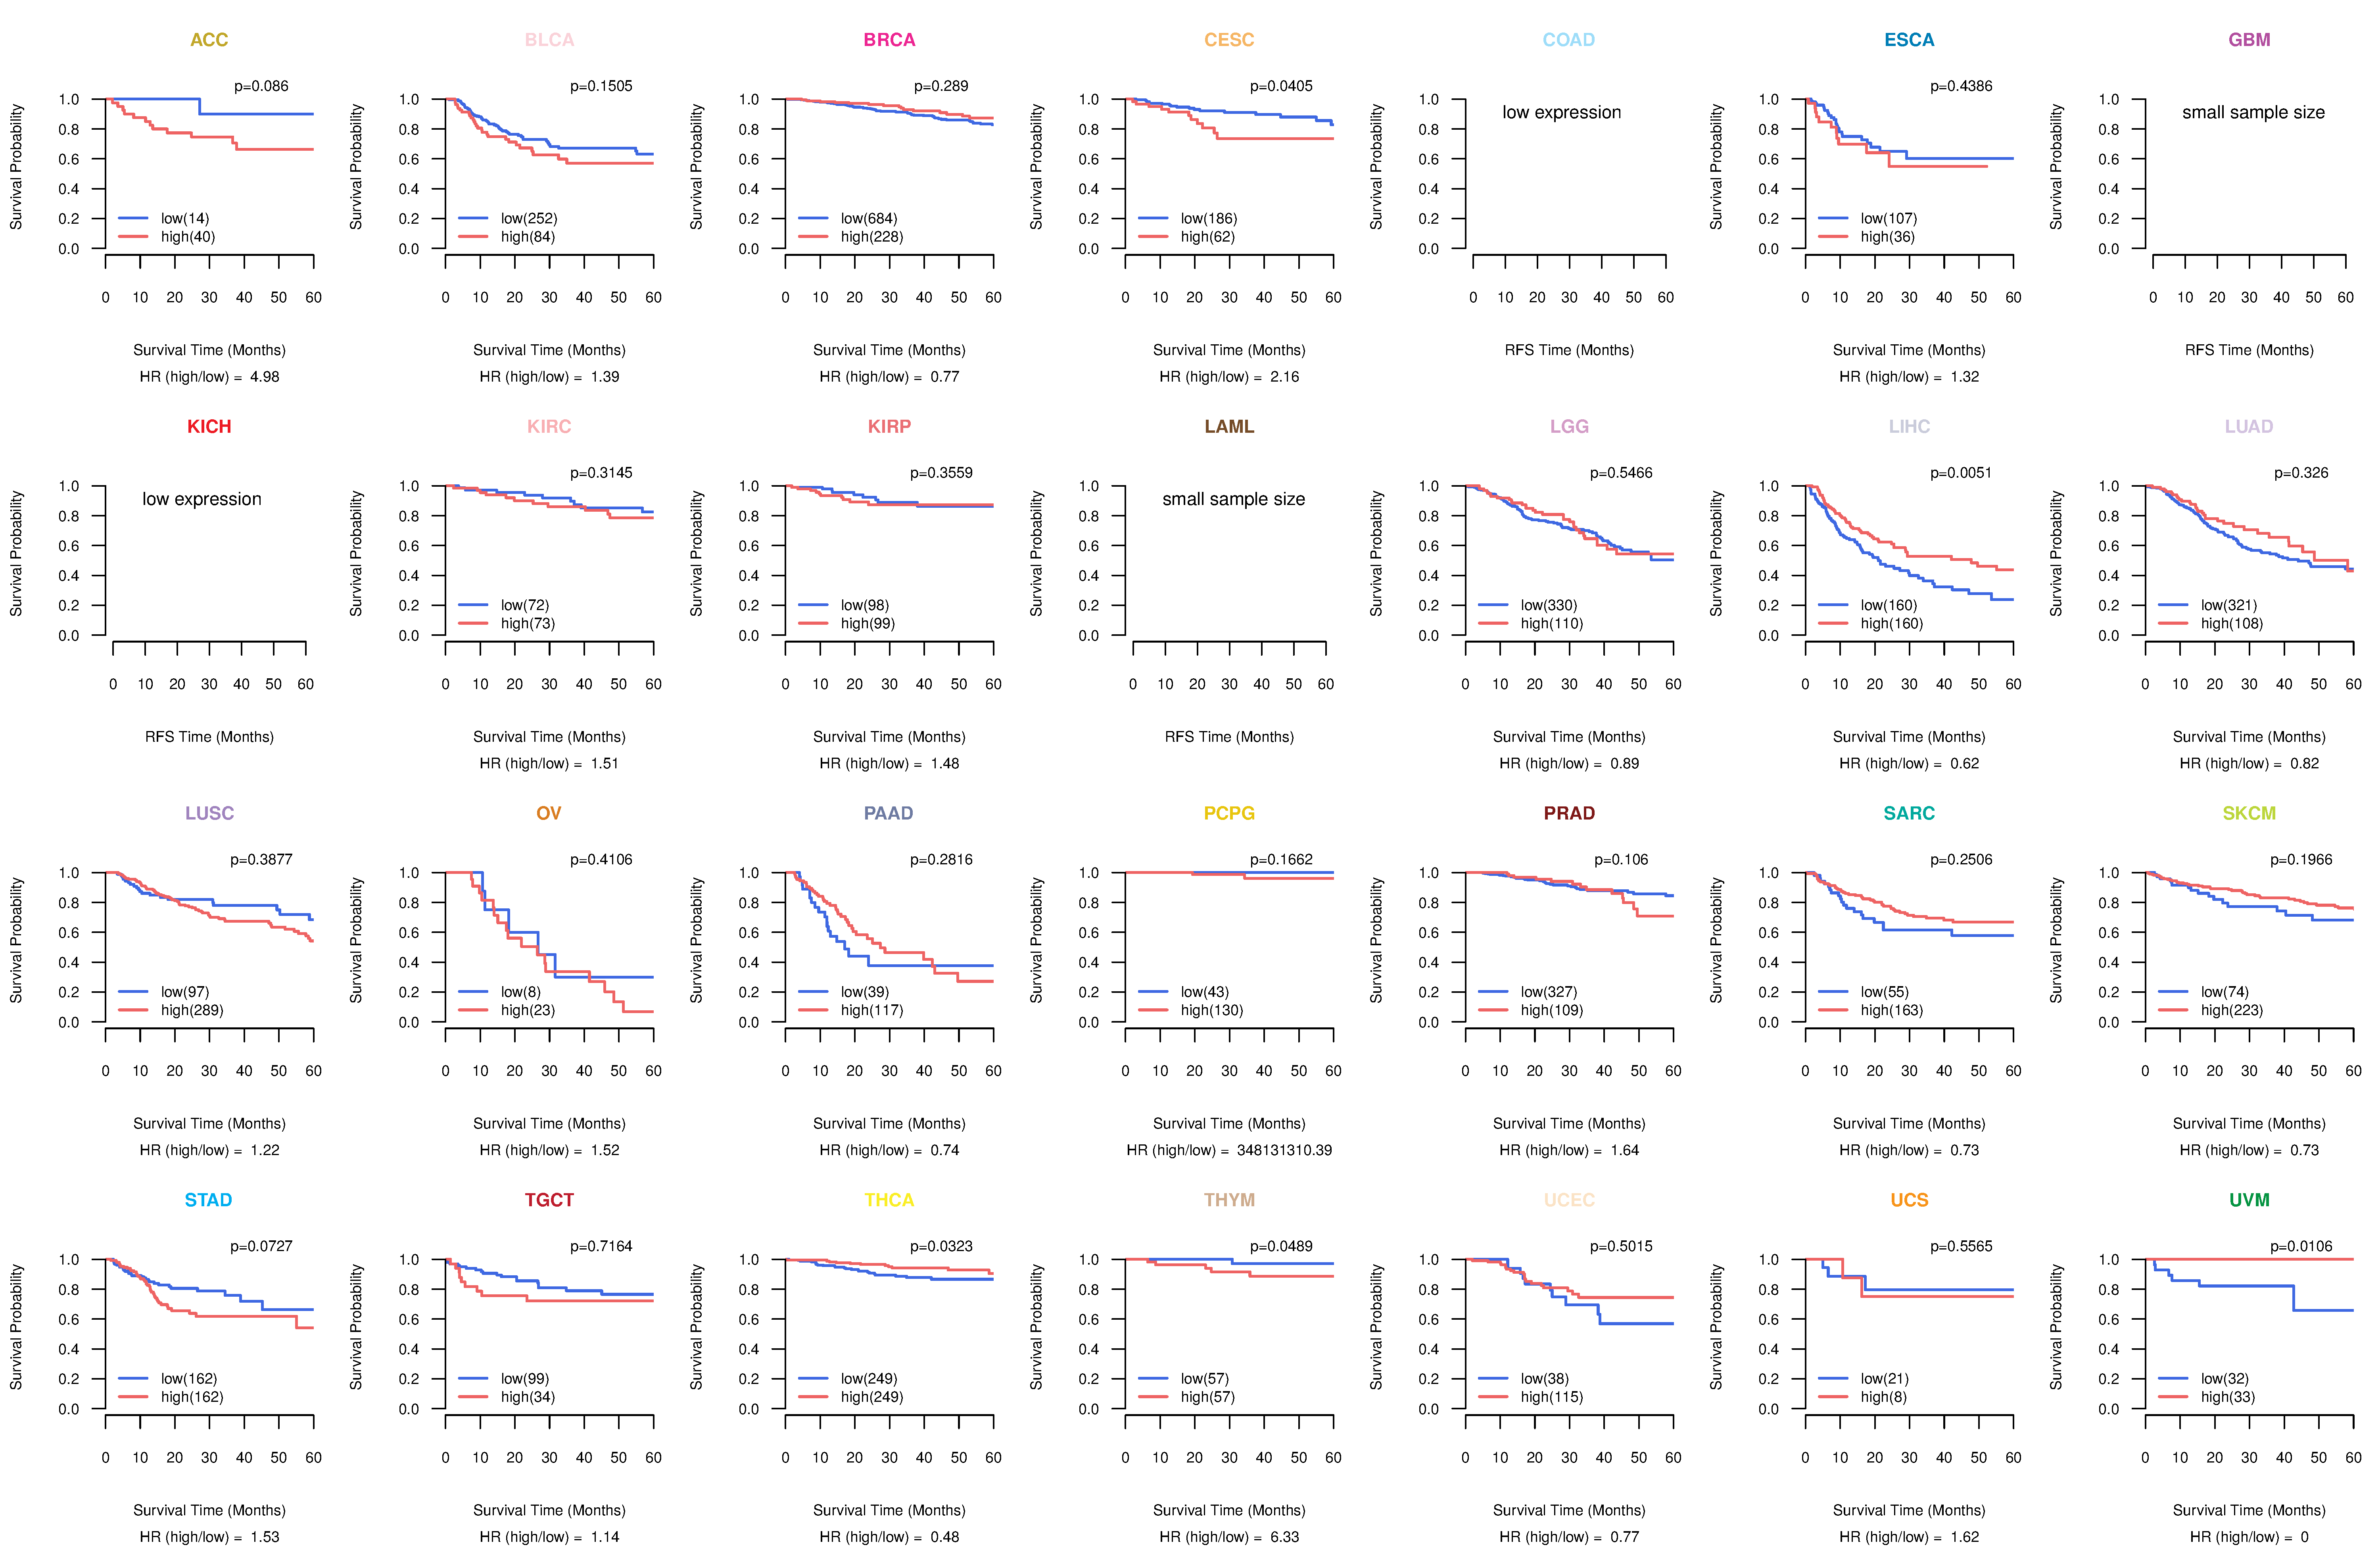
| TissGeneProg for USP44 |
| Kaplan-Meier plots with logrank tests of overall survival (OS) using 28 cancer types (TCGA IlluminaHiSeq_RNASeqV2, pan-cancer normalized log2(norm_counts+1) data, version 2016-08-16) (TCGA clinicalMatrix, phenotype data, version 2016-04-27) * Click on the image to enlarge it in a new window. |
 |
| Kaplan-Meier plots with logrank test of relapse free survival (RFS) using 28 cancer types (TCGA IlluminaHiSeq_RNASeqV2, pan-cancer normalized log2(norm_counts+1) data, version 2016-08-16) (TCGA clinicalMatrix, phenotype data, version 2016-04-27) * Click on the image enlarge it in a new window. |
 |
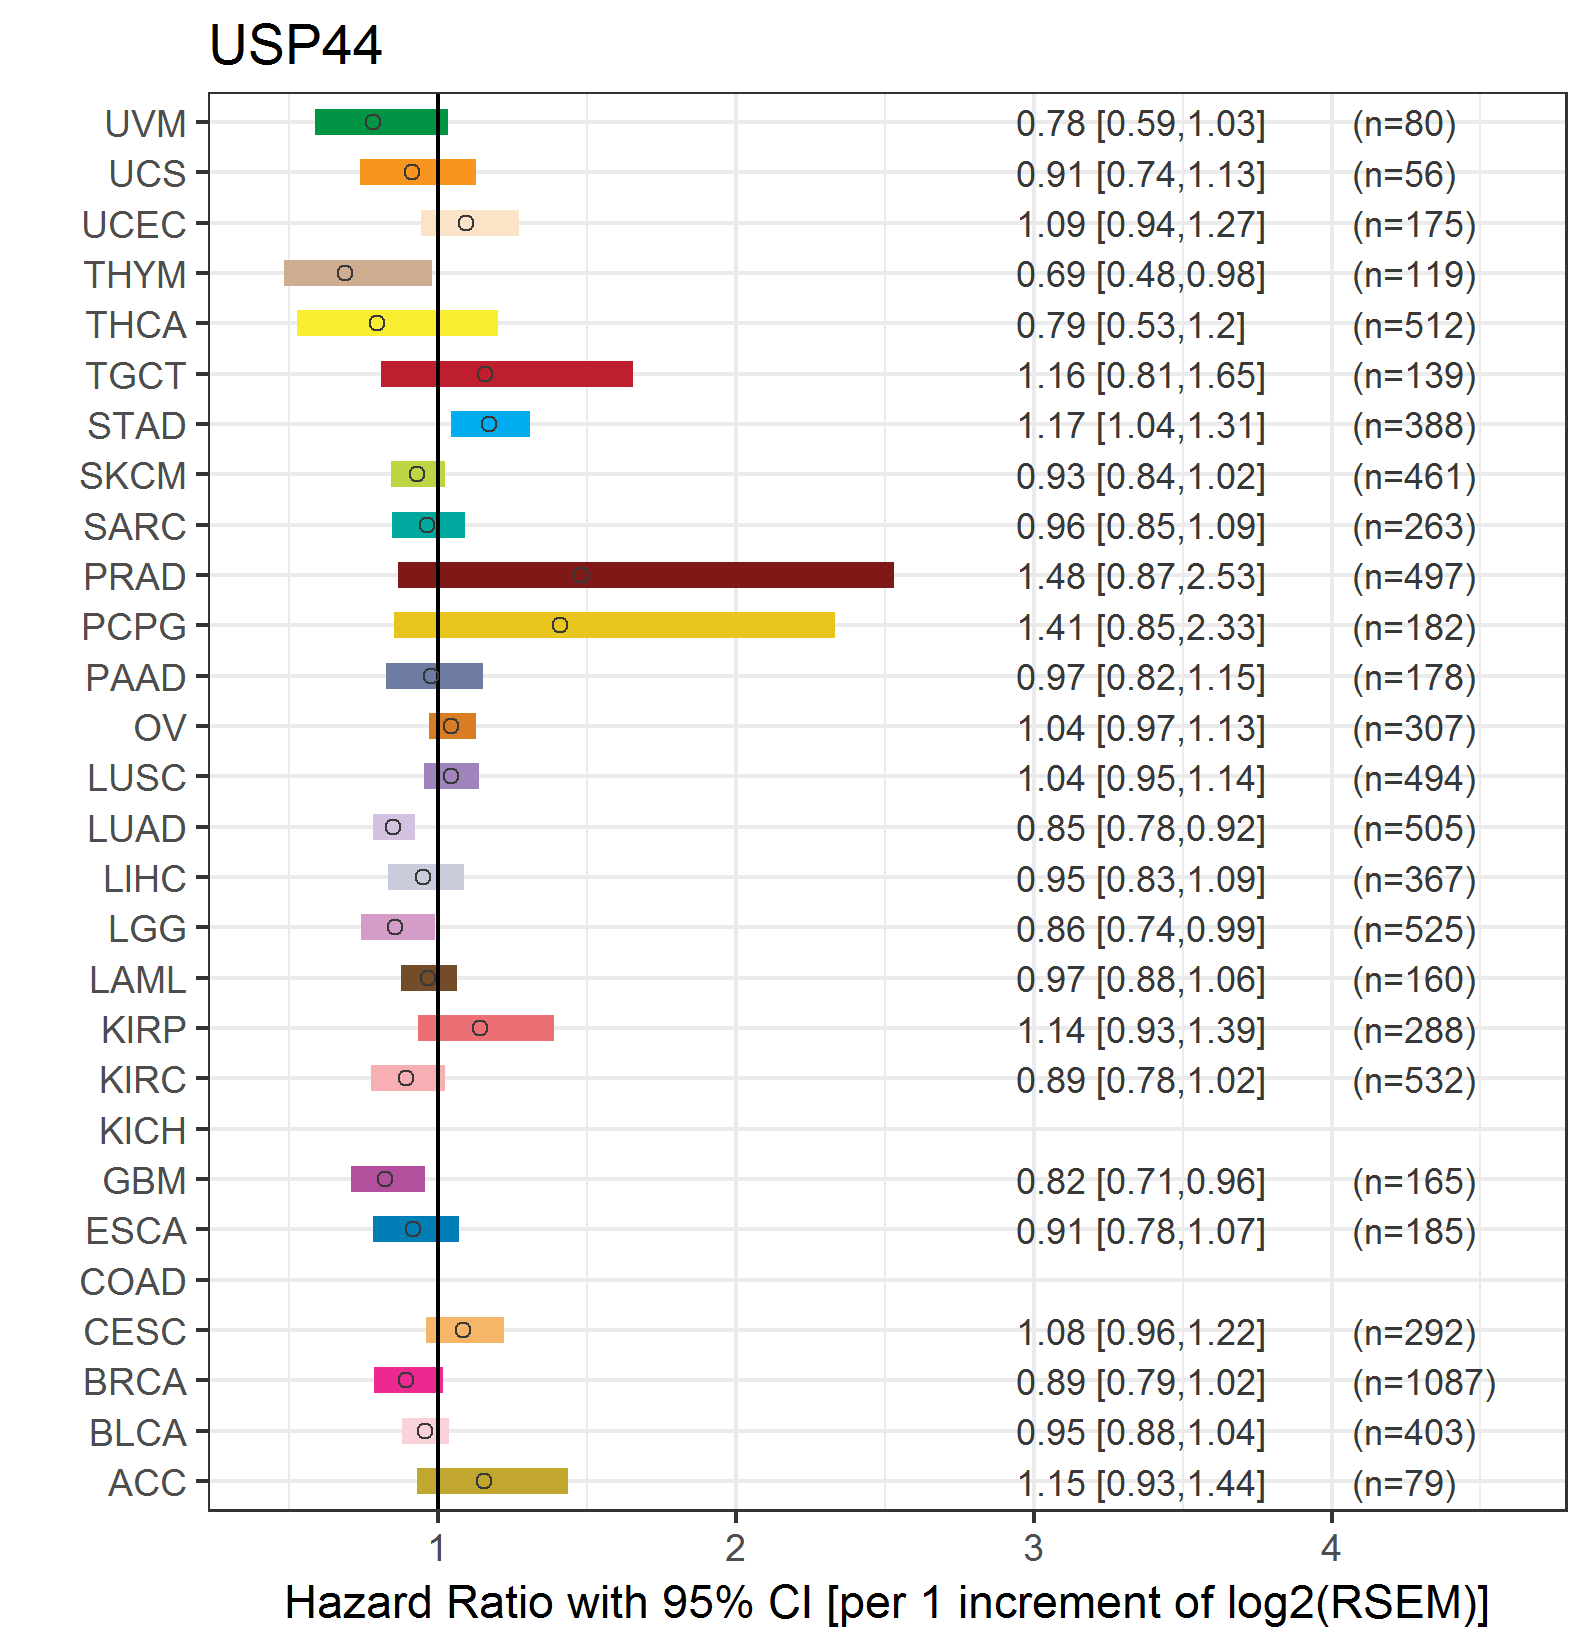
| Forest plot of Cox proportional hazard ratio (HR) and 95% CI of overall survival (OS) using 28 cancer types (TCGA IlluminaHiSeq_RNASeqV2, pan-cancer normalized log2(norm_counts+1) data, version 2016-08-16) (TCGA clinicalMatrix, phenotype data, version 2016-04-27) * Click on the image enlarge it in a new window. |
 |
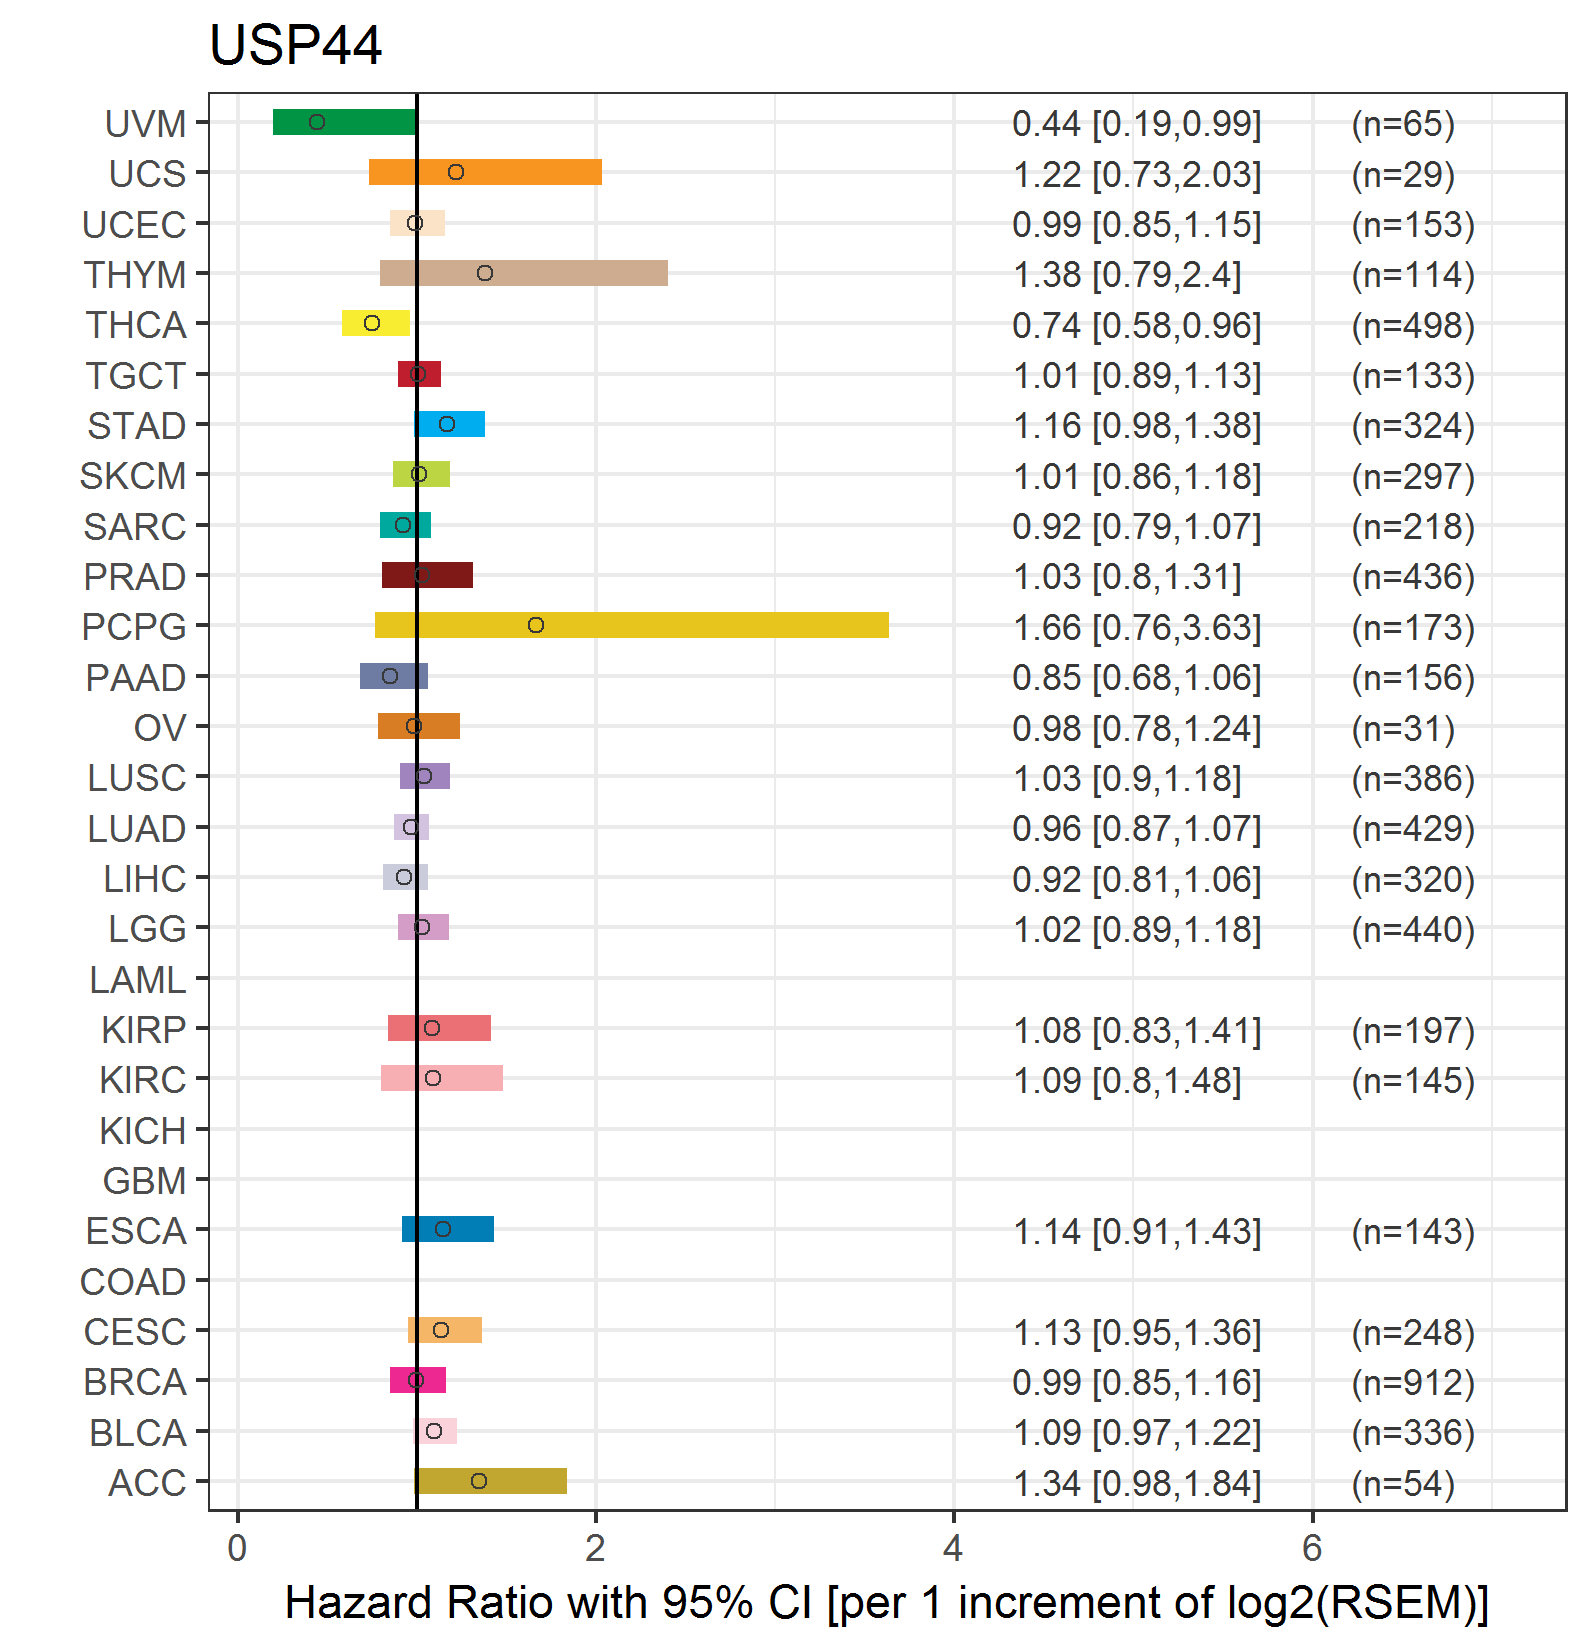
| Forest plot of Cox proportional hazard ratio (HR) and 95% CI of relapse free survival (RFS) using 28 cancer types (TCGA IlluminaHiSeq_RNASeqV2, pan-cancer normalized log2(norm_counts+1) data, version 2016-08-16) (TCGA clinicalMatrix, phenotype data, version 2016-04-27) * Click on the image enlarge it in a new window. |
 |
| Top |
| TissGeneClin for USP44 |
| TissGeneDrug for USP44 |
| Drug information targeting TissGene (DrugBank Version 5.0.6, 2017-04-01) |
| DrugBank ID | Drug name | Drug activity | Drug type | Drug status |
| Top |
| TissGeneDisease for USP44 |
| Disease information associated with TissGene (DisGeNet, 2016-06-01) |
| Disease ID | Disease name | # pubmeds | Source |
| umls:C0001430 | Adenoma | 1 | BeFree |
| umls:C0009402 | Colorectal Carcinoma | 1 | BeFree |
| umls:C0242379 | Malignant neoplasm of lung | 1 | BeFree |
| umls:C0596263 | Carcinogenesis | 1 | BeFree |
| umls:C0684249 | Carcinoma of lung | 1 | BeFree |
| umls:C1302401 | Adenoma of large intestine | 1 | BeFree |
| umls:C1527249 | Colorectal Cancer | 1 | BeFree |
|
Copyright 2016-Present - The University of Texas Health Science Center at Houston (UTHealth) Web File Viewing | How to Report, Fraud, Waste and Abuse | State of Texas | Statewide Search | Texas Homeland Security | Site Policies |