 |
| |
| |
| |
| |
| |
| |
|

| TissGeneSummary for MEX3B |
 Gene summary Gene summary |
| Basic gene information | Gene symbol | MEX3B |
| Gene name | mex-3 RNA binding family member B | |
| Synonyms | MEX-3B|RKHD3|RNF195 | |
| Cytomap | UCSC genome browser: 15q25.2 | |
| Type of gene | protein-coding | |
| RefGenes | NM_032246.4, | |
| Description | RING finger protein 195RNA-binding protein MEX3Bring finger and KH domain containing 3 | |
| Modification date | 20141207 | |
| dbXrefs | MIM : 611008 | |
| HGNC : HGNC | ||
| Ensembl : ENSG00000183496 | ||
| HPRD : 15256 | ||
| Vega : OTTHUMG00000147356 | ||
| Protein | UniProt: go to UniProt's Cross Reference DB Table | |
| Expression | CleanEX: HS_MEX3B | |
| BioGPS: 84206 | ||
| Pathway | NCI Pathway Interaction Database: MEX3B | |
| KEGG: MEX3B | ||
| REACTOME: MEX3B | ||
| Pathway Commons: MEX3B | ||
| Context | iHOP: MEX3B | |
| ligand binding site mutation search in PubMed: MEX3B | ||
| UCL Cancer Institute: MEX3B | ||
| Assigned class in TissGDB* | C | |
| Included tissue-specific gene expression resources | TiGER,GTEx | |
| Specific-tissues in normal samples (assigned by TissGDB using HPA, TiGER, and GTEx) | Testis | |
| Cancer types related to the specific-tissues in cancer samples (assigned by TissGDB using TCGA) | TGCT | |
| Reference showing the relevant tissue of MEX3B | ||
| Description by TissGene annotations | Have significant anti-correlated miRNA | |
| * Class A consists of genes with literature evidence and is part of the cTissGenes. Class B consists of only cTissGenes without additional evidence. The remaining genes belong to Class C. |
| Gene ontology having evidence of Inferred from Direct Assay (IDA) from Entrez |
| GO ID | GO term | PubMed ID |
| Top |
| TissGeneExp for MEX3B |
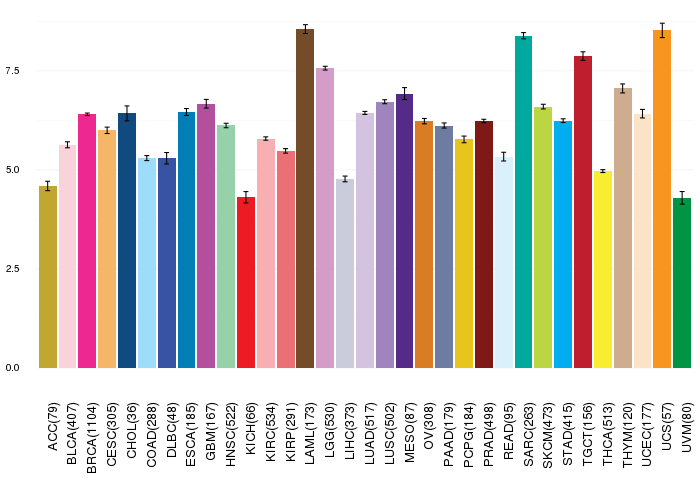
| Gene expressions across 28 cancer types (X-axis: cancer type and Y-axis: log2(norm_counts+1)) (TCGA IlluminaHiSeq_RNASeqV2, pan-cancer normalized log2(norm_counts+1) data, version 2016-08-16) |
 |
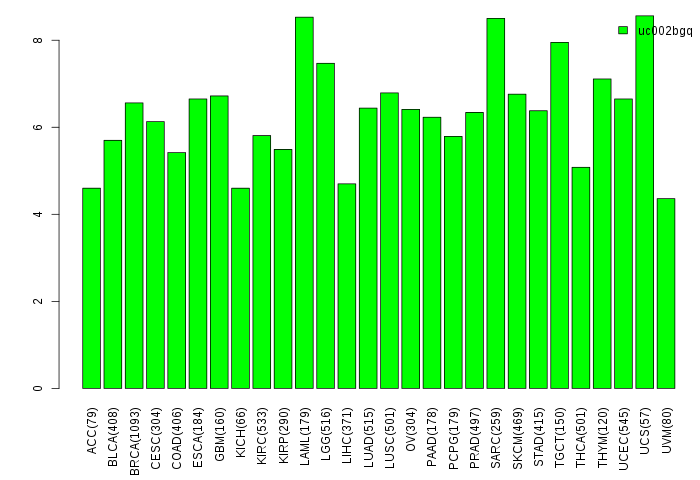
| Gene isoform expressions across 28 cancer types (X-axis: cancer type and Y-axis: log2(norm_counts+1)) (TCGA pan-cancer tcga_rsem_isoform_tpm, version 2016-09-01) |
 |
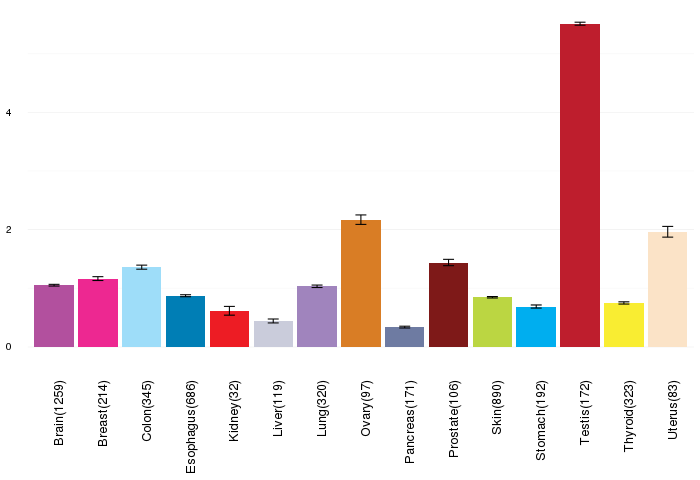
| Gene expressions across normal tissues of GTEx data (GTEx GTEx_Analysis_v6_RNA-seq_RNA-SeQCv1.1.8_gene_rpkm.gct) - Here, we shows the matched tissue types only among our 28 cancer types. |
 |
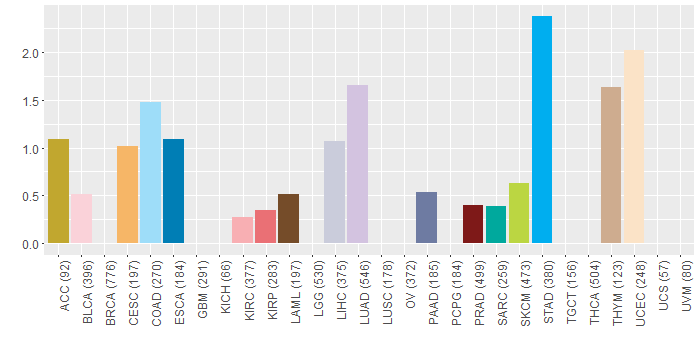
| Different expressions across 14 cancer types with more than 10 samples between matched tumors and normals (X-axis: cancer type and Y-axis: log2(norm_counts+1)) (TCGA IlluminaHiSeq_RNASeqV2, pan-cancer normalized log2(norm_counts+1) data, version 2016-08-16) |
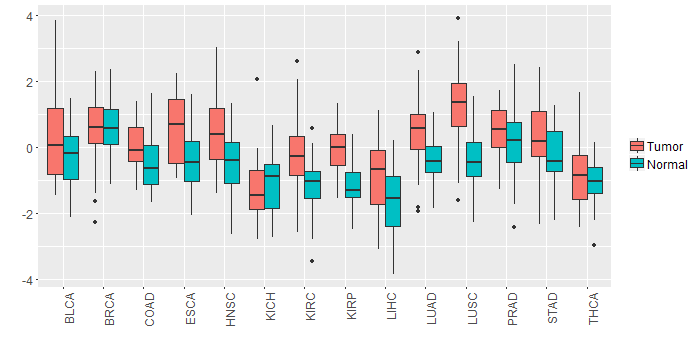 |
| - Significantly differentially expressed cancer types and information. (|Fold change|>1 and FDR<0.05) |
| Cancer type | Mean(exp) in tumor | Mean(exp) in matched normal | Log2FC | P-val. | FDR |
| KIRP | -0.055526102 | -1.120044852 | 1.06451875 | 5.35E-07 | 2.89E-06 |
| LUSC | 1.255242709 | -0.356310232 | 1.611552941 | 2.24E-13 | 1.11E-12 |
| Top |
| TissGene-miRNA for MEX3B |
| Significantly anti-correlated miRNAs of TissGene across 28 cancer types (Gene-miRNA relations from TargetScanHuman Relsease 7.1, Conserved_Site_Context_Scores.txt.zip, 06.01.2016) (TCGA IlluminaHiSeq_miRNASeq, log2(RPM+1) data, version 2016-11-21) (TCGA IlluminaHiSeq_RNASeqV2, log2(normalized_count+1) data, version 2016-08-16) (Spearman’s Rank Correlation (p-value<0.05 and coefficient<-0.25)) |
| Cancer type | miRNA id | miRNA accession | P-val. | Coeff. | # samples |
| THYM | hsa-miR-520d-3p | MIMAT0002856 | 0.0033 | -0.28 | 122 |
| THYM | hsa-miR-520e | MIMAT0002825 | 0.0081 | -0.3 | 122 |
| Top |
| TissGeneMut for MEX3B |
| TissGeneSNV for MEX3B |
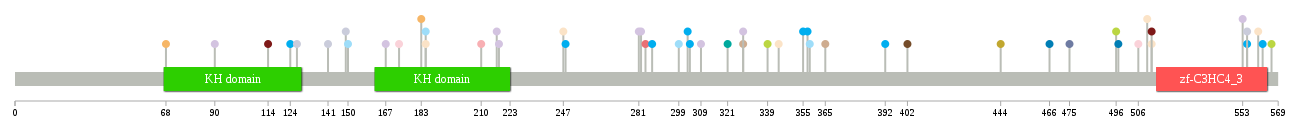
| nsSNV counts per each loci. Different colors of circles represent different cancer types. Circle size denotes number of samples. (TCGA somatic mutation (SNPs and small INDELs) data, version 2016-04-25) * Click on the image to enlarge it in a new window. |
 |
 |
| Somatic nucleotide variants of TissGene across 28 cancer types (X-axis: cancer type and Y-axis: % of mutated samples) The numbers in parentheses are numbers of samples with mutation (nsSNVs). (TCGA somatic mutation (SNPs and small INDELs) data, version 2016-04-25) |
 |
| - nsSNVs sorted by frequency. |
| AAchange | Cancer type | # samples |
| p.R512H | UCEC | 1 |
| p.A150T | COAD | 1 |
| p.D287N | STAD | 1 |
| p.A309S | LUAD | 1 |
| p.M210I | KIRC | 1 |
| p.S299C | COAD | 1 |
| p.R185H | UCEC | 1 |
| p.V392I | STAD | 1 |
| p.P321S | SARC | 1 |
| p.A344P | UCEC | 1 |
| p.D247N | UCEC | 1 |
| p.R512H | PRAD | 1 |
| p.R566C | SKCM | 1 |
| p.E553K | LUAD | 1 |
| p.V248A | STAD | 1 |
| p.K90N | LUAD | 1 |
| p.I183M | CESC | 1 |
| p.P365L | THYM | 1 |
| p.R124Q | STAD | 1 |
| p.L510I | UCEC | 1 |
| p.R185H | COAD | 1 |
| p.A328T | THYM | 1 |
| p.G339R | SKCM | 1 |
| p.A328V | LUAD | 1 |
| p.R141Q | LIHC | 1 |
| p.G303S | STAD | 1 |
| p.P555Q | LIHC | 1 |
| p.S506Y | BLCA | 1 |
| p.G466* | ESCA | 1 |
| p.G173R | BLCA | 1 |
| p.A217S | LUAD | 1 |
| p.T114M | PRAD | 1 |
| p.S496L | SKCM | 1 |
| p.V167L | LUAD | 1 |
| p.P555L | STAD | 1 |
| p.R218L | LUAD | 1 |
| p.Y284C | KIRP | 1 |
| p.P555R | HNSC | 1 |
| p.S497C | ESCA | 1 |
| p.P357H | STAD | 1 |
| p.I127T | LIHC | 1 |
| p.A121P | HNSC | 1 |
| p.S282C | LUAD | 1 |
| p.E358K | COAD | 1 |
| p.G355S | STAD | 1 |
| p.F281L | LUAD | 1 |
| p.A560T | UCEC | 1 |
| p.A475V | PAAD | 1 |
| p.G149D | LIHC | 1 |
| p.E68Q | CESC | 1 |
| p.G304R | STAD | 1 |
| p.T562I | STAD | 1 |
| p.P444R | ACC | 1 |
| p.S402P | LAML | 1 |
| Top |
| TissGeneCNV for MEX3B |
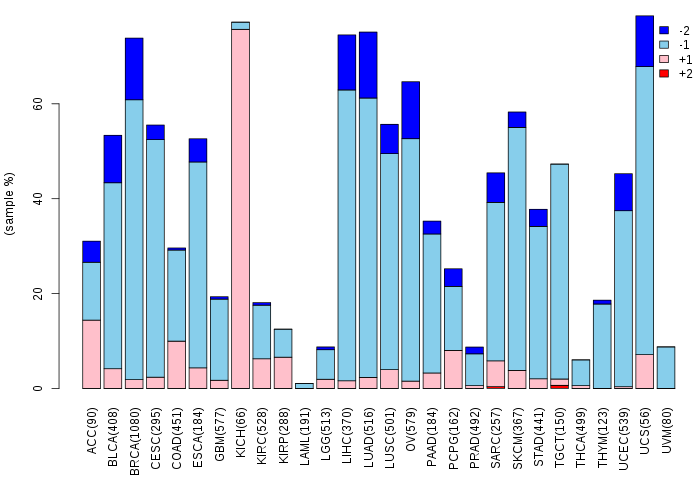
| Copy number variations of TissGene across 28 cancer types (X-axis: cancer type and Y-axis: % of CNV samples) (TCGA Gistic2_CopyNumber_Gistic2_all_data_by_genes, Gistic2 copy number data, version 2016-08-16) |
 |
| Top |
| TissGeneFusions for MEX3B |
| Fusion genes including TissGene (ChimerDB 3.0, 2016-12-01 and TCGA fusion Portal 2015-12-01) |
| Database | Src | Cancer type | Sample | Fusion gene | ORF | 5'-gene BP | 3'-gene BP |
| Top |
| TissGeneNet for MEX3B |
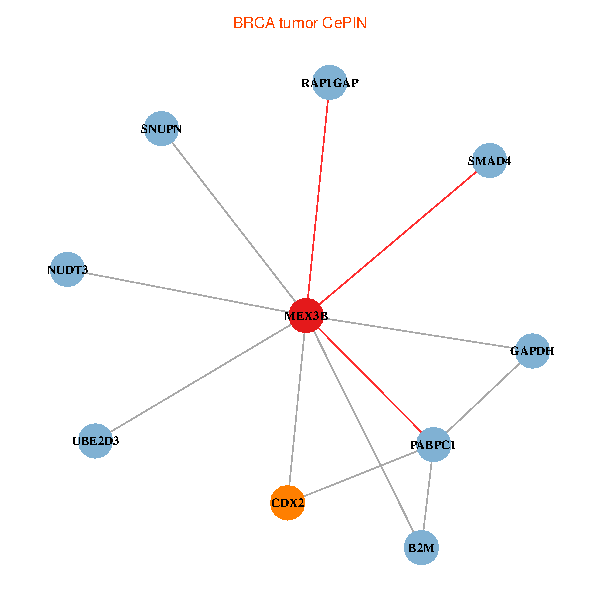
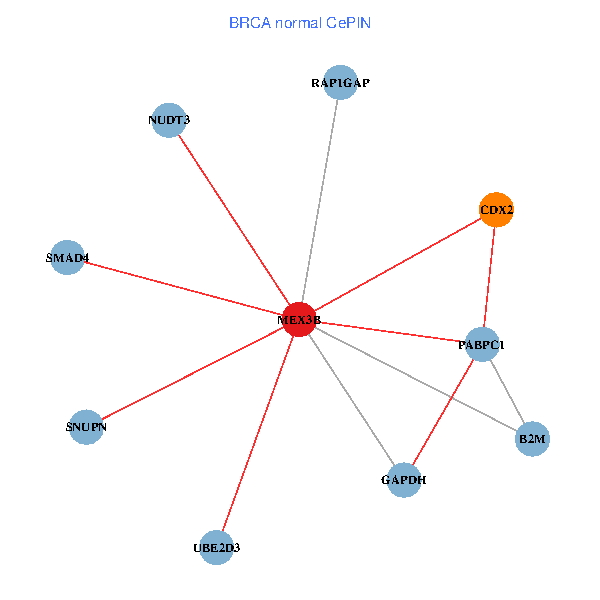
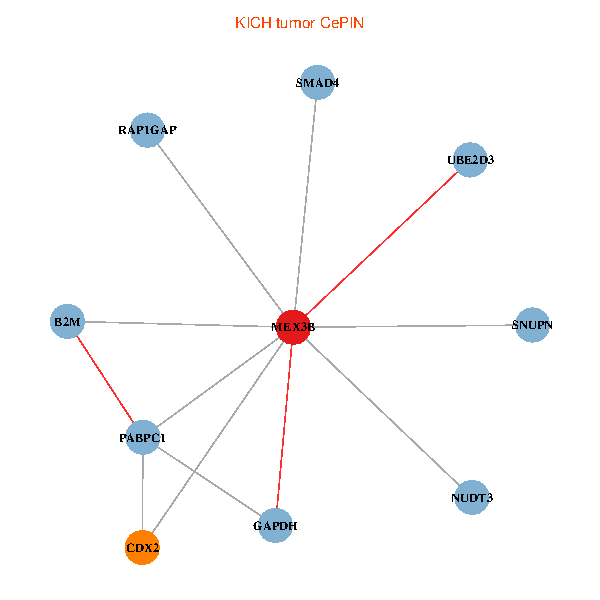
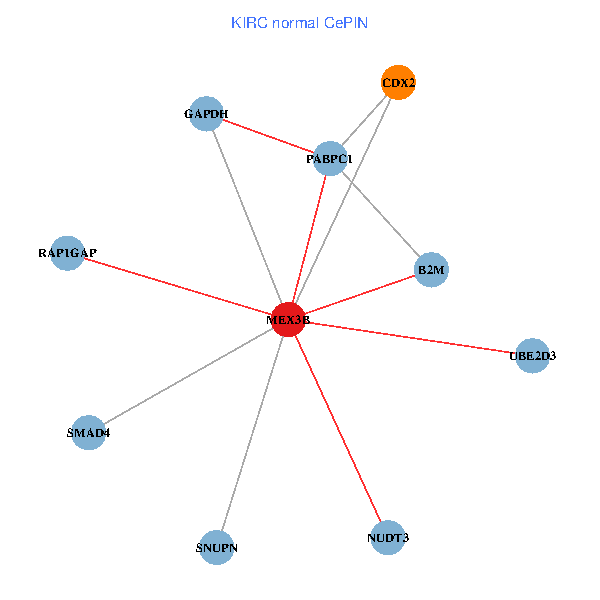
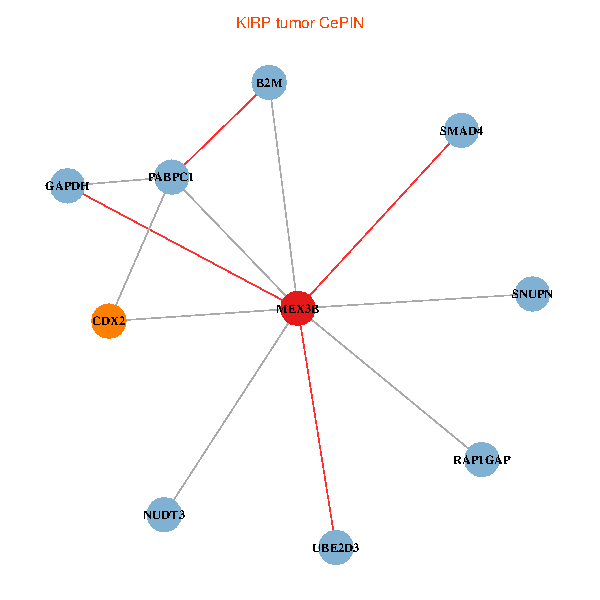
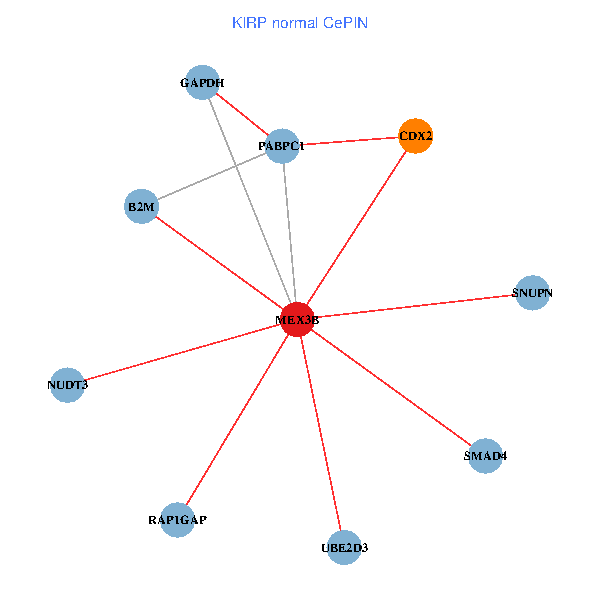
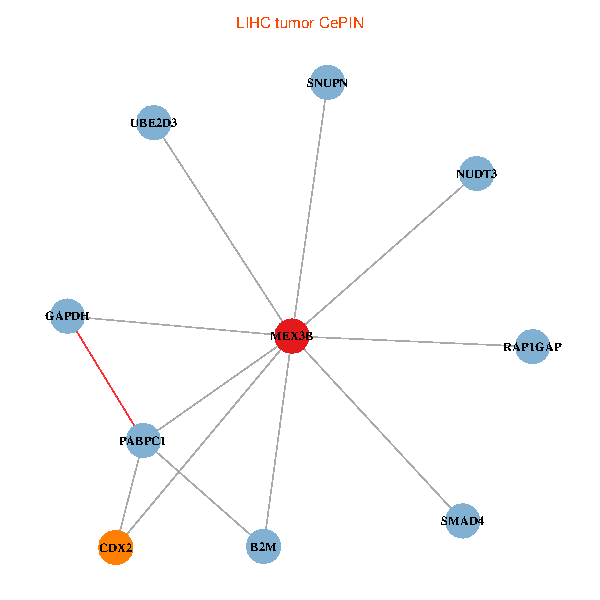
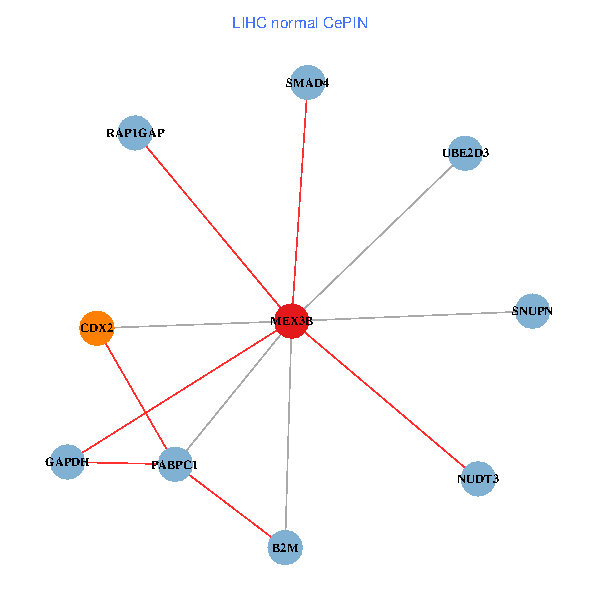
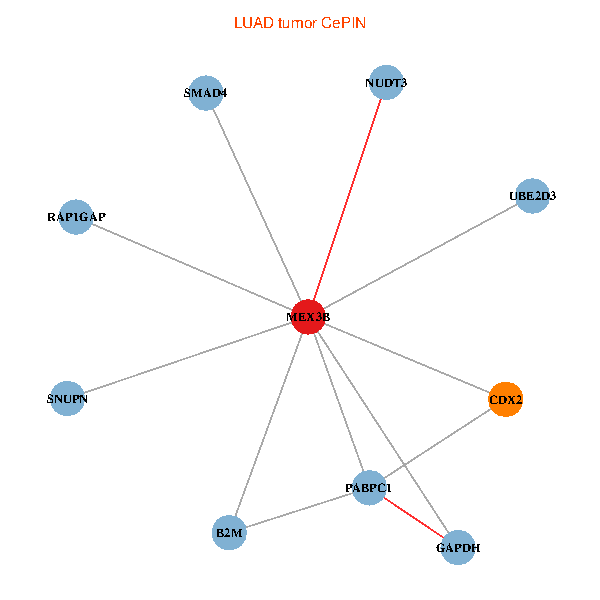
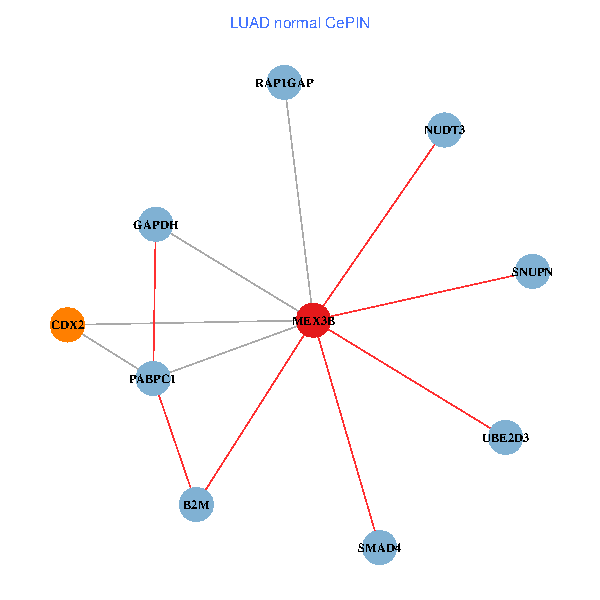
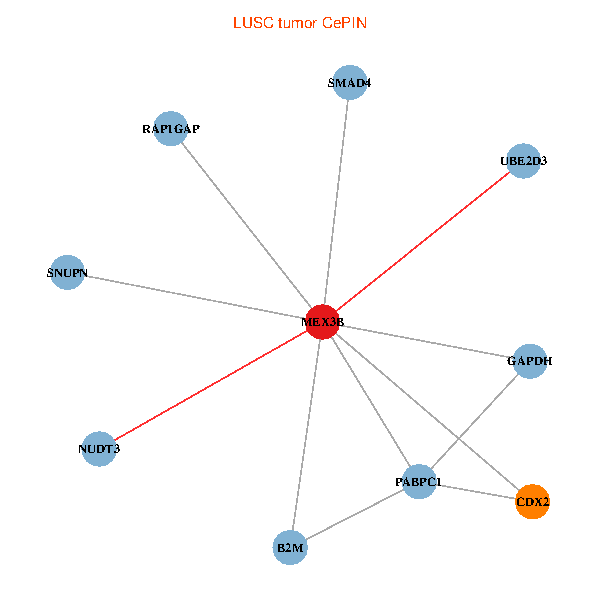
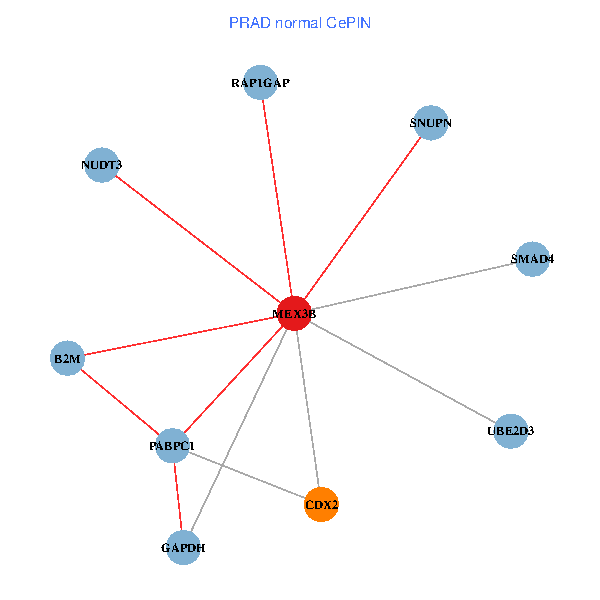
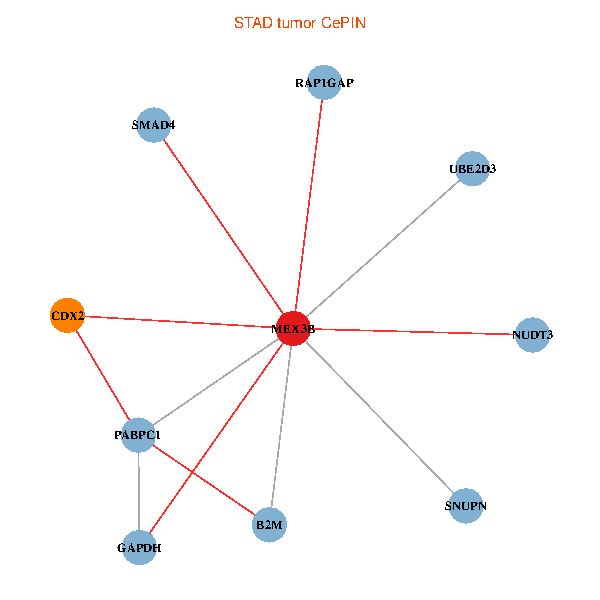
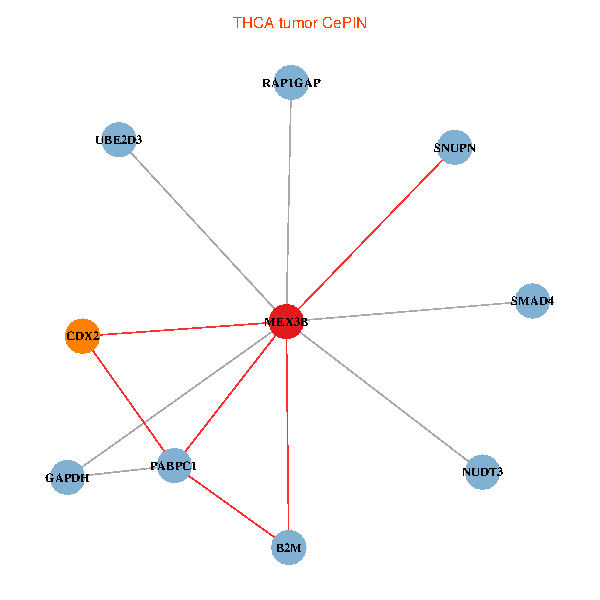
| Co-expressed gene networks based on protein-protein interaction data (CePIN) (TCGA IlluminaHiSeq_RNASeqV2, pan-cancer normalized log2(norm_counts+1) data, version 2016-08-16) (PINA2 ppi data) |
| BRCA (tumor) | BRCA (normal) |
| MEX3B, NUDT3, RAP1GAP, GAPDH, SMAD4, UBE2D3, B2M, PABPC1, SNUPN, CDX2 (tumor) | MEX3B, NUDT3, RAP1GAP, GAPDH, SMAD4, UBE2D3, B2M, PABPC1, SNUPN, CDX2 (normal) |
 |  |
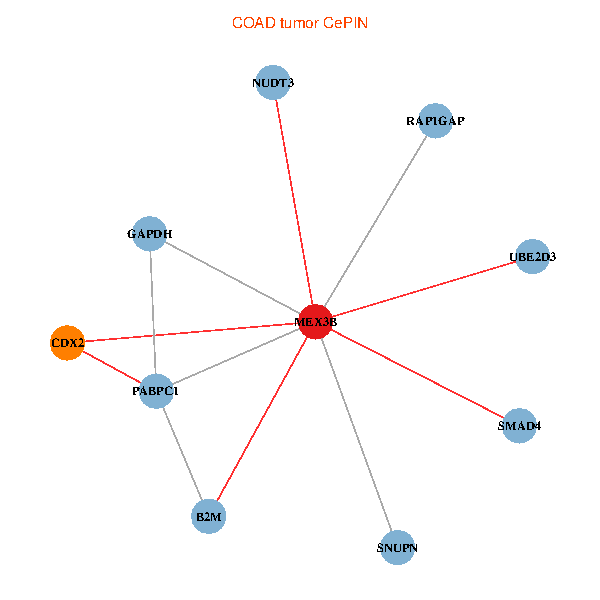
| COAD (tumor) | COAD (normal) |
| MEX3B, NUDT3, RAP1GAP, GAPDH, SMAD4, UBE2D3, B2M, PABPC1, SNUPN, CDX2 (tumor) | MEX3B, NUDT3, RAP1GAP, GAPDH, SMAD4, UBE2D3, B2M, PABPC1, SNUPN, CDX2 (normal) |
 |  |
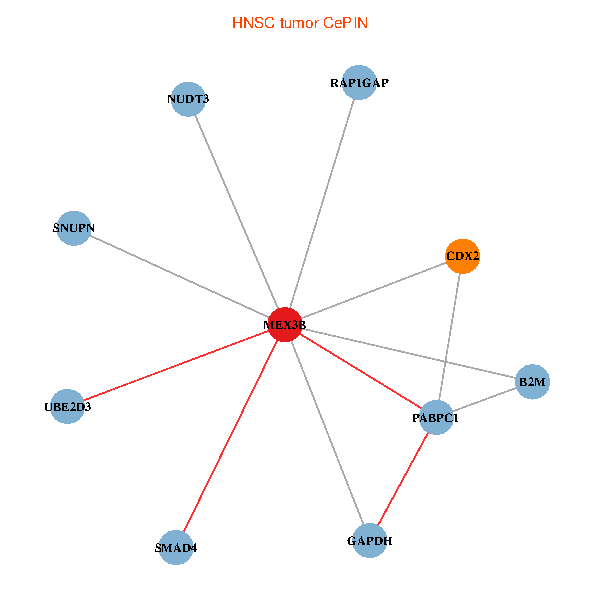
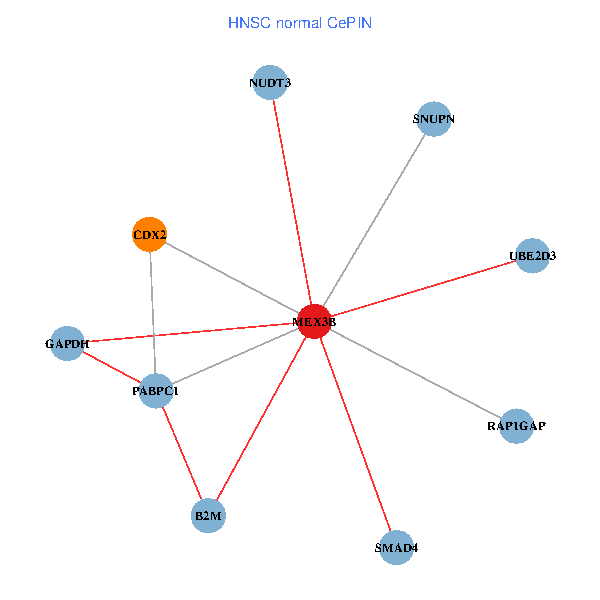
| HNSC (tumor) | HNSC (normal) |
| MEX3B, NUDT3, RAP1GAP, GAPDH, SMAD4, UBE2D3, B2M, PABPC1, SNUPN, CDX2 (tumor) | MEX3B, NUDT3, RAP1GAP, GAPDH, SMAD4, UBE2D3, B2M, PABPC1, SNUPN, CDX2 (normal) |
 |  |
| KICH (tumor) | KICH (normal) |
| MEX3B, NUDT3, RAP1GAP, GAPDH, SMAD4, UBE2D3, B2M, PABPC1, SNUPN, CDX2 (tumor) | MEX3B, NUDT3, RAP1GAP, GAPDH, SMAD4, UBE2D3, B2M, PABPC1, SNUPN, CDX2 (normal) |
 |  |
| KIRC (tumor) | KIRC (normal) |
| MEX3B, NUDT3, RAP1GAP, GAPDH, SMAD4, UBE2D3, B2M, PABPC1, SNUPN, CDX2 (tumor) | MEX3B, NUDT3, RAP1GAP, GAPDH, SMAD4, UBE2D3, B2M, PABPC1, SNUPN, CDX2 (normal) |
 |  |
| KIRP (tumor) | KIRP (normal) |
| MEX3B, NUDT3, RAP1GAP, GAPDH, SMAD4, UBE2D3, B2M, PABPC1, SNUPN, CDX2 (tumor) | MEX3B, NUDT3, RAP1GAP, GAPDH, SMAD4, UBE2D3, B2M, PABPC1, SNUPN, CDX2 (normal) |
 |  |
| LIHC (tumor) | LIHC (normal) |
| MEX3B, NUDT3, RAP1GAP, GAPDH, SMAD4, UBE2D3, B2M, PABPC1, SNUPN, CDX2 (tumor) | MEX3B, NUDT3, RAP1GAP, GAPDH, SMAD4, UBE2D3, B2M, PABPC1, SNUPN, CDX2 (normal) |
 |  |
| LUAD (tumor) | LUAD (normal) |
| MEX3B, NUDT3, RAP1GAP, GAPDH, SMAD4, UBE2D3, B2M, PABPC1, SNUPN, CDX2 (tumor) | MEX3B, NUDT3, RAP1GAP, GAPDH, SMAD4, UBE2D3, B2M, PABPC1, SNUPN, CDX2 (normal) |
 |  |
| LUSC (tumor) | LUSC (normal) |
| MEX3B, NUDT3, RAP1GAP, GAPDH, SMAD4, UBE2D3, B2M, PABPC1, SNUPN, CDX2 (tumor) | MEX3B, NUDT3, RAP1GAP, GAPDH, SMAD4, UBE2D3, B2M, PABPC1, SNUPN, CDX2 (normal) |
 |  |
| PRAD (tumor) | PRAD (normal) |
| MEX3B, NUDT3, RAP1GAP, GAPDH, SMAD4, UBE2D3, B2M, PABPC1, SNUPN, CDX2 (tumor) | MEX3B, NUDT3, RAP1GAP, GAPDH, SMAD4, UBE2D3, B2M, PABPC1, SNUPN, CDX2 (normal) |
 |  |
| STAD (tumor) | STAD (normal) |
| MEX3B, NUDT3, RAP1GAP, GAPDH, SMAD4, UBE2D3, B2M, PABPC1, SNUPN, CDX2 (tumor) | MEX3B, NUDT3, RAP1GAP, GAPDH, SMAD4, UBE2D3, B2M, PABPC1, SNUPN, CDX2 (normal) |
 |  |
| THCA (tumor) | THCA (normal) |
| MEX3B, NUDT3, RAP1GAP, GAPDH, SMAD4, UBE2D3, B2M, PABPC1, SNUPN, CDX2 (tumor) | MEX3B, NUDT3, RAP1GAP, GAPDH, SMAD4, UBE2D3, B2M, PABPC1, SNUPN, CDX2 (normal) |
 |  |
| Top |
| TissGeneProg for MEX3B |
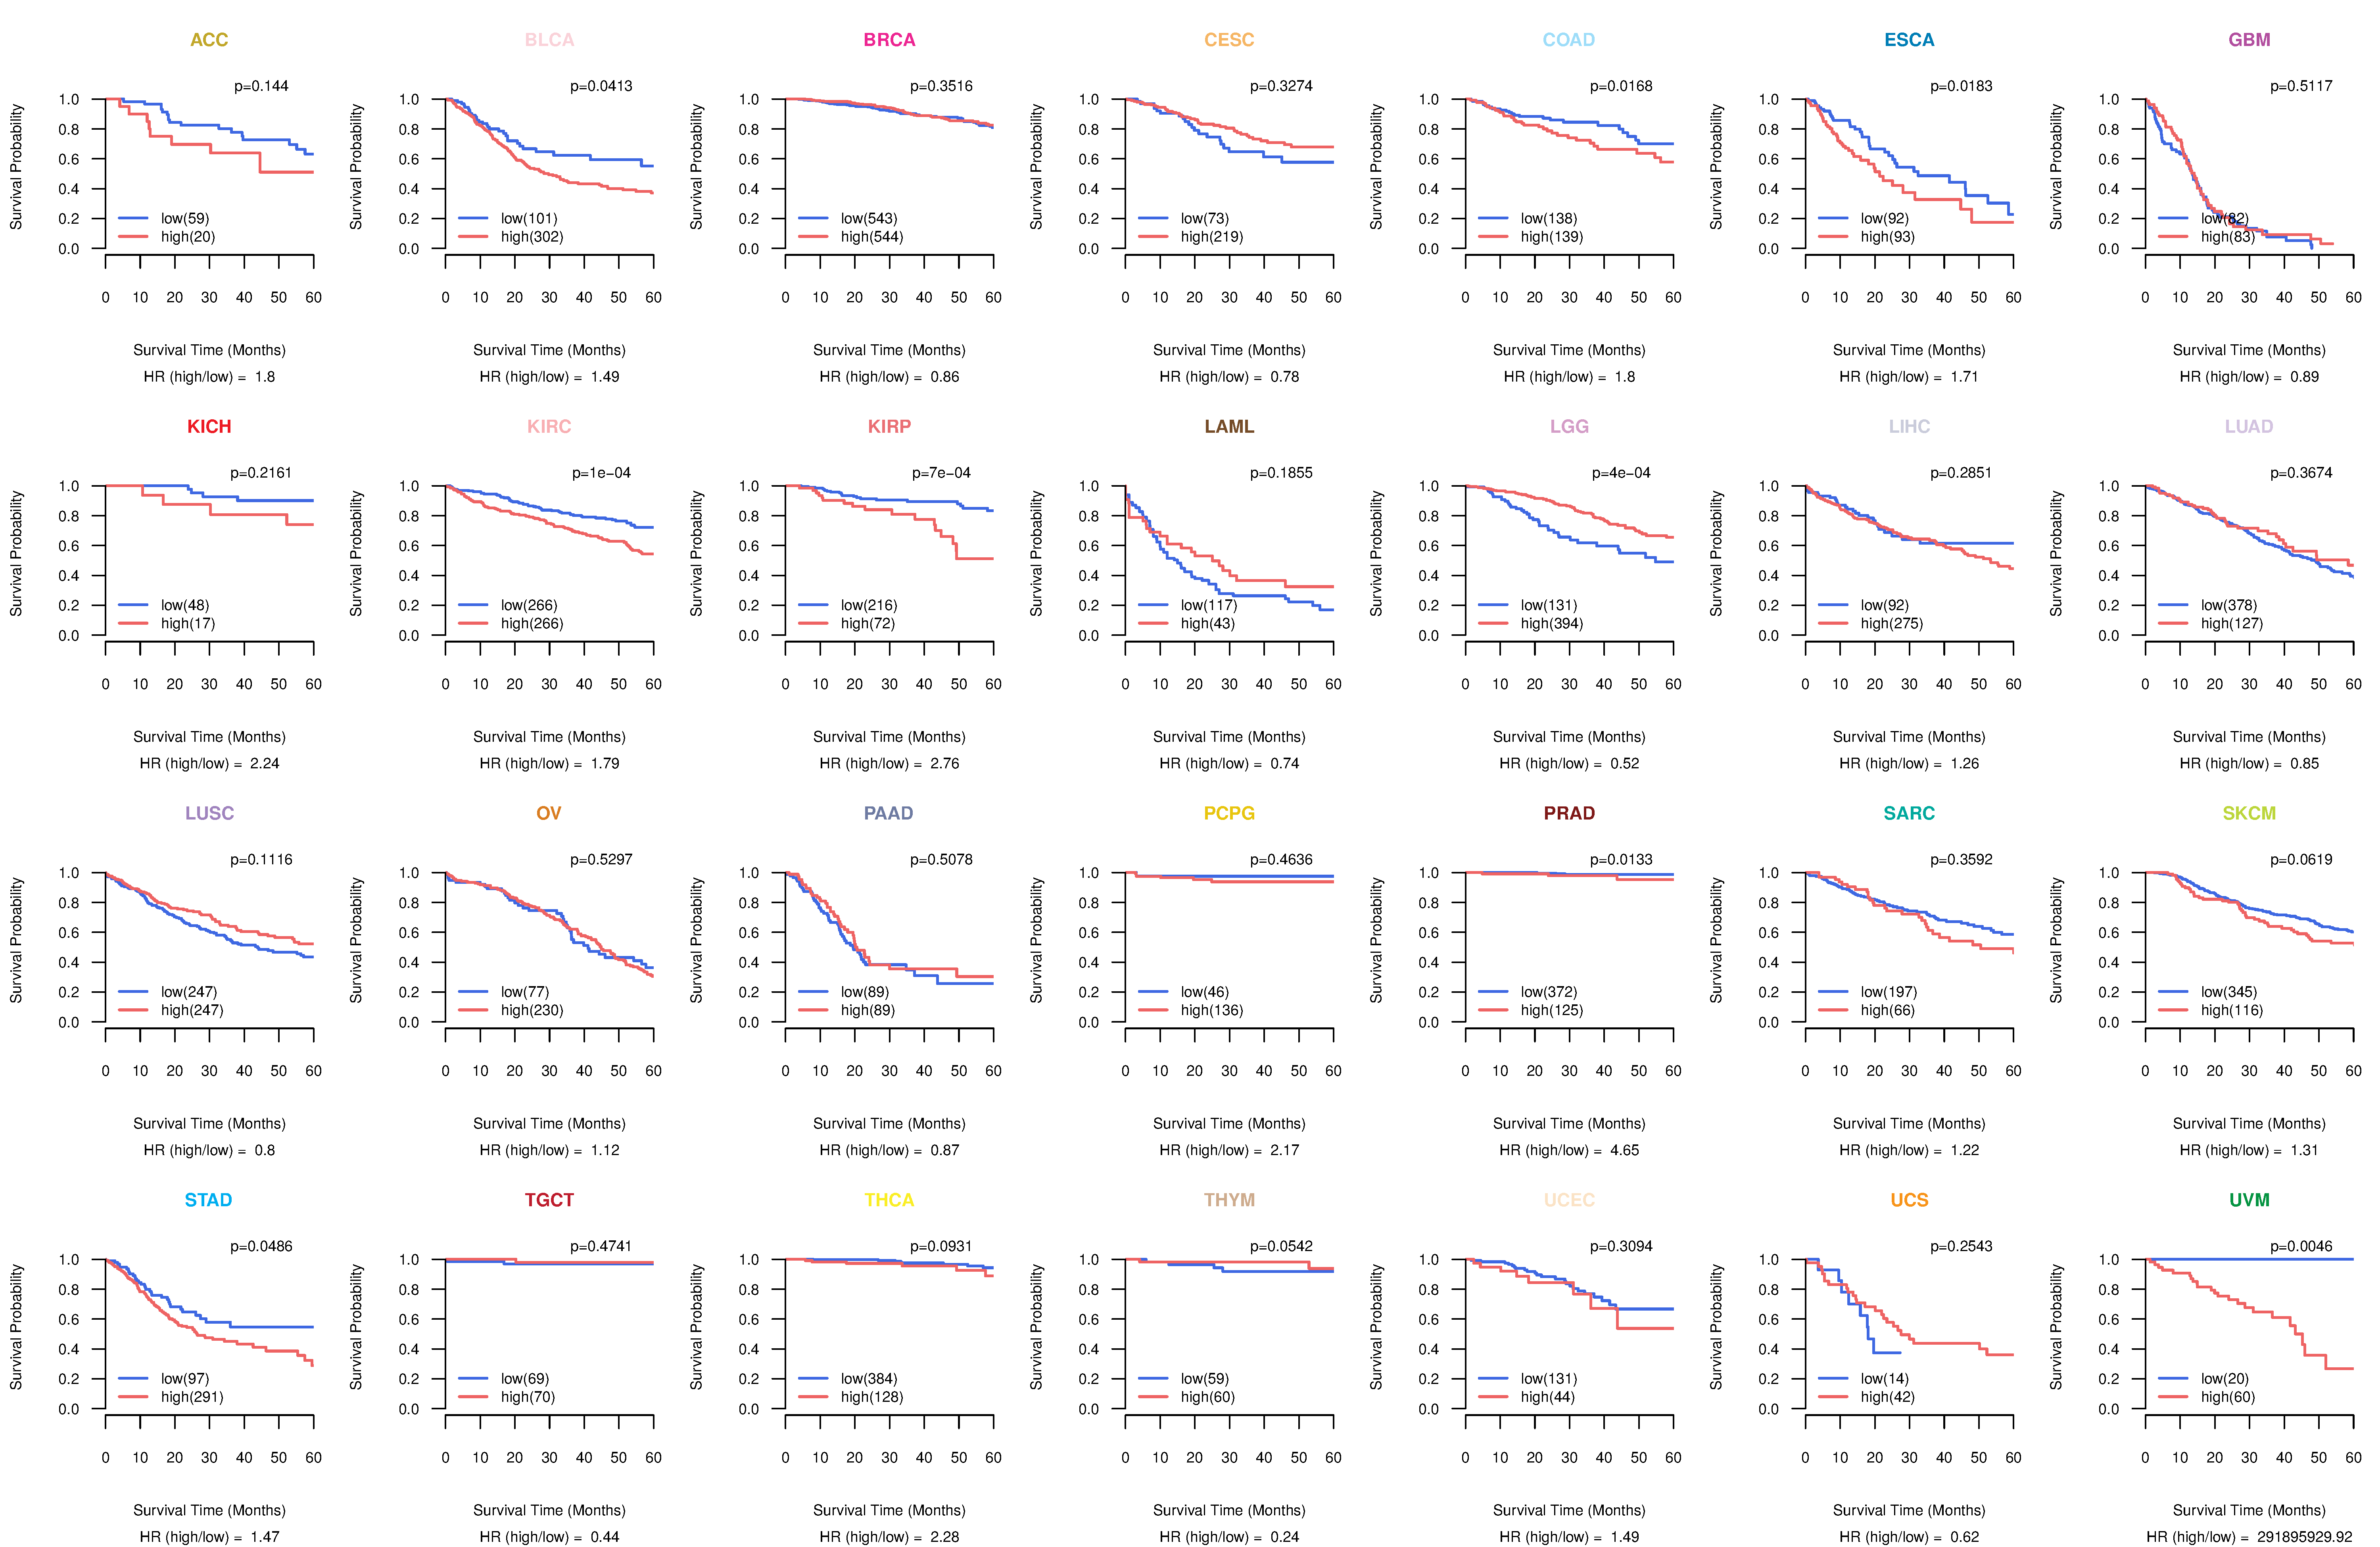
| Kaplan-Meier plots with logrank tests of overall survival (OS) using 28 cancer types (TCGA IlluminaHiSeq_RNASeqV2, pan-cancer normalized log2(norm_counts+1) data, version 2016-08-16) (TCGA clinicalMatrix, phenotype data, version 2016-04-27) * Click on the image to enlarge it in a new window. |
 |
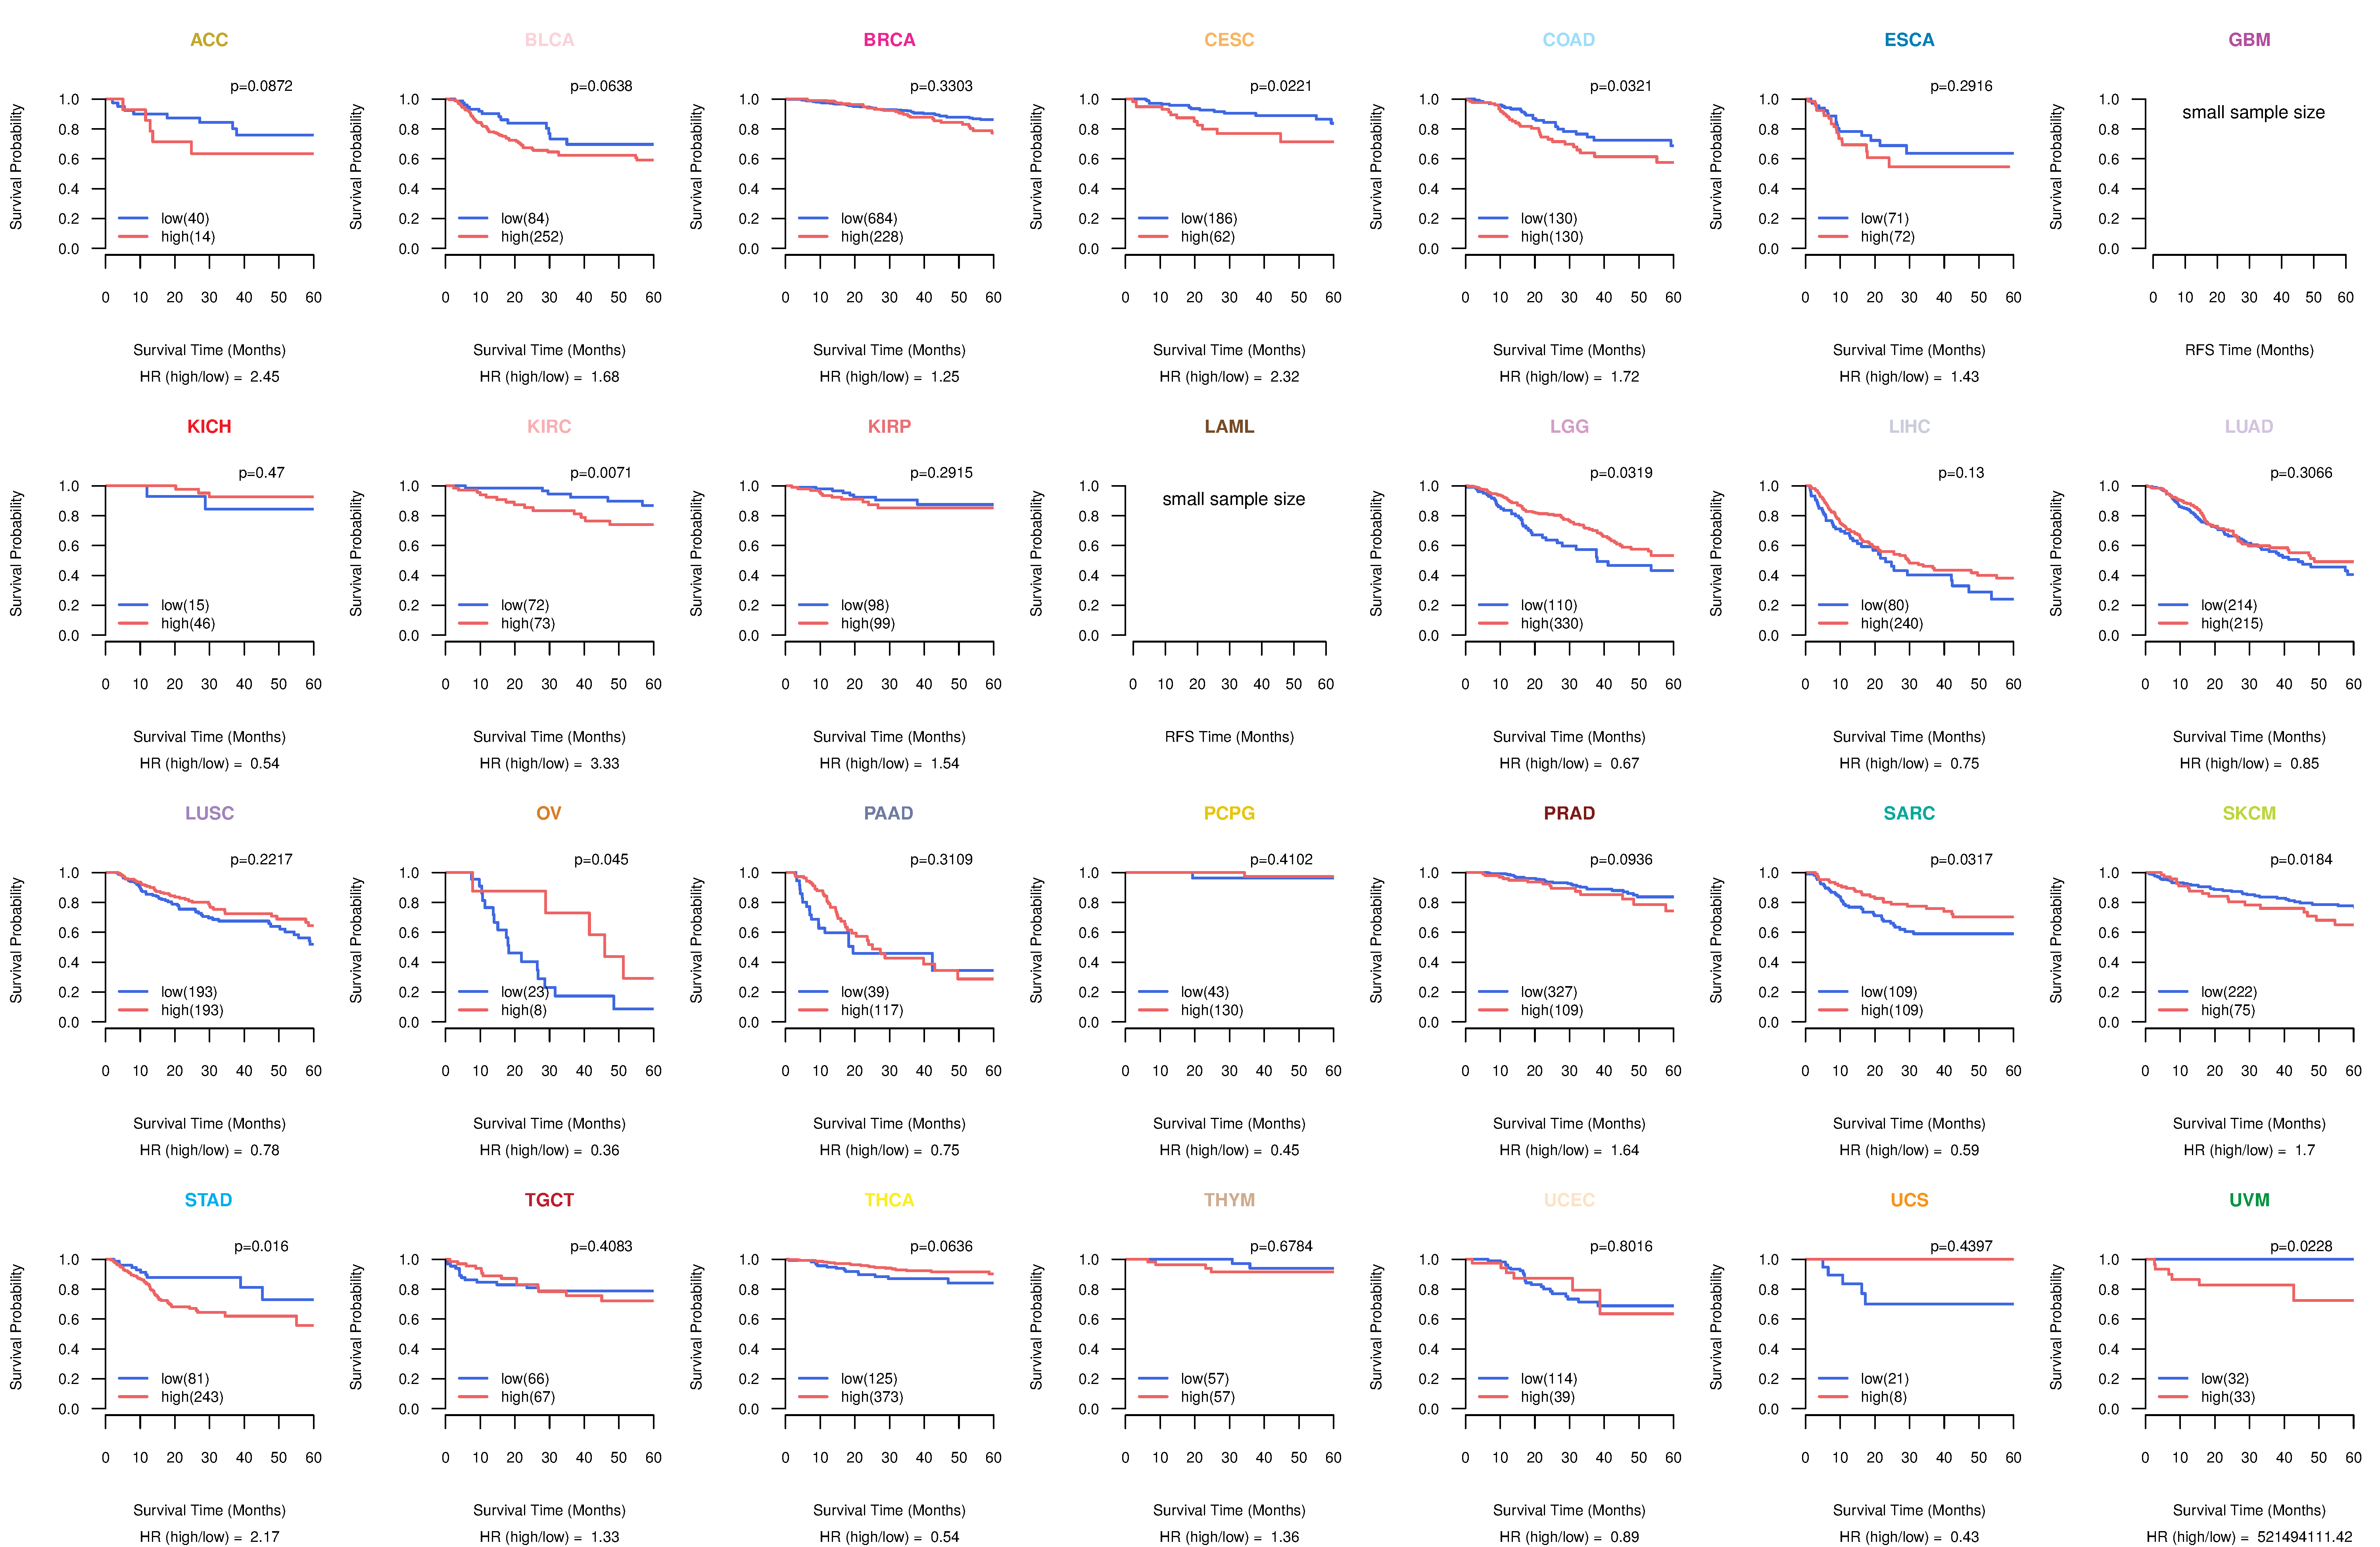
| Kaplan-Meier plots with logrank test of relapse free survival (RFS) using 28 cancer types (TCGA IlluminaHiSeq_RNASeqV2, pan-cancer normalized log2(norm_counts+1) data, version 2016-08-16) (TCGA clinicalMatrix, phenotype data, version 2016-04-27) * Click on the image enlarge it in a new window. |
 |
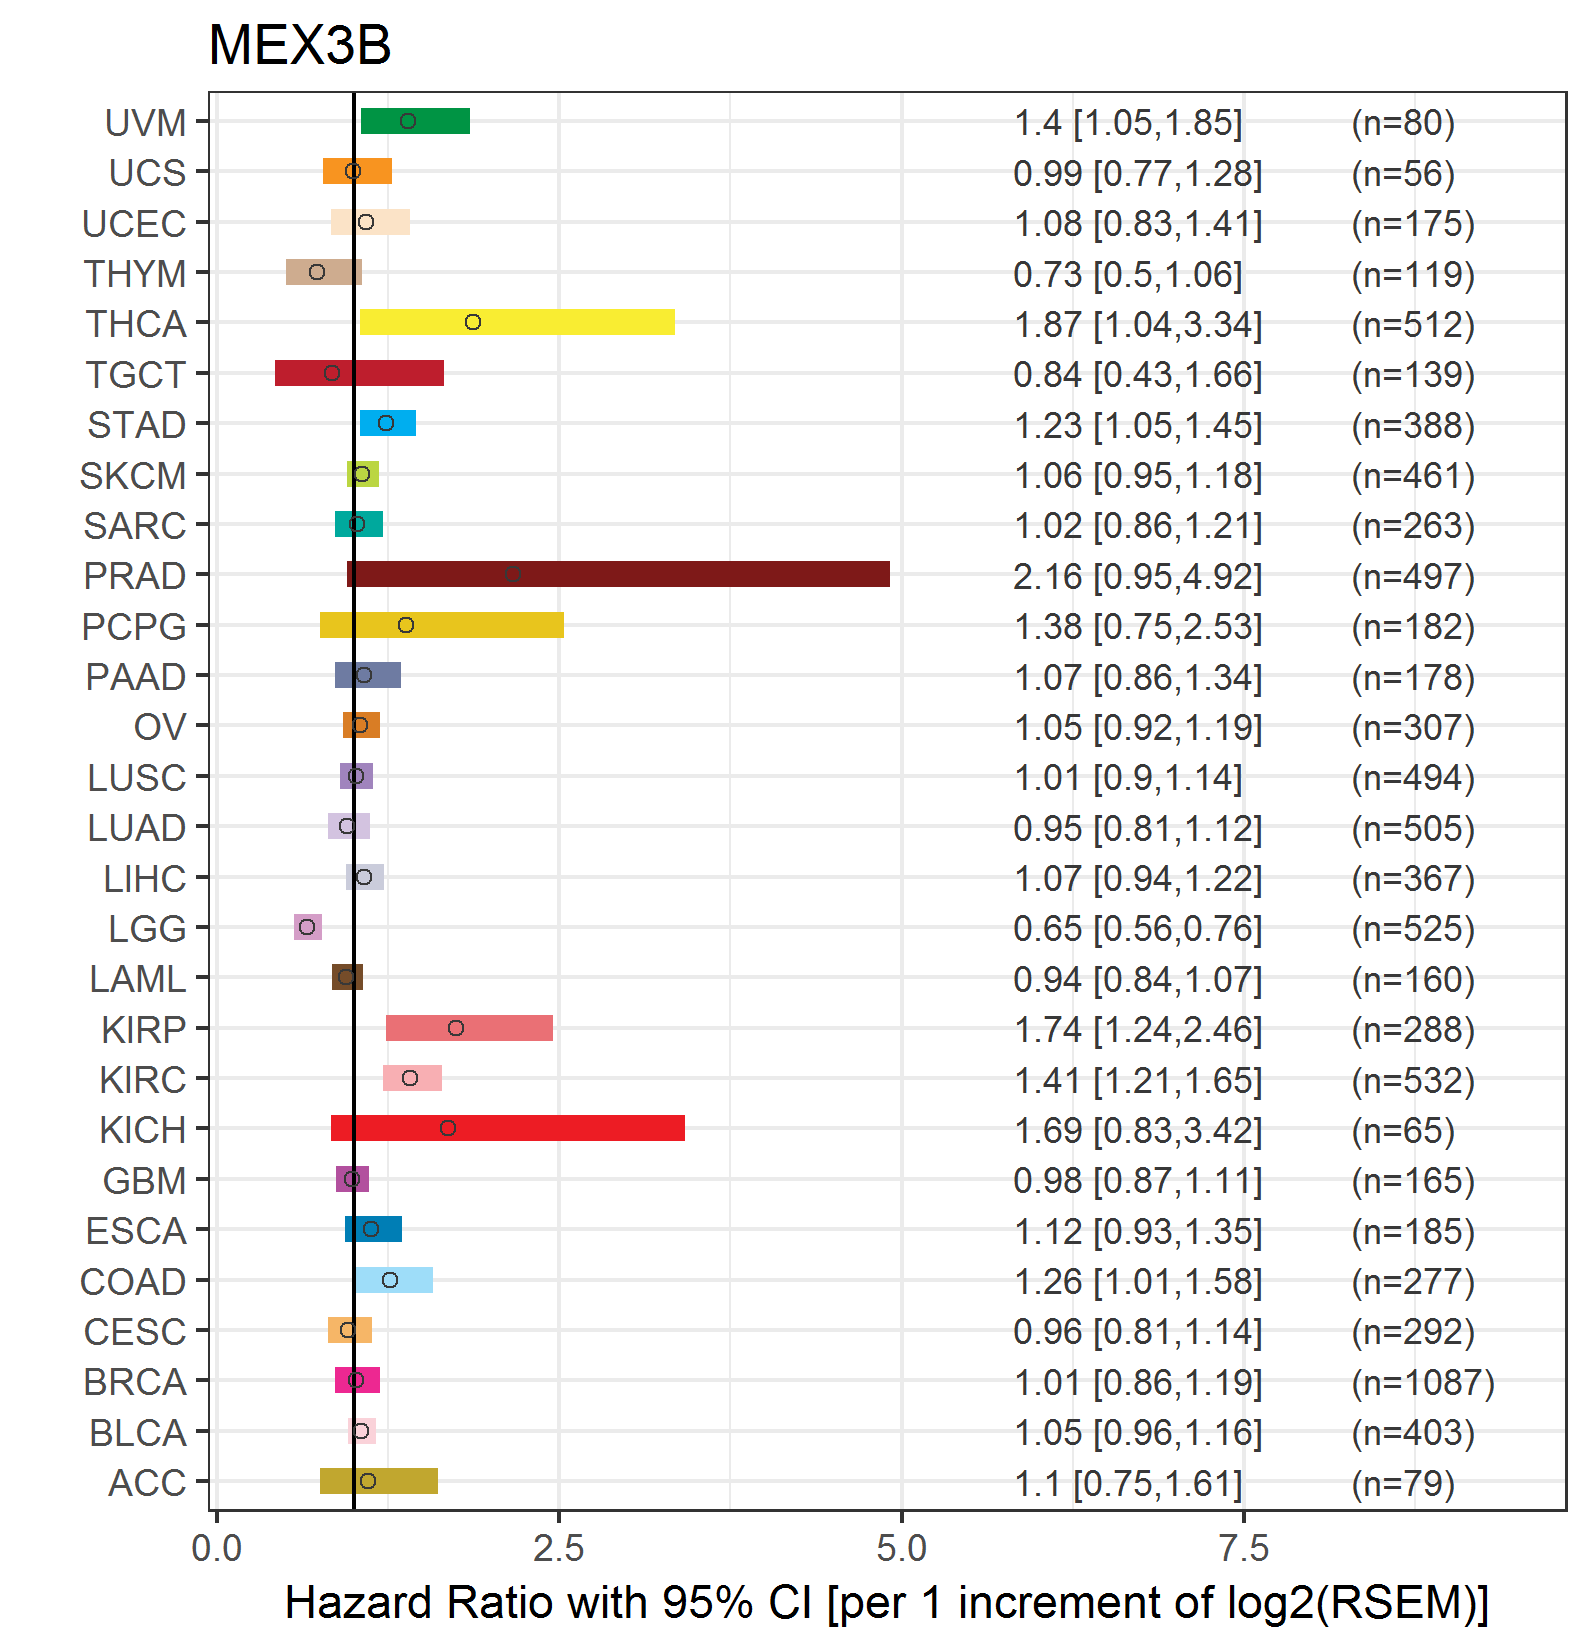
| Forest plot of Cox proportional hazard ratio (HR) and 95% CI of overall survival (OS) using 28 cancer types (TCGA IlluminaHiSeq_RNASeqV2, pan-cancer normalized log2(norm_counts+1) data, version 2016-08-16) (TCGA clinicalMatrix, phenotype data, version 2016-04-27) * Click on the image enlarge it in a new window. |
 |
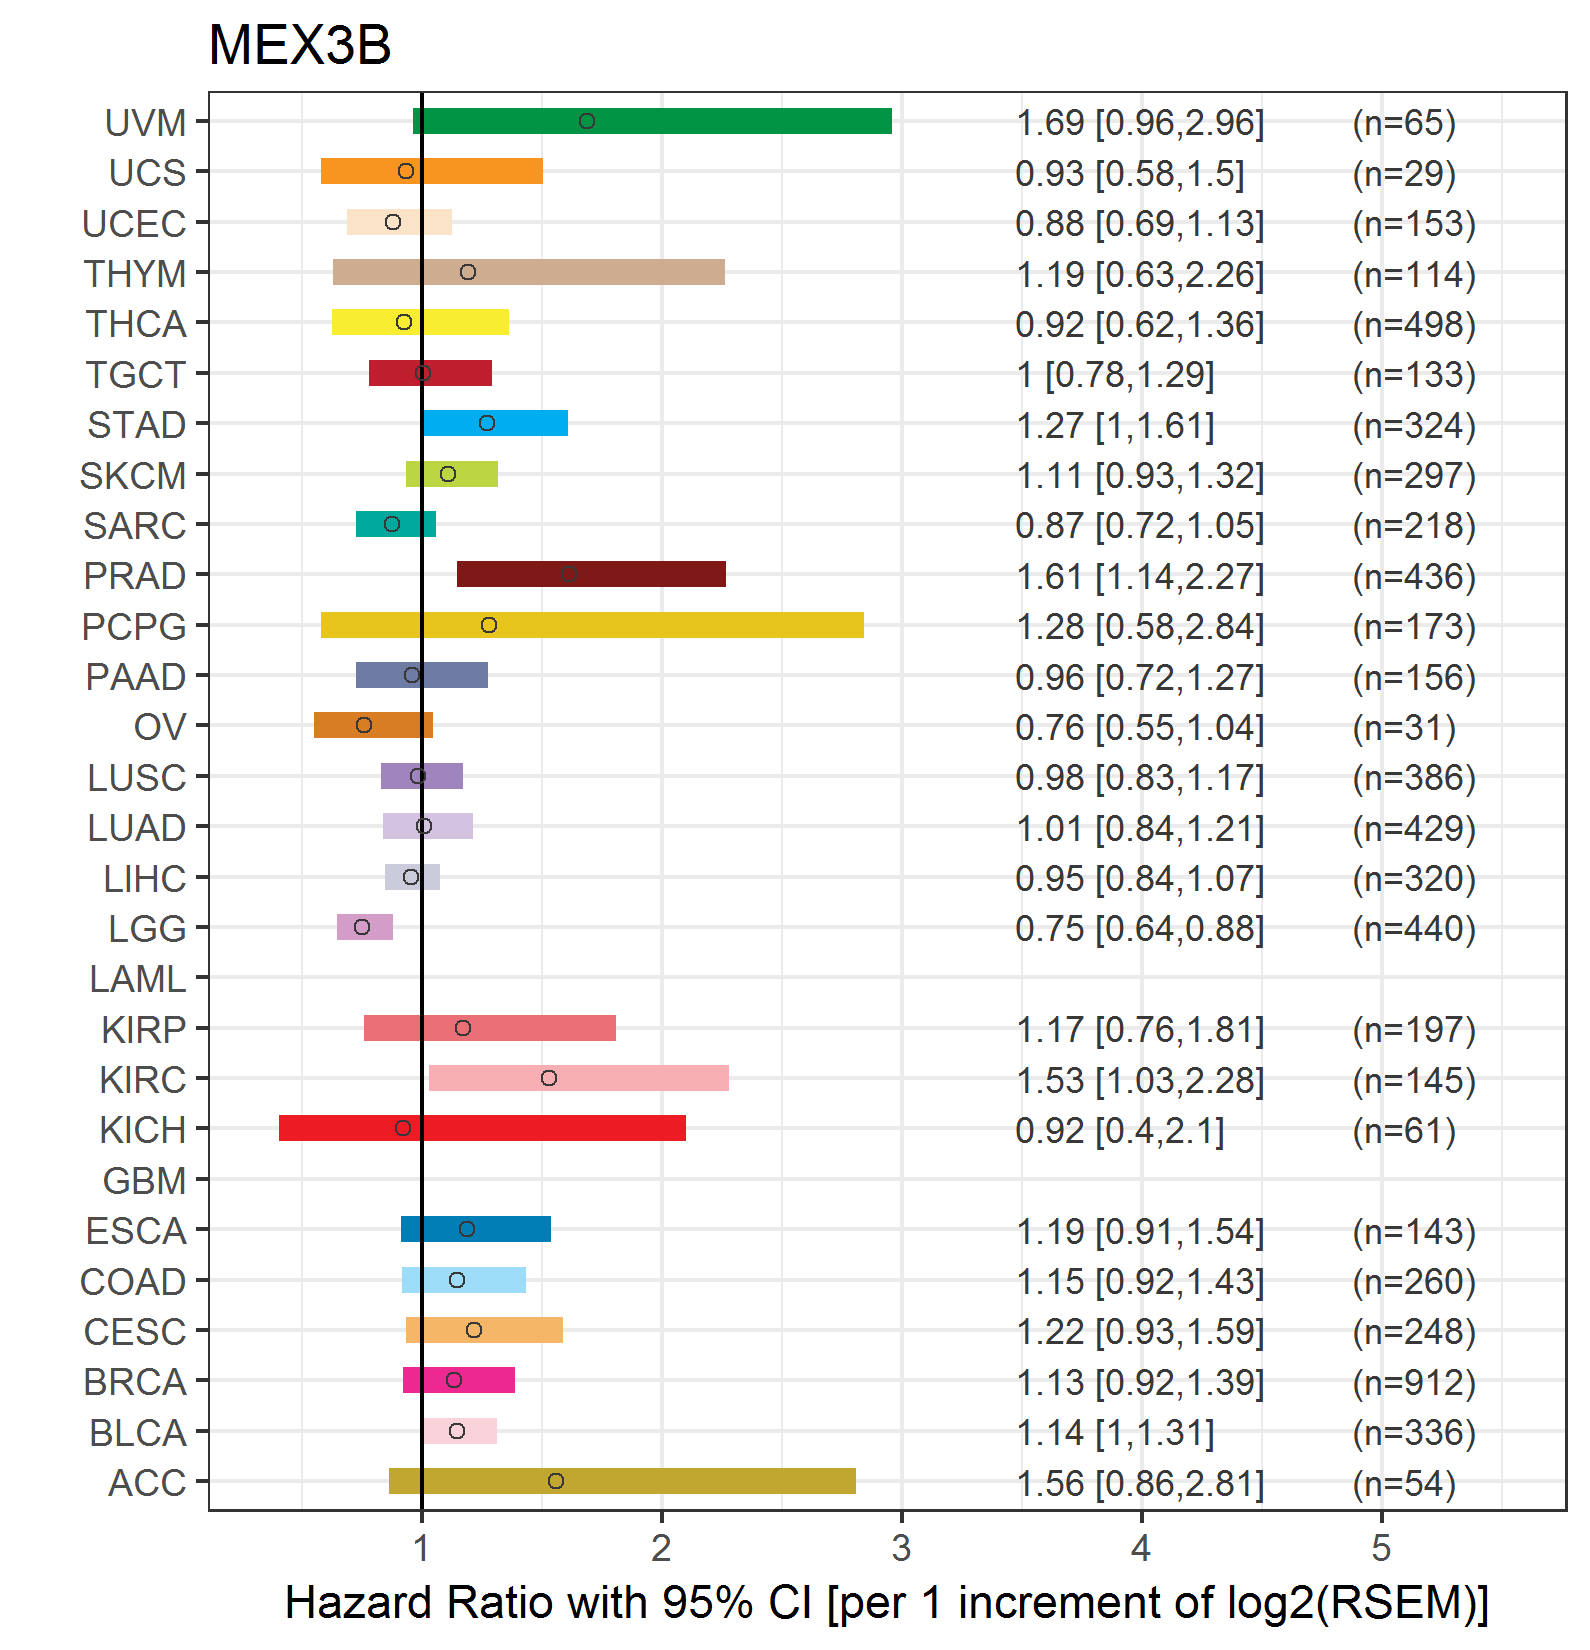
| Forest plot of Cox proportional hazard ratio (HR) and 95% CI of relapse free survival (RFS) using 28 cancer types (TCGA IlluminaHiSeq_RNASeqV2, pan-cancer normalized log2(norm_counts+1) data, version 2016-08-16) (TCGA clinicalMatrix, phenotype data, version 2016-04-27) * Click on the image enlarge it in a new window. |
 |
| Top |
| TissGeneClin for MEX3B |
| TissGeneDrug for MEX3B |
| Drug information targeting TissGene (DrugBank Version 5.0.6, 2017-04-01) |
| DrugBank ID | Drug name | Drug activity | Drug type | Drug status |
| Top |
| TissGeneDisease for MEX3B |
| Disease information associated with TissGene (DisGeNet, 2016-06-01) |
| Disease ID | Disease name | # pubmeds | Source |
|
Copyright 2016-Present - The University of Texas Health Science Center at Houston (UTHealth) Web File Viewing | How to Report, Fraud, Waste and Abuse | State of Texas | Statewide Search | Texas Homeland Security | Site Policies |