 |
| |
| |
| |
| |
| |
| |
|

| TissGeneSummary for ZMYND12 |
 Gene summary Gene summary |
| Basic gene information | Gene symbol | ZMYND12 |
| Gene name | zinc finger, MYND-type containing 12 | |
| Synonyms | - | |
| Cytomap | UCSC genome browser: 1p34.2 | |
| Type of gene | protein-coding | |
| RefGenes | NM_001146192.1, NM_032257.4, | |
| Description | zinc finger MYND domain-containing protein 12zinc finger, MYND domain containing 12 | |
| Modification date | 20141207 | |
| dbXrefs | HGNC : HGNC | |
| Ensembl : ENSG00000066185 | ||
| HPRD : 15740 | ||
| Vega : OTTHUMG00000007333 | ||
| Protein | UniProt: go to UniProt's Cross Reference DB Table | |
| Expression | CleanEX: HS_ZMYND12 | |
| BioGPS: 84217 | ||
| Pathway | NCI Pathway Interaction Database: ZMYND12 | |
| KEGG: ZMYND12 | ||
| REACTOME: ZMYND12 | ||
| Pathway Commons: ZMYND12 | ||
| Context | iHOP: ZMYND12 | |
| ligand binding site mutation search in PubMed: ZMYND12 | ||
| UCL Cancer Institute: ZMYND12 | ||
| Assigned class in TissGDB* | C | |
| Included tissue-specific gene expression resources | TiGER,GTEx | |
| Specific-tissues in normal samples (assigned by TissGDB using HPA, TiGER, and GTEx) | Testis | |
| Cancer types related to the specific-tissues in cancer samples (assigned by TissGDB using TCGA) | TGCT | |
| Reference showing the relevant tissue of ZMYND12 | ||
| Description by TissGene annotations | Fused withTSGene | |
| * Class A consists of genes with literature evidence and is part of the cTissGenes. Class B consists of only cTissGenes without additional evidence. The remaining genes belong to Class C. |
| Gene ontology having evidence of Inferred from Direct Assay (IDA) from Entrez |
| GO ID | GO term | PubMed ID |
| Top |
| TissGeneExp for ZMYND12 |
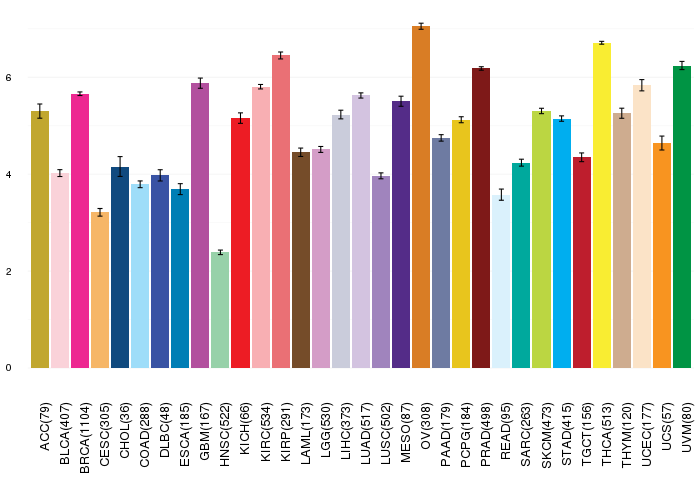
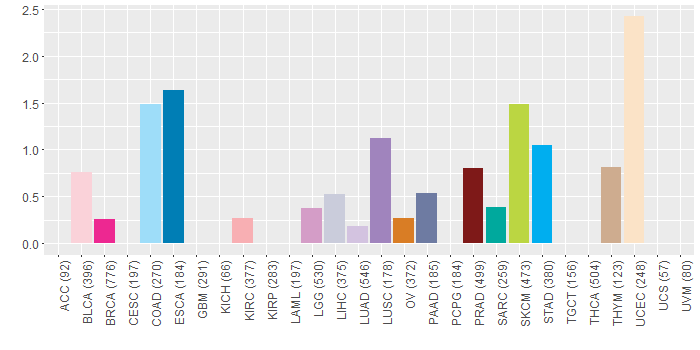
| Gene expressions across 28 cancer types (X-axis: cancer type and Y-axis: log2(norm_counts+1)) (TCGA IlluminaHiSeq_RNASeqV2, pan-cancer normalized log2(norm_counts+1) data, version 2016-08-16) |
 |
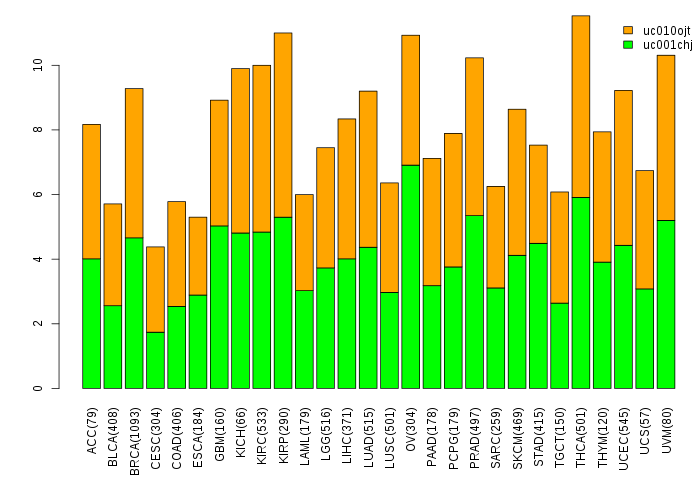
| Gene isoform expressions across 28 cancer types (X-axis: cancer type and Y-axis: log2(norm_counts+1)) (TCGA pan-cancer tcga_rsem_isoform_tpm, version 2016-09-01) |
 |
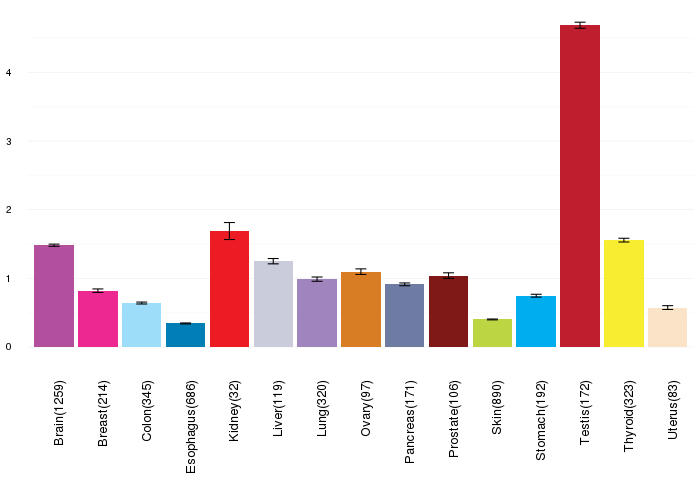
| Gene expressions across normal tissues of GTEx data (GTEx GTEx_Analysis_v6_RNA-seq_RNA-SeQCv1.1.8_gene_rpkm.gct) - Here, we shows the matched tissue types only among our 28 cancer types. |
 |
| Different expressions across 14 cancer types with more than 10 samples between matched tumors and normals (X-axis: cancer type and Y-axis: log2(norm_counts+1)) (TCGA IlluminaHiSeq_RNASeqV2, pan-cancer normalized log2(norm_counts+1) data, version 2016-08-16) |
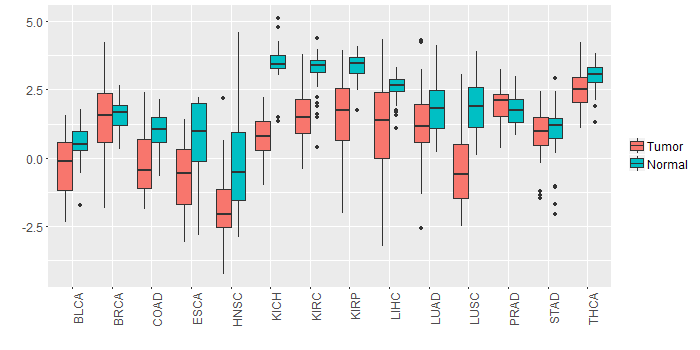 |
| - Significantly differentially expressed cancer types and information. (|Fold change|>1 and FDR<0.05) |
| Cancer type | Mean(exp) in tumor | Mean(exp) in matched normal | Log2FC | P-val. | FDR |
| HNSC | -1.855018694 | -0.271381485 | -1.583637209 | 1.24E-06 | 9.21E-06 |
| LIHC | 1.109512422 | 2.601490422 | -1.491978 | 8.63E-08 | 6.14E-07 |
| LUSC | -0.45095946 | 1.872758187 | -2.323717647 | 6.22E-18 | 5.65E-17 |
| KICH | 0.823430422 | 3.447030422 | -2.6236 | 9.79E-16 | 2.40E-14 |
| KIRP | 1.498040172 | 3.383502672 | -1.8854625 | 3.41E-08 | 2.31E-07 |
| KIRC | 1.605739478 | 3.237522811 | -1.631783333 | 1.72E-22 | 1.63E-21 |
| COAD | -0.117057424 | 0.926023345 | -1.043080769 | 0.0011 | 0.003113824 |
| Top |
| TissGene-miRNA for ZMYND12 |
| Significantly anti-correlated miRNAs of TissGene across 28 cancer types (Gene-miRNA relations from TargetScanHuman Relsease 7.1, Conserved_Site_Context_Scores.txt.zip, 06.01.2016) (TCGA IlluminaHiSeq_miRNASeq, log2(RPM+1) data, version 2016-11-21) (TCGA IlluminaHiSeq_RNASeqV2, log2(normalized_count+1) data, version 2016-08-16) (Spearman’s Rank Correlation (p-value<0.05 and coefficient<-0.25)) |
| Cancer type | miRNA id | miRNA accession | P-val. | Coeff. | # samples |
| Top |
| TissGeneMut for ZMYND12 |
| TissGeneSNV for ZMYND12 |
| nsSNV counts per each loci. Different colors of circles represent different cancer types. Circle size denotes number of samples. (TCGA somatic mutation (SNPs and small INDELs) data, version 2016-04-25) * Click on the image to enlarge it in a new window. |
 |
 |
| Somatic nucleotide variants of TissGene across 28 cancer types (X-axis: cancer type and Y-axis: % of mutated samples) The numbers in parentheses are numbers of samples with mutation (nsSNVs). (TCGA somatic mutation (SNPs and small INDELs) data, version 2016-04-25) |
 |
| - nsSNVs sorted by frequency. |
| AAchange | Cancer type | # samples |
| p.L141F | SKCM | 2 |
| p.R192C | COAD | 1 |
| p.Y98* | LIHC | 1 |
| p.R212S | ESCA | 1 |
| p.I49L | OV | 1 |
| p.A21S | STAD | 1 |
| p.Y98X | LIHC | 1 |
| p.R73Q | PRAD | 1 |
| p.K311N | LUSC | 1 |
| p.R73W | PRAD | 1 |
| p.Y252C | STAD | 1 |
| p.D300A | PRAD | 1 |
| p.R286C | SKCM | 1 |
| p.T274N | ESCA | 1 |
| p.E89Q | BLCA | 1 |
| p.P363S | SKCM | 1 |
| p.S167I | COAD | 1 |
| p.Q96H | BRCA | 1 |
| p.W244X | THYM | 1 |
| p.R73Q | LGG | 1 |
| p.K97N | STAD | 1 |
| p.T7I | UCEC | 1 |
| p.F90L | UCEC | 1 |
| p.M321I | SKCM | 1 |
| p.R176Q | UCEC | 1 |
| p.R13H | LIHC | 1 |
| p.F90L | ESCA | 1 |
| p.S290L | SKCM | 1 |
| p.A137S | SARC | 1 |
| p.V127A | KIRC | 1 |
| p.Y98D | UCEC | 1 |
| p.E128Q | HNSC | 1 |
| p.S358L | LUSC | 1 |
| p.E138K | PAAD | 1 |
| p.R145Q | LGG | 1 |
| p.M1I | BLCA | 1 |
| p.R61H | UCEC | 1 |
| p.R286H | COAD | 1 |
| p.L255F | SKCM | 1 |
| p.V9L | STAD | 1 |
| p.E189K | BRCA | 1 |
| p.E151K | BLCA | 1 |
| p.R61H | PRAD | 1 |
| p.R83W | READ | 1 |
| p.R332M | UCEC | 1 |
| p.E352D | UCEC | 1 |
| p.P24T | UCEC | 1 |
| p.T93A | COAD | 1 |
| p.M320I | SKCM | 1 |
| p.V147I | LUAD | 1 |
| Top |
| TissGeneCNV for ZMYND12 |
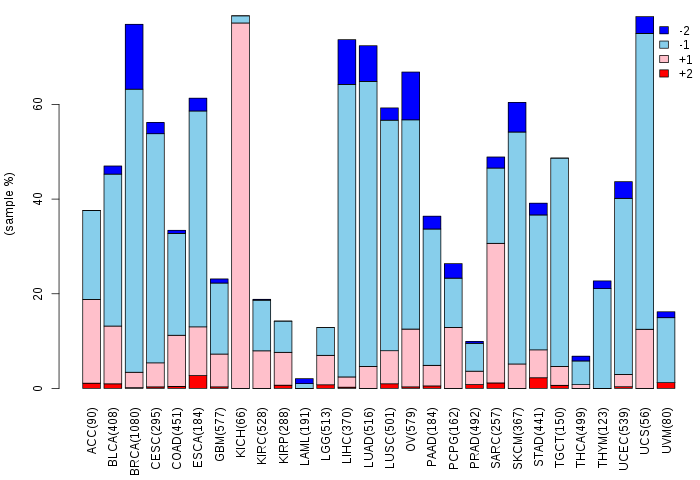
| Copy number variations of TissGene across 28 cancer types (X-axis: cancer type and Y-axis: % of CNV samples) (TCGA Gistic2_CopyNumber_Gistic2_all_data_by_genes, Gistic2 copy number data, version 2016-08-16) |
 |
| Top |
| TissGeneFusions for ZMYND12 |
| Fusion genes including TissGene (ChimerDB 3.0, 2016-12-01 and TCGA fusion Portal 2015-12-01) |
| Database | Src | Cancer type | Sample | Fusion gene | ORF | 5'-gene BP | 3'-gene BP |
| TCGAfusionPortal | PRADA | BLCA | TCGA-BT-A3PK-01A | HIVEP3-ZMYND12 | 5UTR-CDS | Chr1:42384084 | Chr1:42902214 |
| Top |
| TissGeneNet for ZMYND12 |
| Co-expressed gene networks based on protein-protein interaction data (CePIN) (TCGA IlluminaHiSeq_RNASeqV2, pan-cancer normalized log2(norm_counts+1) data, version 2016-08-16) (PINA2 ppi data) |
| Top |
| TissGeneProg for ZMYND12 |
| Kaplan-Meier plots with logrank tests of overall survival (OS) using 28 cancer types (TCGA IlluminaHiSeq_RNASeqV2, pan-cancer normalized log2(norm_counts+1) data, version 2016-08-16) (TCGA clinicalMatrix, phenotype data, version 2016-04-27) * Click on the image to enlarge it in a new window. |
 |
| Kaplan-Meier plots with logrank test of relapse free survival (RFS) using 28 cancer types (TCGA IlluminaHiSeq_RNASeqV2, pan-cancer normalized log2(norm_counts+1) data, version 2016-08-16) (TCGA clinicalMatrix, phenotype data, version 2016-04-27) * Click on the image enlarge it in a new window. |
 |
| Forest plot of Cox proportional hazard ratio (HR) and 95% CI of overall survival (OS) using 28 cancer types (TCGA IlluminaHiSeq_RNASeqV2, pan-cancer normalized log2(norm_counts+1) data, version 2016-08-16) (TCGA clinicalMatrix, phenotype data, version 2016-04-27) * Click on the image enlarge it in a new window. |
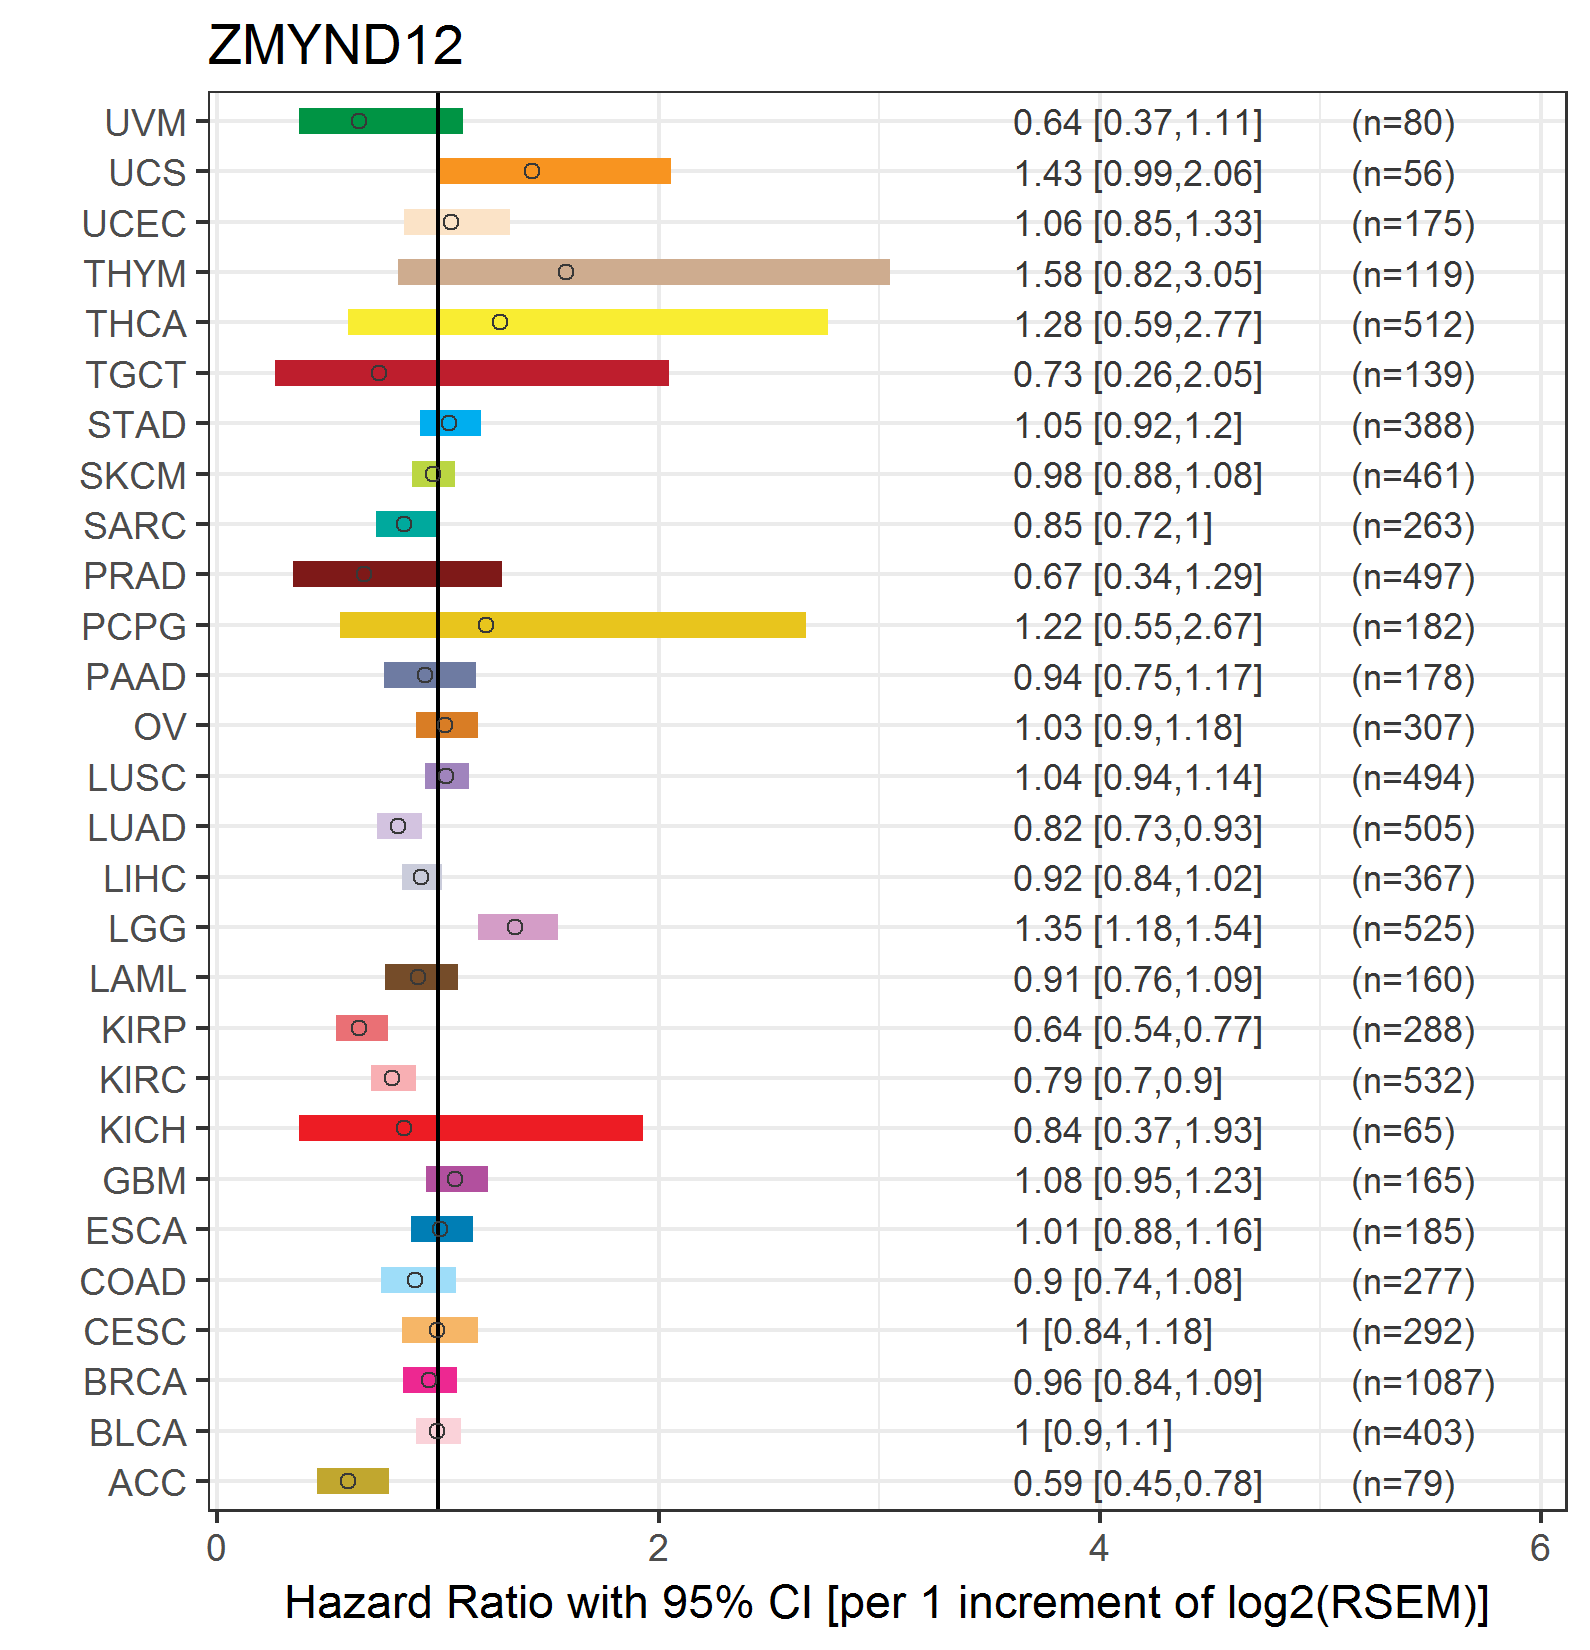 |
| Forest plot of Cox proportional hazard ratio (HR) and 95% CI of relapse free survival (RFS) using 28 cancer types (TCGA IlluminaHiSeq_RNASeqV2, pan-cancer normalized log2(norm_counts+1) data, version 2016-08-16) (TCGA clinicalMatrix, phenotype data, version 2016-04-27) * Click on the image enlarge it in a new window. |
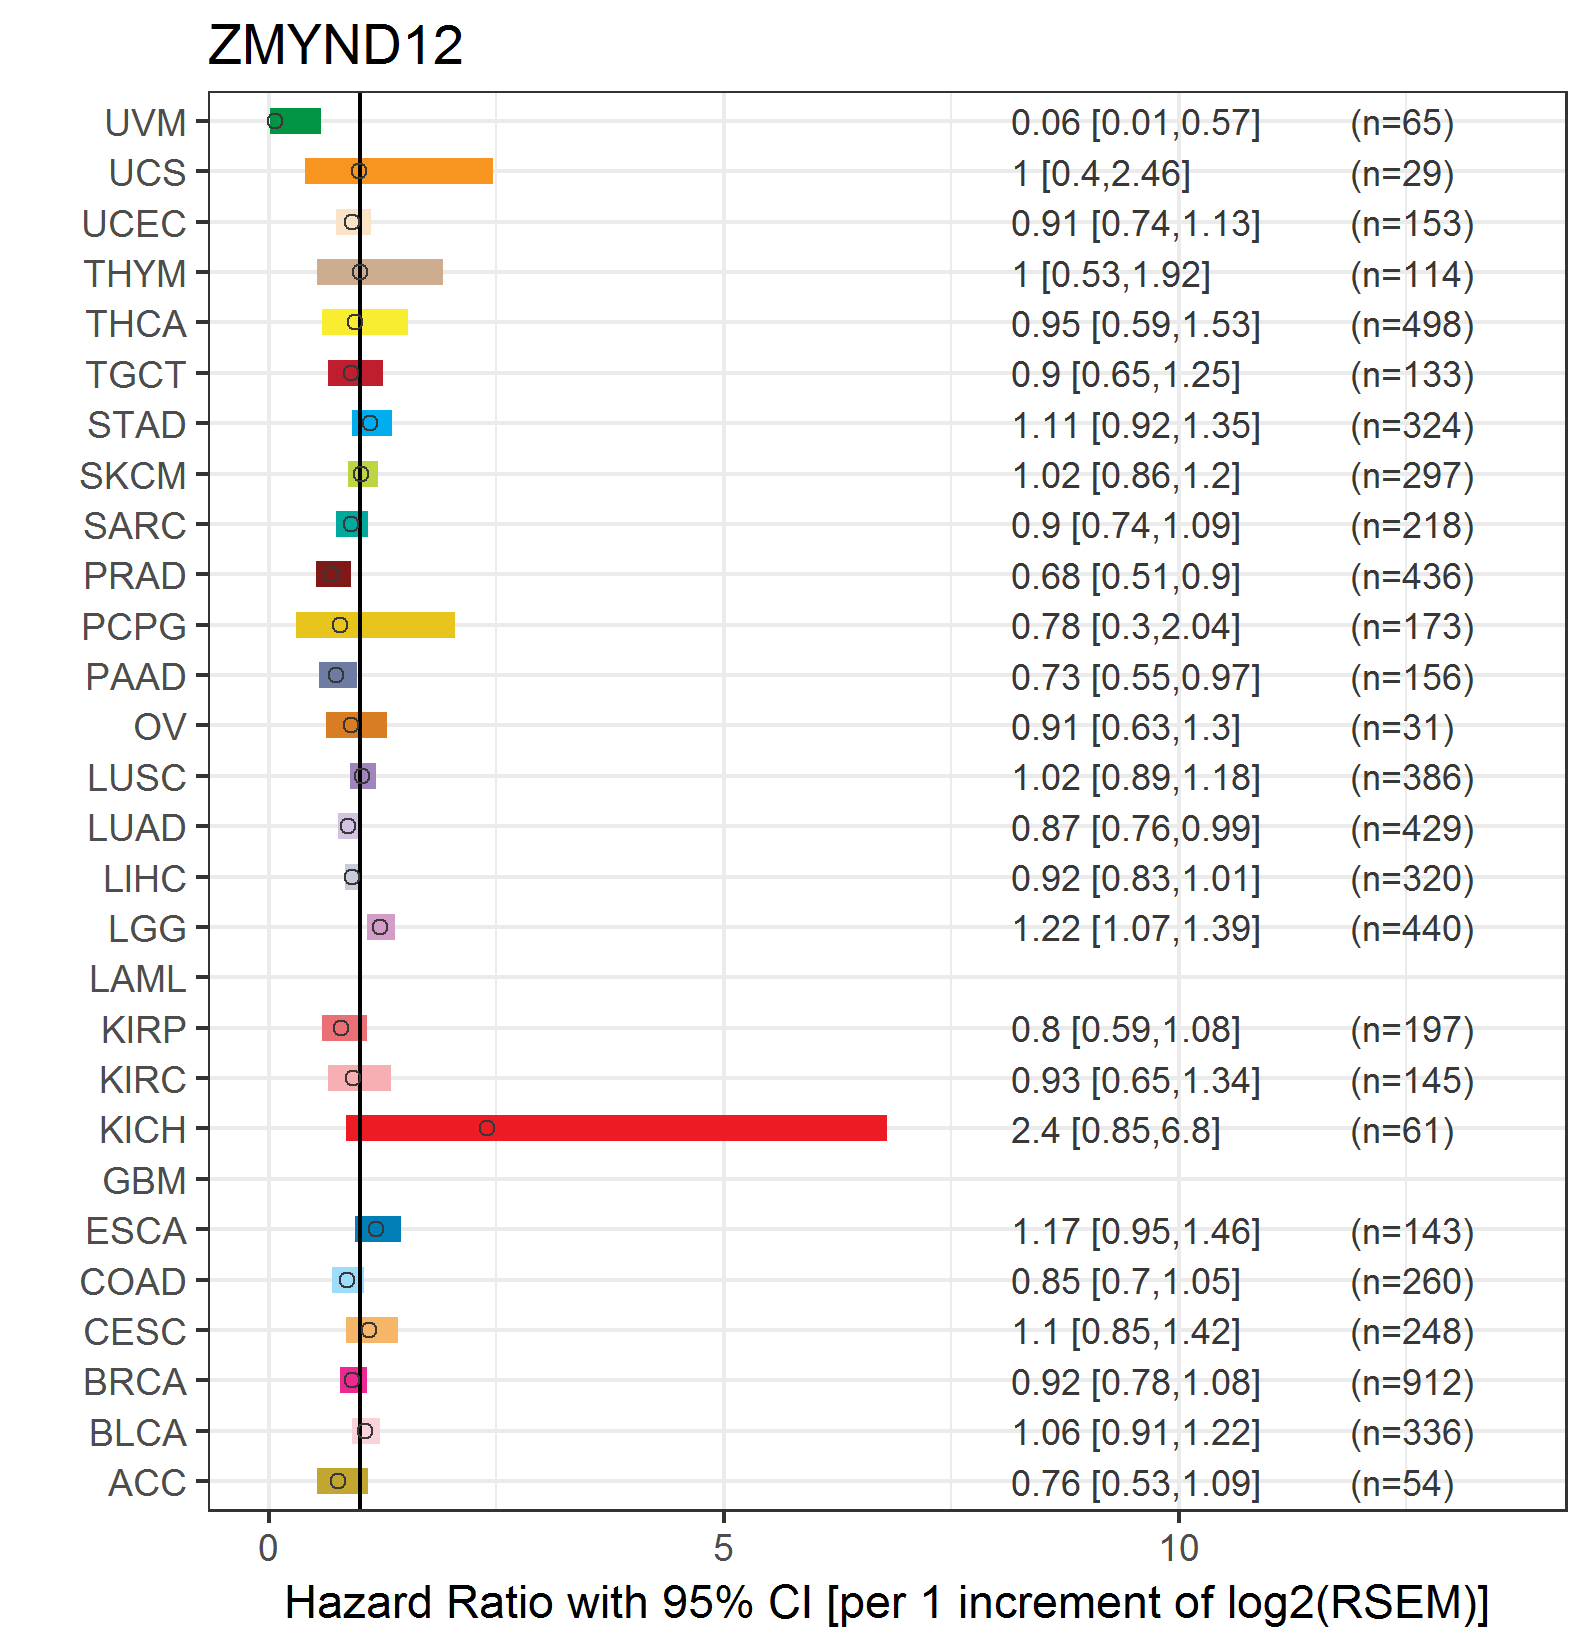 |
| Top |
| TissGeneClin for ZMYND12 |
| TissGeneDrug for ZMYND12 |
| Drug information targeting TissGene (DrugBank Version 5.0.6, 2017-04-01) |
| DrugBank ID | Drug name | Drug activity | Drug type | Drug status |
| Top |
| TissGeneDisease for ZMYND12 |
| Disease information associated with TissGene (DisGeNet, 2016-06-01) |
| Disease ID | Disease name | # pubmeds | Source |
|
Copyright 2016-Present - The University of Texas Health Science Center at Houston (UTHealth) Web File Viewing | How to Report, Fraud, Waste and Abuse | State of Texas | Statewide Search | Texas Homeland Security | Site Policies |