 |
| |
| |
| |
| |
| |
| |
|

| TissGeneSummary for PSD2 |
 Gene summary Gene summary |
| Basic gene information | Gene symbol | PSD2 |
| Gene name | pleckstrin and Sec7 domain containing 2 | |
| Synonyms | EFA6C | |
| Cytomap | UCSC genome browser: 5q31.2 | |
| Type of gene | protein-coding | |
| RefGenes | NM_032289.2, | |
| Description | 6330404E20RikPH and SEC7 domain-containing protein 2pleckstrin homology and SEC7 domain-containing protein 2 | |
| Modification date | 20141207 | |
| dbXrefs | HGNC : HGNC | |
| Ensembl : ENSG00000146005 | ||
| HPRD : 15190 | ||
| Vega : OTTHUMG00000129240 | ||
| Protein | UniProt: go to UniProt's Cross Reference DB Table | |
| Expression | CleanEX: HS_PSD2 | |
| BioGPS: 84249 | ||
| Pathway | NCI Pathway Interaction Database: PSD2 | |
| KEGG: PSD2 | ||
| REACTOME: PSD2 | ||
| Pathway Commons: PSD2 | ||
| Context | iHOP: PSD2 | |
| ligand binding site mutation search in PubMed: PSD2 | ||
| UCL Cancer Institute: PSD2 | ||
| Assigned class in TissGDB* | C | |
| Included tissue-specific gene expression resources | HPA,TiGER | |
| Specific-tissues in normal samples (assigned by TissGDB using HPA, TiGER, and GTEx) | Brain | |
| Cancer types related to the specific-tissues in cancer samples (assigned by TissGDB using TCGA) | GBM,LGG | |
| Reference showing the relevant tissue of PSD2 | ||
| Description by TissGene annotations | Have significant anti-correlated miRNA TissgsKTS CNV lost TissGeneKTS | |
| * Class A consists of genes with literature evidence and is part of the cTissGenes. Class B consists of only cTissGenes without additional evidence. The remaining genes belong to Class C. |
| Gene ontology having evidence of Inferred from Direct Assay (IDA) from Entrez |
| GO ID | GO term | PubMed ID |
| Top |
| TissGeneExp for PSD2 |
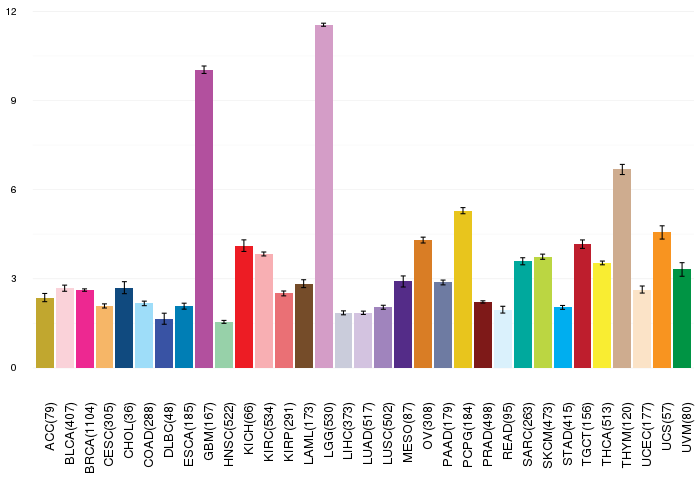
| Gene expressions across 28 cancer types (X-axis: cancer type and Y-axis: log2(norm_counts+1)) (TCGA IlluminaHiSeq_RNASeqV2, pan-cancer normalized log2(norm_counts+1) data, version 2016-08-16) |
 |
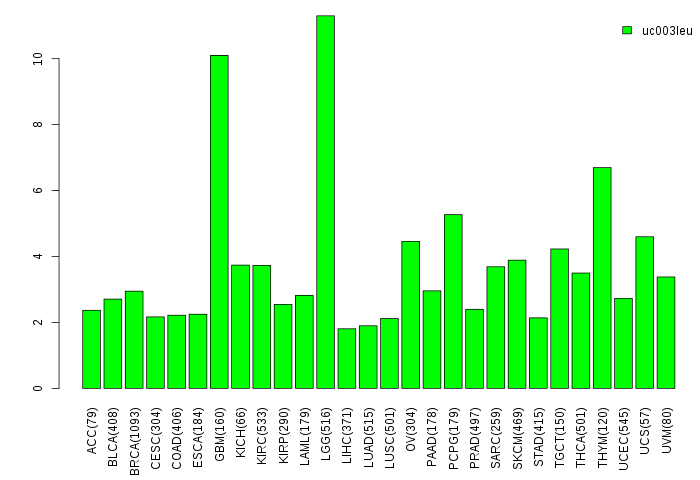
| Gene isoform expressions across 28 cancer types (X-axis: cancer type and Y-axis: log2(norm_counts+1)) (TCGA pan-cancer tcga_rsem_isoform_tpm, version 2016-09-01) |
 |
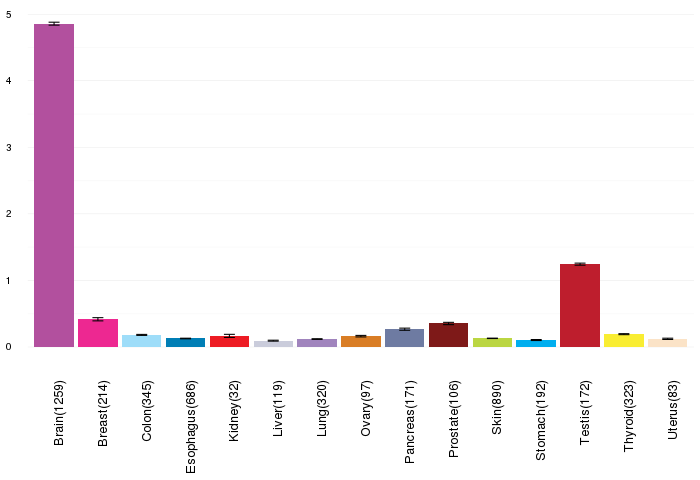
| Gene expressions across normal tissues of GTEx data (GTEx GTEx_Analysis_v6_RNA-seq_RNA-SeQCv1.1.8_gene_rpkm.gct) - Here, we shows the matched tissue types only among our 28 cancer types. |
 |
| Different expressions across 14 cancer types with more than 10 samples between matched tumors and normals (X-axis: cancer type and Y-axis: log2(norm_counts+1)) (TCGA IlluminaHiSeq_RNASeqV2, pan-cancer normalized log2(norm_counts+1) data, version 2016-08-16) |
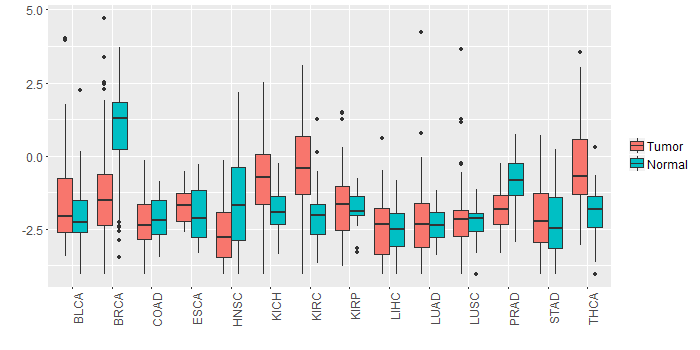 |
| - Significantly differentially expressed cancer types and information. (|Fold change|>1 and FDR<0.05) |
| Cancer type | Mean(exp) in tumor | Mean(exp) in matched normal | Log2FC | P-val. | FDR |
| PRAD | -1.846822989 | -0.831690297 | -1.015132692 | 4.83E-10 | 8.52E-09 |
| KIRC | -0.363510276 | -2.081982498 | 1.718472222 | 1.75E-13 | 7.94E-13 |
| BRCA | -1.380074676 | 0.829954271 | -2.210028947 | 6.65E-23 | 5.83E-22 |
| THCA | -0.407671881 | -1.901661712 | 1.493989831 | 3.38E-10 | 2.09E-09 |
| HNSC | -2.59187129 | -1.491996871 | -1.099874419 | 0.000602 | 0.002184677 |
| KICH | -0.51852822 | -1.87807622 | 1.359548 | 0.00067 | 0.001493104 |
| Top |
| TissGene-miRNA for PSD2 |
| Significantly anti-correlated miRNAs of TissGene across 28 cancer types (Gene-miRNA relations from TargetScanHuman Relsease 7.1, Conserved_Site_Context_Scores.txt.zip, 06.01.2016) (TCGA IlluminaHiSeq_miRNASeq, log2(RPM+1) data, version 2016-11-21) (TCGA IlluminaHiSeq_RNASeqV2, log2(normalized_count+1) data, version 2016-08-16) (Spearman’s Rank Correlation (p-value<0.05 and coefficient<-0.25)) |
| Cancer type | miRNA id | miRNA accession | P-val. | Coeff. | # samples |
| ACC | hsa-miR-410-3p | MIMAT0002171 | 0.021 | -0.26 | 78 |
| ACC | hsa-miR-410-3p | MIMAT0002171 | 0.021 | -0.26 | 78 |
| UVM | hsa-miR-199b-3p | MIMAT0004563 | 0.006 | -0.31 | 80 |
| UVM | hsa-miR-199a-3p | MIMAT0000232 | 0.006 | -0.31 | 80 |
| Top |
| TissGeneMut for PSD2 |
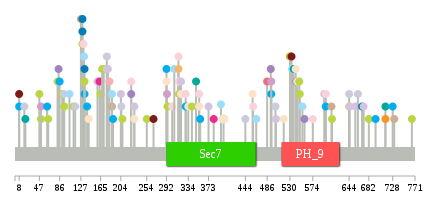
| TissGeneSNV for PSD2 |
| nsSNV counts per each loci. Different colors of circles represent different cancer types. Circle size denotes number of samples. (TCGA somatic mutation (SNPs and small INDELs) data, version 2016-04-25) * Click on the image to enlarge it in a new window. |
 |
 |
| Somatic nucleotide variants of TissGene across 28 cancer types (X-axis: cancer type and Y-axis: % of mutated samples) The numbers in parentheses are numbers of samples with mutation (nsSNVs). (TCGA somatic mutation (SNPs and small INDELs) data, version 2016-04-25) |
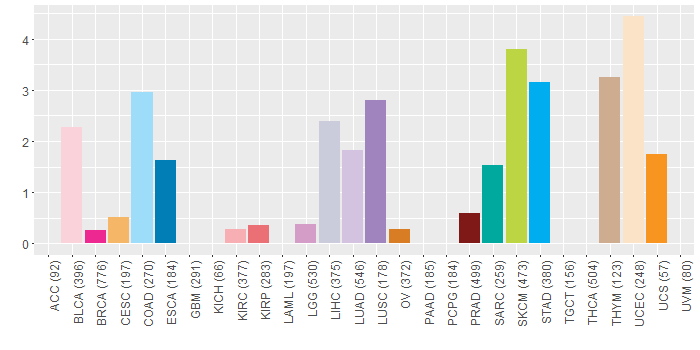 |
| - nsSNVs sorted by frequency. |
| AAchange | Cancer type | # samples |
| p.S402L | UCEC | 2 |
| p.E130X | ESCA | 1 |
| p.E349V | SARC | 1 |
| p.R728W | STAD | 1 |
| p.R230H | UCEC | 1 |
| p.L303V | BLCA | 1 |
| p.R50Q | SKCM | 1 |
| p.Q669H | ESCA | 1 |
| p.P302L | HNSC | 1 |
| p.Q154X | READ | 1 |
| p.S292L | STAD | 1 |
| p.G207E | SKCM | 1 |
| p.Y558C | LUSC | 1 |
| p.P373Q | LUAD | 1 |
| p.S8P | PRAD | 1 |
| p.D765N | SKCM | 1 |
| p.E293D | LGG | 1 |
| p.A139T | STAD | 1 |
| p.S565L | READ | 1 |
| p.P179S | LUAD | 1 |
| p.A211E | HNSC | 1 |
| p.R329C | STAD | 1 |
| p.E611K | SKCM | 1 |
| p.R18C | LIHC | 1 |
| p.E130K | SKCM | 1 |
| p.E95K | SKCM | 1 |
| p.S8P | STAD | 1 |
| p.V133L | COAD | 1 |
| p.F68L | HNSC | 1 |
| p.K62N | STAD | 1 |
| p.A105V | COAD | 1 |
| p.L714I | SARC | 1 |
| p.R224H | BLCA | 1 |
| p.D355N | BLCA | 1 |
| p.F205I | LIHC | 1 |
| p.F542L | LUSC | 1 |
| p.R230C | LUAD | 1 |
| p.H315Y | CESC | 1 |
| p.R134W | STAD | 1 |
| p.R134W | ESCA | 1 |
| p.K541N | UCEC | 1 |
| p.D159Y | LUAD | 1 |
| p.P64S | SKCM | 1 |
| p.R390L | MESO | 1 |
| p.D599N | STAD | 1 |
| p.R316W | SKCM | 1 |
| p.R574C | BLCA | 1 |
| p.S292* | UCEC | 1 |
| p.R644W | SKCM | 1 |
| p.L714I | UCS | 1 |
| p.E465D | COAD | 1 |
| p.H315D | BLCA | 1 |
| p.Q656K | LUAD | 1 |
| p.R334W | UCEC | 1 |
| p.G294E | SKCM | 1 |
| p.P20L | SARC | 1 |
| p.S165N | SKCM | 1 |
| p.A672S | LUAD | 1 |
| p.R494* | LGG | 1 |
| p.R224C | LUSC | 1 |
| p.P533T | PRAD | 1 |
| p.R134Q | SKCM | 1 |
| p.E142D | UCEC | 1 |
| p.G47E | SKCM | 1 |
| p.P182L | KIRC | 1 |
| p.P397H | COAD | 1 |
| p.T549I | SKCM | 1 |
| p.R50Q | LGG | 1 |
| p.E130* | ESCA | 1 |
| p.A82V | SKCM | 1 |
| p.F502S | LIHC | 1 |
| p.D171N | SKCM | 1 |
| p.G486W | KIRP | 1 |
| p.R494Q | STAD | 1 |
| p.A731V | THYM | 1 |
| p.R187Q | COAD | 1 |
| p.K596N | LUAD | 1 |
| p.E341K | SKCM | 1 |
| p.V518I | UCEC | 1 |
| p.R695Q | STAD | 1 |
| p.R644W | LIHC | 1 |
| p.G84W | LUSC | 1 |
| p.P645H | LUAD | 1 |
| p.R187W | THYM | 1 |
| p.R531K | SKCM | 1 |
| p.S357L | STAD | 1 |
| p.R320L | LUAD | 1 |
| p.T418M | READ | 1 |
| p.G548E | SKCM | 1 |
| p.C307F | COAD | 1 |
| p.A94V | LIHC | 1 |
| p.E91K | SKCM | 1 |
| p.G254S | SKCM | 1 |
| p.P116T | LIHC | 1 |
| p.D168E | SKCM | 1 |
| p.D267A | PRAD | 1 |
| p.I459M | BLCA | 1 |
| p.R534S | COAD | 1 |
| p.D86Y | STAD | 1 |
| p.R320H | UCEC | 1 |
| p.E657D | READ | 1 |
| p.D355N | UCEC | 1 |
| p.E177* | LIHC | 1 |
| p.T493M | LUSC | 1 |
| p.K530R | OV | 1 |
| p.D132N | BLCA | 1 |
| p.L503P | LUAD | 1 |
| p.E177X | LIHC | 1 |
| p.R189H | STAD | 1 |
| p.S458F | UCEC | 1 |
| p.R661Q | LIHC | 1 |
| p.A544T | UCEC | 1 |
| p.V682I | SKCM | 1 |
| p.R383Q | BRCA | 1 |
| p.K610N | THYM | 1 |
| p.R329L | BLCA | 1 |
| p.A204V | LUAD | 1 |
| p.R316W | BLCA | 1 |
| p.D599N | BLCA | 1 |
| p.G163R | BRCA | 1 |
| p.Q554H | COAD | 1 |
| p.G444D | LIHC | 1 |
| p.R537H | SARC | 1 |
| p.S113N | SKCM | 1 |
| p.G127C | THYM | 1 |
| Top |
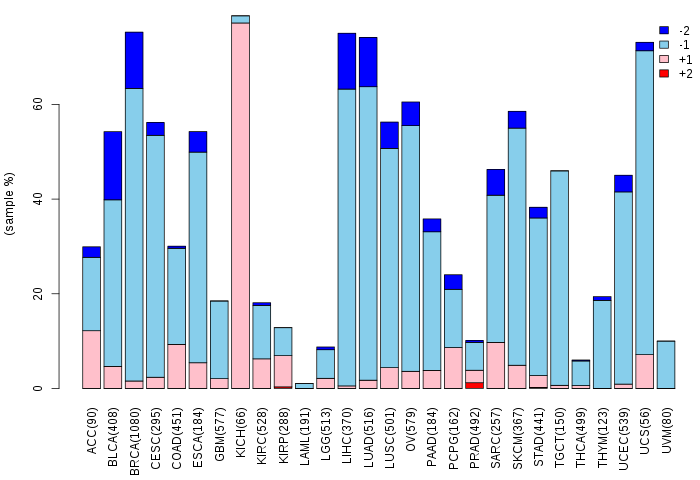
| TissGeneCNV for PSD2 |
| Copy number variations of TissGene across 28 cancer types (X-axis: cancer type and Y-axis: % of CNV samples) (TCGA Gistic2_CopyNumber_Gistic2_all_data_by_genes, Gistic2 copy number data, version 2016-08-16) |
 |
| Top |
| TissGeneFusions for PSD2 |
| Fusion genes including TissGene (ChimerDB 3.0, 2016-12-01 and TCGA fusion Portal 2015-12-01) |
| Database | Src | Cancer type | Sample | Fusion gene | ORF | 5'-gene BP | 3'-gene BP |
| TCGAfusionPortal | PRADA | BRCA | TCGA-BH-A0B3-01A | NCOA1-PSD2 | 5UTR-CDS | Chr2:24787299 | Chr5:139201478 |
| Top |
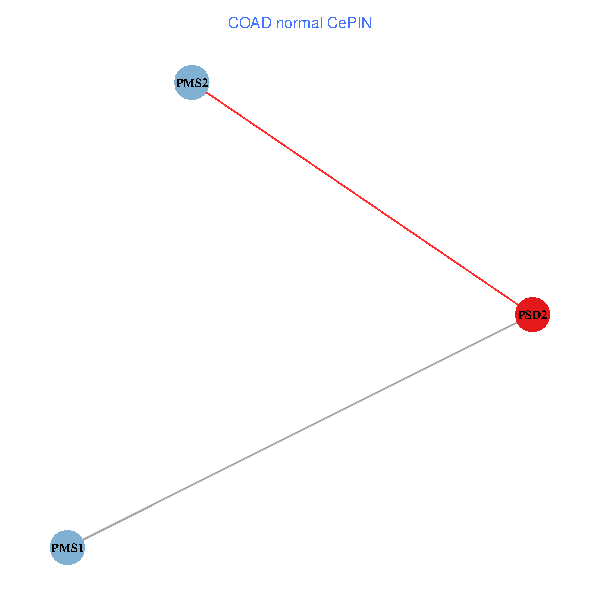
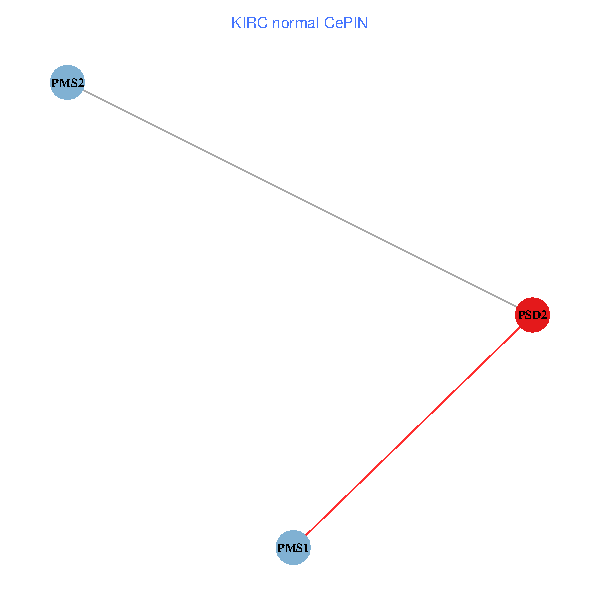
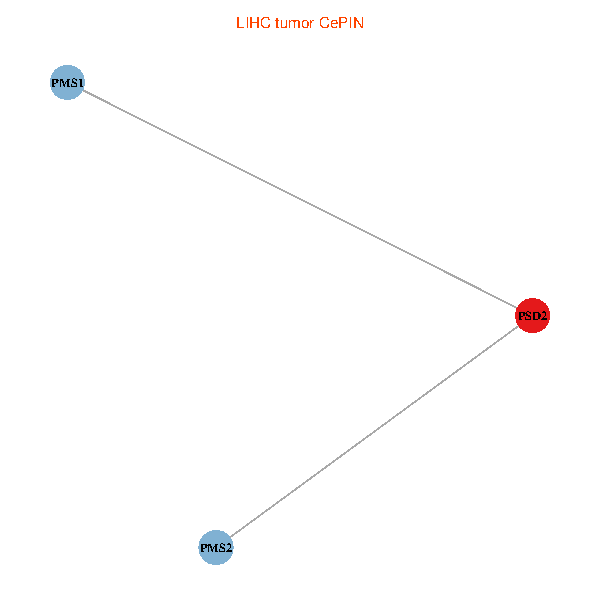
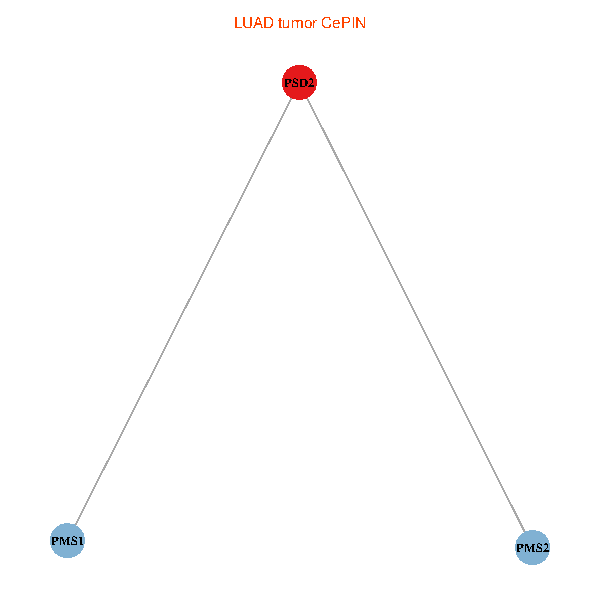
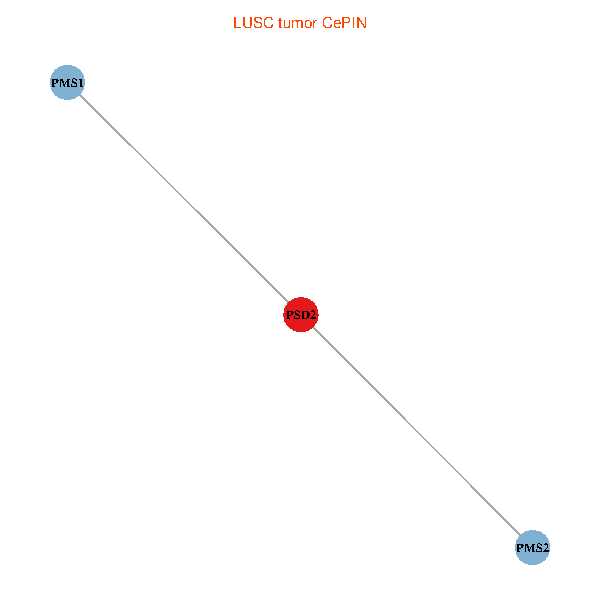
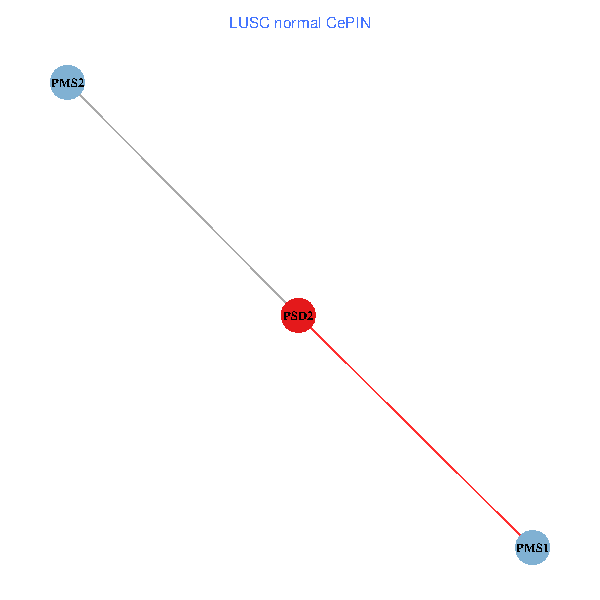
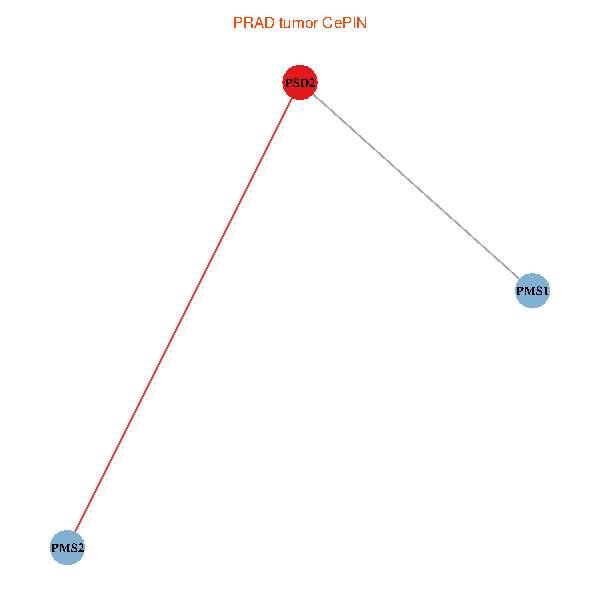
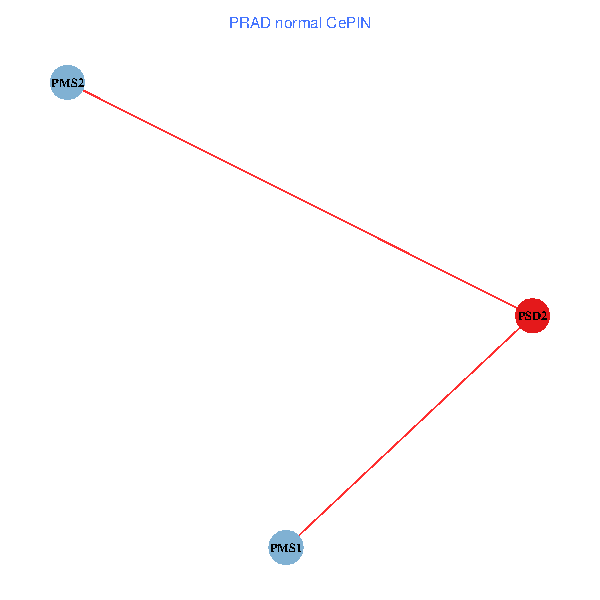
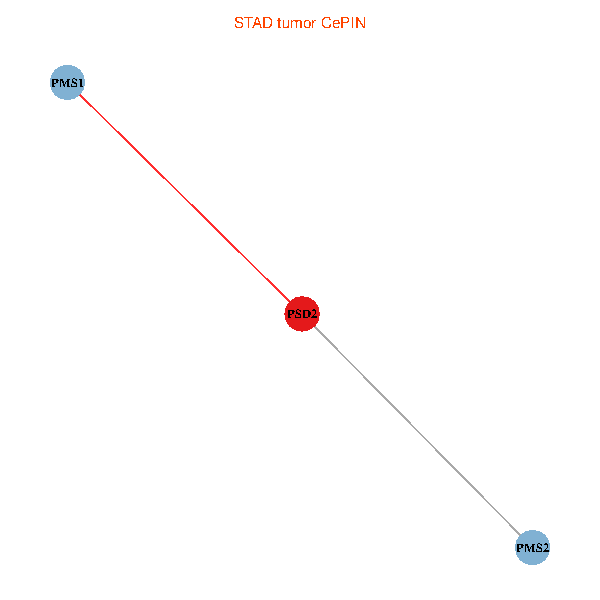
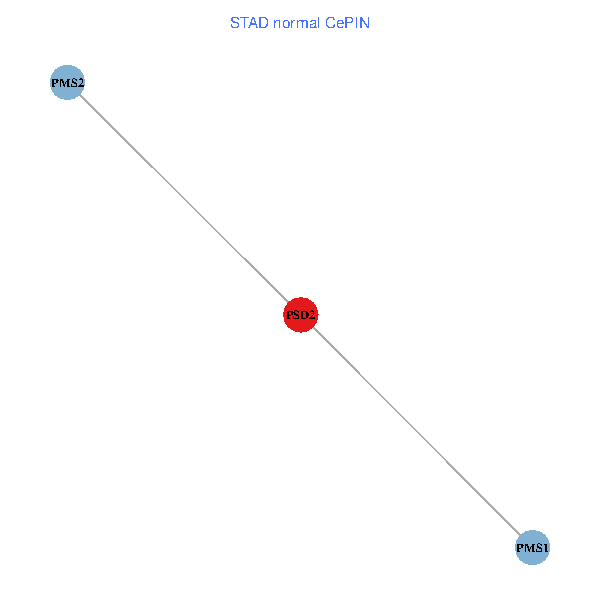
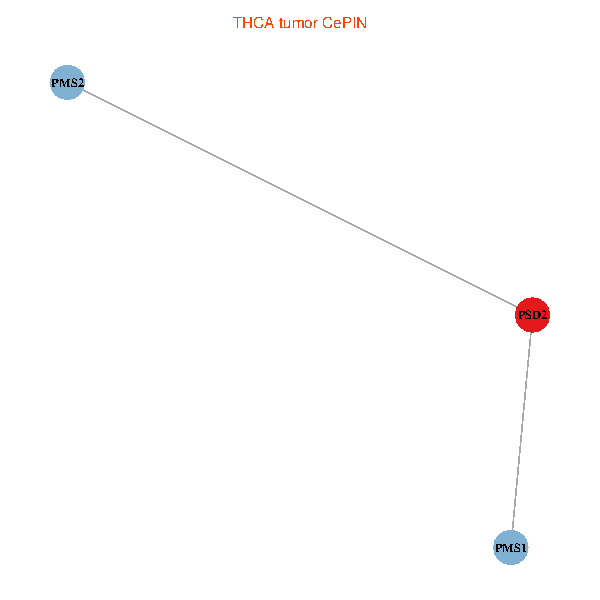
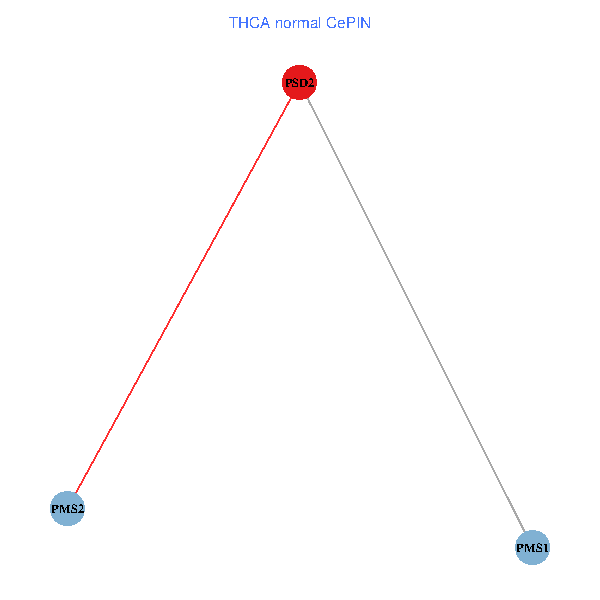
| TissGeneNet for PSD2 |
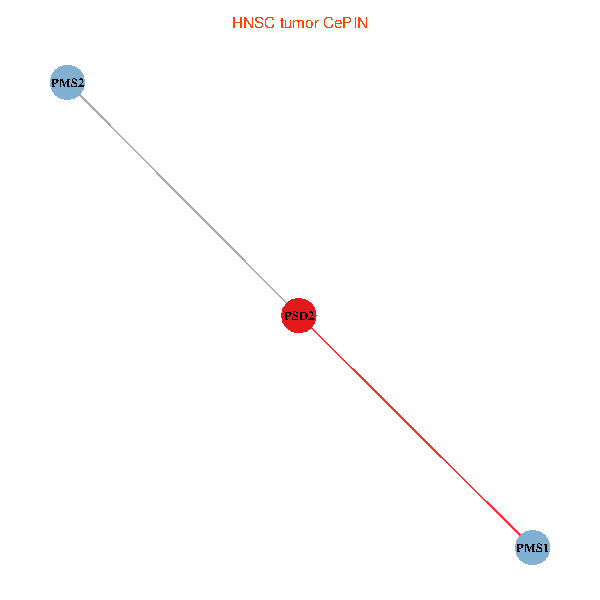
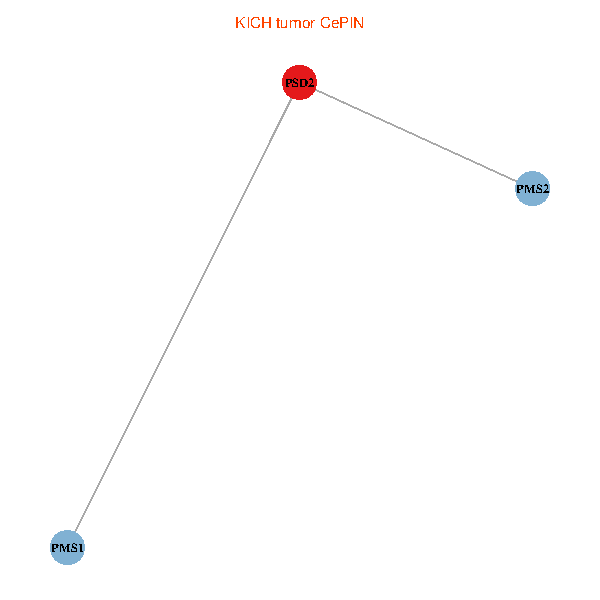
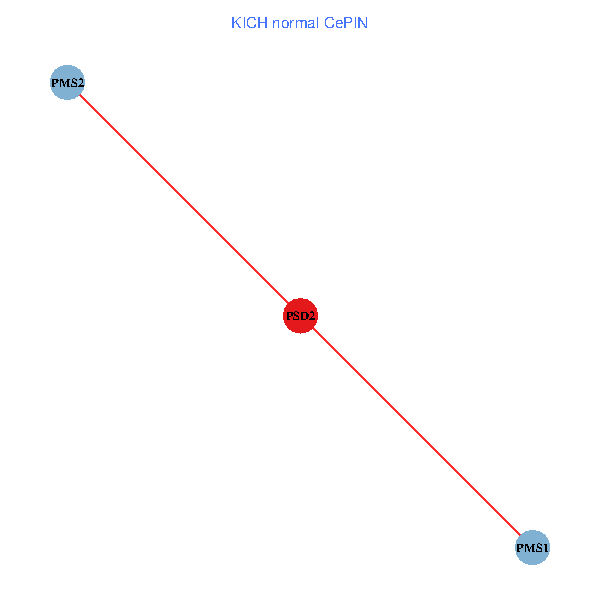
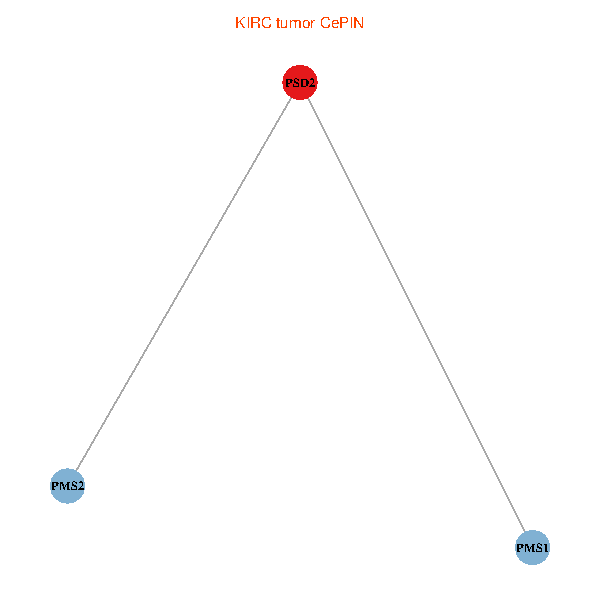
| Co-expressed gene networks based on protein-protein interaction data (CePIN) (TCGA IlluminaHiSeq_RNASeqV2, pan-cancer normalized log2(norm_counts+1) data, version 2016-08-16) (PINA2 ppi data) |
| BRCA (tumor) | BRCA (normal) |
| PSD2, PMS1, PMS2 (tumor) | PSD2, PMS1, PMS2 (normal) |
 |  |
| COAD (tumor) | COAD (normal) |
| PSD2, PMS1, PMS2 (tumor) | PSD2, PMS1, PMS2 (normal) |
 |  |
| HNSC (tumor) | HNSC (normal) |
| PSD2, PMS1, PMS2 (tumor) | PSD2, PMS1, PMS2 (normal) |
 |  |
| KICH (tumor) | KICH (normal) |
| PSD2, PMS1, PMS2 (tumor) | PSD2, PMS1, PMS2 (normal) |
 |  |
| KIRC (tumor) | KIRC (normal) |
| PSD2, PMS1, PMS2 (tumor) | PSD2, PMS1, PMS2 (normal) |
 |  |
| KIRP (tumor) | KIRP (normal) |
| PSD2, PMS1, PMS2 (tumor) | PSD2, PMS1, PMS2 (normal) |
 |  |
| LIHC (tumor) | LIHC (normal) |
| PSD2, PMS1, PMS2 (tumor) | PSD2, PMS1, PMS2 (normal) |
 |  |
| LUAD (tumor) | LUAD (normal) |
| PSD2, PMS1, PMS2 (tumor) | PSD2, PMS1, PMS2 (normal) |
 |  |
| LUSC (tumor) | LUSC (normal) |
| PSD2, PMS1, PMS2 (tumor) | PSD2, PMS1, PMS2 (normal) |
 |  |
| PRAD (tumor) | PRAD (normal) |
| PSD2, PMS1, PMS2 (tumor) | PSD2, PMS1, PMS2 (normal) |
 |  |
| STAD (tumor) | STAD (normal) |
| PSD2, PMS1, PMS2 (tumor) | PSD2, PMS1, PMS2 (normal) |
 |  |
| THCA (tumor) | THCA (normal) |
| PSD2, PMS1, PMS2 (tumor) | PSD2, PMS1, PMS2 (normal) |
 |  |
| Top |
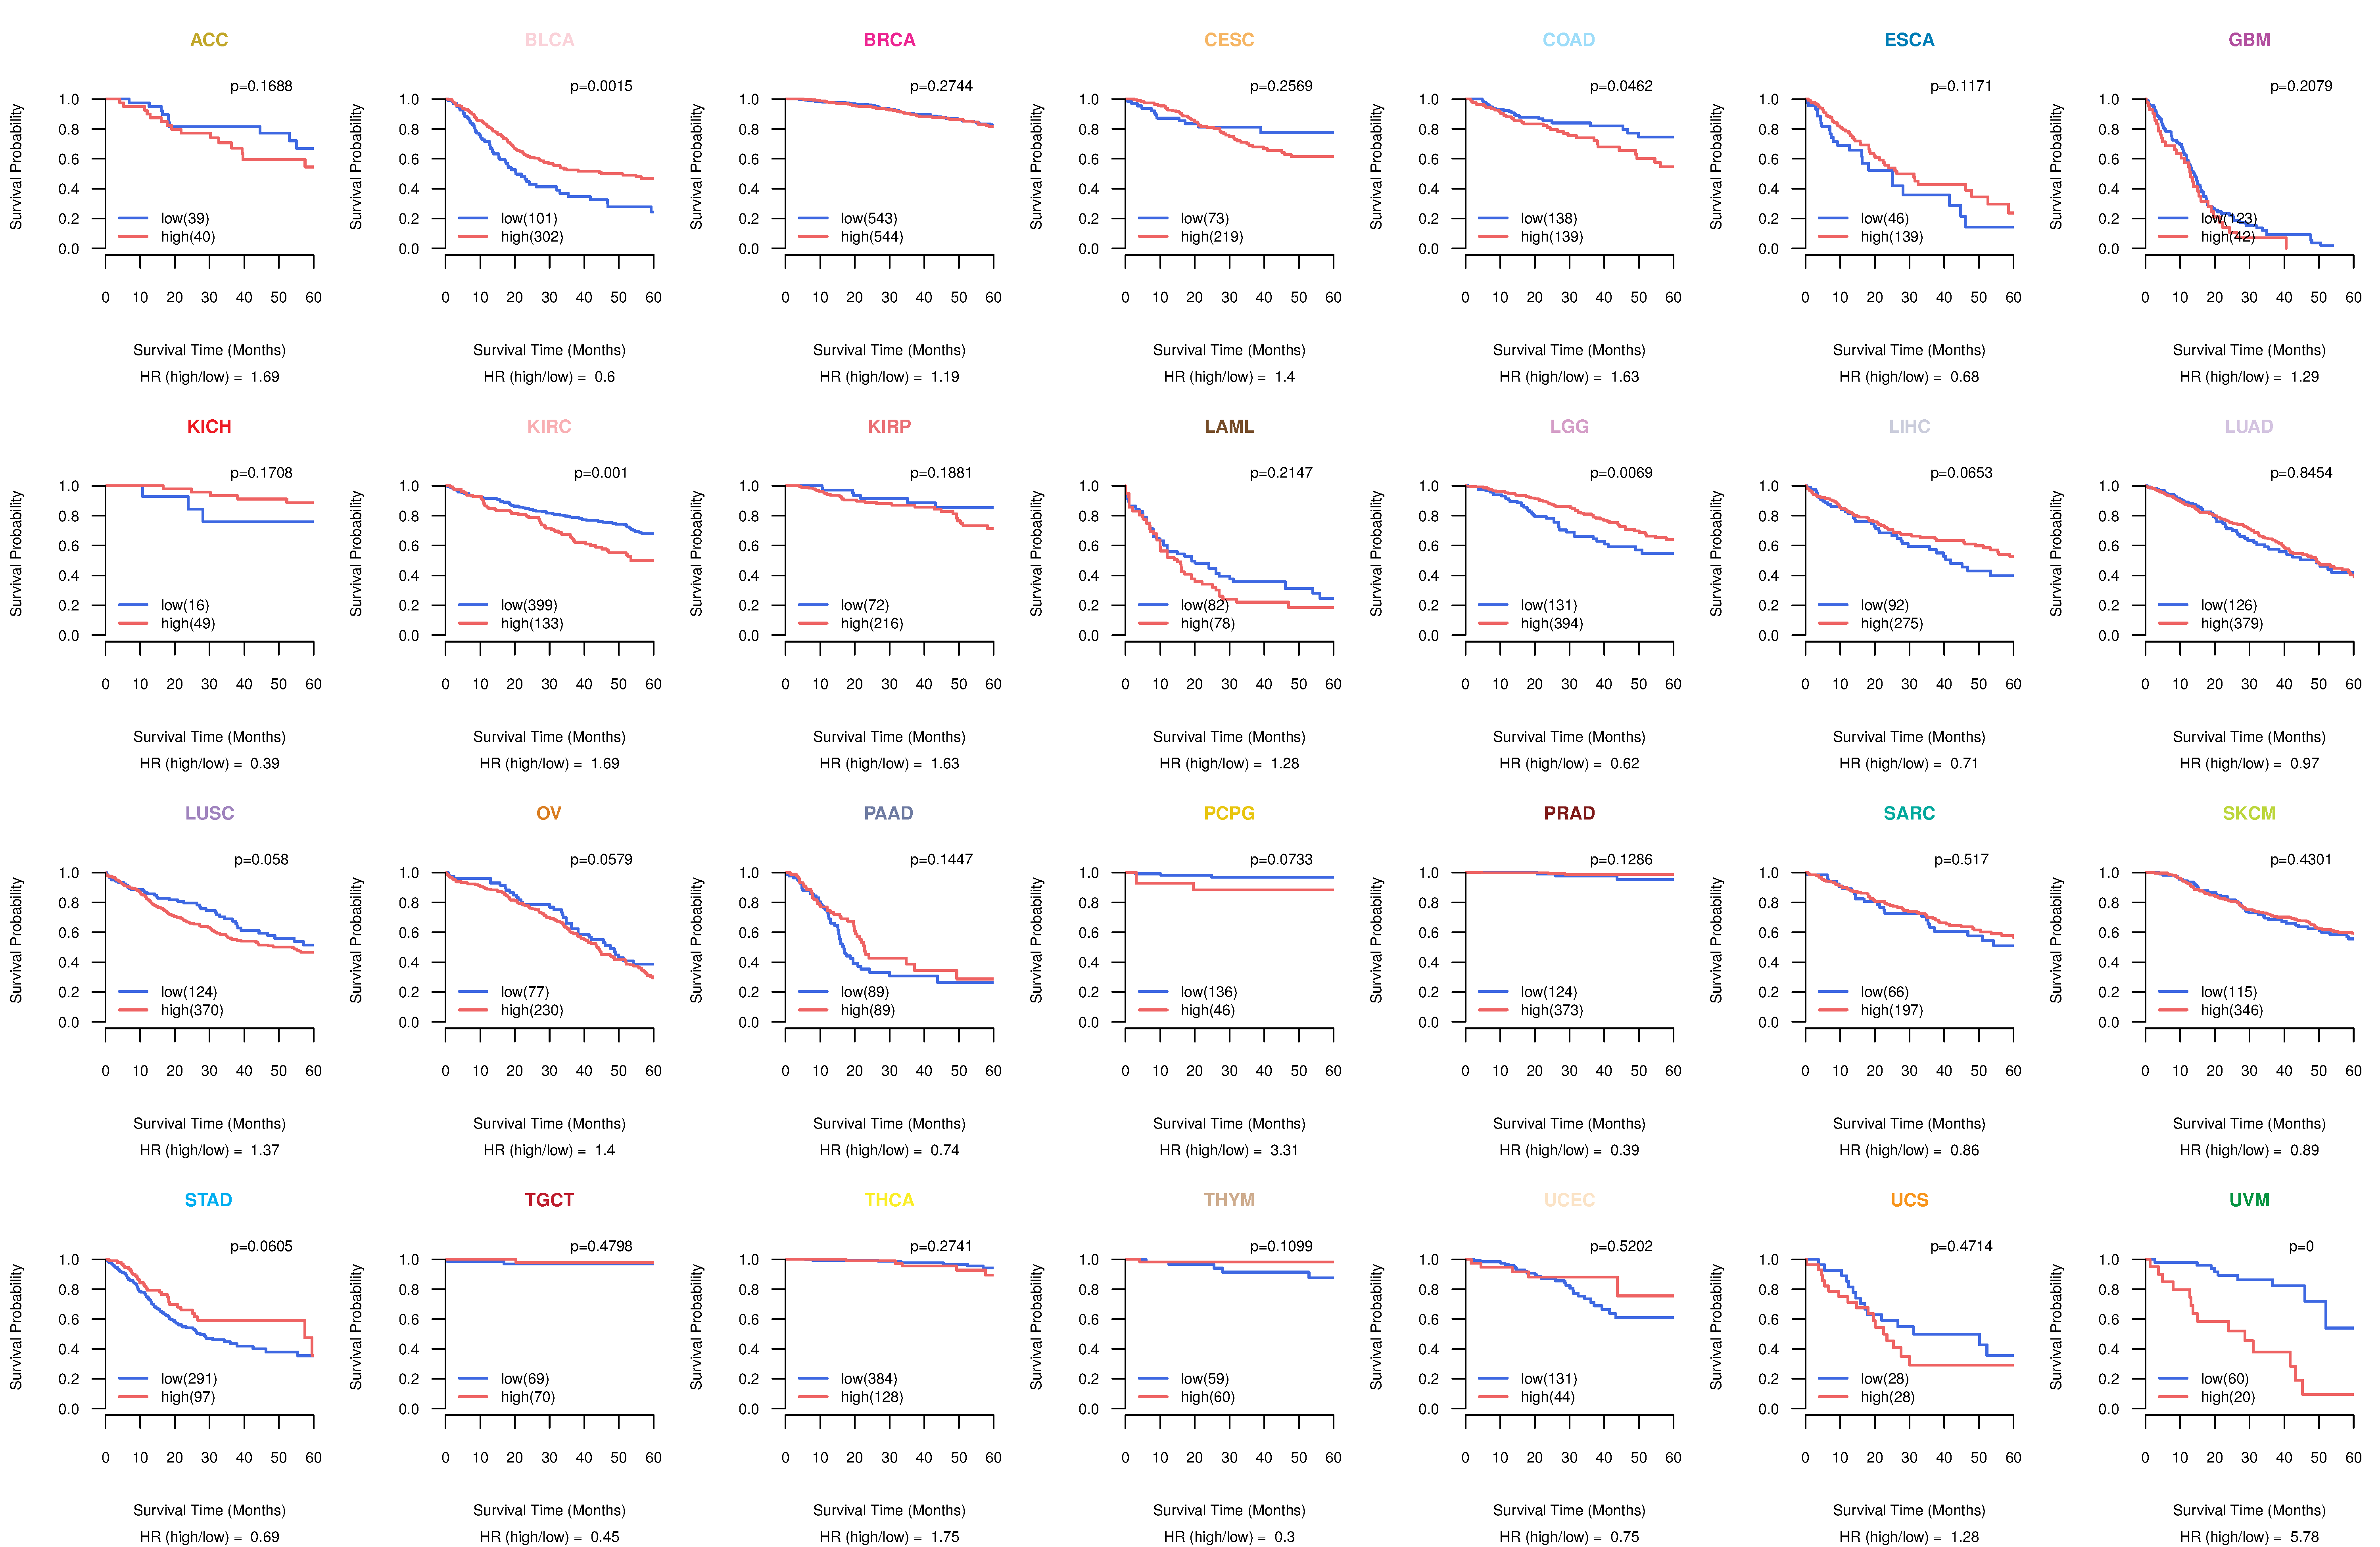
| TissGeneProg for PSD2 |
| Kaplan-Meier plots with logrank tests of overall survival (OS) using 28 cancer types (TCGA IlluminaHiSeq_RNASeqV2, pan-cancer normalized log2(norm_counts+1) data, version 2016-08-16) (TCGA clinicalMatrix, phenotype data, version 2016-04-27) * Click on the image to enlarge it in a new window. |
 |
| Kaplan-Meier plots with logrank test of relapse free survival (RFS) using 28 cancer types (TCGA IlluminaHiSeq_RNASeqV2, pan-cancer normalized log2(norm_counts+1) data, version 2016-08-16) (TCGA clinicalMatrix, phenotype data, version 2016-04-27) * Click on the image enlarge it in a new window. |
 |
| Forest plot of Cox proportional hazard ratio (HR) and 95% CI of overall survival (OS) using 28 cancer types (TCGA IlluminaHiSeq_RNASeqV2, pan-cancer normalized log2(norm_counts+1) data, version 2016-08-16) (TCGA clinicalMatrix, phenotype data, version 2016-04-27) * Click on the image enlarge it in a new window. |
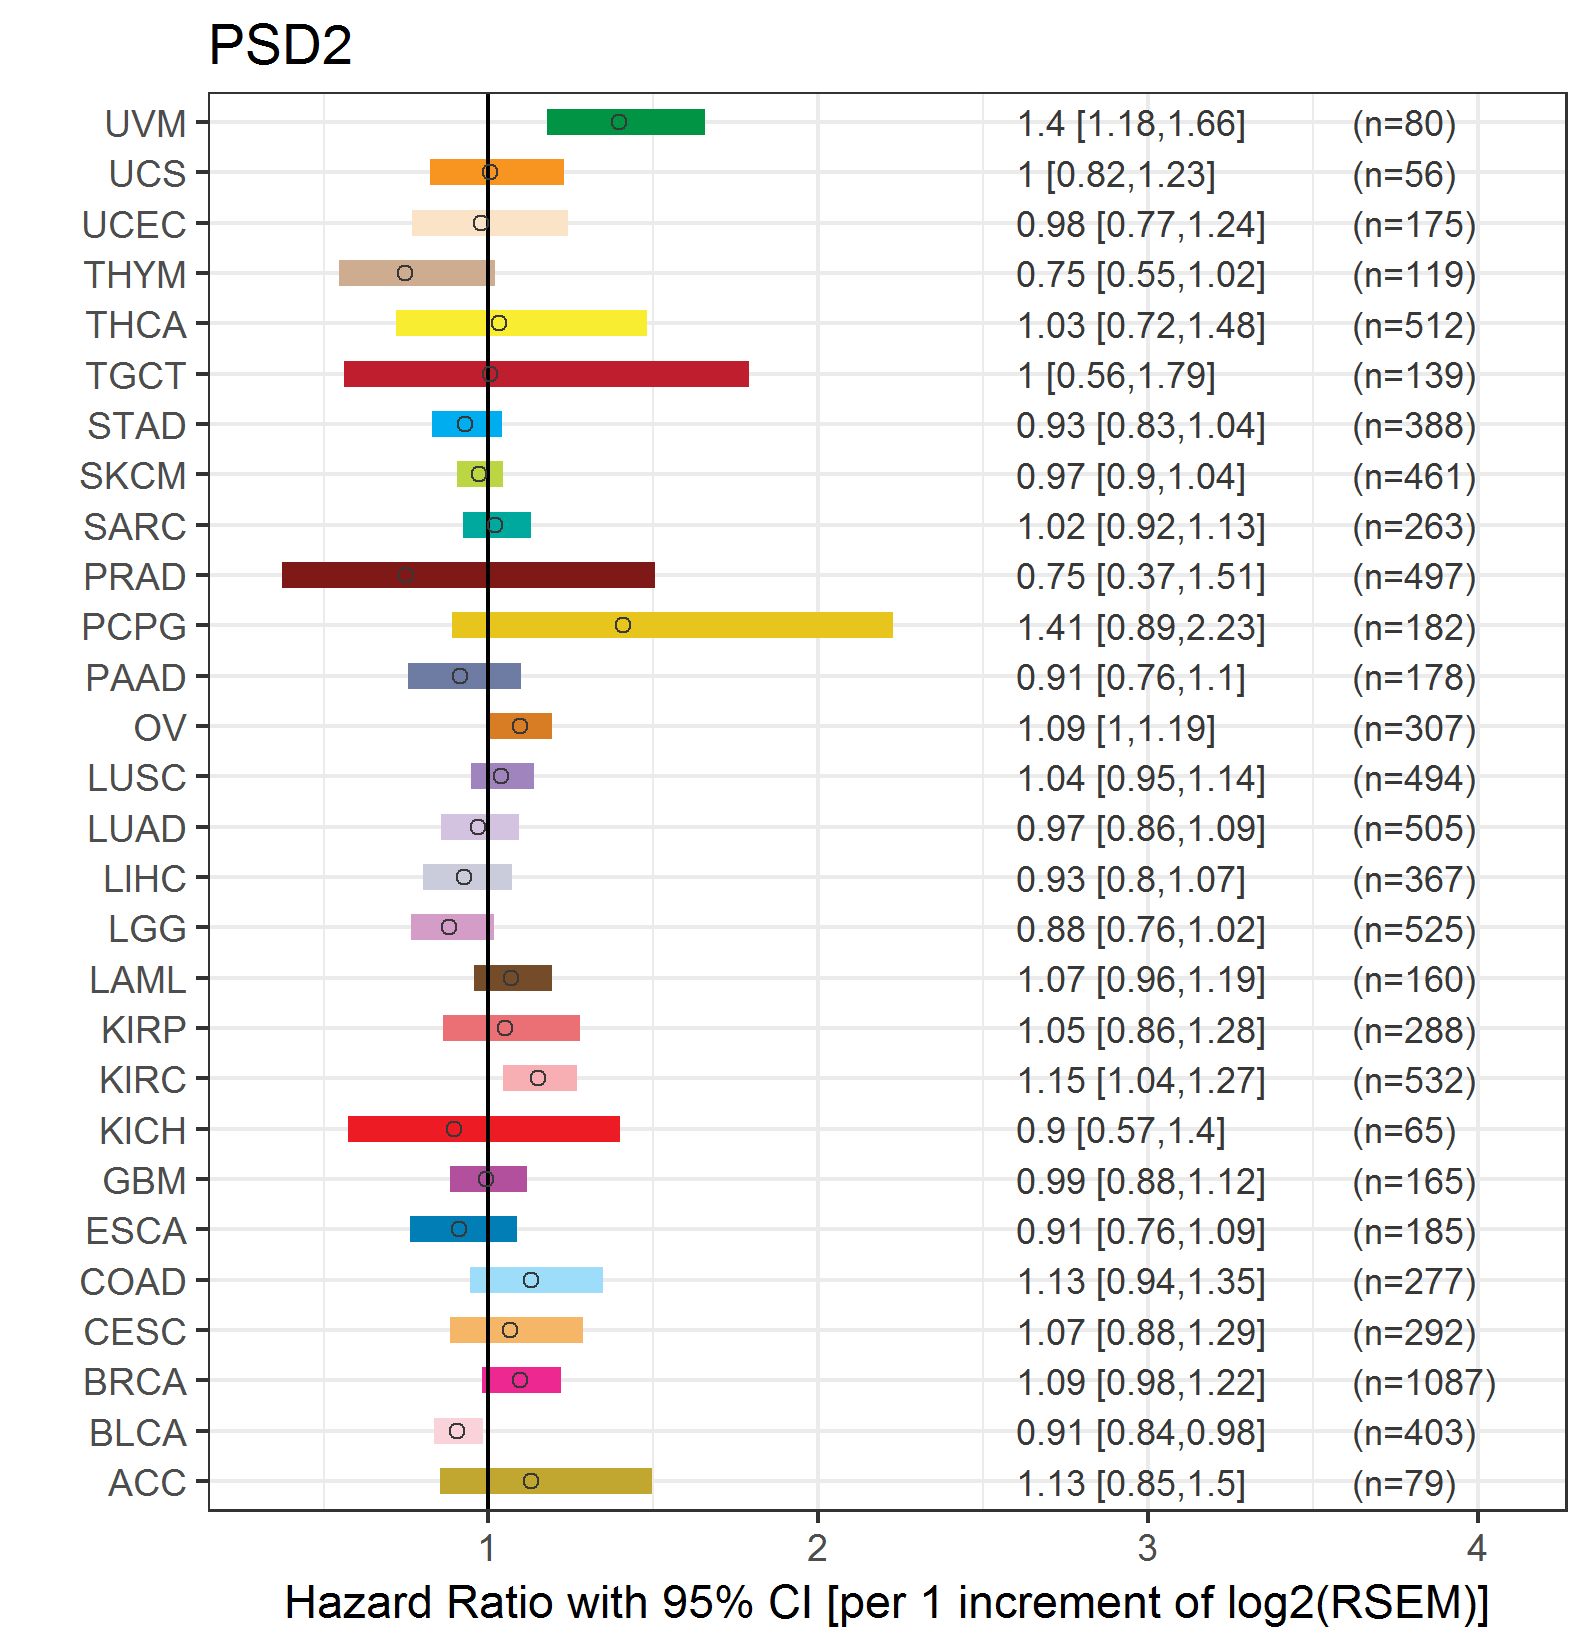 |
| Forest plot of Cox proportional hazard ratio (HR) and 95% CI of relapse free survival (RFS) using 28 cancer types (TCGA IlluminaHiSeq_RNASeqV2, pan-cancer normalized log2(norm_counts+1) data, version 2016-08-16) (TCGA clinicalMatrix, phenotype data, version 2016-04-27) * Click on the image enlarge it in a new window. |
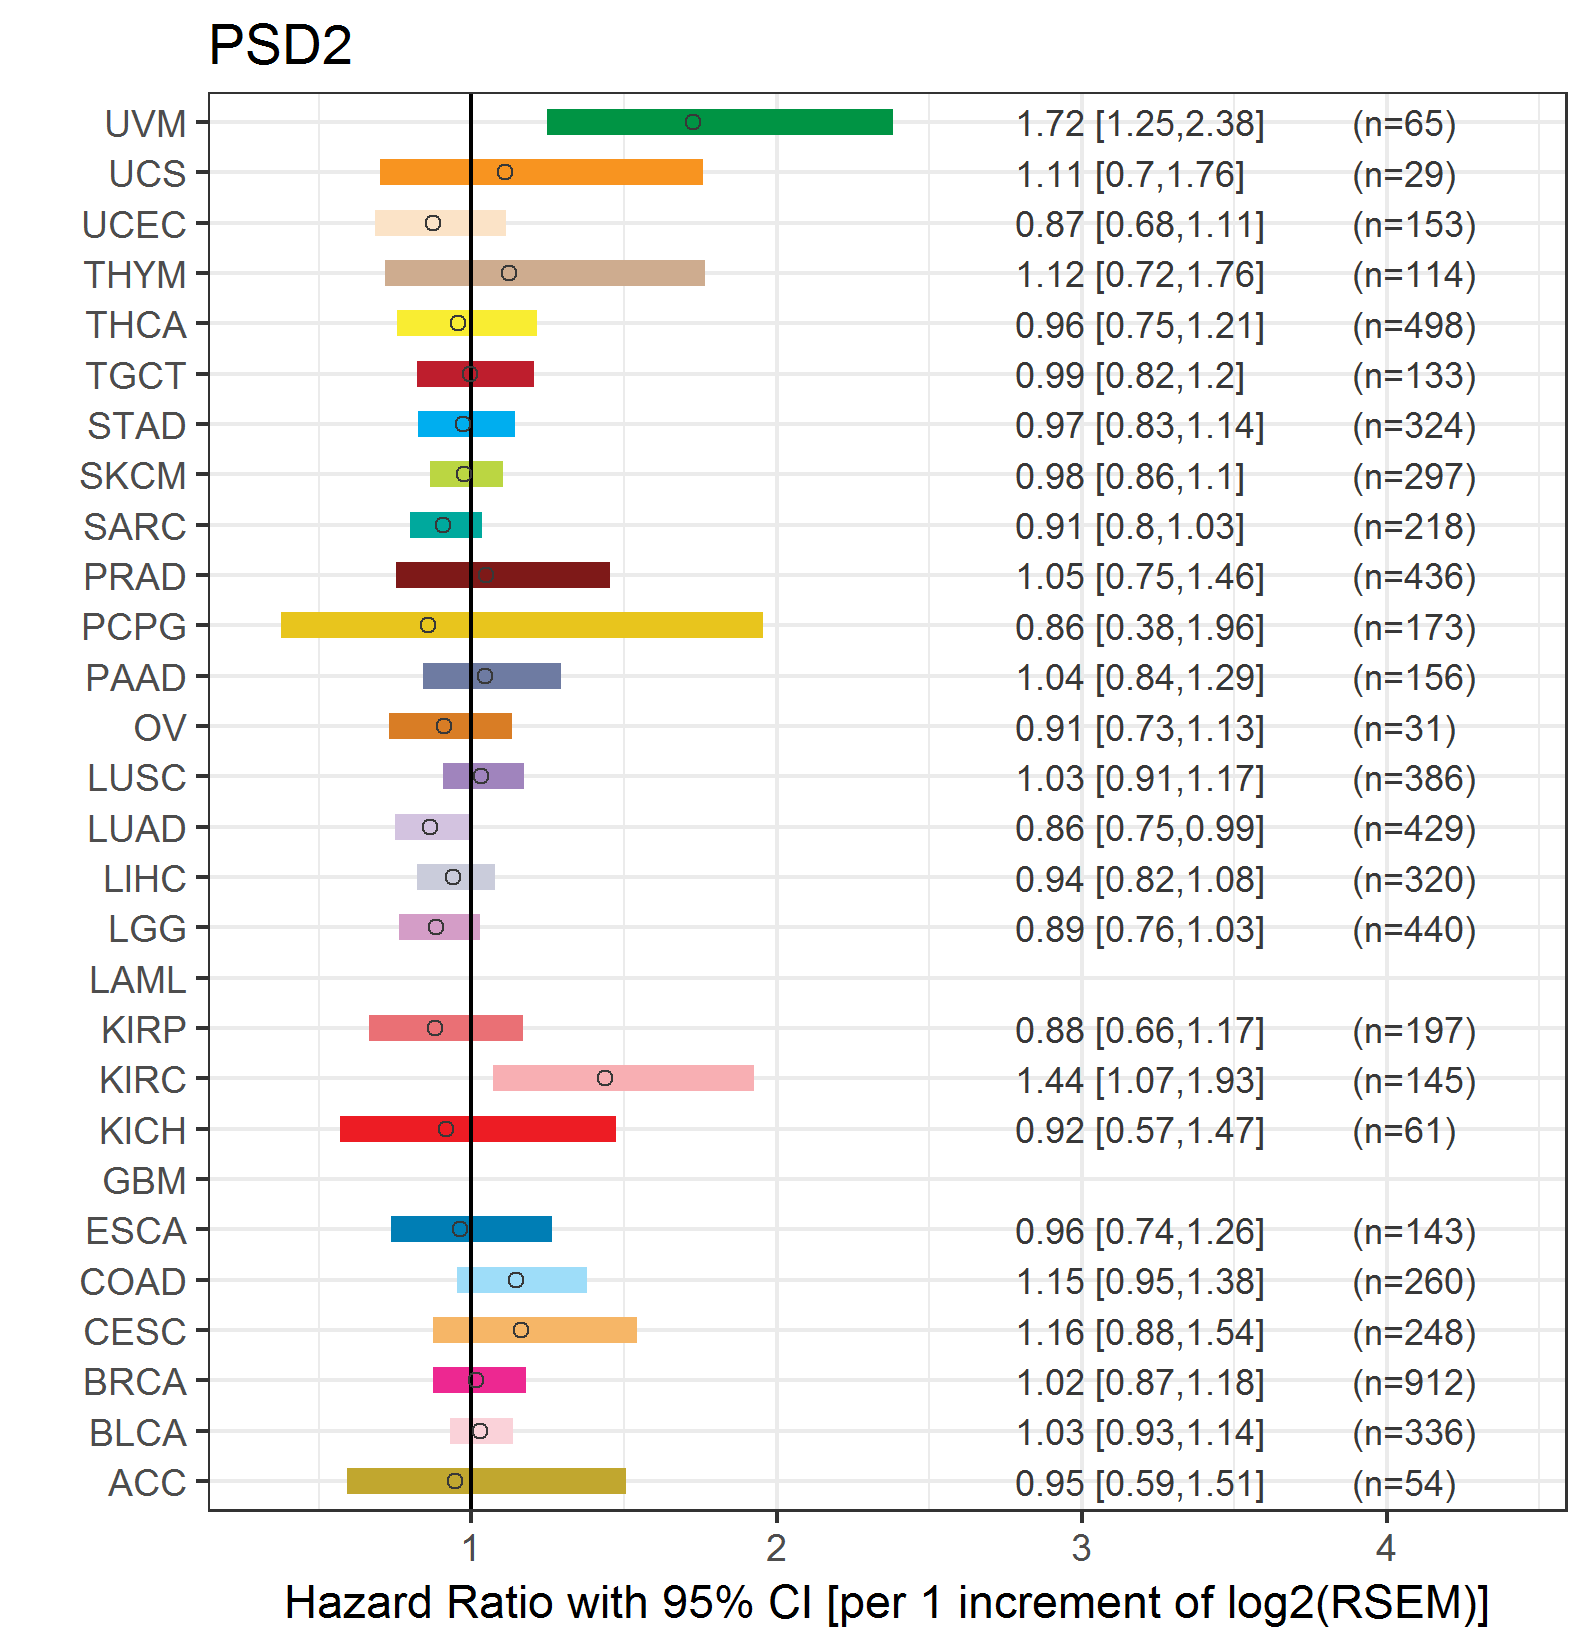 |
| Top |
| TissGeneClin for PSD2 |
| TissGeneDrug for PSD2 |
| Drug information targeting TissGene (DrugBank Version 5.0.6, 2017-04-01) |
| DrugBank ID | Drug name | Drug activity | Drug type | Drug status |
| Top |
| TissGeneDisease for PSD2 |
| Disease information associated with TissGene (DisGeNet, 2016-06-01) |
| Disease ID | Disease name | # pubmeds | Source |
| umls:C0032927 | Precancerous Conditions | 1 | CTD_human |
|
Copyright 2016-Present - The University of Texas Health Science Center at Houston (UTHealth) Web File Viewing | How to Report, Fraud, Waste and Abuse | State of Texas | Statewide Search | Texas Homeland Security | Site Policies |