 |
| |
| |
| |
| |
| |
| |
|

| TissGeneSummary for MON1A |
 Gene summary Gene summary |
| Basic gene information | Gene symbol | MON1A |
| Gene name | MON1 secretory trafficking family member A | |
| Synonyms | SAND1 | |
| Cytomap | UCSC genome browser: 3p21.31 | |
| Type of gene | protein-coding | |
| RefGenes | NM_001142501.1, NM_032355.3, | |
| Description | MON1 homolog Avacuolar fusion protein MON1 homolog A | |
| Modification date | 20141207 | |
| dbXrefs | MIM : 611464 | |
| HGNC : HGNC | ||
| Ensembl : ENSG00000164077 | ||
| HPRD : 17586 | ||
| Vega : OTTHUMG00000156737 | ||
| Protein | UniProt: go to UniProt's Cross Reference DB Table | |
| Expression | CleanEX: HS_MON1A | |
| BioGPS: 84315 | ||
| Pathway | NCI Pathway Interaction Database: MON1A | |
| KEGG: MON1A | ||
| REACTOME: MON1A | ||
| Pathway Commons: MON1A | ||
| Context | iHOP: MON1A | |
| ligand binding site mutation search in PubMed: MON1A | ||
| UCL Cancer Institute: MON1A | ||
| Assigned class in TissGDB* | C | |
| Included tissue-specific gene expression resources | TiGER,GTEx | |
| Specific-tissues in normal samples (assigned by TissGDB using HPA, TiGER, and GTEx) | CervixTestis | |
| Cancer types related to the specific-tissues in cancer samples (assigned by TissGDB using TCGA) | CESCTGCT | |
| Reference showing the relevant tissue of MON1A | ||
| Description by TissGene annotations | TissgsLTS Fused withTSGene | |
| * Class A consists of genes with literature evidence and is part of the cTissGenes. Class B consists of only cTissGenes without additional evidence. The remaining genes belong to Class C. |
| Gene ontology having evidence of Inferred from Direct Assay (IDA) from Entrez |
| GO ID | GO term | PubMed ID |
| Top |
| TissGeneExp for MON1A |
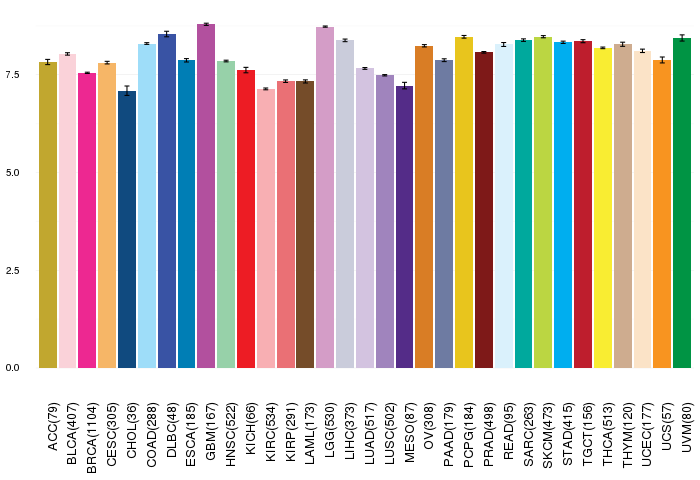
| Gene expressions across 28 cancer types (X-axis: cancer type and Y-axis: log2(norm_counts+1)) (TCGA IlluminaHiSeq_RNASeqV2, pan-cancer normalized log2(norm_counts+1) data, version 2016-08-16) |
 |
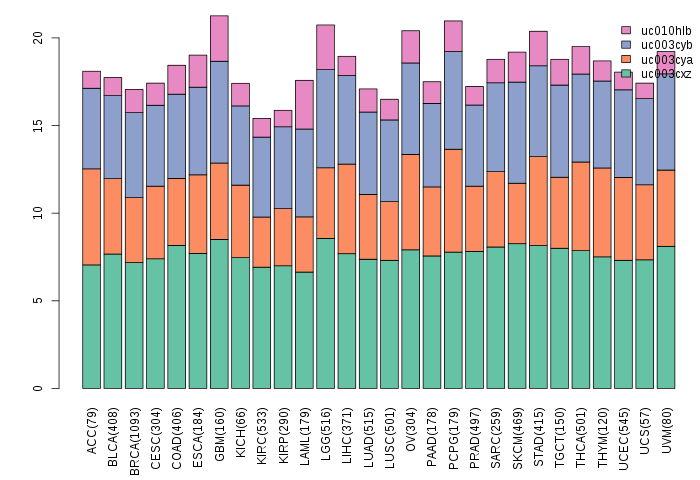
| Gene isoform expressions across 28 cancer types (X-axis: cancer type and Y-axis: log2(norm_counts+1)) (TCGA pan-cancer tcga_rsem_isoform_tpm, version 2016-09-01) |
 |
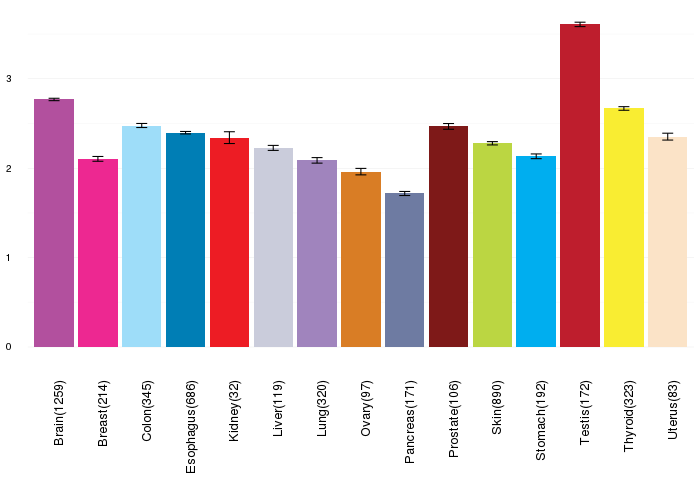
| Gene expressions across normal tissues of GTEx data (GTEx GTEx_Analysis_v6_RNA-seq_RNA-SeQCv1.1.8_gene_rpkm.gct) - Here, we shows the matched tissue types only among our 28 cancer types. |
 |
| Different expressions across 14 cancer types with more than 10 samples between matched tumors and normals (X-axis: cancer type and Y-axis: log2(norm_counts+1)) (TCGA IlluminaHiSeq_RNASeqV2, pan-cancer normalized log2(norm_counts+1) data, version 2016-08-16) |
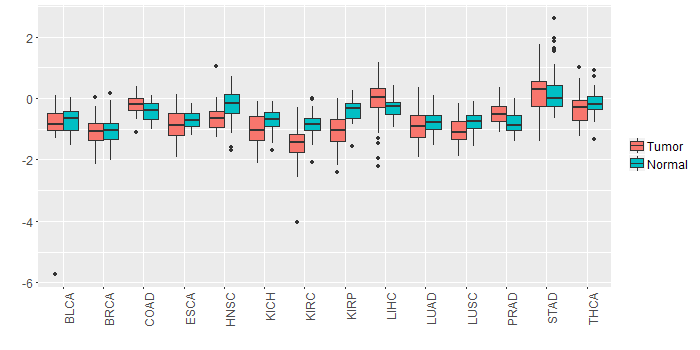 |
| - Significantly differentially expressed cancer types and information. (|Fold change|>1 and FDR<0.05) |
| Cancer type | Mean(exp) in tumor | Mean(exp) in matched normal | Log2FC | P-val. | FDR |
| Top |
| TissGene-miRNA for MON1A |
| Significantly anti-correlated miRNAs of TissGene across 28 cancer types (Gene-miRNA relations from TargetScanHuman Relsease 7.1, Conserved_Site_Context_Scores.txt.zip, 06.01.2016) (TCGA IlluminaHiSeq_miRNASeq, log2(RPM+1) data, version 2016-11-21) (TCGA IlluminaHiSeq_RNASeqV2, log2(normalized_count+1) data, version 2016-08-16) (Spearman’s Rank Correlation (p-value<0.05 and coefficient<-0.25)) |
| Cancer type | miRNA id | miRNA accession | P-val. | Coeff. | # samples |
| Top |
| TissGeneMut for MON1A |
| TissGeneSNV for MON1A |
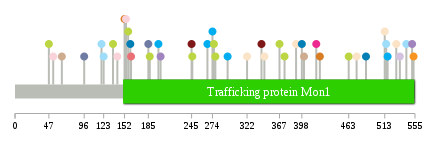
| nsSNV counts per each loci. Different colors of circles represent different cancer types. Circle size denotes number of samples. (TCGA somatic mutation (SNPs and small INDELs) data, version 2016-04-25) * Click on the image to enlarge it in a new window. |
 |
 |
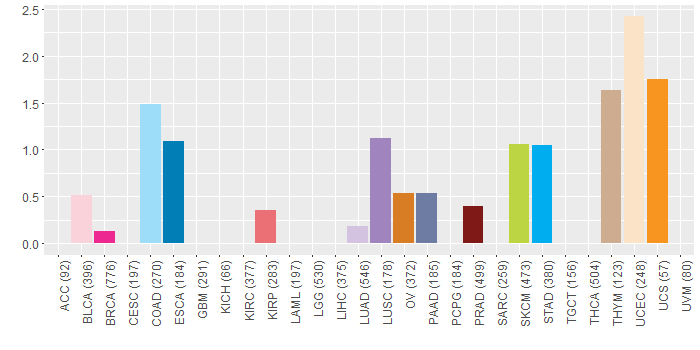
| Somatic nucleotide variants of TissGene across 28 cancer types (X-axis: cancer type and Y-axis: % of mutated samples) The numbers in parentheses are numbers of samples with mutation (nsSNVs). (TCGA somatic mutation (SNPs and small INDELs) data, version 2016-04-25) |
 |
| - nsSNVs sorted by frequency. |
| AAchange | Cancer type | # samples |
| p.G47R | SKCM | 1 |
| p.D154N | BLCA | 1 |
| p.E459K | HNSC | 1 |
| p.G53D | BLCA | 1 |
| p.S276F | SKCM | 1 |
| p.D553G | UCS | 1 |
| p.T199M | STAD | 1 |
| p.L245I | PRAD | 1 |
| p.M123I | COAD | 1 |
| p.T322M | UCEC | 1 |
| p.E157K | SKCM | 1 |
| p.V534I | LUAD | 1 |
| p.G278S | SKCM | 1 |
| p.R185C | PAAD | 1 |
| p.G142D | BLCA | 1 |
| p.A295T | STAD | 1 |
| p.S160X | ESCA | 1 |
| p.S551N | LUSC | 1 |
| p.E246K | SKCM | 1 |
| p.R152H | OV | 1 |
| p.D398A | ESCA | 1 |
| p.T529A | UCEC | 1 |
| p.E161X | KIRP | 1 |
| p.R543C | COAD | 1 |
| p.R423C | OV | 1 |
| p.A274S | STAD | 1 |
| p.S267F | STAD | 1 |
| p.R515C | COAD | 1 |
| p.D487A | ESCA | 1 |
| p.P463L | SKCM | 1 |
| p.A390S | UCEC | 1 |
| p.R65G | THYM | 1 |
| p.P131A | HNSC | 1 |
| p.S418F | BRCA | 1 |
| p.G120V | COAD | 1 |
| p.D642G | UCS | 1 |
| p.R517C | STAD | 1 |
| p.P374L | SKCM | 1 |
| p.E370K | HNSC | 1 |
| p.R96C | PAAD | 1 |
| p.G346S | UCEC | 1 |
| p.F474L | UCEC | 1 |
| p.R513H | UCEC | 1 |
| p.D401N | THYM | 1 |
| p.S187F | SKCM | 1 |
| p.A202T | LUSC | 1 |
| p.R342C | PRAD | 1 |
| p.G367S | SKCM | 1 |
| p.G136R | SKCM | 1 |
| Top |
| TissGeneCNV for MON1A |
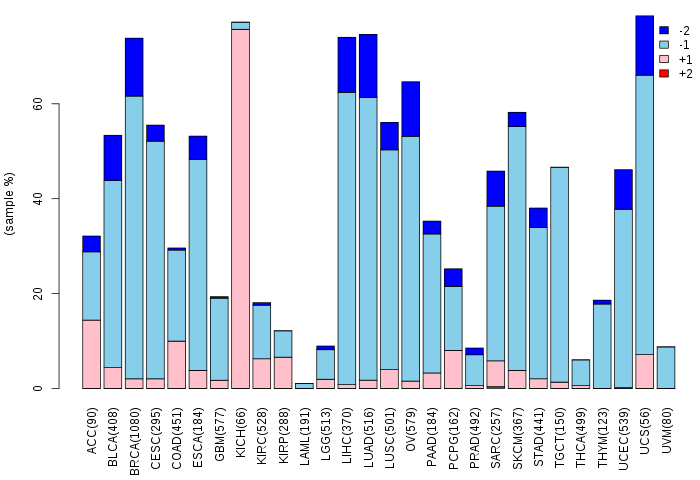
| Copy number variations of TissGene across 28 cancer types (X-axis: cancer type and Y-axis: % of CNV samples) (TCGA Gistic2_CopyNumber_Gistic2_all_data_by_genes, Gistic2 copy number data, version 2016-08-16) |
 |
| Top |
| TissGeneFusions for MON1A |
| Fusion genes including TissGene (ChimerDB 3.0, 2016-12-01 and TCGA fusion Portal 2015-12-01) |
| Database | Src | Cancer type | Sample | Fusion gene | ORF | 5'-gene BP | 3'-gene BP |
| Chimerdb3.0 | FusionScan | ESCA | TCGA-JY-A6FA-01A | RBM6-MON1A | In-Frame | chr3:50000118 | chr3:49950792 |
| TCGAfusionPortal | PRADA | PRAD | TCGA-HC-8265-01A | MAP4-MON1A | 5UTR-CDS | Chr3:48130263 | Chr3:49950792 |
| Top |
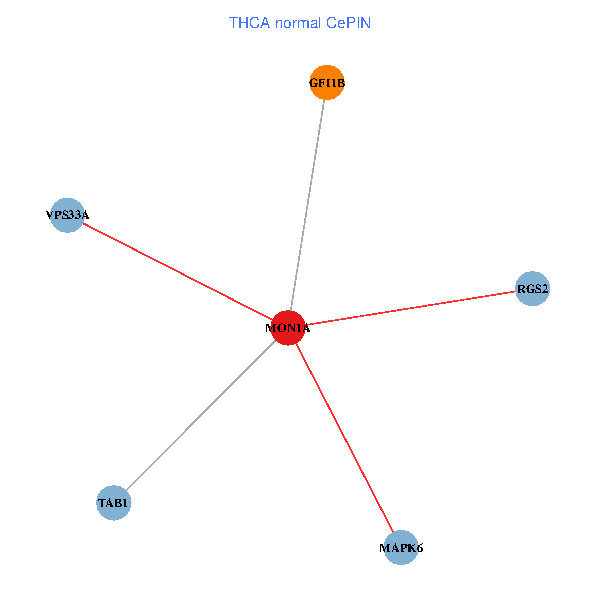
| TissGeneNet for MON1A |
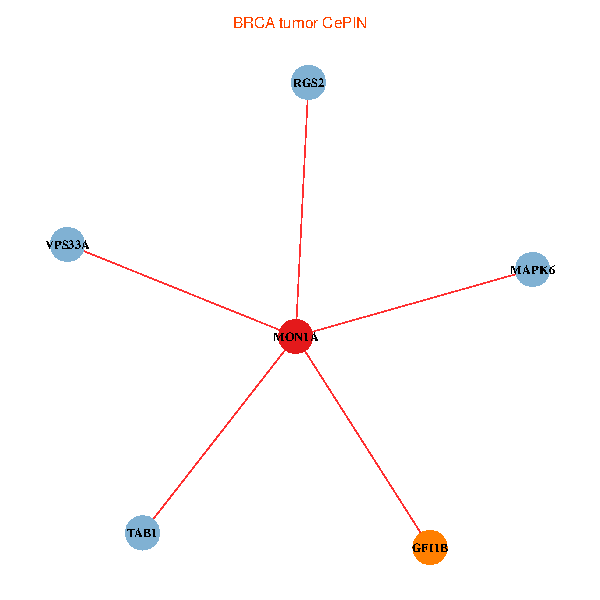
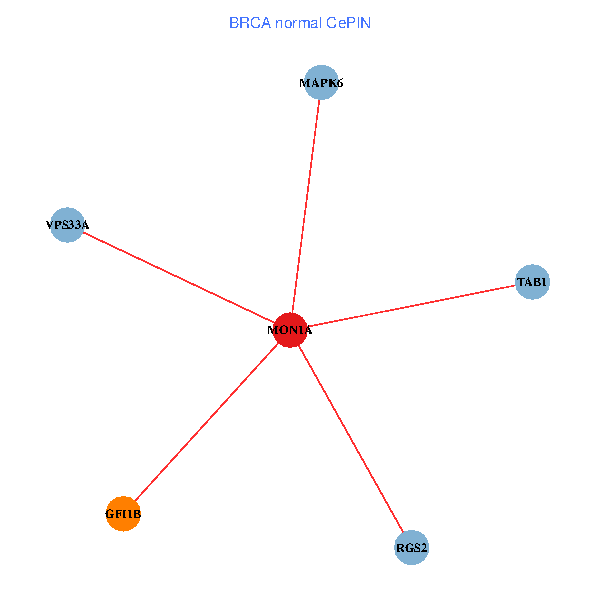
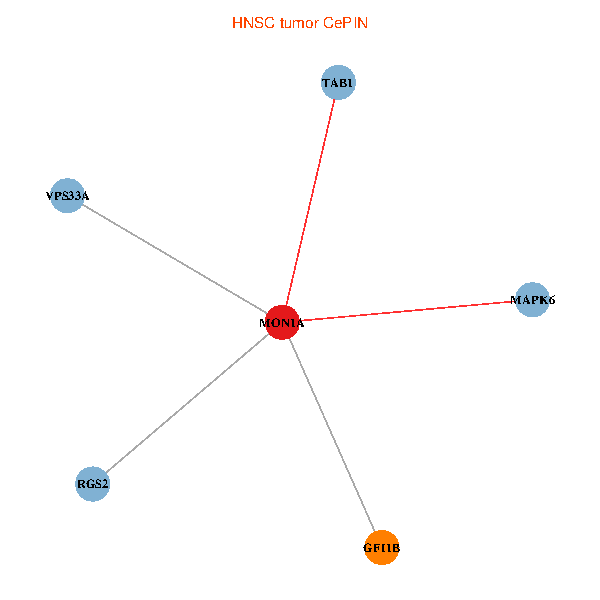
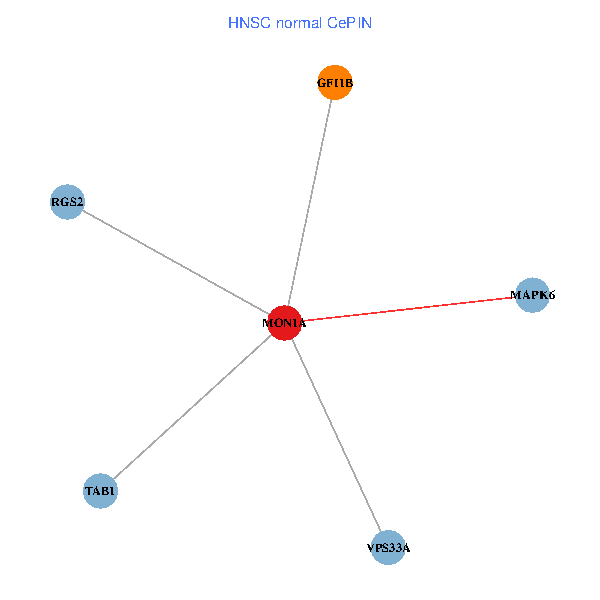
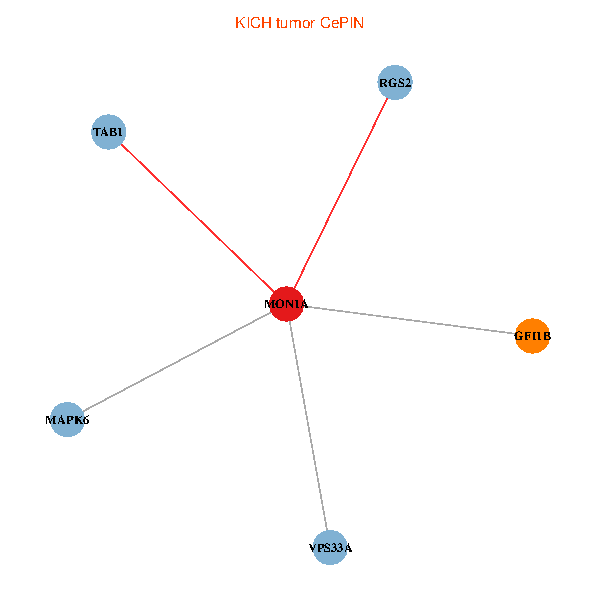
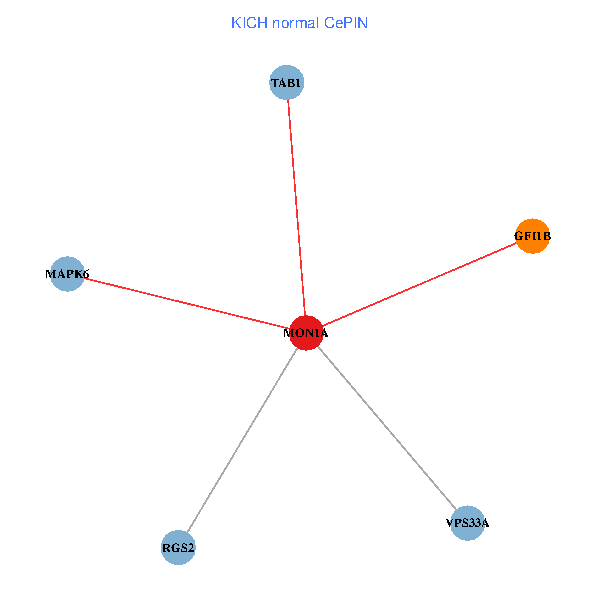
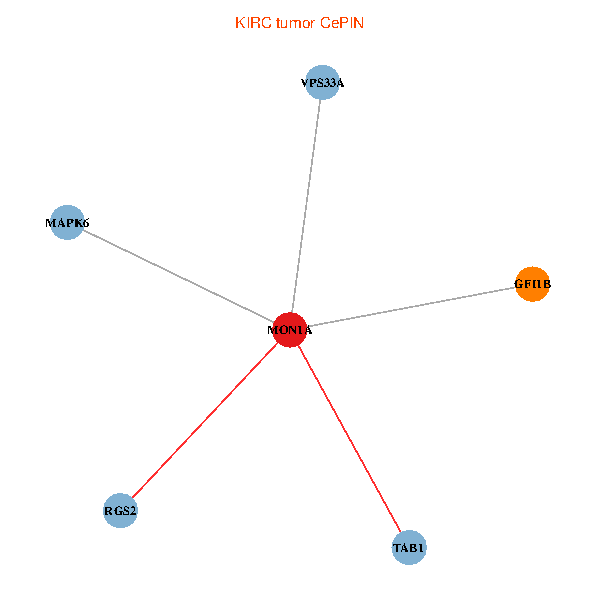
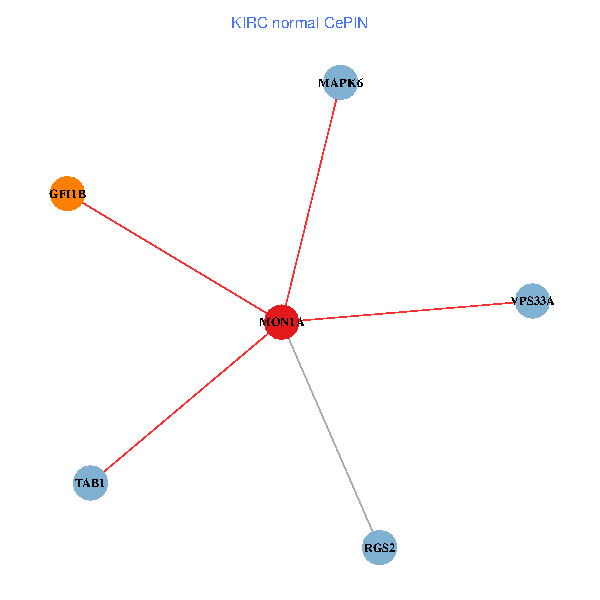
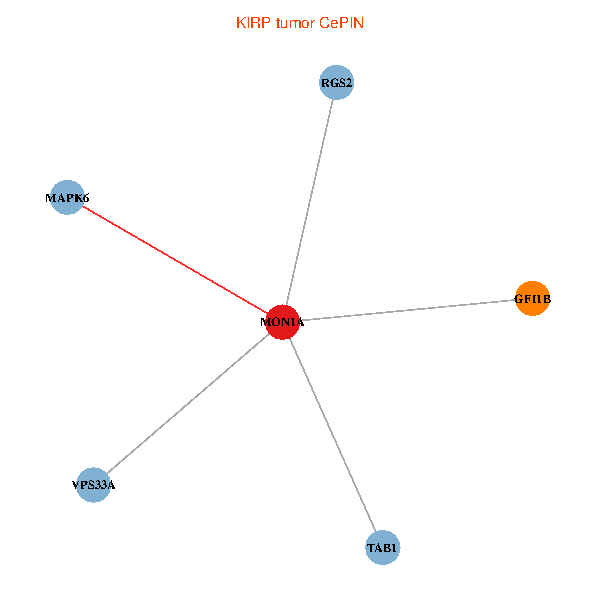
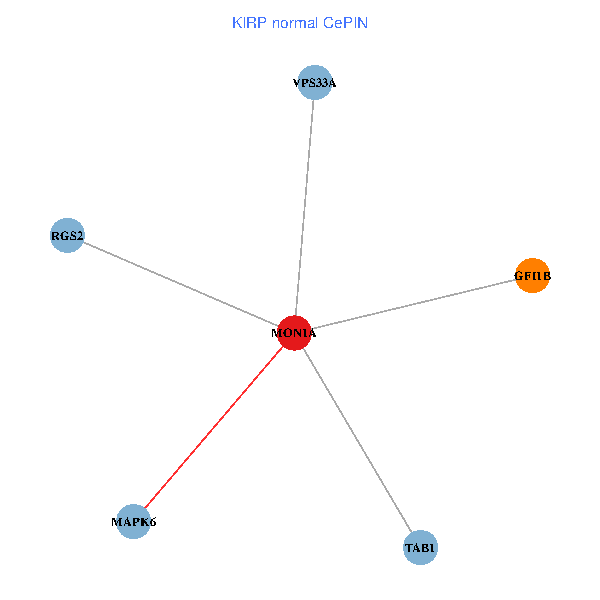
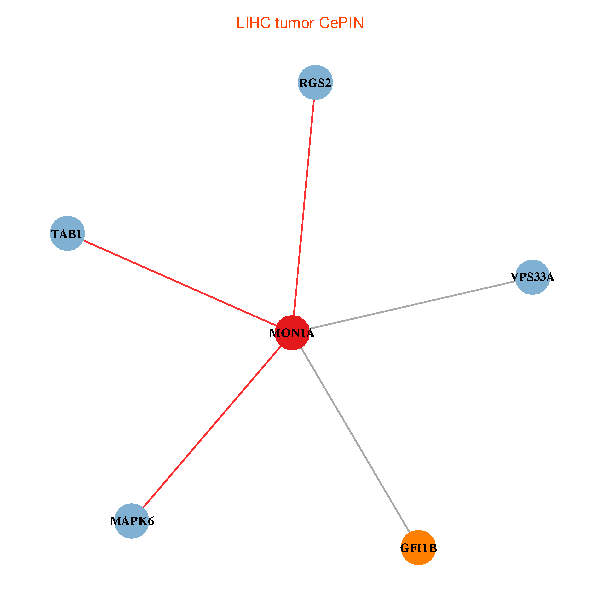
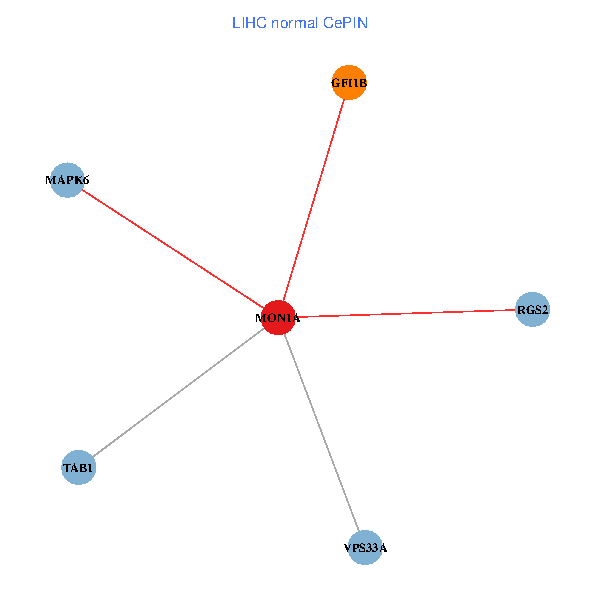
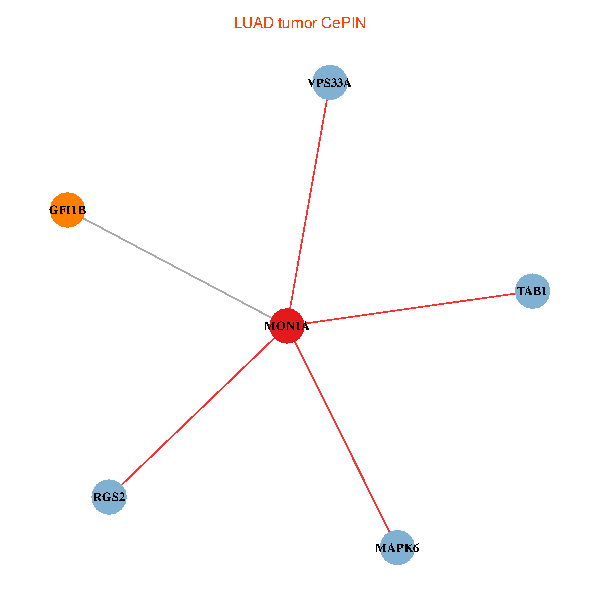
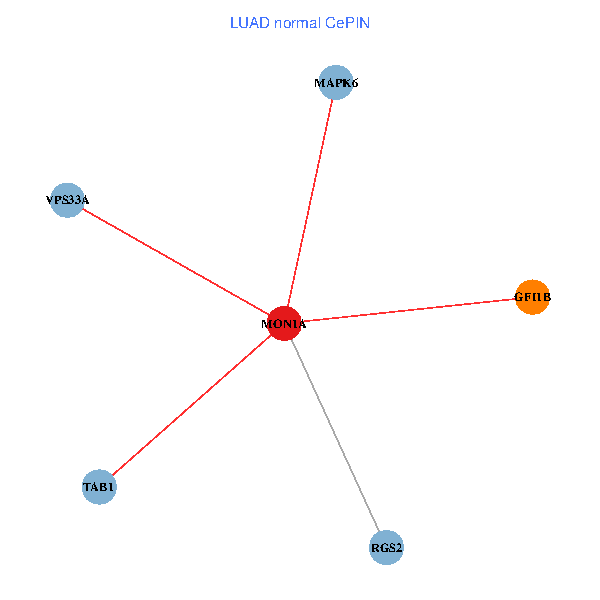
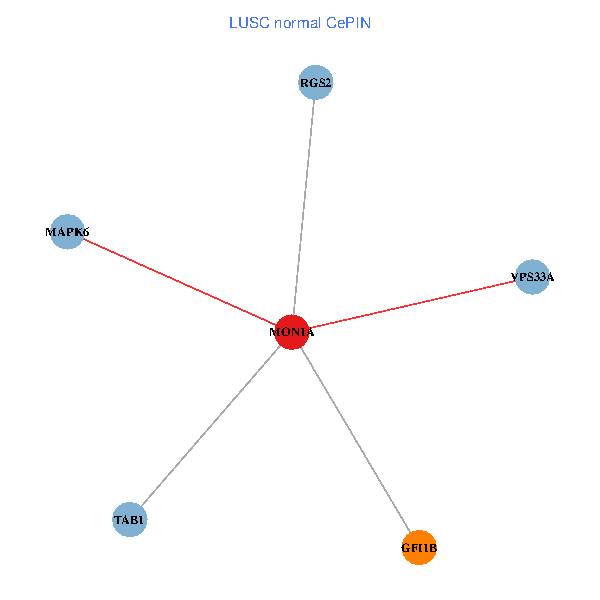
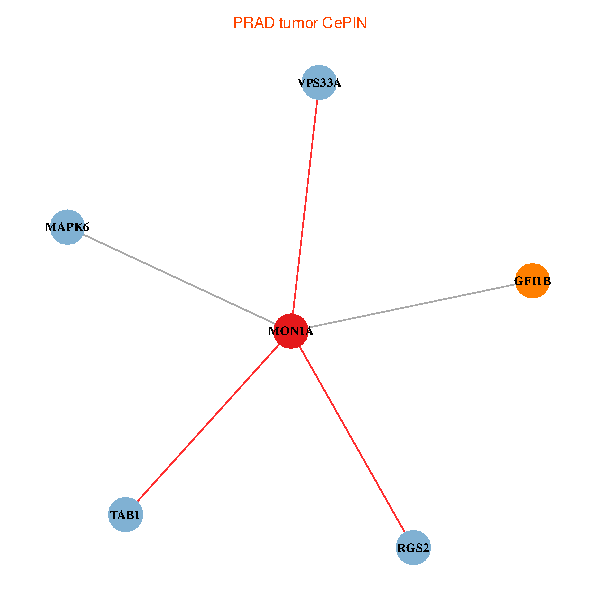
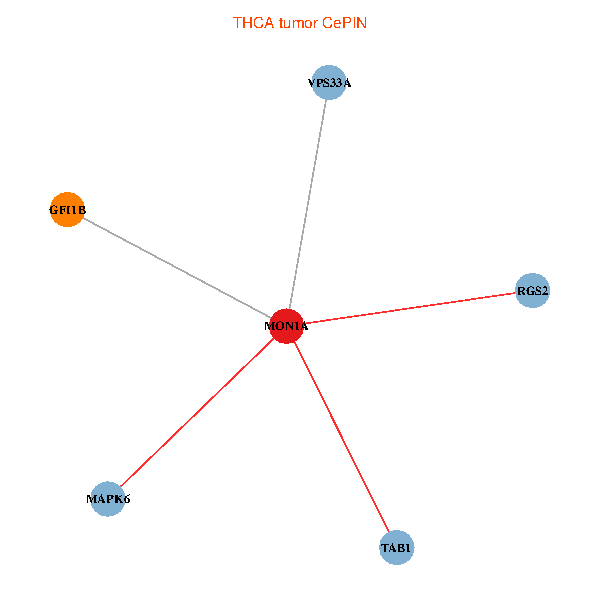
| Co-expressed gene networks based on protein-protein interaction data (CePIN) (TCGA IlluminaHiSeq_RNASeqV2, pan-cancer normalized log2(norm_counts+1) data, version 2016-08-16) (PINA2 ppi data) |
| BRCA (tumor) | BRCA (normal) |
| MON1A, VPS33A, RGS2, TAB1, MAPK6, GFI1B (tumor) | MON1A, VPS33A, RGS2, TAB1, MAPK6, GFI1B (normal) |
 |  |
| COAD (tumor) | COAD (normal) |
| MON1A, VPS33A, RGS2, TAB1, MAPK6, GFI1B (tumor) | MON1A, VPS33A, RGS2, TAB1, MAPK6, GFI1B (normal) |
 |  |
| HNSC (tumor) | HNSC (normal) |
| MON1A, VPS33A, RGS2, TAB1, MAPK6, GFI1B (tumor) | MON1A, VPS33A, RGS2, TAB1, MAPK6, GFI1B (normal) |
 |  |
| KICH (tumor) | KICH (normal) |
| MON1A, VPS33A, RGS2, TAB1, MAPK6, GFI1B (tumor) | MON1A, VPS33A, RGS2, TAB1, MAPK6, GFI1B (normal) |
 |  |
| KIRC (tumor) | KIRC (normal) |
| MON1A, VPS33A, RGS2, TAB1, MAPK6, GFI1B (tumor) | MON1A, VPS33A, RGS2, TAB1, MAPK6, GFI1B (normal) |
 |  |
| KIRP (tumor) | KIRP (normal) |
| MON1A, VPS33A, RGS2, TAB1, MAPK6, GFI1B (tumor) | MON1A, VPS33A, RGS2, TAB1, MAPK6, GFI1B (normal) |
 |  |
| LIHC (tumor) | LIHC (normal) |
| MON1A, VPS33A, RGS2, TAB1, MAPK6, GFI1B (tumor) | MON1A, VPS33A, RGS2, TAB1, MAPK6, GFI1B (normal) |
 |  |
| LUAD (tumor) | LUAD (normal) |
| MON1A, VPS33A, RGS2, TAB1, MAPK6, GFI1B (tumor) | MON1A, VPS33A, RGS2, TAB1, MAPK6, GFI1B (normal) |
 |  |
| LUSC (tumor) | LUSC (normal) |
| MON1A, VPS33A, RGS2, TAB1, MAPK6, GFI1B (tumor) | MON1A, VPS33A, RGS2, TAB1, MAPK6, GFI1B (normal) |
 |  |
| PRAD (tumor) | PRAD (normal) |
| MON1A, VPS33A, RGS2, TAB1, MAPK6, GFI1B (tumor) | MON1A, VPS33A, RGS2, TAB1, MAPK6, GFI1B (normal) |
 |  |
| STAD (tumor) | STAD (normal) |
| MON1A, VPS33A, RGS2, TAB1, MAPK6, GFI1B (tumor) | MON1A, VPS33A, RGS2, TAB1, MAPK6, GFI1B (normal) |
 |  |
| THCA (tumor) | THCA (normal) |
| MON1A, VPS33A, RGS2, TAB1, MAPK6, GFI1B (tumor) | MON1A, VPS33A, RGS2, TAB1, MAPK6, GFI1B (normal) |
 |  |
| Top |
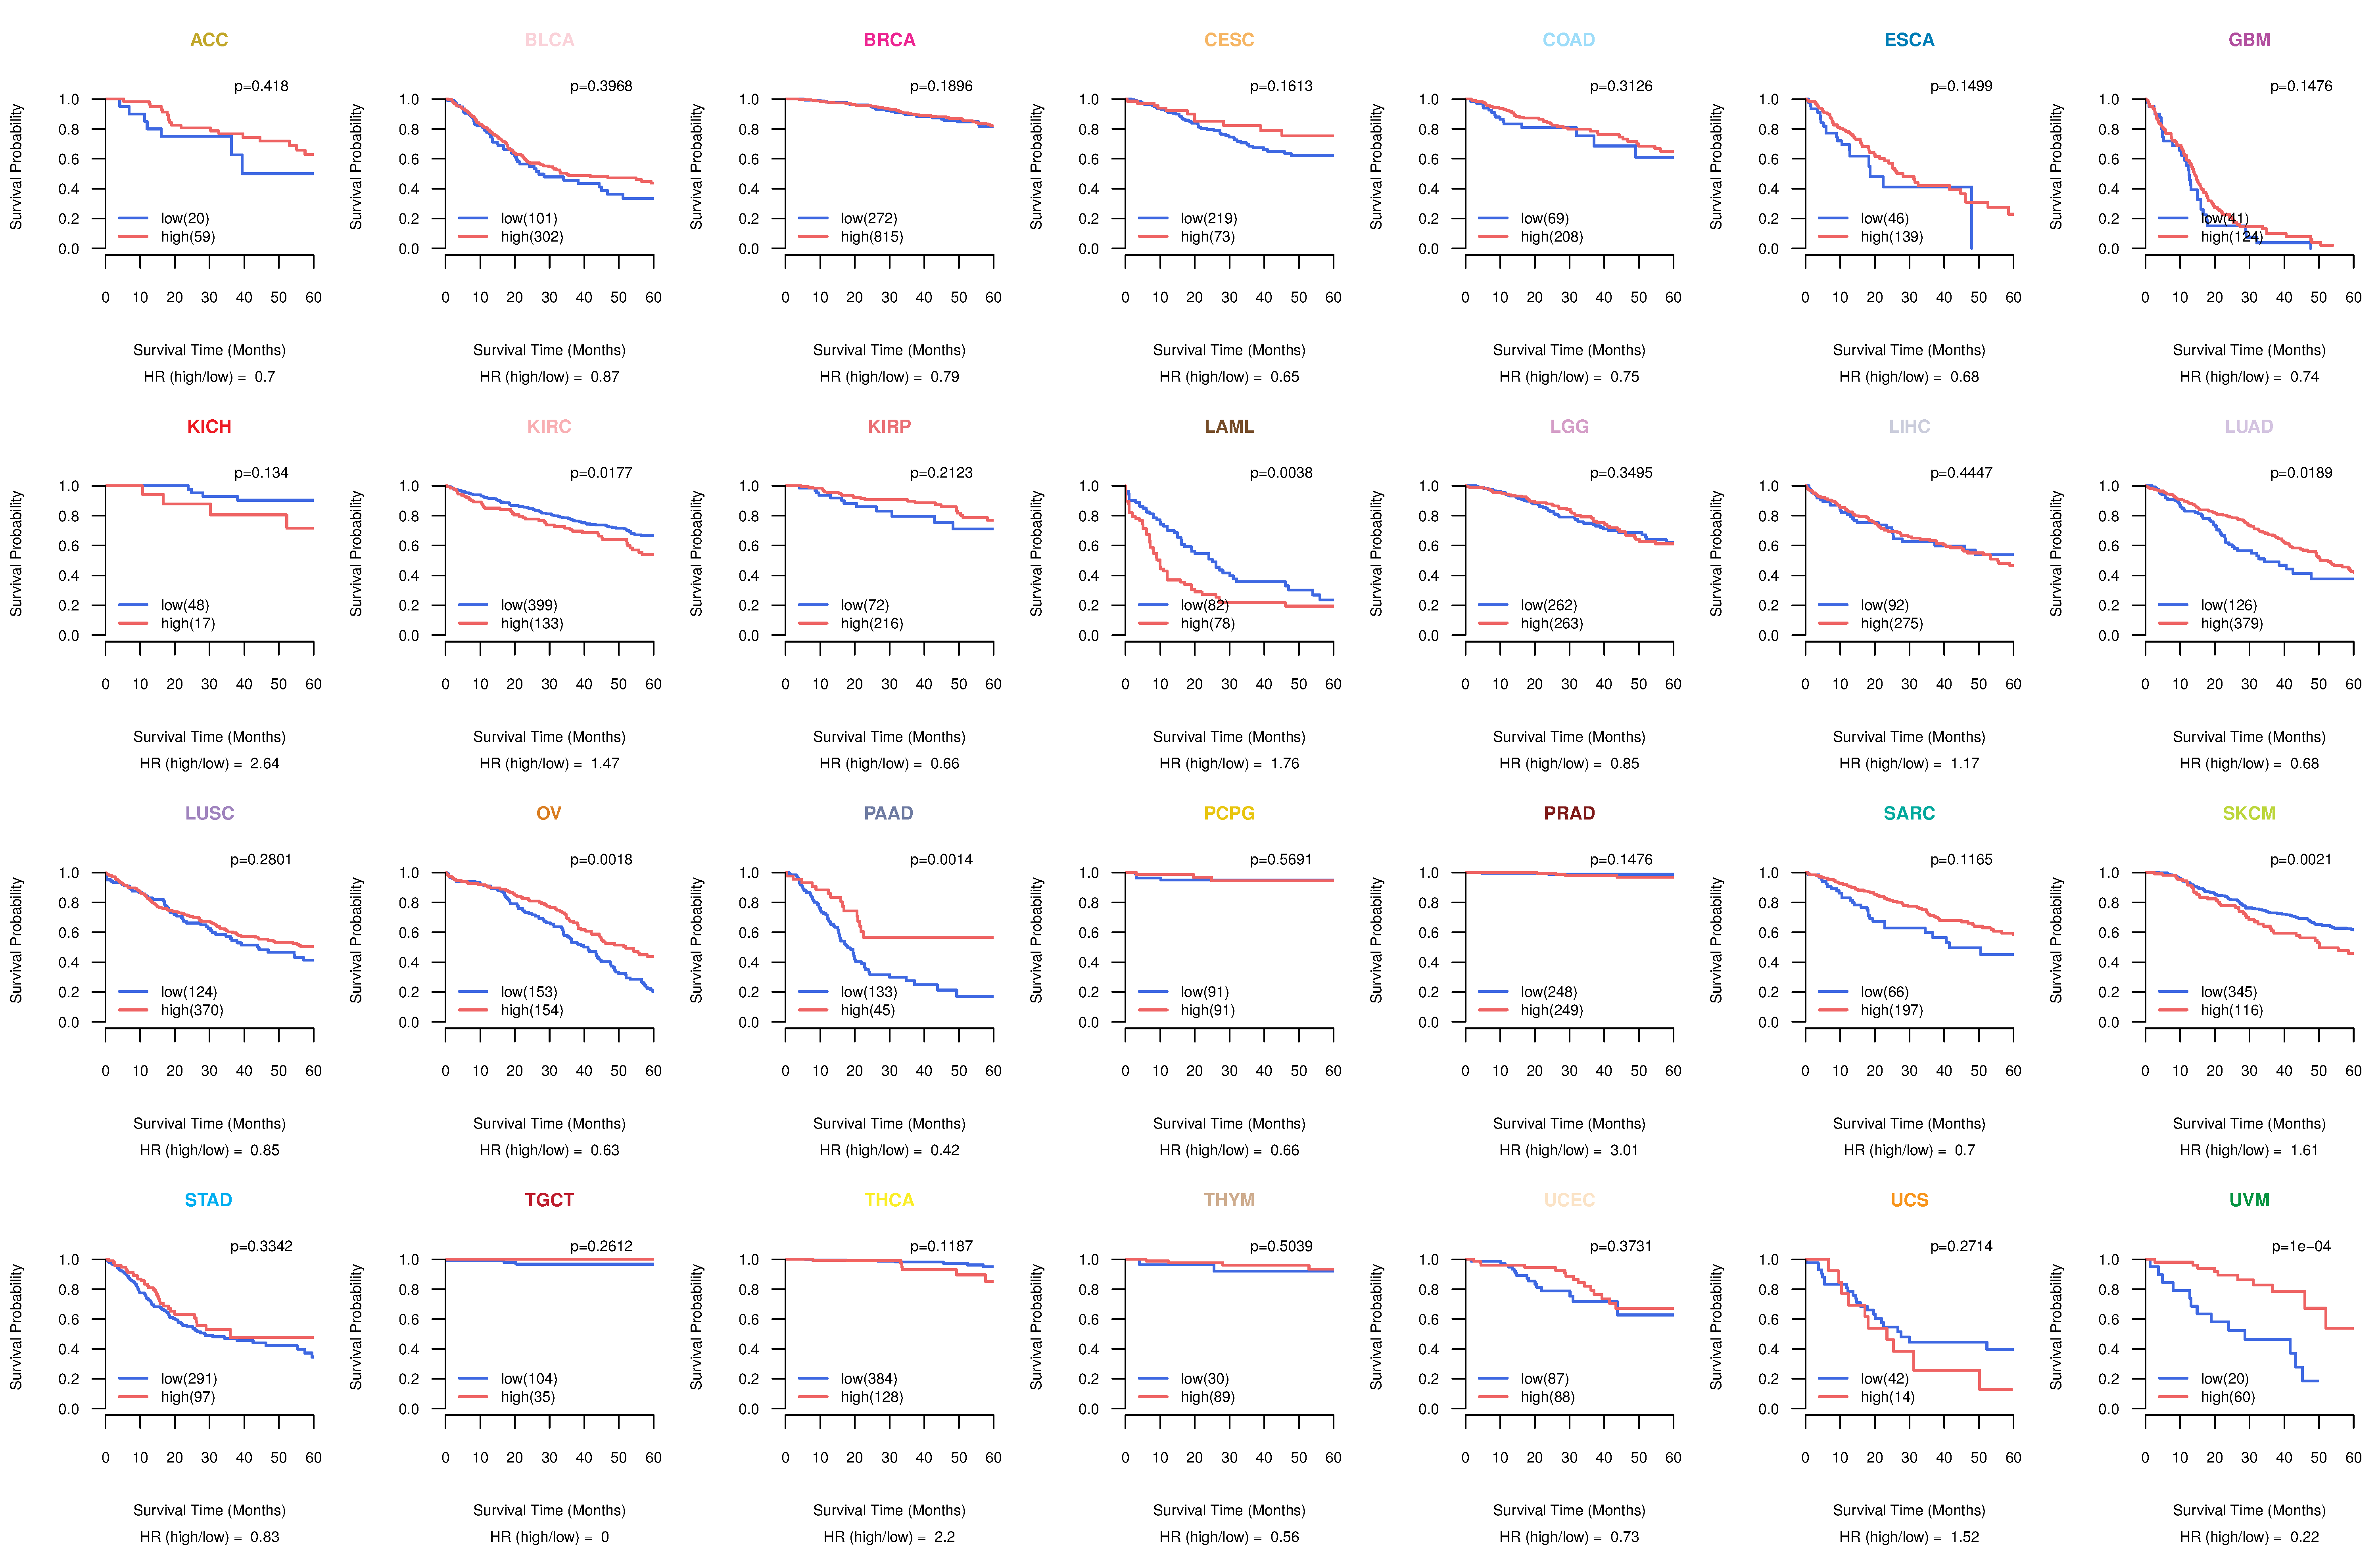
| TissGeneProg for MON1A |
| Kaplan-Meier plots with logrank tests of overall survival (OS) using 28 cancer types (TCGA IlluminaHiSeq_RNASeqV2, pan-cancer normalized log2(norm_counts+1) data, version 2016-08-16) (TCGA clinicalMatrix, phenotype data, version 2016-04-27) * Click on the image to enlarge it in a new window. |
 |
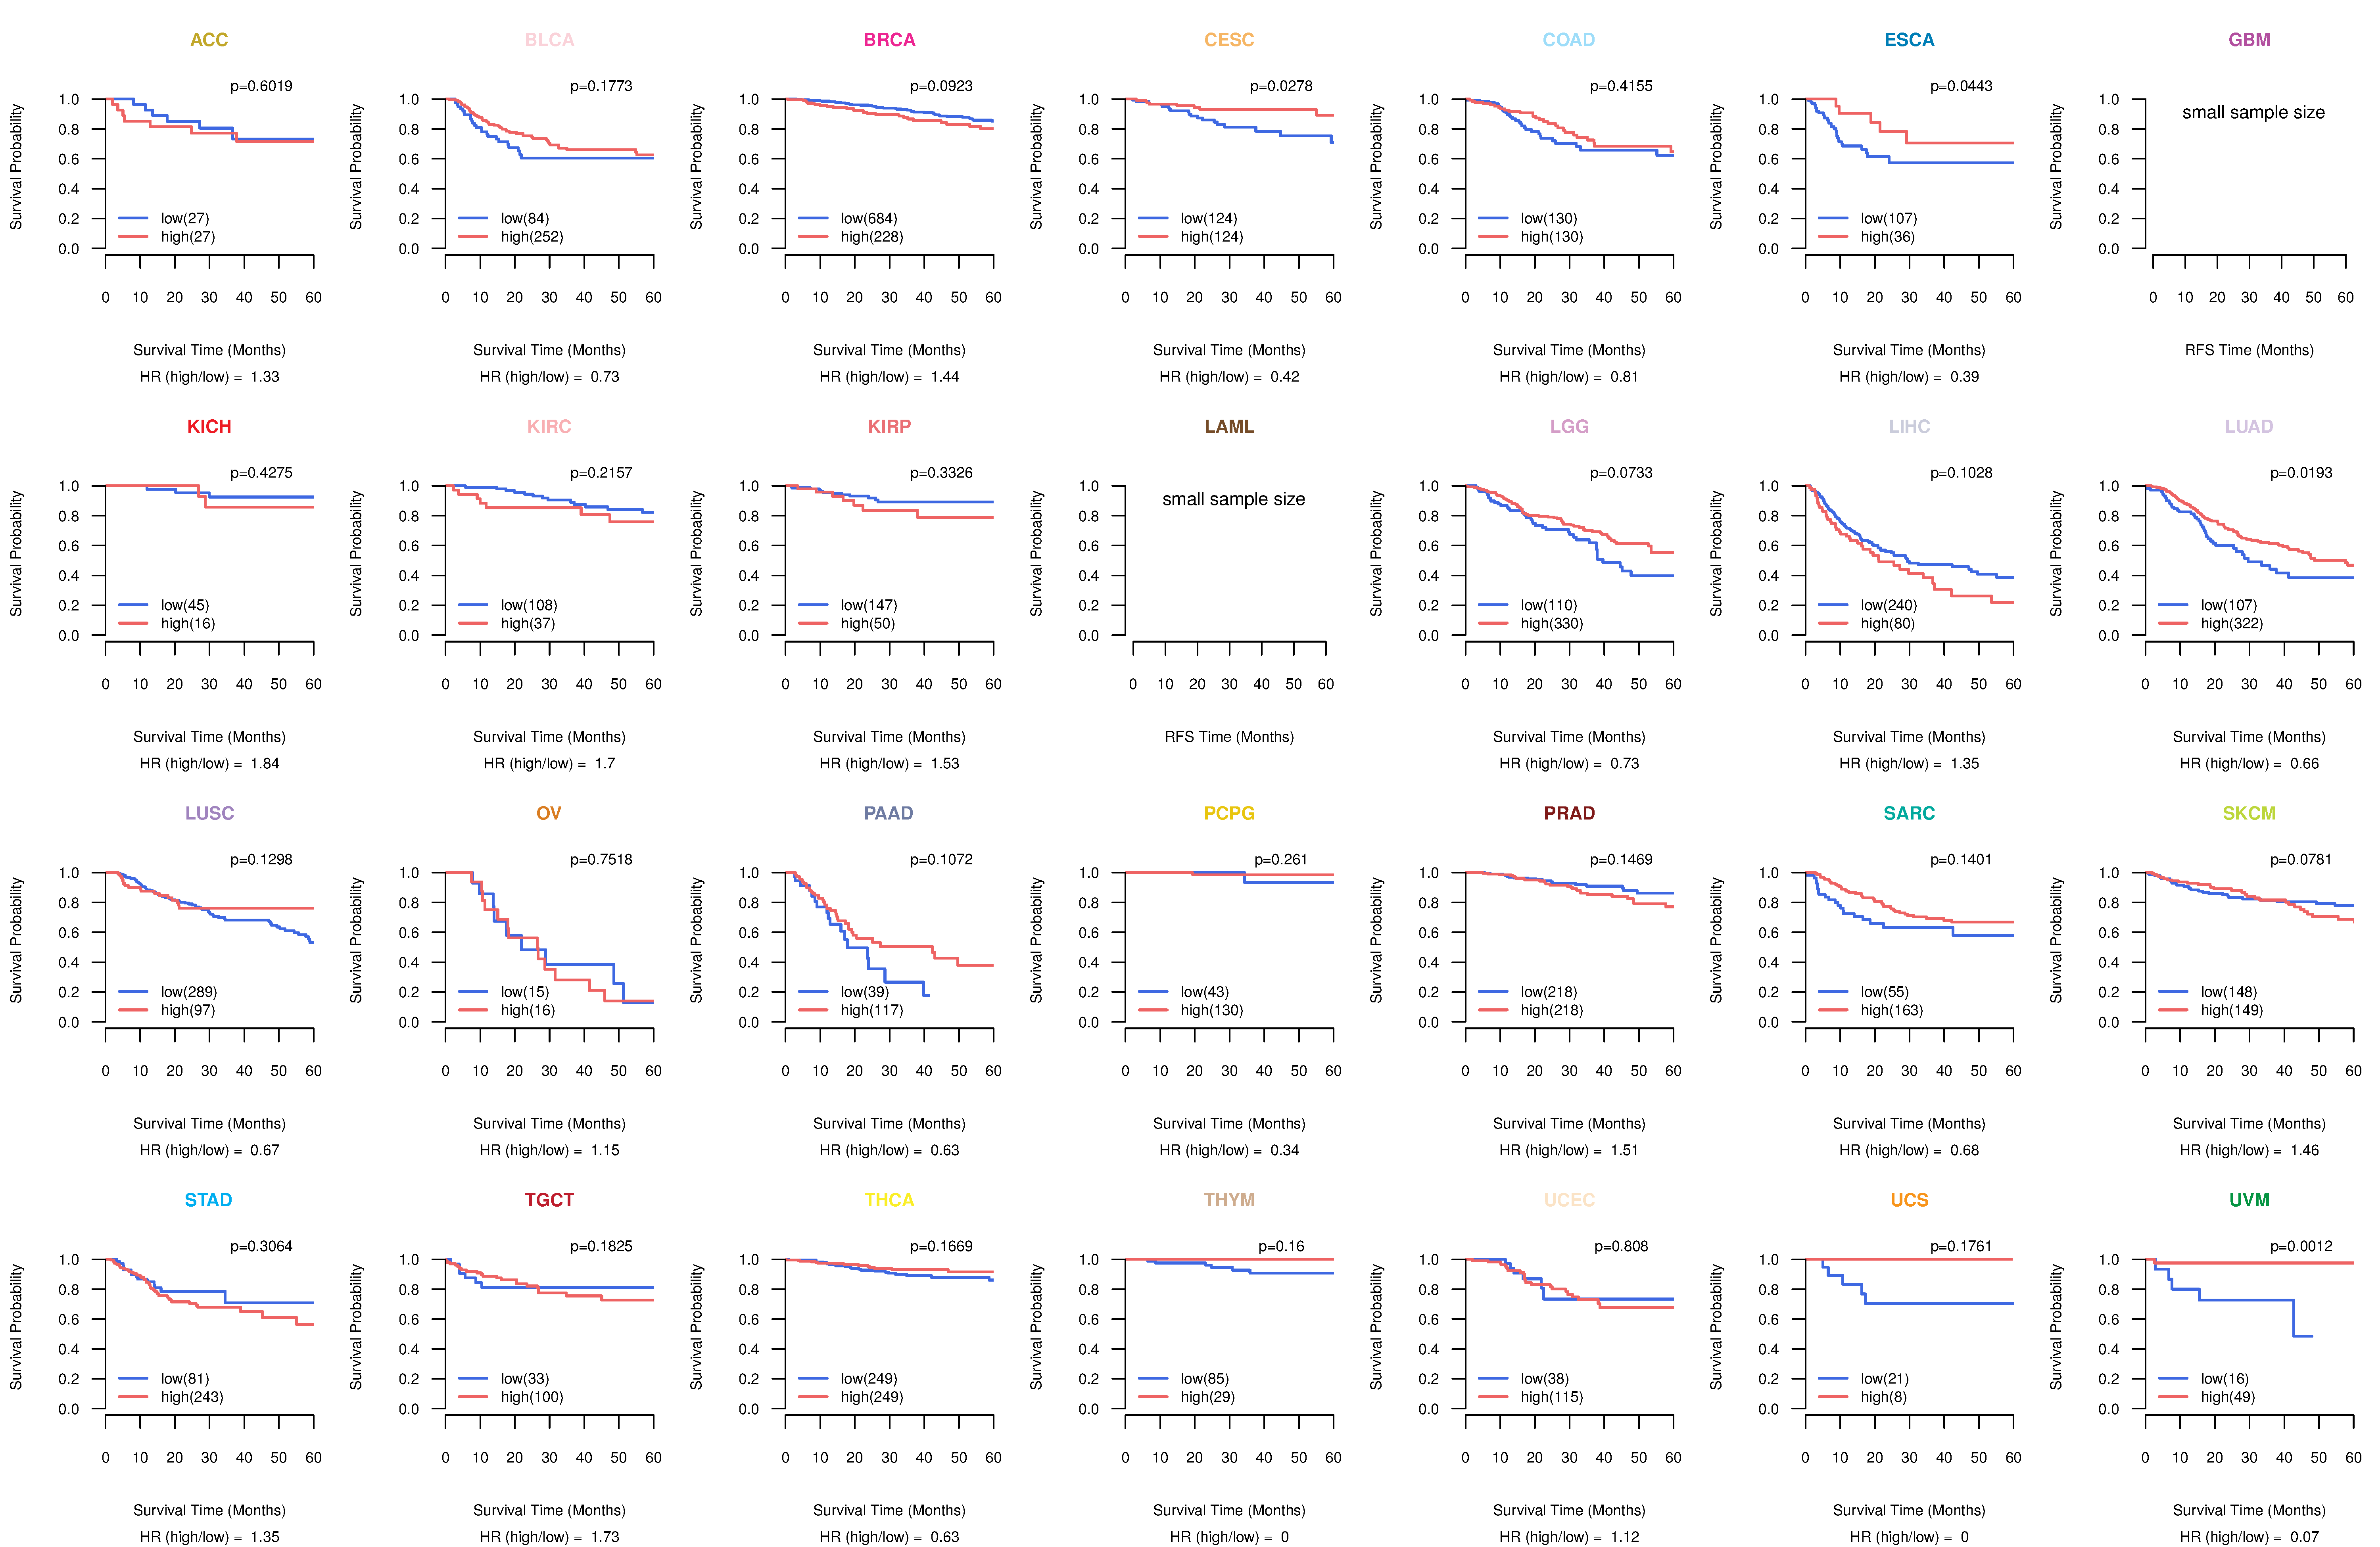
| Kaplan-Meier plots with logrank test of relapse free survival (RFS) using 28 cancer types (TCGA IlluminaHiSeq_RNASeqV2, pan-cancer normalized log2(norm_counts+1) data, version 2016-08-16) (TCGA clinicalMatrix, phenotype data, version 2016-04-27) * Click on the image enlarge it in a new window. |
 |
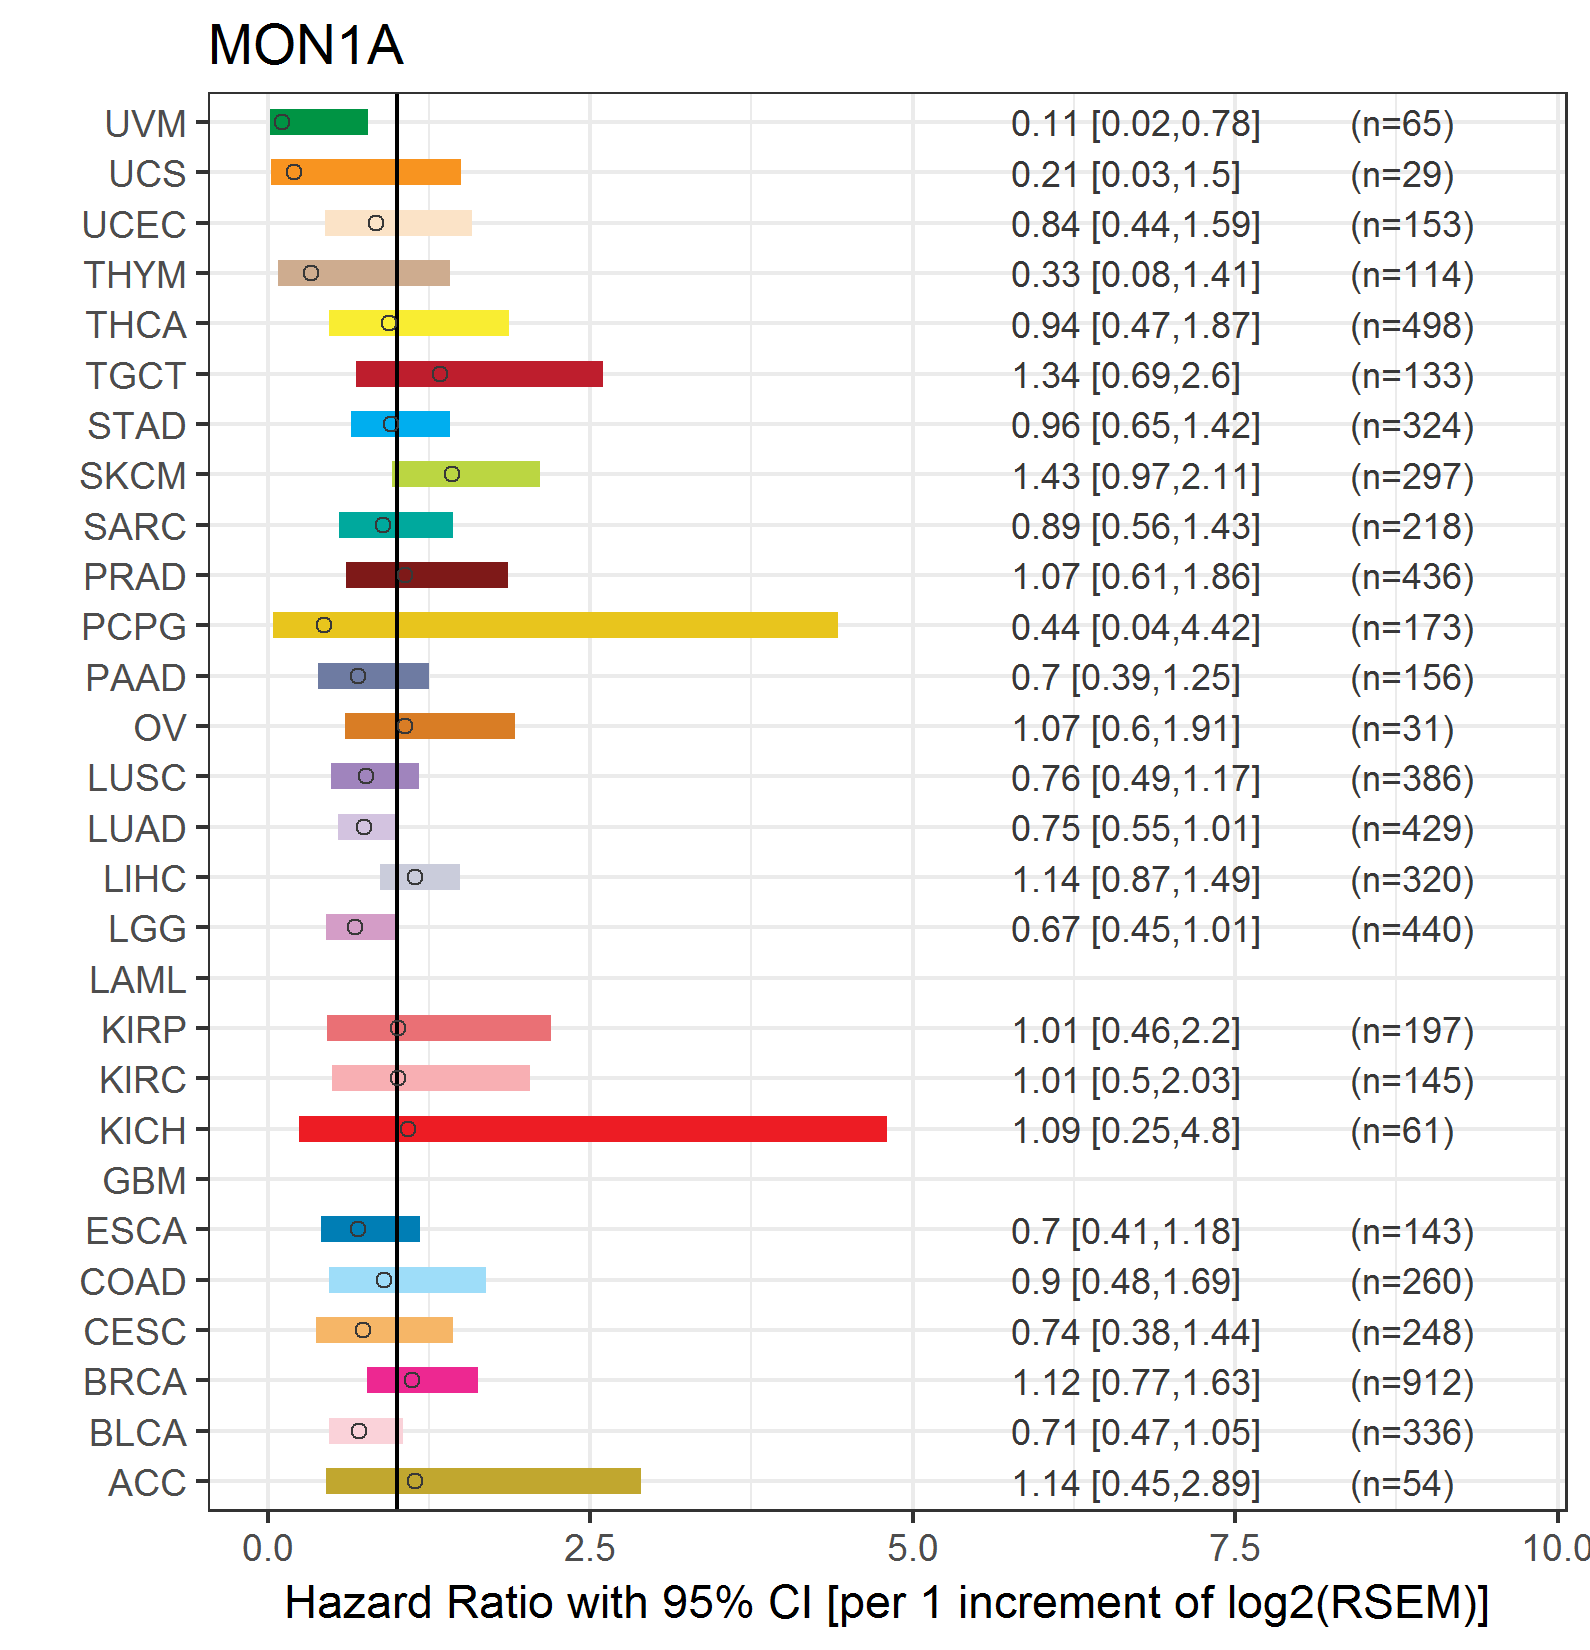
| Forest plot of Cox proportional hazard ratio (HR) and 95% CI of overall survival (OS) using 28 cancer types (TCGA IlluminaHiSeq_RNASeqV2, pan-cancer normalized log2(norm_counts+1) data, version 2016-08-16) (TCGA clinicalMatrix, phenotype data, version 2016-04-27) * Click on the image enlarge it in a new window. |
 |
| Forest plot of Cox proportional hazard ratio (HR) and 95% CI of relapse free survival (RFS) using 28 cancer types (TCGA IlluminaHiSeq_RNASeqV2, pan-cancer normalized log2(norm_counts+1) data, version 2016-08-16) (TCGA clinicalMatrix, phenotype data, version 2016-04-27) * Click on the image enlarge it in a new window. |
 |
| Top |
| TissGeneClin for MON1A |
| TissGeneDrug for MON1A |
| Drug information targeting TissGene (DrugBank Version 5.0.6, 2017-04-01) |
| DrugBank ID | Drug name | Drug activity | Drug type | Drug status |
| Top |
| TissGeneDisease for MON1A |
| Disease information associated with TissGene (DisGeNet, 2016-06-01) |
| Disease ID | Disease name | # pubmeds | Source |
| umls:C0012715 | Iron Metabolism Disorders | 1 | CTD_human |
|
Copyright 2016-Present - The University of Texas Health Science Center at Houston (UTHealth) Web File Viewing | How to Report, Fraud, Waste and Abuse | State of Texas | Statewide Search | Texas Homeland Security | Site Policies |