 |
| |
| |
| |
| |
| |
| |
|

| TissGeneSummary for DYRK3 |
 Gene summary Gene summary |
| Basic gene information | Gene symbol | DYRK3 |
| Gene name | dual-specificity tyrosine-(Y)-phosphorylation regulated kinase 3 | |
| Synonyms | DYRK5|RED|REDK|hYAK3-2 | |
| Cytomap | UCSC genome browser: 1q32.1 | |
| Type of gene | protein-coding | |
| RefGenes | NM_001004023.1, NM_003582.2, | |
| Description | dual specificity tyrosine-phosphorylation-regulated kinase 3dual-specificity tyrosine-(Y)-phosphorylation regulated kinase 5protein kinase Dyrk3regulatory erythroid kinase | |
| Modification date | 20141207 | |
| dbXrefs | MIM : 603497 | |
| HGNC : HGNC | ||
| Ensembl : ENSG00000143479 | ||
| HPRD : 04607 | ||
| Vega : OTTHUMG00000036339 | ||
| Protein | UniProt: go to UniProt's Cross Reference DB Table | |
| Expression | CleanEX: HS_DYRK3 | |
| BioGPS: 8444 | ||
| Pathway | NCI Pathway Interaction Database: DYRK3 | |
| KEGG: DYRK3 | ||
| REACTOME: DYRK3 | ||
| Pathway Commons: DYRK3 | ||
| Context | iHOP: DYRK3 | |
| ligand binding site mutation search in PubMed: DYRK3 | ||
| UCL Cancer Institute: DYRK3 | ||
| Assigned class in TissGDB* | C | |
| Included tissue-specific gene expression resources | TiGER,GTEx | |
| Specific-tissues in normal samples (assigned by TissGDB using HPA, TiGER, and GTEx) | Testis | |
| Cancer types related to the specific-tissues in cancer samples (assigned by TissGDB using TCGA) | TGCT | |
| Reference showing the relevant tissue of DYRK3 | ||
| Description by TissGene annotations | Cancer gene TissgsLTS | |
| * Class A consists of genes with literature evidence and is part of the cTissGenes. Class B consists of only cTissGenes without additional evidence. The remaining genes belong to Class C. |
| Gene ontology having evidence of Inferred from Direct Assay (IDA) from Entrez |
| GO ID | GO term | PubMed ID | GO:0006468 | protein phosphorylation | 10779429 | GO:0030218 | erythrocyte differentiation | 10779429 | GO:0006468 | protein phosphorylation | 10779429 | GO:0030218 | erythrocyte differentiation | 10779429 |
| Top |
| TissGeneExp for DYRK3 |
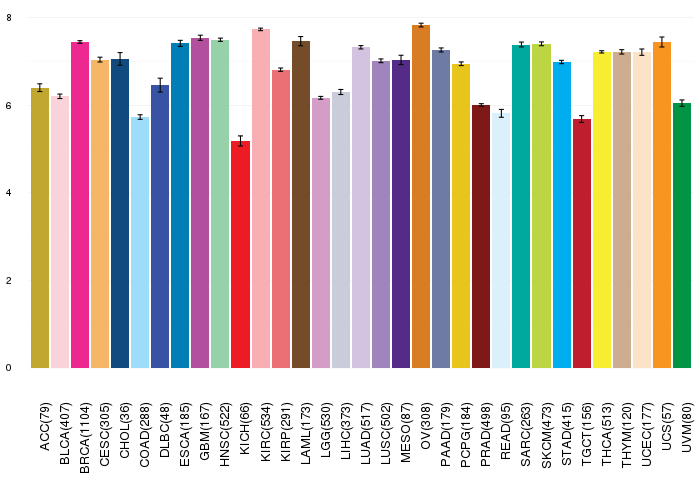
| Gene expressions across 28 cancer types (X-axis: cancer type and Y-axis: log2(norm_counts+1)) (TCGA IlluminaHiSeq_RNASeqV2, pan-cancer normalized log2(norm_counts+1) data, version 2016-08-16) |
 |
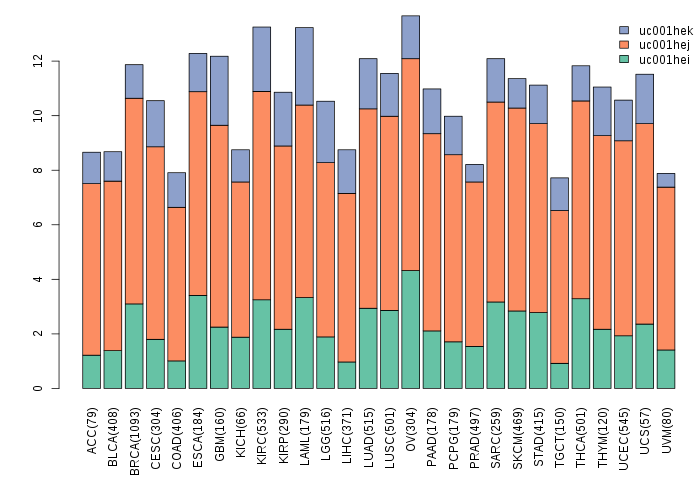
| Gene isoform expressions across 28 cancer types (X-axis: cancer type and Y-axis: log2(norm_counts+1)) (TCGA pan-cancer tcga_rsem_isoform_tpm, version 2016-09-01) |
 |
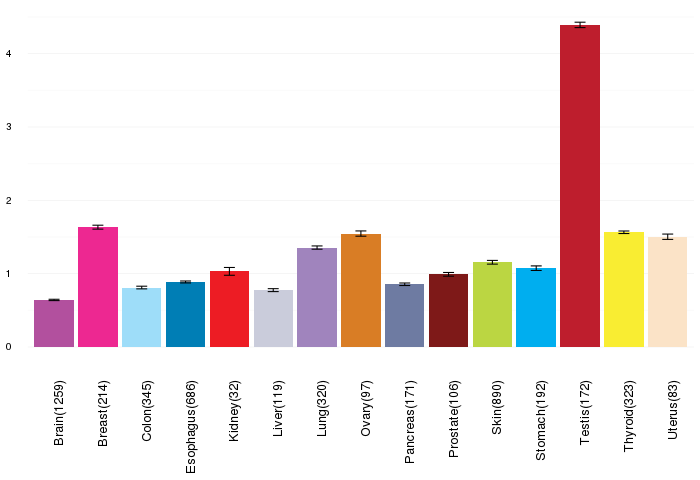
| Gene expressions across normal tissues of GTEx data (GTEx GTEx_Analysis_v6_RNA-seq_RNA-SeQCv1.1.8_gene_rpkm.gct) - Here, we shows the matched tissue types only among our 28 cancer types. |
 |
| Different expressions across 14 cancer types with more than 10 samples between matched tumors and normals (X-axis: cancer type and Y-axis: log2(norm_counts+1)) (TCGA IlluminaHiSeq_RNASeqV2, pan-cancer normalized log2(norm_counts+1) data, version 2016-08-16) |
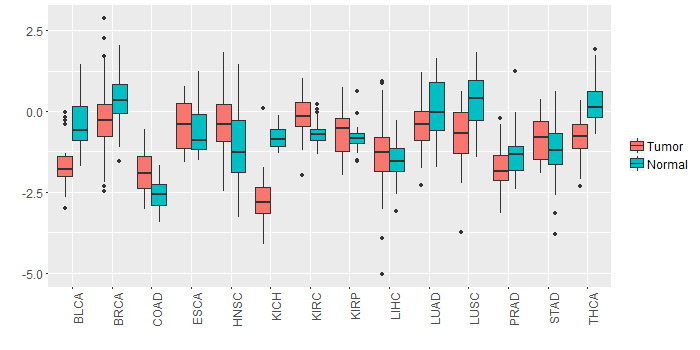 |
| - Significantly differentially expressed cancer types and information. (|Fold change|>1 and FDR<0.05) |
| Cancer type | Mean(exp) in tumor | Mean(exp) in matched normal | Log2FC | P-val. | FDR |
| KICH | -2.706094535 | -0.807962535 | -1.898132 | 5.95E-12 | 5.96E-11 |
| LUSC | -0.725805436 | 0.303012211 | -1.028817647 | 8.04E-08 | 2.29E-07 |
| THCA | -0.789859009 | 0.274952855 | -1.064811864 | 9.00E-16 | 1.36E-14 |
| BLCA | -1.558313692 | -0.391555798 | -1.166757895 | 0.000133 | 0.001379704 |
| Top |
| TissGene-miRNA for DYRK3 |
| Significantly anti-correlated miRNAs of TissGene across 28 cancer types (Gene-miRNA relations from TargetScanHuman Relsease 7.1, Conserved_Site_Context_Scores.txt.zip, 06.01.2016) (TCGA IlluminaHiSeq_miRNASeq, log2(RPM+1) data, version 2016-11-21) (TCGA IlluminaHiSeq_RNASeqV2, log2(normalized_count+1) data, version 2016-08-16) (Spearman’s Rank Correlation (p-value<0.05 and coefficient<-0.25)) |
| Cancer type | miRNA id | miRNA accession | P-val. | Coeff. | # samples |
| UCS | hsa-miR-27a-3p | MIMAT0000084 | 0.035 | -0.29 | 56 |
| UCS | hsa-miR-27b-3p | MIMAT0000419 | 0.035 | -0.29 | 56 |
| Top |
| TissGeneMut for DYRK3 |
| TissGeneSNV for DYRK3 |
| nsSNV counts per each loci. Different colors of circles represent different cancer types. Circle size denotes number of samples. (TCGA somatic mutation (SNPs and small INDELs) data, version 2016-04-25) * Click on the image to enlarge it in a new window. |
 |
 |
| Somatic nucleotide variants of TissGene across 28 cancer types (X-axis: cancer type and Y-axis: % of mutated samples) The numbers in parentheses are numbers of samples with mutation (nsSNVs). (TCGA somatic mutation (SNPs and small INDELs) data, version 2016-04-25) |
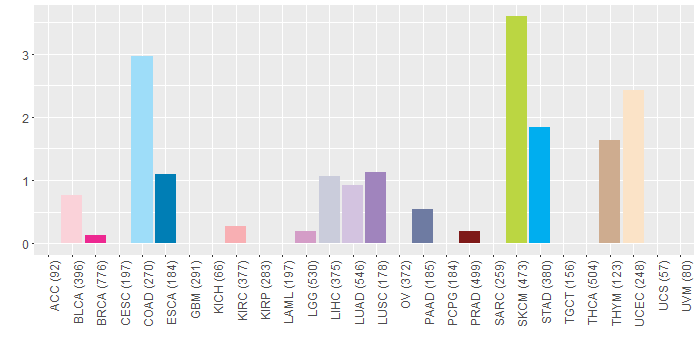 |
| - nsSNVs sorted by frequency. |
| AAchange | Cancer type | # samples |
| p.A135S | LIHC | 2 |
| p.P38L | SKCM | 1 |
| p.Y197C | COAD | 1 |
| p.E379Q | BLCA | 1 |
| p.V558I | COAD | 1 |
| p.E359Q | BLCA | 1 |
| p.N270S | UCEC | 1 |
| p.G198R | SKCM | 1 |
| p.Q386H | PRAD | 1 |
| p.A175V | SKCM | 1 |
| p.P513Q | THYM | 1 |
| p.L402R | COAD | 1 |
| p.P58S | SKCM | 1 |
| p.E147* | STAD | 1 |
| p.R241H | COAD | 1 |
| p.S298F | SKCM | 1 |
| p.S277C | SKCM | 1 |
| p.F341V | HNSC | 1 |
| p.R448C | SKCM | 1 |
| p.E339* | UCEC | 1 |
| p.D335N | PAAD | 1 |
| p.R293H | LUAD | 1 |
| p.E339Q | BLCA | 1 |
| p.R202Q | UCEC | 1 |
| p.D274N | BLCA | 1 |
| p.S425F | SKCM | 1 |
| p.R188* | SKCM | 1 |
| p.P173S | LUAD | 1 |
| p.S113F | SKCM | 1 |
| p.N110S | LUAD | 1 |
| p.L323S | UCEC | 1 |
| p.R520W | HNSC | 1 |
| p.E238K | SKCM | 1 |
| p.S318F | SKCM | 1 |
| p.Y234C | COAD | 1 |
| p.S257C | SKCM | 1 |
| p.M254T | LUAD | 1 |
| p.P146L | SKCM | 1 |
| p.P166L | SKCM | 1 |
| p.E258K | SKCM | 1 |
| p.K535N | COAD | 1 |
| p.Q70* | SKCM | 1 |
| p.K84N | THYM | 1 |
| p.A115S | LIHC | 1 |
| p.Q90X | SKCM | 1 |
| p.R248H | COAD | 1 |
| p.A196V | STAD | 1 |
| p.R245C | UCEC | 1 |
| p.S372C | LUAD | 1 |
| p.E319Q | BLCA | 1 |
| p.E167X | STAD | 1 |
| p.R348C | UCEC | 1 |
| p.K96Q | UCEC | 1 |
| p.L322I | SKCM | 1 |
| p.R225H | PRAD | 1 |
| p.A547G | HNSC | 1 |
| p.D183N | SKCM | 1 |
| p.D315N | PAAD | 1 |
| p.G218R | SKCM | 1 |
| p.D335N | COAD | 1 |
| p.V235M | COAD | 1 |
| p.A567G | HNSC | 1 |
| p.G560V | KIRC | 1 |
| p.D355Y | LUSC | 1 |
| p.S352C | LUAD | 1 |
| p.F361V | HNSC | 1 |
| p.R232* | STAD | 1 |
| p.L531* | LIHC | 1 |
| p.S106I | BRCA | 1 |
| p.D335N | UCEC | 1 |
| p.R450H | UCEC | 1 |
| p.A155V | SKCM | 1 |
| p.P153S | LUAD | 1 |
| p.P458T | SKCM | 1 |
| p.N187T | STAD | 1 |
| p.A175D | ESCA | 1 |
| p.R202Q | STAD | 1 |
| p.F361L | ESCA | 1 |
| p.P536L | LGG | 1 |
| p.F395S | SKCM | 1 |
| p.S488C | BLCA | 1 |
| p.P38S | SKCM | 1 |
| p.R182Q | STAD | 1 |
| p.F375S | SKCM | 1 |
| p.R348H | LUSC | 1 |
| p.L295I | STAD | 1 |
| p.R178I | STAD | 1 |
| p.I577M | STAD | 1 |
| p.N130S | LUAD | 1 |
| p.K303M | LIHC | 1 |
| p.F92S | COAD | 1 |
| Top |
| TissGeneCNV for DYRK3 |
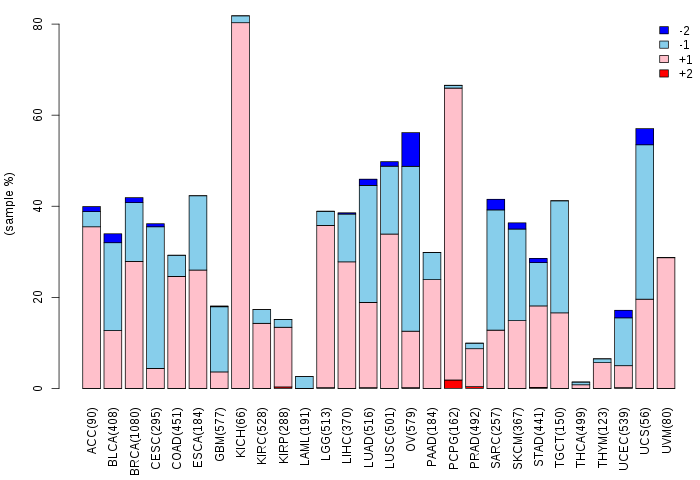
| Copy number variations of TissGene across 28 cancer types (X-axis: cancer type and Y-axis: % of CNV samples) (TCGA Gistic2_CopyNumber_Gistic2_all_data_by_genes, Gistic2 copy number data, version 2016-08-16) |
 |
| Top |
| TissGeneFusions for DYRK3 |
| Fusion genes including TissGene (ChimerDB 3.0, 2016-12-01 and TCGA fusion Portal 2015-12-01) |
| Database | Src | Cancer type | Sample | Fusion gene | ORF | 5'-gene BP | 3'-gene BP |
| Chimerdb3.0 | ChiTaRs | NA | CV414816 | DYRK3-DYRK3 | chr1:206826389 | chr1:206823873 |
| Top |
| TissGeneNet for DYRK3 |
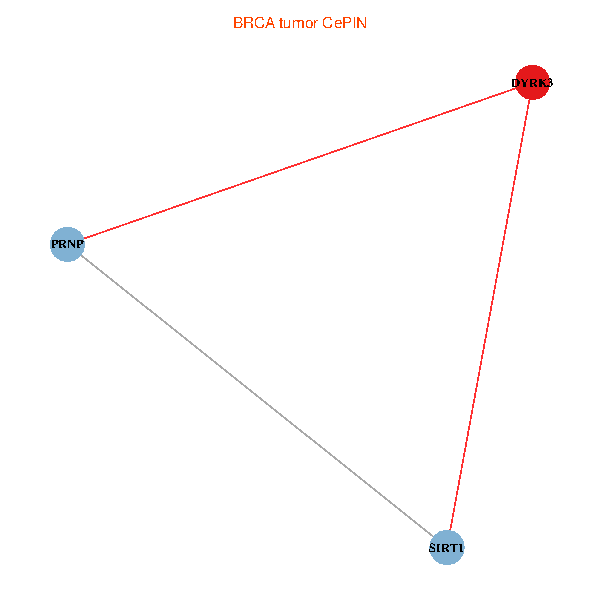
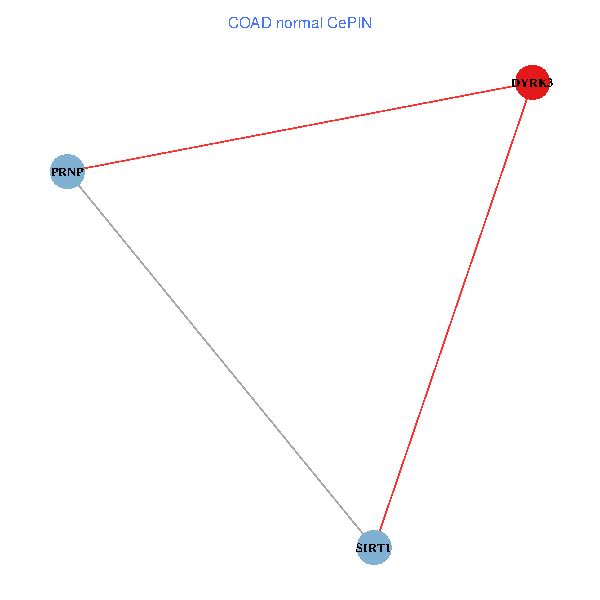
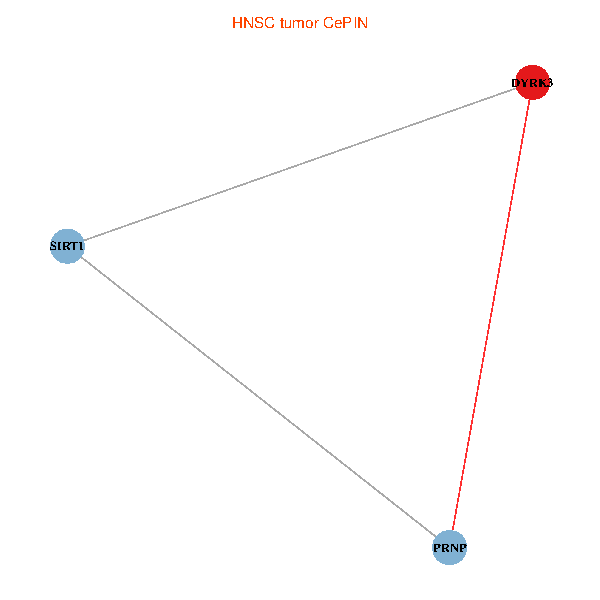
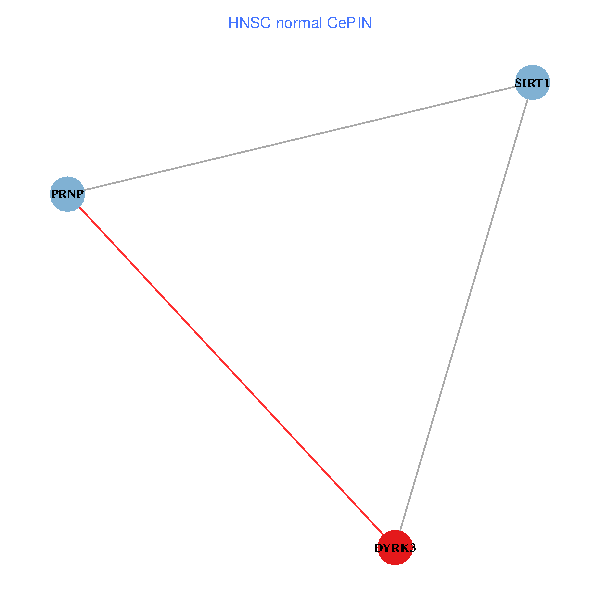
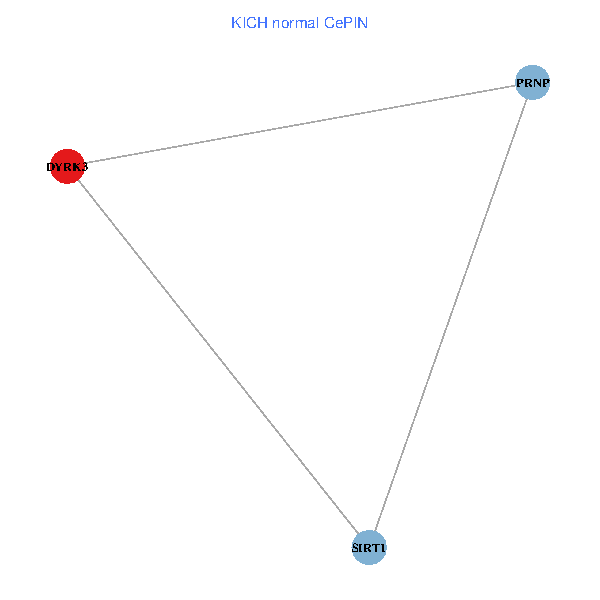
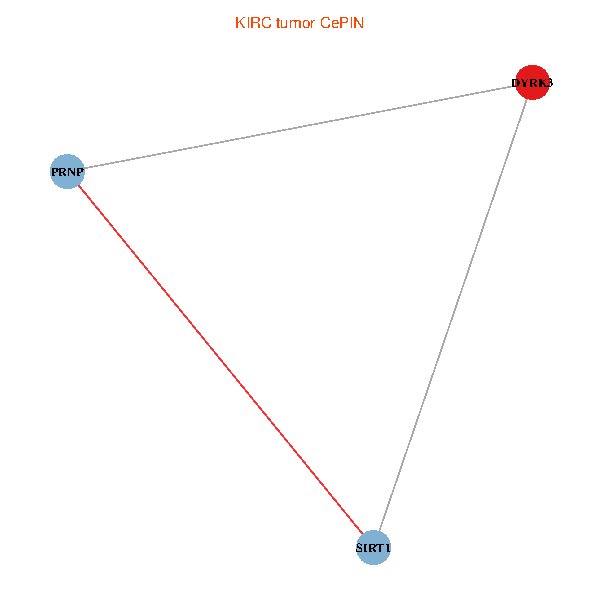
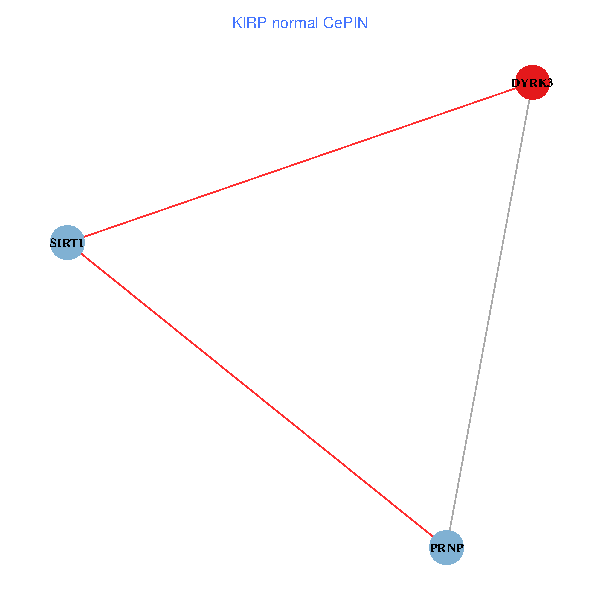
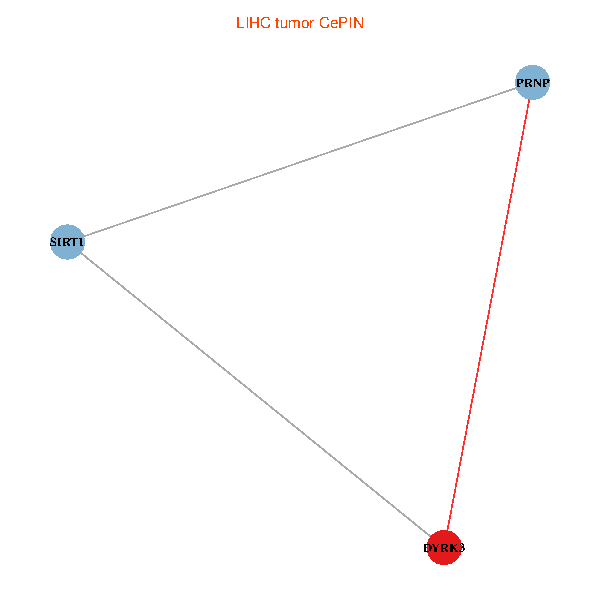
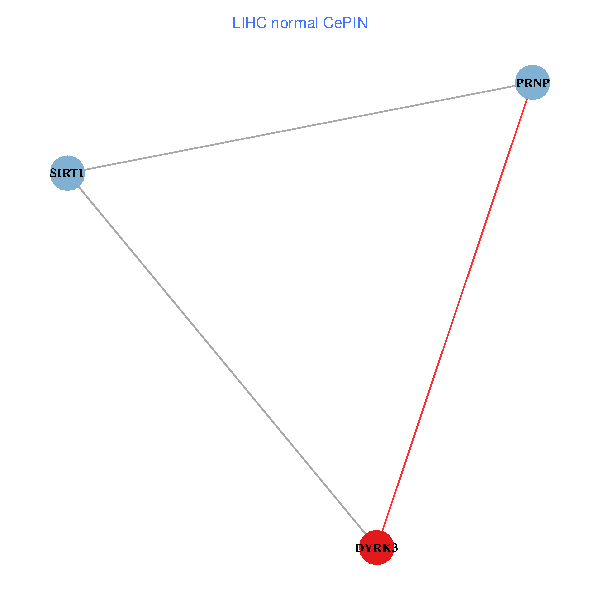
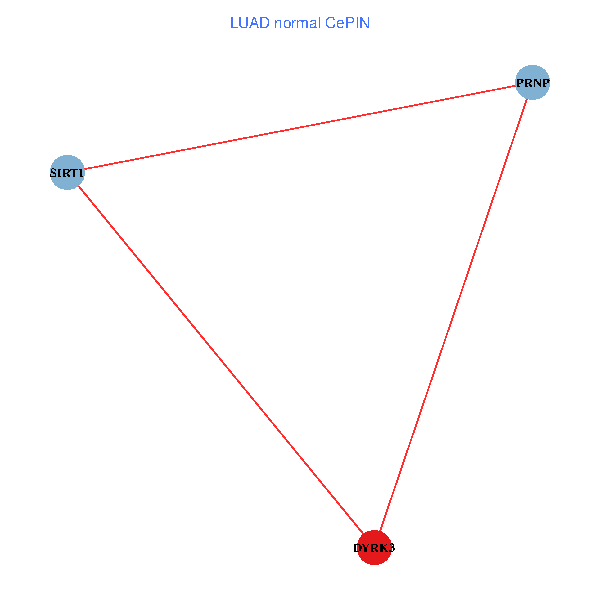
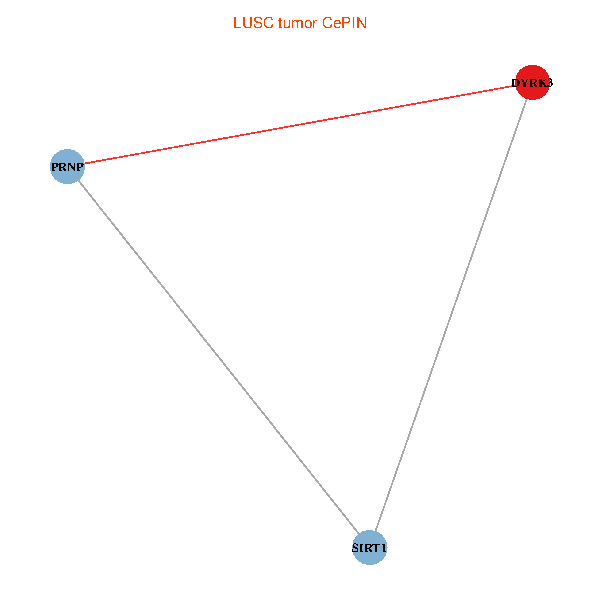
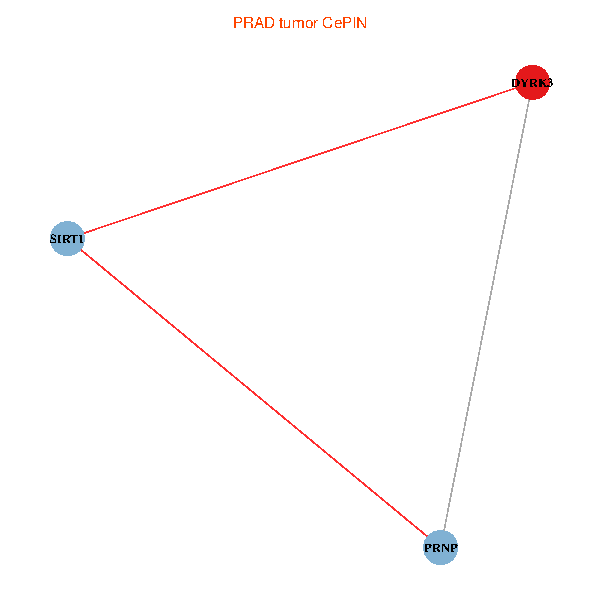
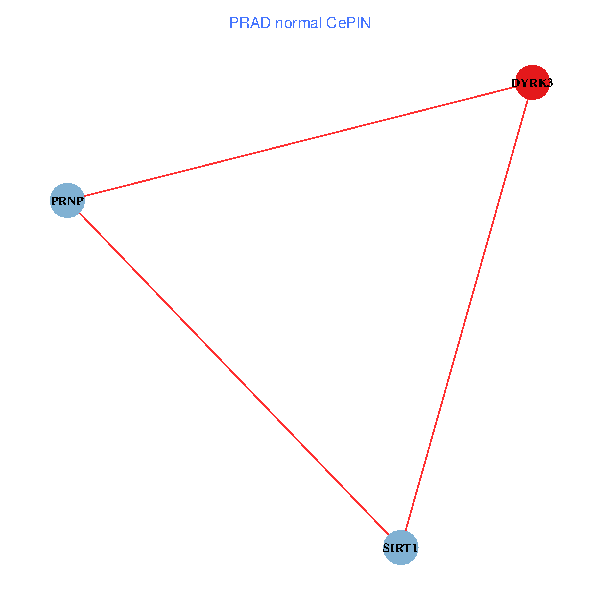
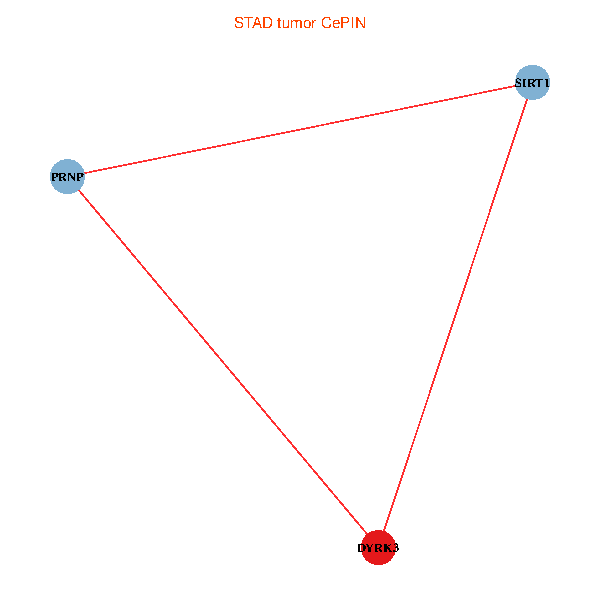
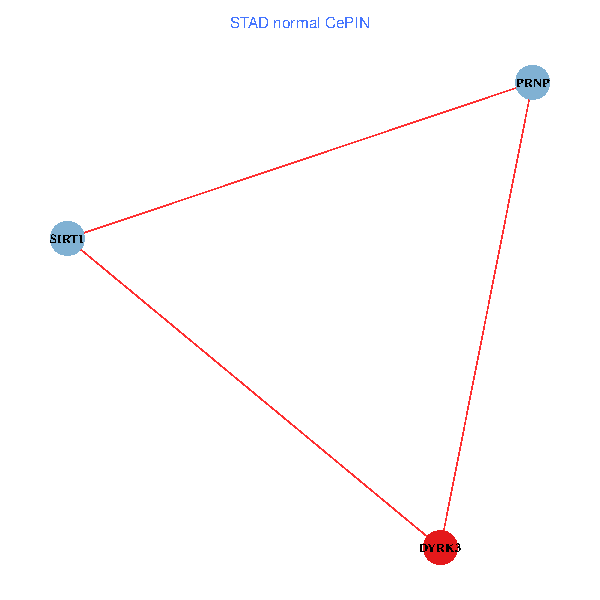
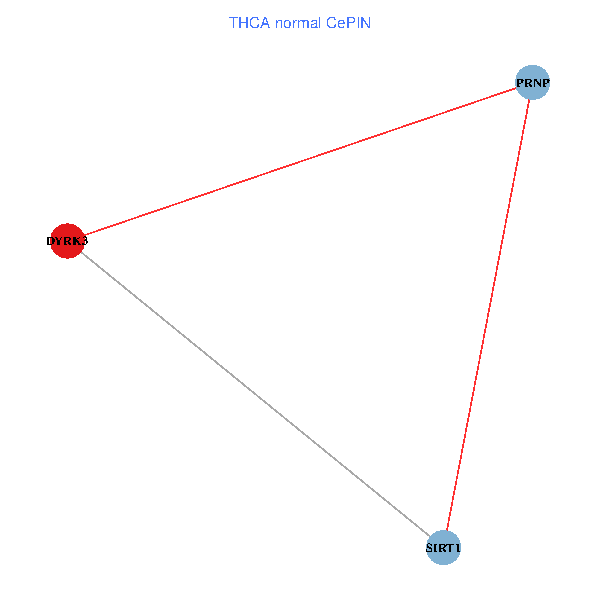
| Co-expressed gene networks based on protein-protein interaction data (CePIN) (TCGA IlluminaHiSeq_RNASeqV2, pan-cancer normalized log2(norm_counts+1) data, version 2016-08-16) (PINA2 ppi data) |
| BRCA (tumor) | BRCA (normal) |
| DYRK3, SIRT1, PRNP (tumor) | DYRK3, SIRT1, PRNP (normal) |
 |  |
| COAD (tumor) | COAD (normal) |
| DYRK3, SIRT1, PRNP (tumor) | DYRK3, SIRT1, PRNP (normal) |
 |  |
| HNSC (tumor) | HNSC (normal) |
| DYRK3, SIRT1, PRNP (tumor) | DYRK3, SIRT1, PRNP (normal) |
 |  |
| KICH (tumor) | KICH (normal) |
| DYRK3, SIRT1, PRNP (tumor) | DYRK3, SIRT1, PRNP (normal) |
 |  |
| KIRC (tumor) | KIRC (normal) |
| DYRK3, SIRT1, PRNP (tumor) | DYRK3, SIRT1, PRNP (normal) |
 |  |
| KIRP (tumor) | KIRP (normal) |
| DYRK3, SIRT1, PRNP (tumor) | DYRK3, SIRT1, PRNP (normal) |
 |  |
| LIHC (tumor) | LIHC (normal) |
| DYRK3, SIRT1, PRNP (tumor) | DYRK3, SIRT1, PRNP (normal) |
 |  |
| LUAD (tumor) | LUAD (normal) |
| DYRK3, SIRT1, PRNP (tumor) | DYRK3, SIRT1, PRNP (normal) |
 |  |
| LUSC (tumor) | LUSC (normal) |
| DYRK3, SIRT1, PRNP (tumor) | DYRK3, SIRT1, PRNP (normal) |
 |  |
| PRAD (tumor) | PRAD (normal) |
| DYRK3, SIRT1, PRNP (tumor) | DYRK3, SIRT1, PRNP (normal) |
 |  |
| STAD (tumor) | STAD (normal) |
| DYRK3, SIRT1, PRNP (tumor) | DYRK3, SIRT1, PRNP (normal) |
 |  |
| THCA (tumor) | THCA (normal) |
| DYRK3, SIRT1, PRNP (tumor) | DYRK3, SIRT1, PRNP (normal) |
 |  |
| Top |
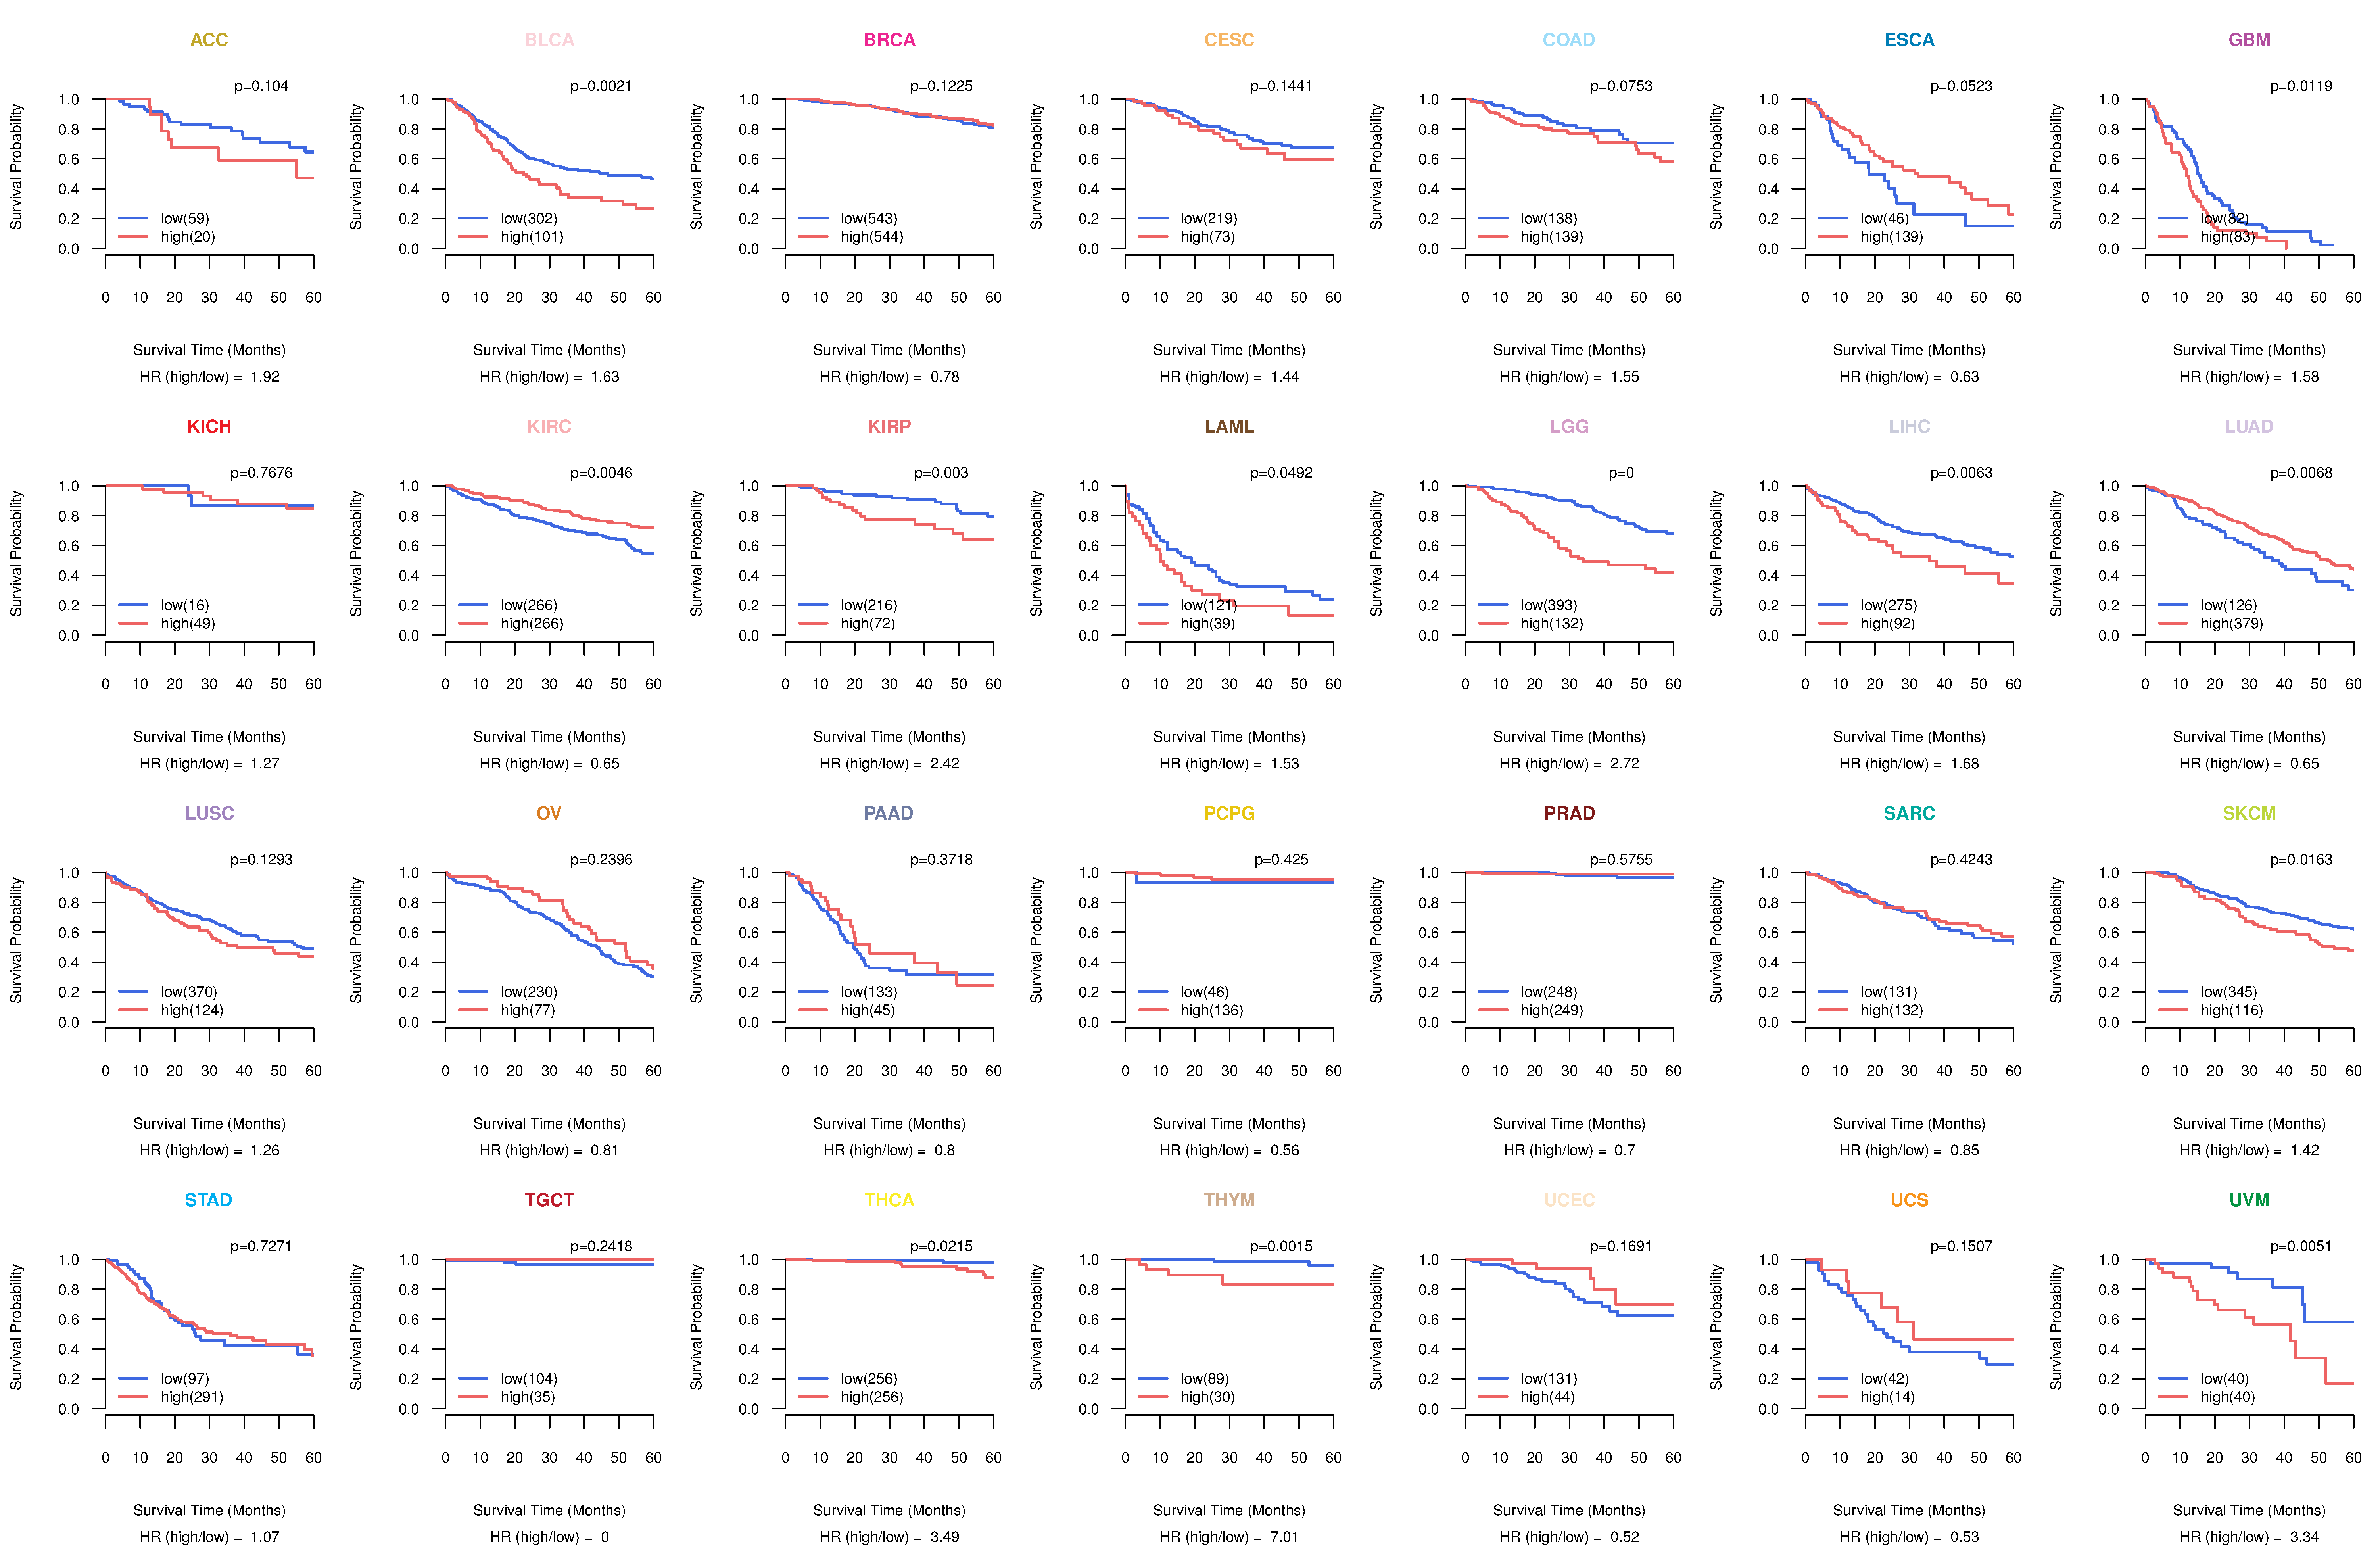
| TissGeneProg for DYRK3 |
| Kaplan-Meier plots with logrank tests of overall survival (OS) using 28 cancer types (TCGA IlluminaHiSeq_RNASeqV2, pan-cancer normalized log2(norm_counts+1) data, version 2016-08-16) (TCGA clinicalMatrix, phenotype data, version 2016-04-27) * Click on the image to enlarge it in a new window. |
 |
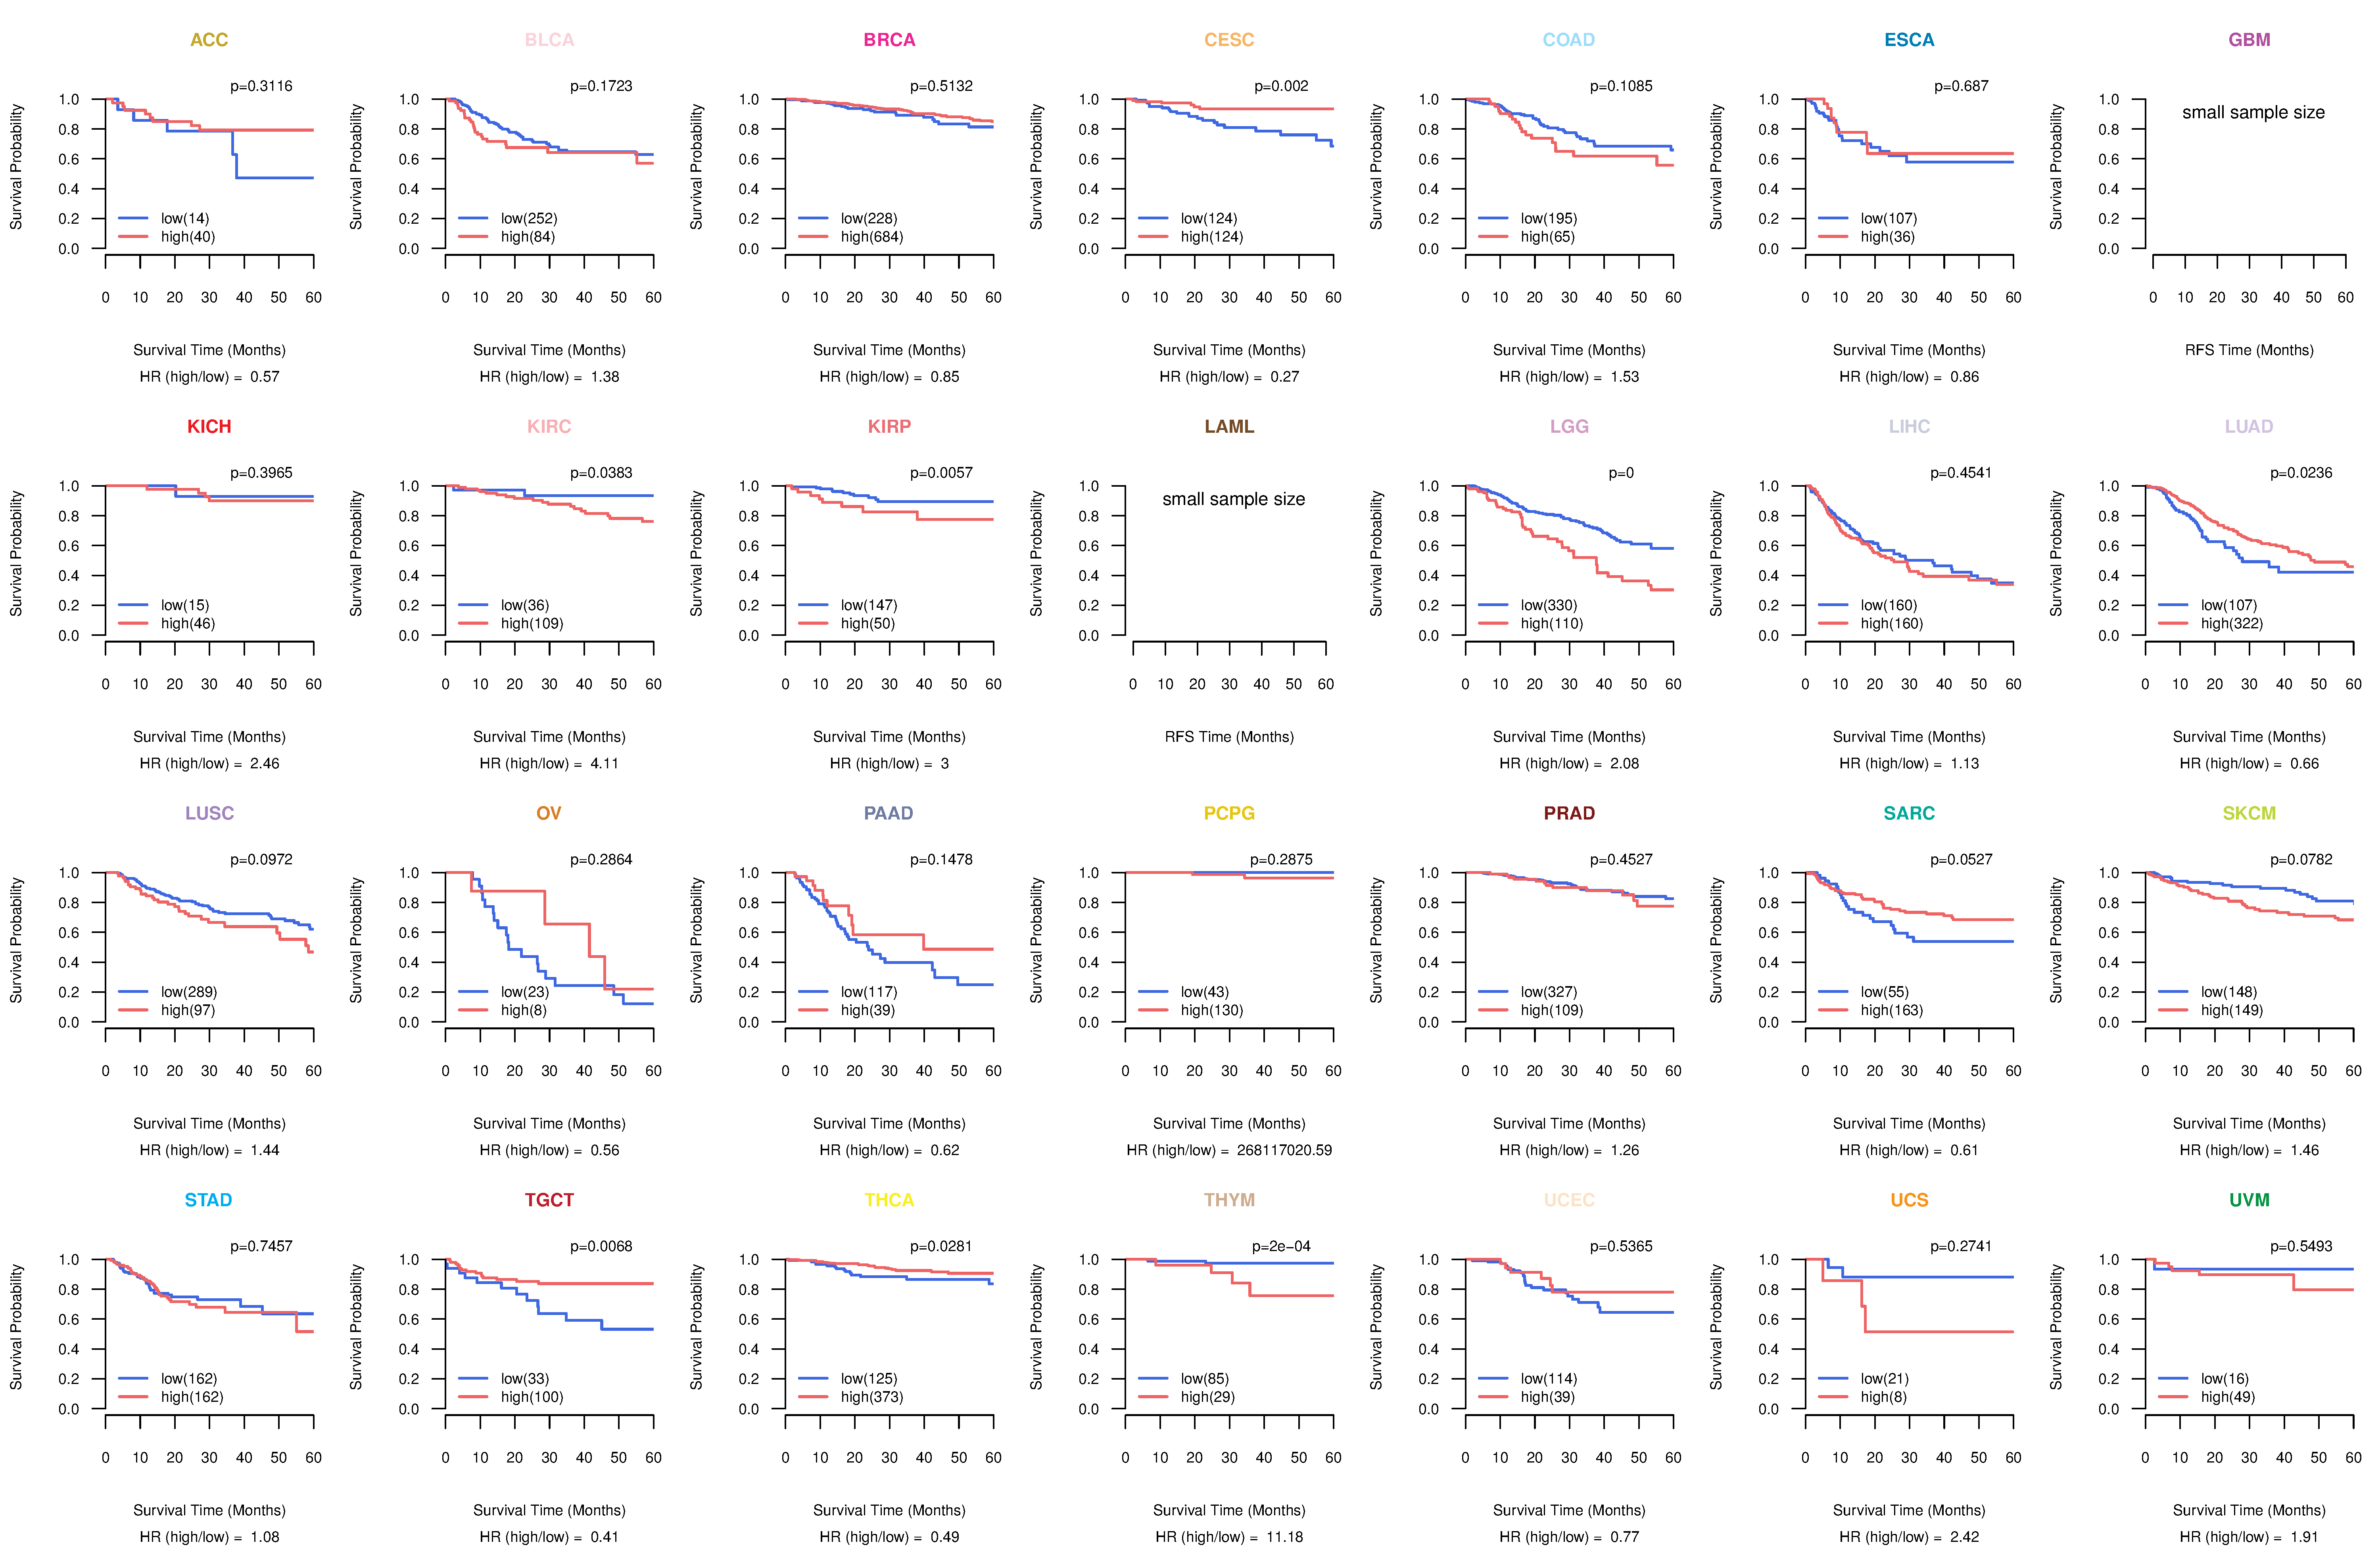
| Kaplan-Meier plots with logrank test of relapse free survival (RFS) using 28 cancer types (TCGA IlluminaHiSeq_RNASeqV2, pan-cancer normalized log2(norm_counts+1) data, version 2016-08-16) (TCGA clinicalMatrix, phenotype data, version 2016-04-27) * Click on the image enlarge it in a new window. |
 |
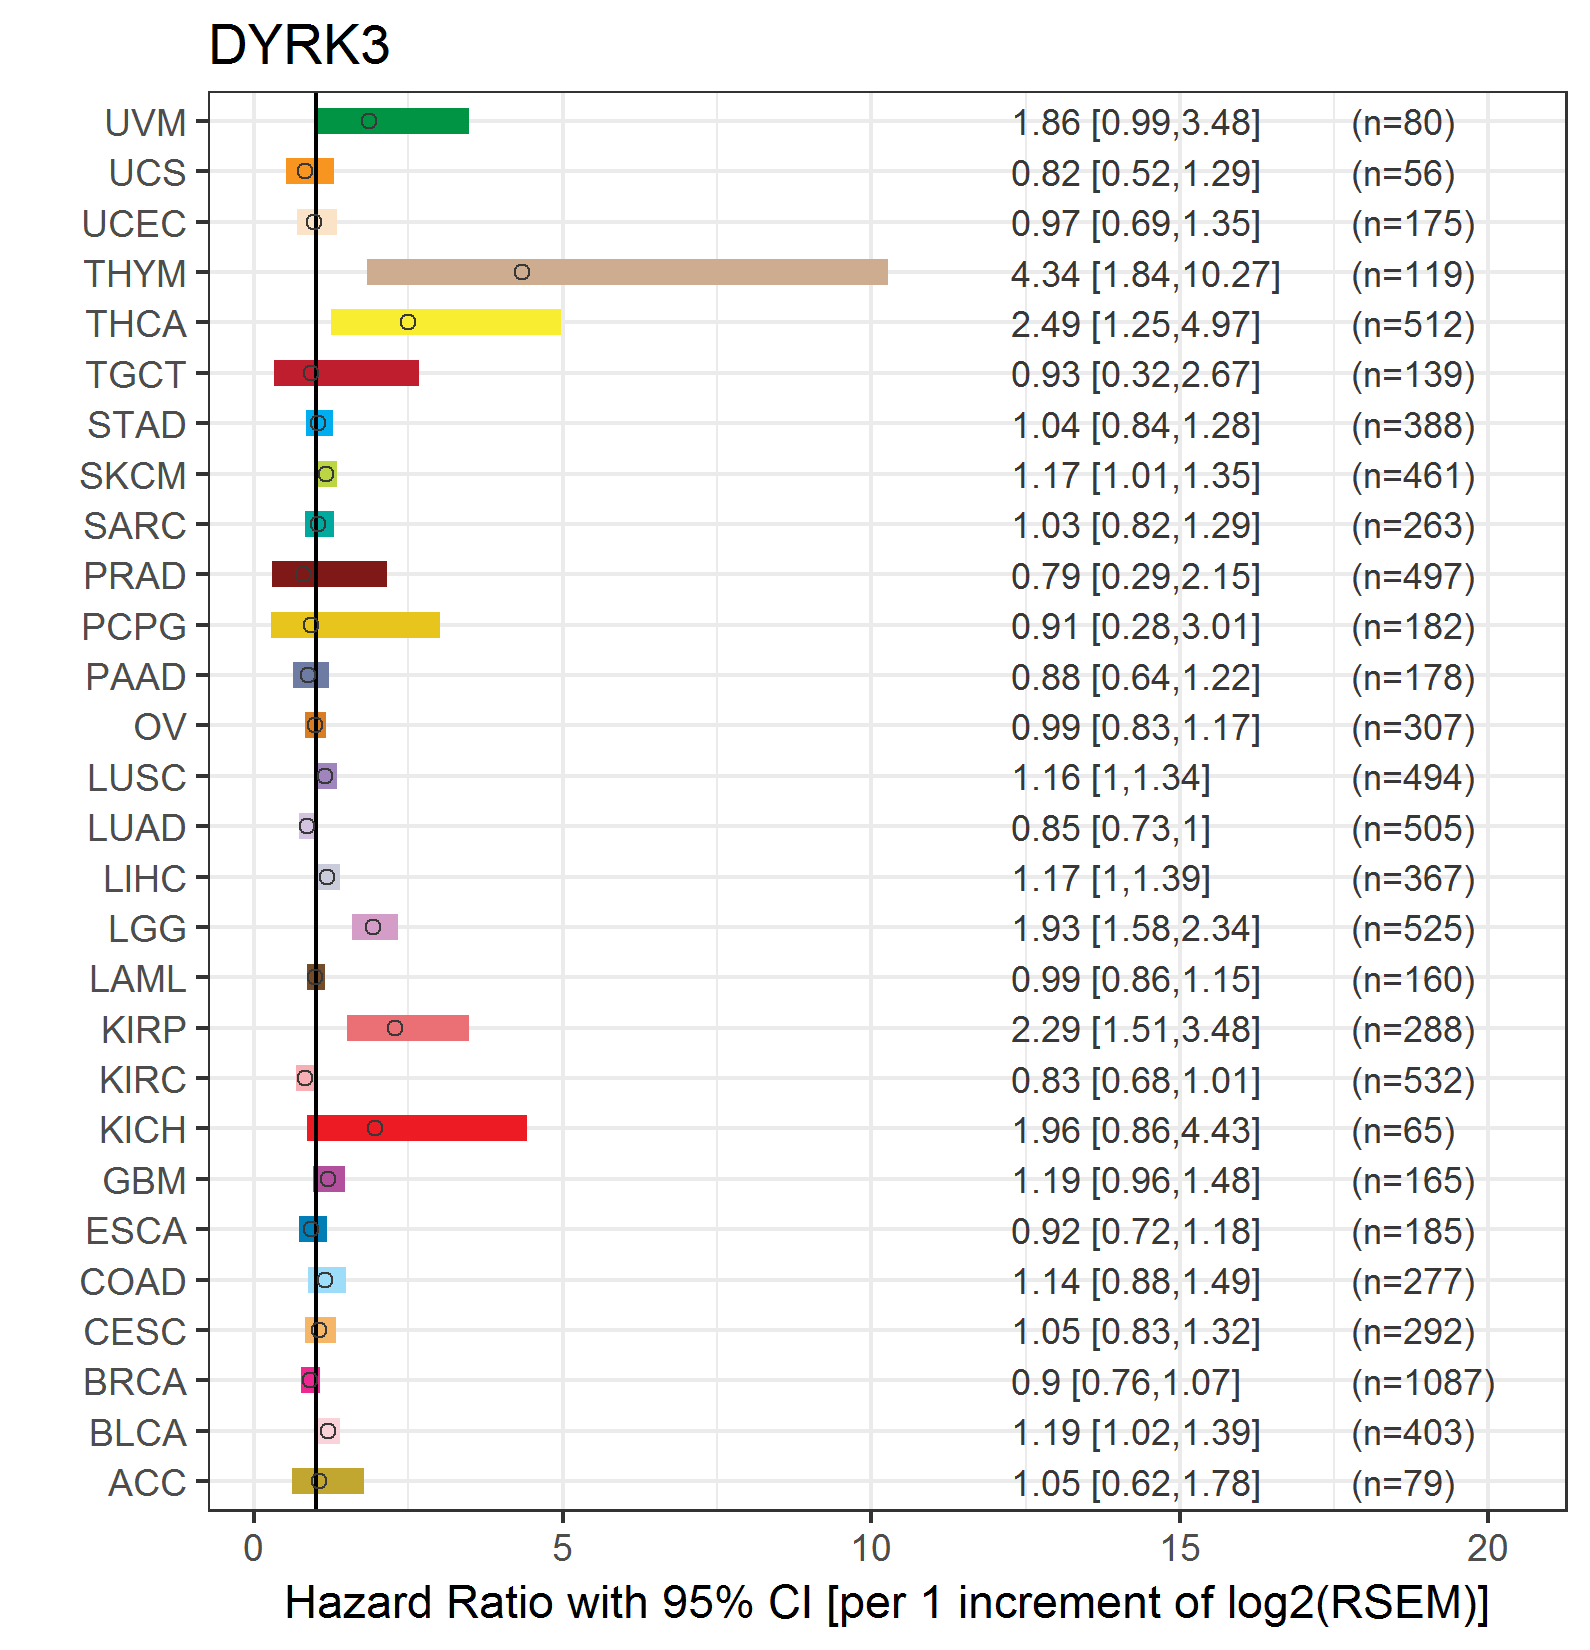
| Forest plot of Cox proportional hazard ratio (HR) and 95% CI of overall survival (OS) using 28 cancer types (TCGA IlluminaHiSeq_RNASeqV2, pan-cancer normalized log2(norm_counts+1) data, version 2016-08-16) (TCGA clinicalMatrix, phenotype data, version 2016-04-27) * Click on the image enlarge it in a new window. |
 |
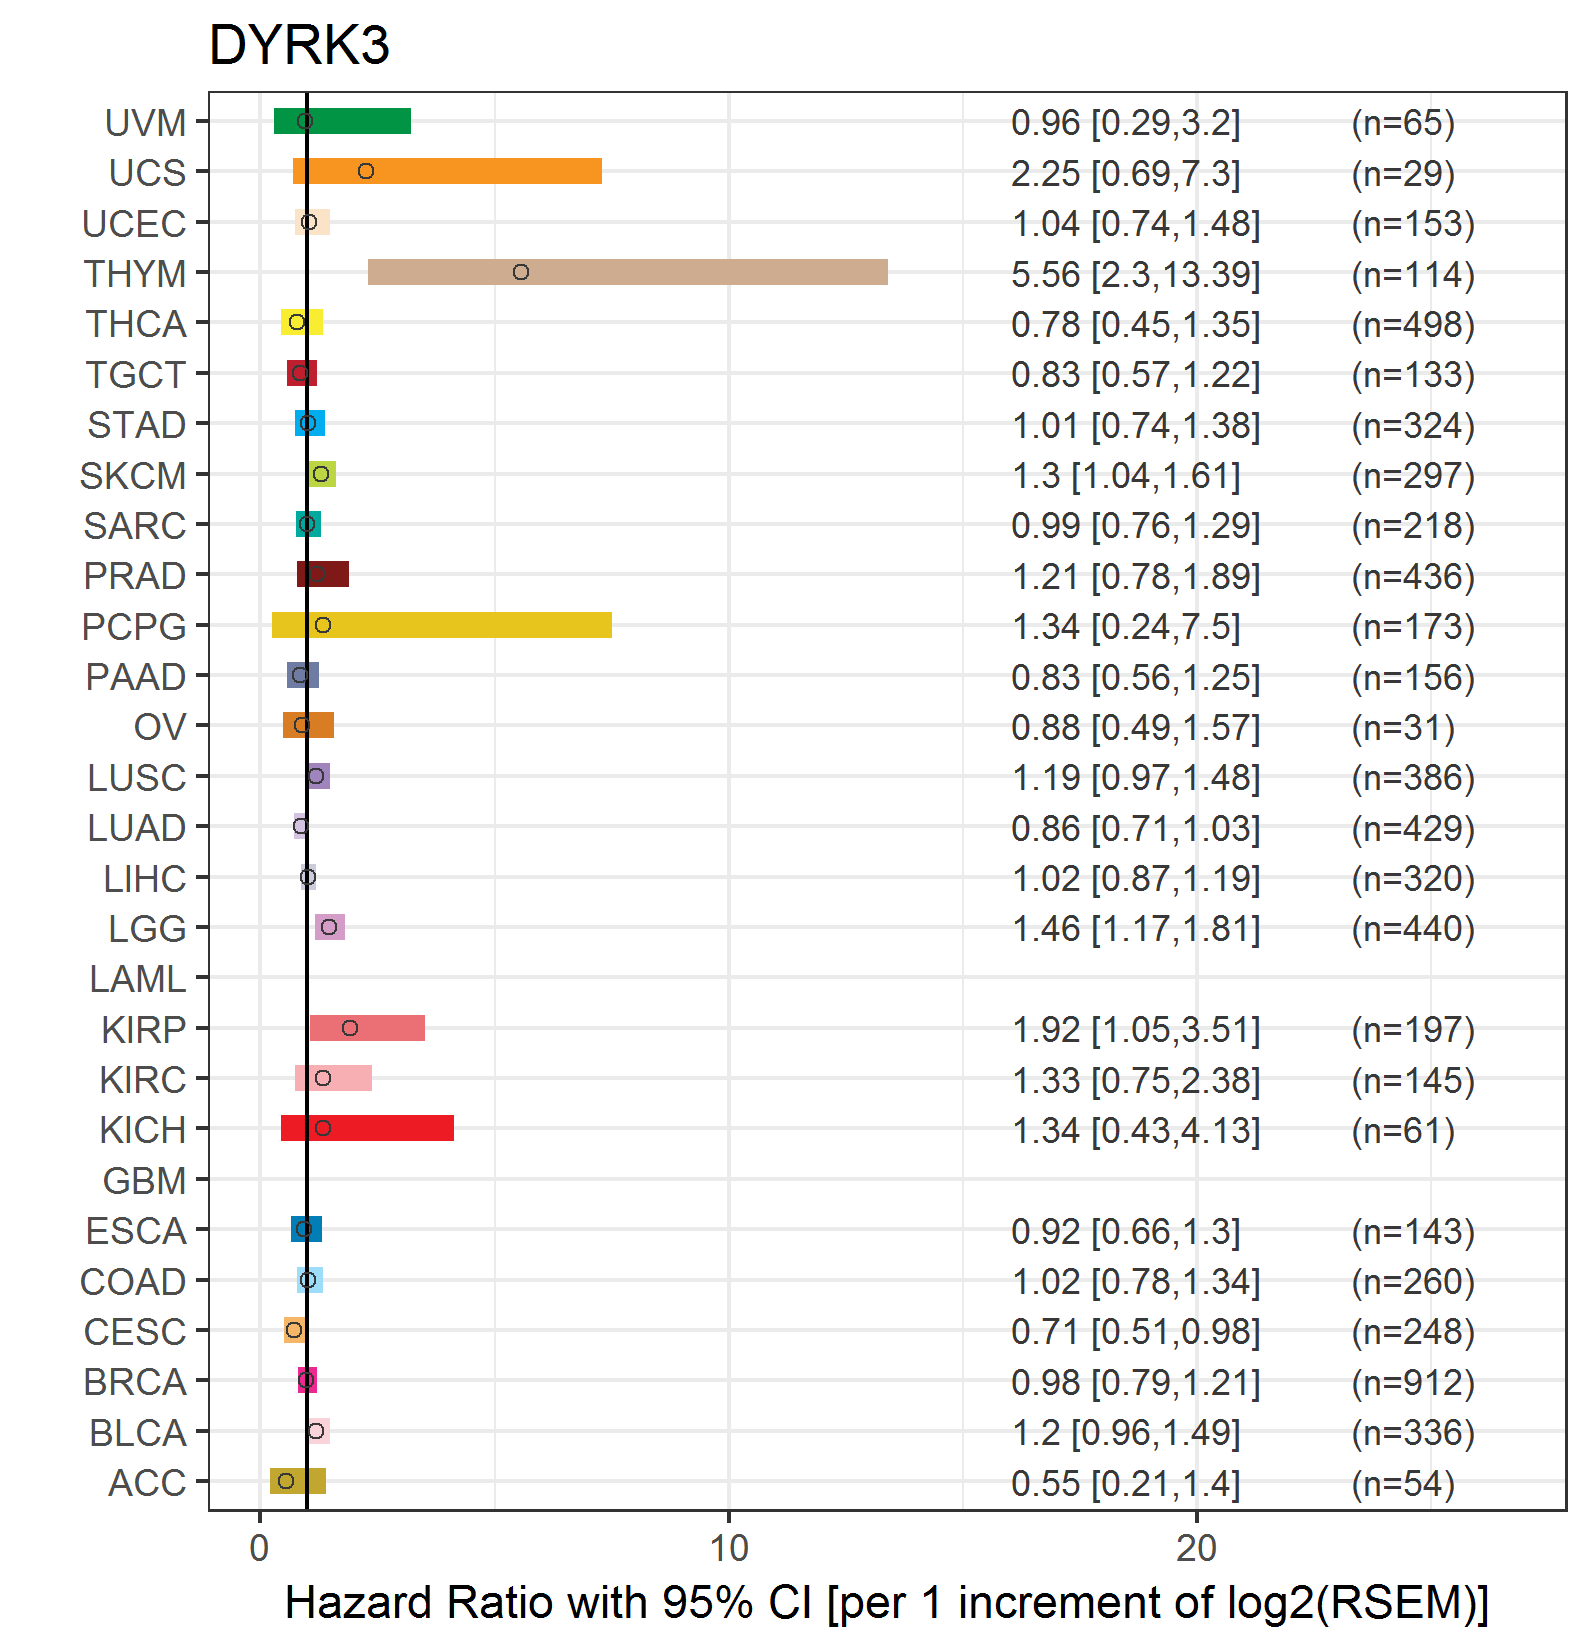
| Forest plot of Cox proportional hazard ratio (HR) and 95% CI of relapse free survival (RFS) using 28 cancer types (TCGA IlluminaHiSeq_RNASeqV2, pan-cancer normalized log2(norm_counts+1) data, version 2016-08-16) (TCGA clinicalMatrix, phenotype data, version 2016-04-27) * Click on the image enlarge it in a new window. |
 |
| Top |
| TissGeneClin for DYRK3 |
| TissGeneDrug for DYRK3 |
| Drug information targeting TissGene (DrugBank Version 5.0.6, 2017-04-01) |
| DrugBank ID | Drug name | Drug activity | Drug type | Drug status |
| Top |
| TissGeneDisease for DYRK3 |
| Disease information associated with TissGene (DisGeNet, 2016-06-01) |
| Disease ID | Disease name | # pubmeds | Source |
| umls:C0009398 | Color vision defect | 1 | BeFree |
| umls:C0242225 | Color blindness | 1 | BeFree |
| umls:C0280100 | Solid tumour | 1 | BeFree |
|
Copyright 2016-Present - The University of Texas Health Science Center at Houston (UTHealth) Web File Viewing | How to Report, Fraud, Waste and Abuse | State of Texas | Statewide Search | Texas Homeland Security | Site Policies |