 |
| |
| |
| |
| |
| |
| |
|

| TissGeneSummary for FKBP6 |
 Gene summary Gene summary |
| Basic gene information | Gene symbol | FKBP6 |
| Gene name | FK506 binding protein 6, 36kDa | |
| Synonyms | FKBP36 | |
| Cytomap | UCSC genome browser: 7q11.23 | |
| Type of gene | protein-coding | |
| RefGenes | NM_001135211.2, NM_001281304.1,NM_003602.4, | |
| Description | 36 kDa FKBPPPIase FKBP6immunophilin FKBP36inactive PPIase FKBP6inactive peptidyl-prolyl cis-trans isomerase FKBP6peptidyl-prolyl cis-trans isomerase FKBP6rotamase | |
| Modification date | 20141207 | |
| dbXrefs | MIM : 604839 | |
| HGNC : HGNC | ||
| Ensembl : ENSG00000077800 | ||
| HPRD : 05326 | ||
| Vega : OTTHUMG00000150520 | ||
| Protein | UniProt: go to UniProt's Cross Reference DB Table | |
| Expression | CleanEX: HS_FKBP6 | |
| BioGPS: 8468 | ||
| Pathway | NCI Pathway Interaction Database: FKBP6 | |
| KEGG: FKBP6 | ||
| REACTOME: FKBP6 | ||
| Pathway Commons: FKBP6 | ||
| Context | iHOP: FKBP6 | |
| ligand binding site mutation search in PubMed: FKBP6 | ||
| UCL Cancer Institute: FKBP6 | ||
| Assigned class in TissGDB* | B | |
| Included tissue-specific gene expression resources | HPA,TiGER,GTEx | |
| Specific-tissues in normal samples (assigned by TissGDB using HPA, TiGER, and GTEx) | Testis | |
| Cancer types related to the specific-tissues in cancer samples (assigned by TissGDB using TCGA) | TGCT | |
| Reference showing the relevant tissue of FKBP6 | ||
| Description by TissGene annotations | ||
| * Class A consists of genes with literature evidence and is part of the cTissGenes. Class B consists of only cTissGenes without additional evidence. The remaining genes belong to Class C. |
| Gene ontology having evidence of Inferred from Direct Assay (IDA) from Entrez |
| GO ID | GO term | PubMed ID |
| Top |
| TissGeneExp for FKBP6 |
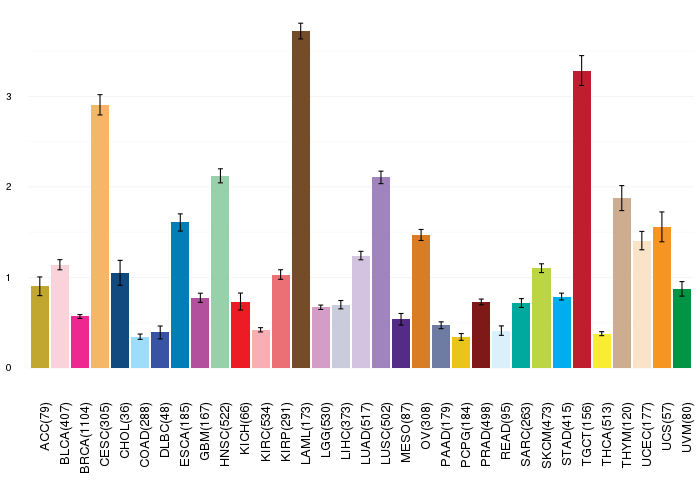
| Gene expressions across 28 cancer types (X-axis: cancer type and Y-axis: log2(norm_counts+1)) (TCGA IlluminaHiSeq_RNASeqV2, pan-cancer normalized log2(norm_counts+1) data, version 2016-08-16) |
 |
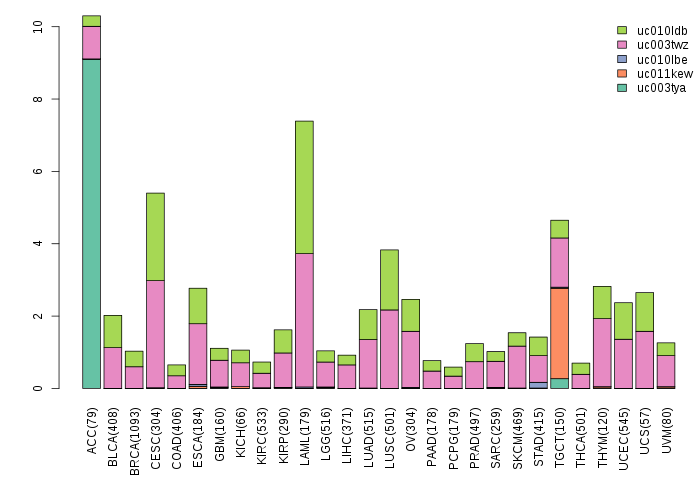
| Gene isoform expressions across 28 cancer types (X-axis: cancer type and Y-axis: log2(norm_counts+1)) (TCGA pan-cancer tcga_rsem_isoform_tpm, version 2016-09-01) |
 |
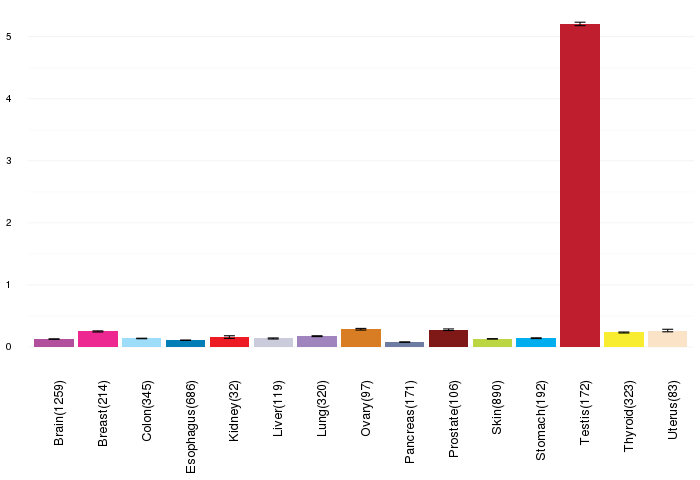
| Gene expressions across normal tissues of GTEx data (GTEx GTEx_Analysis_v6_RNA-seq_RNA-SeQCv1.1.8_gene_rpkm.gct) - Here, we shows the matched tissue types only among our 28 cancer types. |
 |
| Different expressions across 14 cancer types with more than 10 samples between matched tumors and normals (X-axis: cancer type and Y-axis: log2(norm_counts+1)) (TCGA IlluminaHiSeq_RNASeqV2, pan-cancer normalized log2(norm_counts+1) data, version 2016-08-16) |
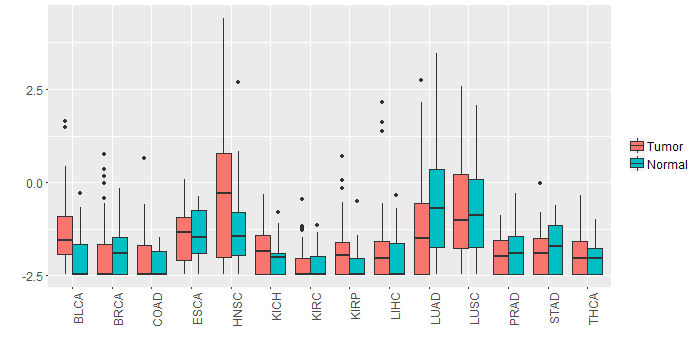 |
| - Significantly differentially expressed cancer types and information. (|Fold change|>1 and FDR<0.05) |
| Cancer type | Mean(exp) in tumor | Mean(exp) in matched normal | Log2FC | P-val. | FDR |
| HNSC | -0.307349943 | -1.325931339 | 1.018581395 | 0.00279 | 0.008227392 |
| Top |
| TissGene-miRNA for FKBP6 |
| Significantly anti-correlated miRNAs of TissGene across 28 cancer types (Gene-miRNA relations from TargetScanHuman Relsease 7.1, Conserved_Site_Context_Scores.txt.zip, 06.01.2016) (TCGA IlluminaHiSeq_miRNASeq, log2(RPM+1) data, version 2016-11-21) (TCGA IlluminaHiSeq_RNASeqV2, log2(normalized_count+1) data, version 2016-08-16) (Spearman’s Rank Correlation (p-value<0.05 and coefficient<-0.25)) |
| Cancer type | miRNA id | miRNA accession | P-val. | Coeff. | # samples |
| ACC | hsa-miR-194-5p | MIMAT0000460 | 0.025 | -0.26 | 78 |
| ACC | hsa-miR-194-5p | MIMAT0000460 | 0.025 | -0.26 | 78 |
| Top |
| TissGeneMut for FKBP6 |
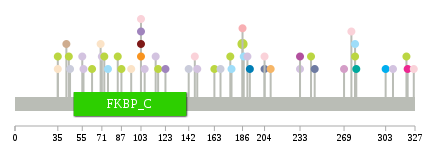
| TissGeneSNV for FKBP6 |
| nsSNV counts per each loci. Different colors of circles represent different cancer types. Circle size denotes number of samples. (TCGA somatic mutation (SNPs and small INDELs) data, version 2016-04-25) * Click on the image to enlarge it in a new window. |
 |
 |
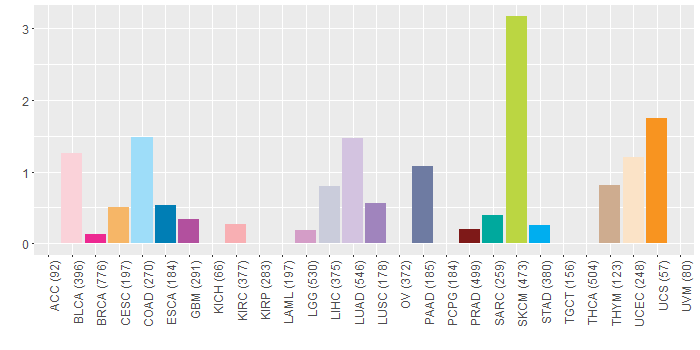
| Somatic nucleotide variants of TissGene across 28 cancer types (X-axis: cancer type and Y-axis: % of mutated samples) The numbers in parentheses are numbers of samples with mutation (nsSNVs). (TCGA somatic mutation (SNPs and small INDELs) data, version 2016-04-25) |
 |
| - nsSNVs sorted by frequency. |
| AAchange | Cancer type | # samples |
| p.R186C | SKCM | 3 |
| p.A279V | SARC | 1 |
| p.E106D | LUAD | 1 |
| p.N115K | LUAD | 1 |
| p.A245D | PAAD | 1 |
| p.F77V | DLBC | 1 |
| p.R44* | SKCM | 1 |
| p.R278X | COAD | 1 |
| p.D35N | SKCM | 1 |
| p.P163L | SKCM | 1 |
| p.A217T | HNSC | 1 |
| p.D320N | SKCM | 1 |
| p.E309* | LUAD | 1 |
| p.E147K | BLCA | 1 |
| p.R103Q | UCS | 1 |
| p.F177C | COAD | 1 |
| p.S56* | LUAD | 1 |
| p.G321C | BRCA | 1 |
| p.E326K | BLCA | 1 |
| p.R278Q | SKCM | 1 |
| p.G87R | SKCM | 1 |
| p.R103Q | READ | 1 |
| p.V42I | THYM | 1 |
| p.R204Q | PAAD | 1 |
| p.Y269H | LGG | 1 |
| p.G242R | SKCM | 1 |
| p.P71H | LUAD | 1 |
| p.A95T | UCEC | 1 |
| p.G63E | SKCM | 1 |
| p.D233Y | LUAD | 1 |
| p.R204* | BLCA | 1 |
| p.D35E | UCEC | 1 |
| p.Y303C | STAD | 1 |
| p.D233H | GBM | 1 |
| p.F275L | BLCA | 1 |
| p.D149Y | LUAD | 1 |
| p.E45D | LIHC | 1 |
| p.A190S | LUAD | 1 |
| p.F187L | COAD | 1 |
| p.R70S | UCEC | 1 |
| p.A55P | LUAD | 1 |
| p.R103Q | PRAD | 1 |
| p.E209K | CESC | 1 |
| p.F142L | LIHC | 1 |
| p.A117T | SKCM | 1 |
| p.E176K | SKCM | 1 |
| p.Y76C | COAD | 1 |
| p.M84I | SKCM | 1 |
| p.C123S | LUSC | 1 |
| p.R103Q | BLCA | 1 |
| p.R103Q | LUSC | 1 |
| p.D73N | SKCM | 1 |
| p.R186C | KIRC | 1 |
| p.L168M | LIHC | 1 |
| p.V192M | ESCA | 1 |
| Top |
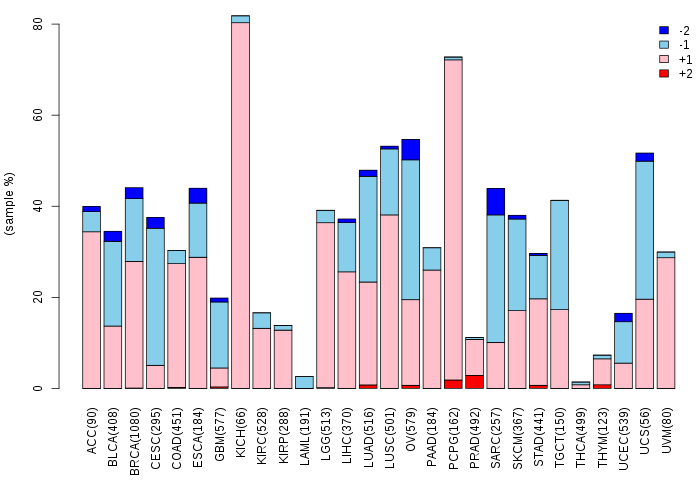
| TissGeneCNV for FKBP6 |
| Copy number variations of TissGene across 28 cancer types (X-axis: cancer type and Y-axis: % of CNV samples) (TCGA Gistic2_CopyNumber_Gistic2_all_data_by_genes, Gistic2 copy number data, version 2016-08-16) |
 |
| Top |
| TissGeneFusions for FKBP6 |
| Fusion genes including TissGene (ChimerDB 3.0, 2016-12-01 and TCGA fusion Portal 2015-12-01) |
| Database | Src | Cancer type | Sample | Fusion gene | ORF | 5'-gene BP | 3'-gene BP |
| Chimerdb3.0 | ChiTaRs | NA | DA679431 | FKBP6-RNF167 | chr7:72722813 | chr17:4844166 | |
| Chimerdb3.0 | ChiTaRs | NA | AW205219 | AAAS-FKBP6 | chr12:53701290 | chr7:72738395 | |
| Chimerdb3.0 | ChiTaRs | NA | BC111488 | MON2-FKBP6 | chr12:62902925 | chr7:72615306 |
| Top |
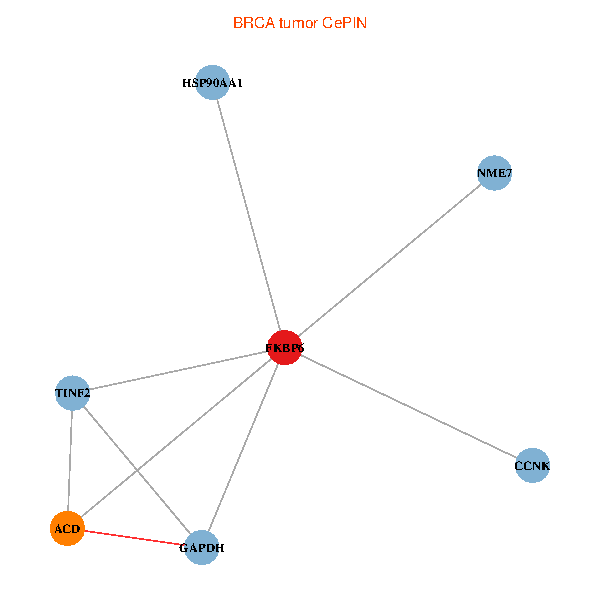
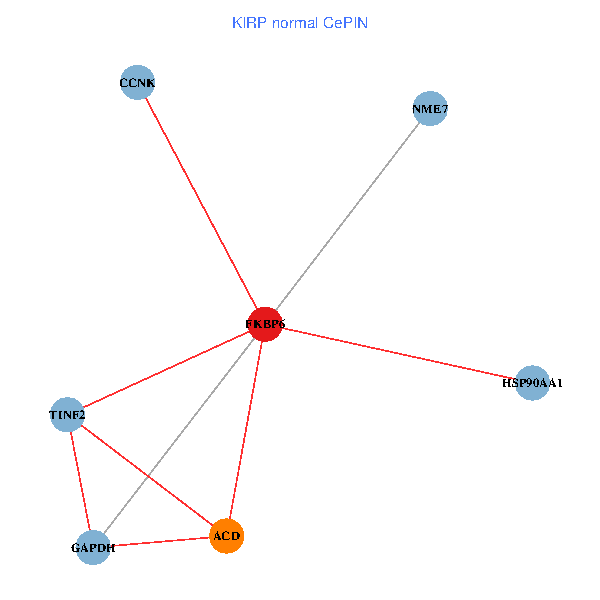
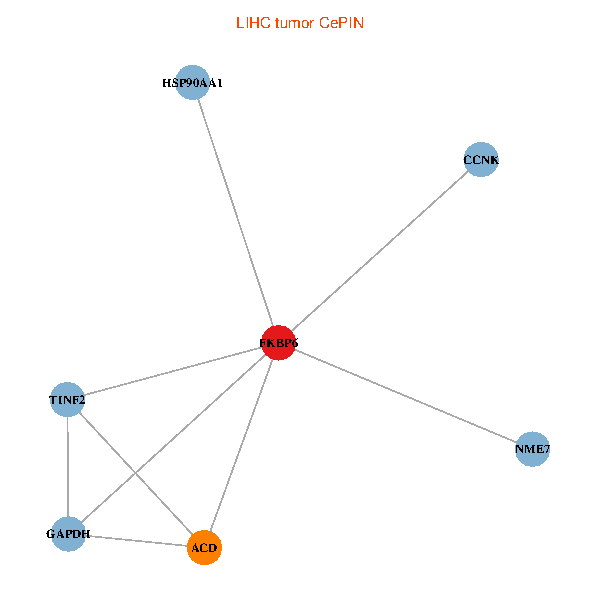
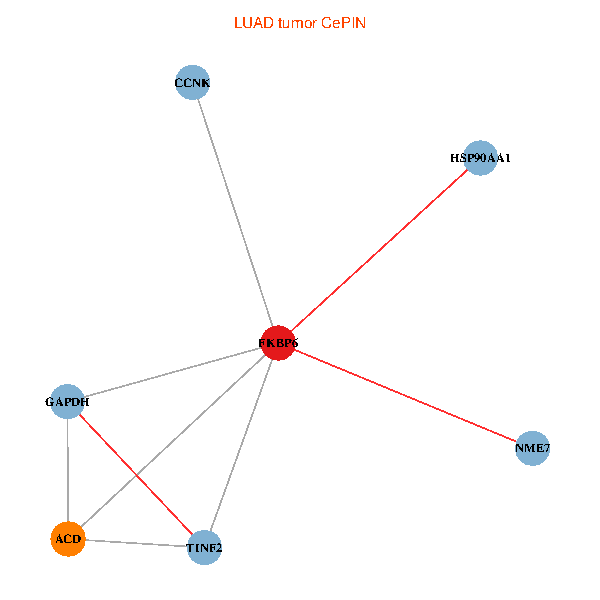
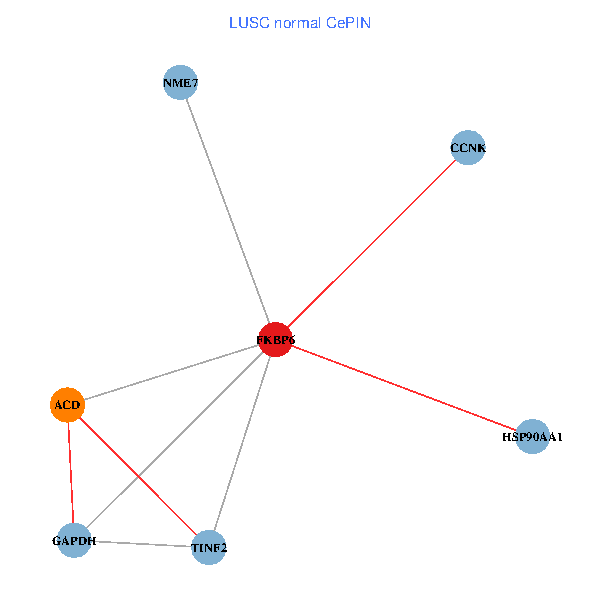
| TissGeneNet for FKBP6 |
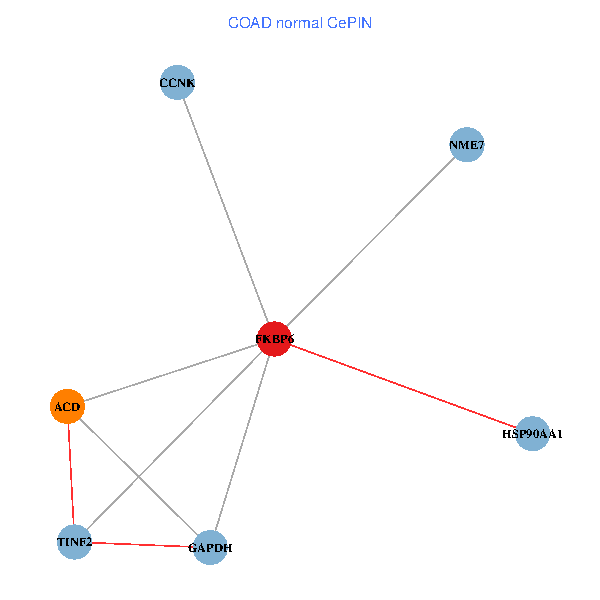
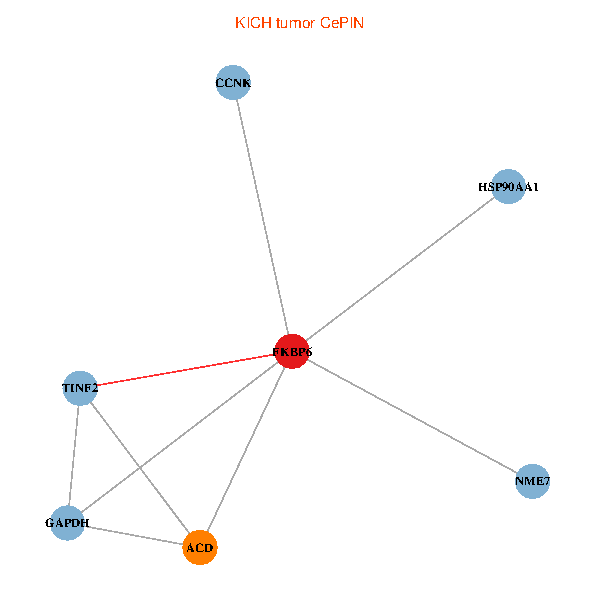
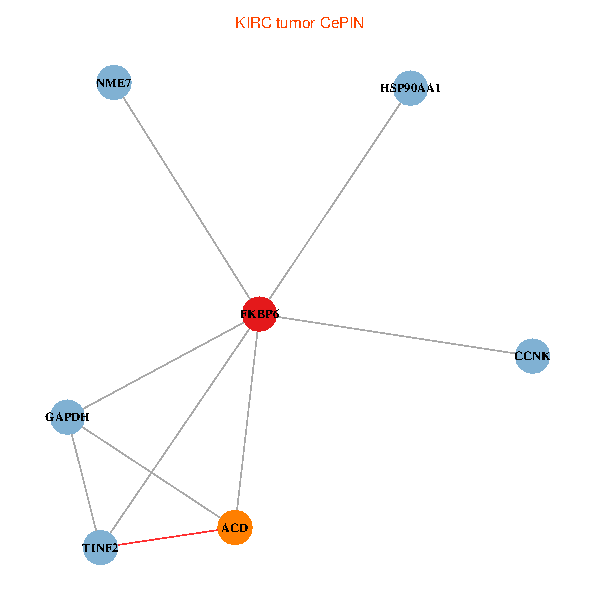
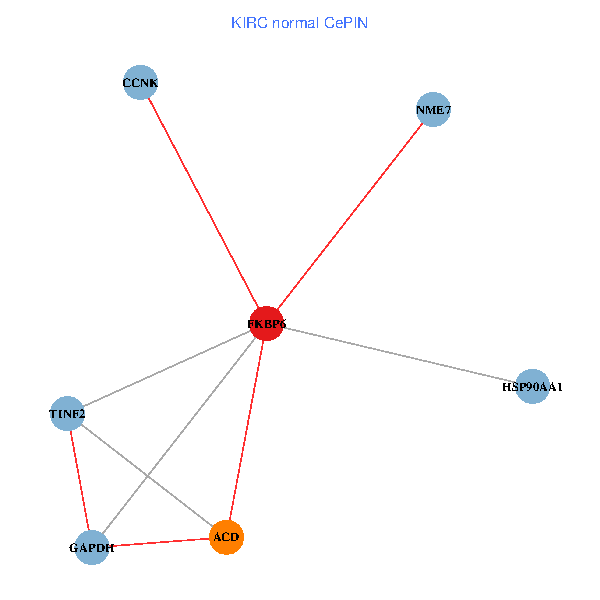
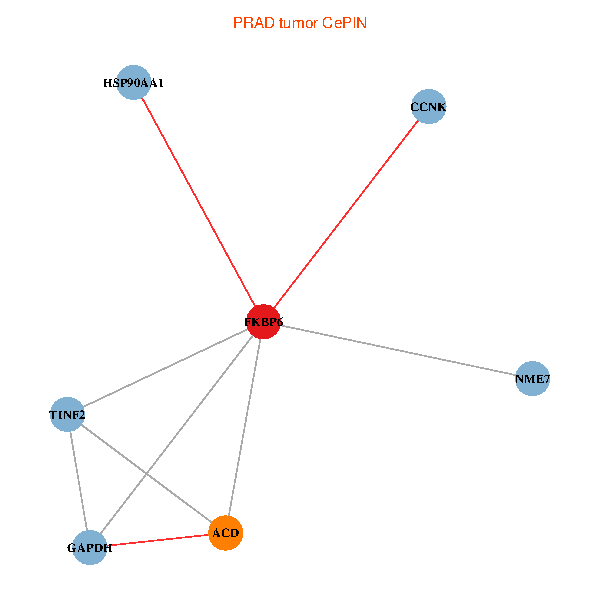
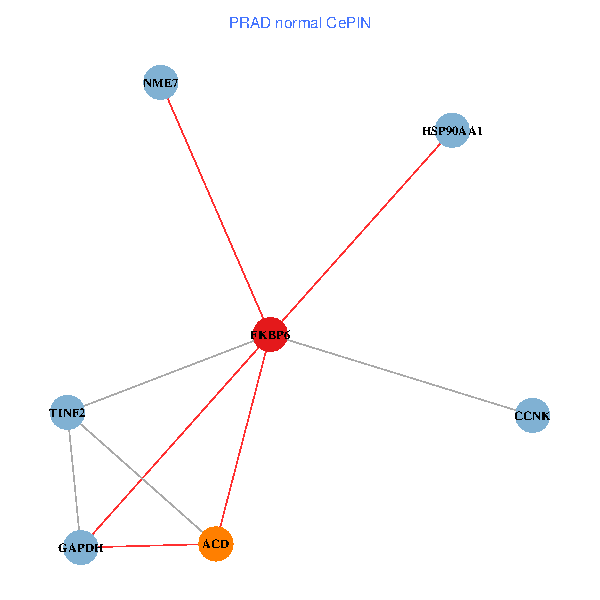
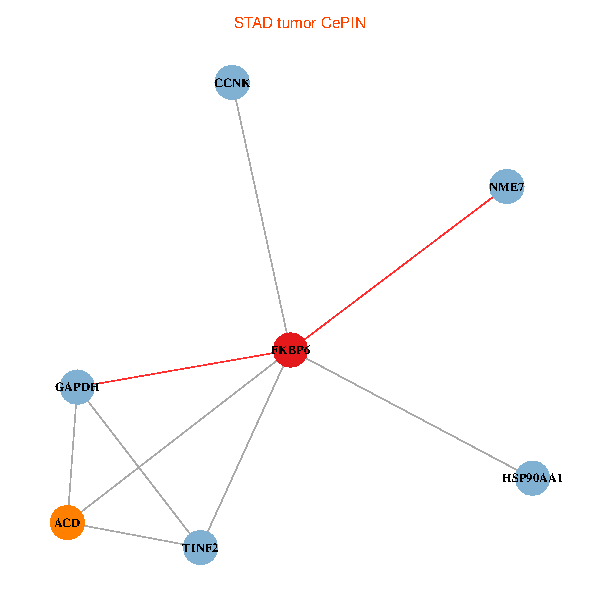
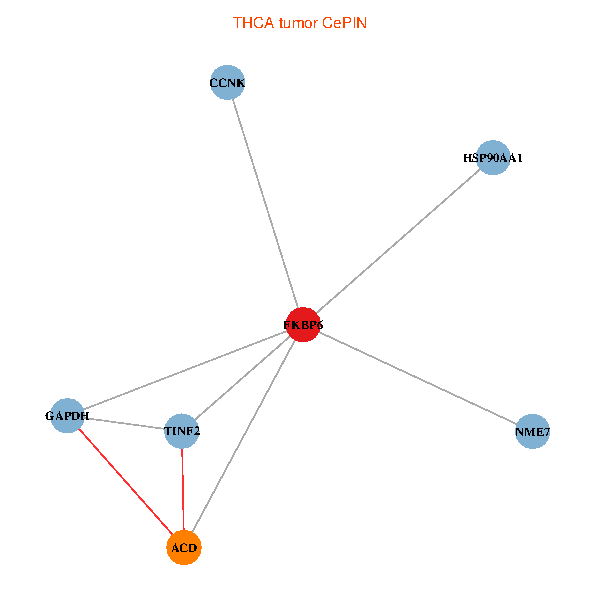
| Co-expressed gene networks based on protein-protein interaction data (CePIN) (TCGA IlluminaHiSeq_RNASeqV2, pan-cancer normalized log2(norm_counts+1) data, version 2016-08-16) (PINA2 ppi data) |
| BRCA (tumor) | BRCA (normal) |
| FKBP6, TINF2, ACD, GAPDH, HSP90AA1, NME7, CCNK (tumor) | FKBP6, TINF2, ACD, GAPDH, HSP90AA1, NME7, CCNK (normal) |
 |  |
| COAD (tumor) | COAD (normal) |
| FKBP6, TINF2, ACD, GAPDH, HSP90AA1, NME7, CCNK (tumor) | FKBP6, TINF2, ACD, GAPDH, HSP90AA1, NME7, CCNK (normal) |
 |  |
| HNSC (tumor) | HNSC (normal) |
| FKBP6, TINF2, ACD, GAPDH, HSP90AA1, NME7, CCNK (tumor) | FKBP6, TINF2, ACD, GAPDH, HSP90AA1, NME7, CCNK (normal) |
 |  |
| KICH (tumor) | KICH (normal) |
| FKBP6, TINF2, ACD, GAPDH, HSP90AA1, NME7, CCNK (tumor) | FKBP6, TINF2, ACD, GAPDH, HSP90AA1, NME7, CCNK (normal) |
 |  |
| KIRC (tumor) | KIRC (normal) |
| FKBP6, TINF2, ACD, GAPDH, HSP90AA1, NME7, CCNK (tumor) | FKBP6, TINF2, ACD, GAPDH, HSP90AA1, NME7, CCNK (normal) |
 |  |
| KIRP (tumor) | KIRP (normal) |
| FKBP6, TINF2, ACD, GAPDH, HSP90AA1, NME7, CCNK (tumor) | FKBP6, TINF2, ACD, GAPDH, HSP90AA1, NME7, CCNK (normal) |
 |  |
| LIHC (tumor) | LIHC (normal) |
| FKBP6, TINF2, ACD, GAPDH, HSP90AA1, NME7, CCNK (tumor) | FKBP6, TINF2, ACD, GAPDH, HSP90AA1, NME7, CCNK (normal) |
 |  |
| LUAD (tumor) | LUAD (normal) |
| FKBP6, TINF2, ACD, GAPDH, HSP90AA1, NME7, CCNK (tumor) | FKBP6, TINF2, ACD, GAPDH, HSP90AA1, NME7, CCNK (normal) |
 |  |
| LUSC (tumor) | LUSC (normal) |
| FKBP6, TINF2, ACD, GAPDH, HSP90AA1, NME7, CCNK (tumor) | FKBP6, TINF2, ACD, GAPDH, HSP90AA1, NME7, CCNK (normal) |
 |  |
| PRAD (tumor) | PRAD (normal) |
| FKBP6, TINF2, ACD, GAPDH, HSP90AA1, NME7, CCNK (tumor) | FKBP6, TINF2, ACD, GAPDH, HSP90AA1, NME7, CCNK (normal) |
 |  |
| STAD (tumor) | STAD (normal) |
| FKBP6, TINF2, ACD, GAPDH, HSP90AA1, NME7, CCNK (tumor) | FKBP6, TINF2, ACD, GAPDH, HSP90AA1, NME7, CCNK (normal) |
 |  |
| THCA (tumor) | THCA (normal) |
| FKBP6, TINF2, ACD, GAPDH, HSP90AA1, NME7, CCNK (tumor) | FKBP6, TINF2, ACD, GAPDH, HSP90AA1, NME7, CCNK (normal) |
 |  |
| Top |
| TissGeneProg for FKBP6 |
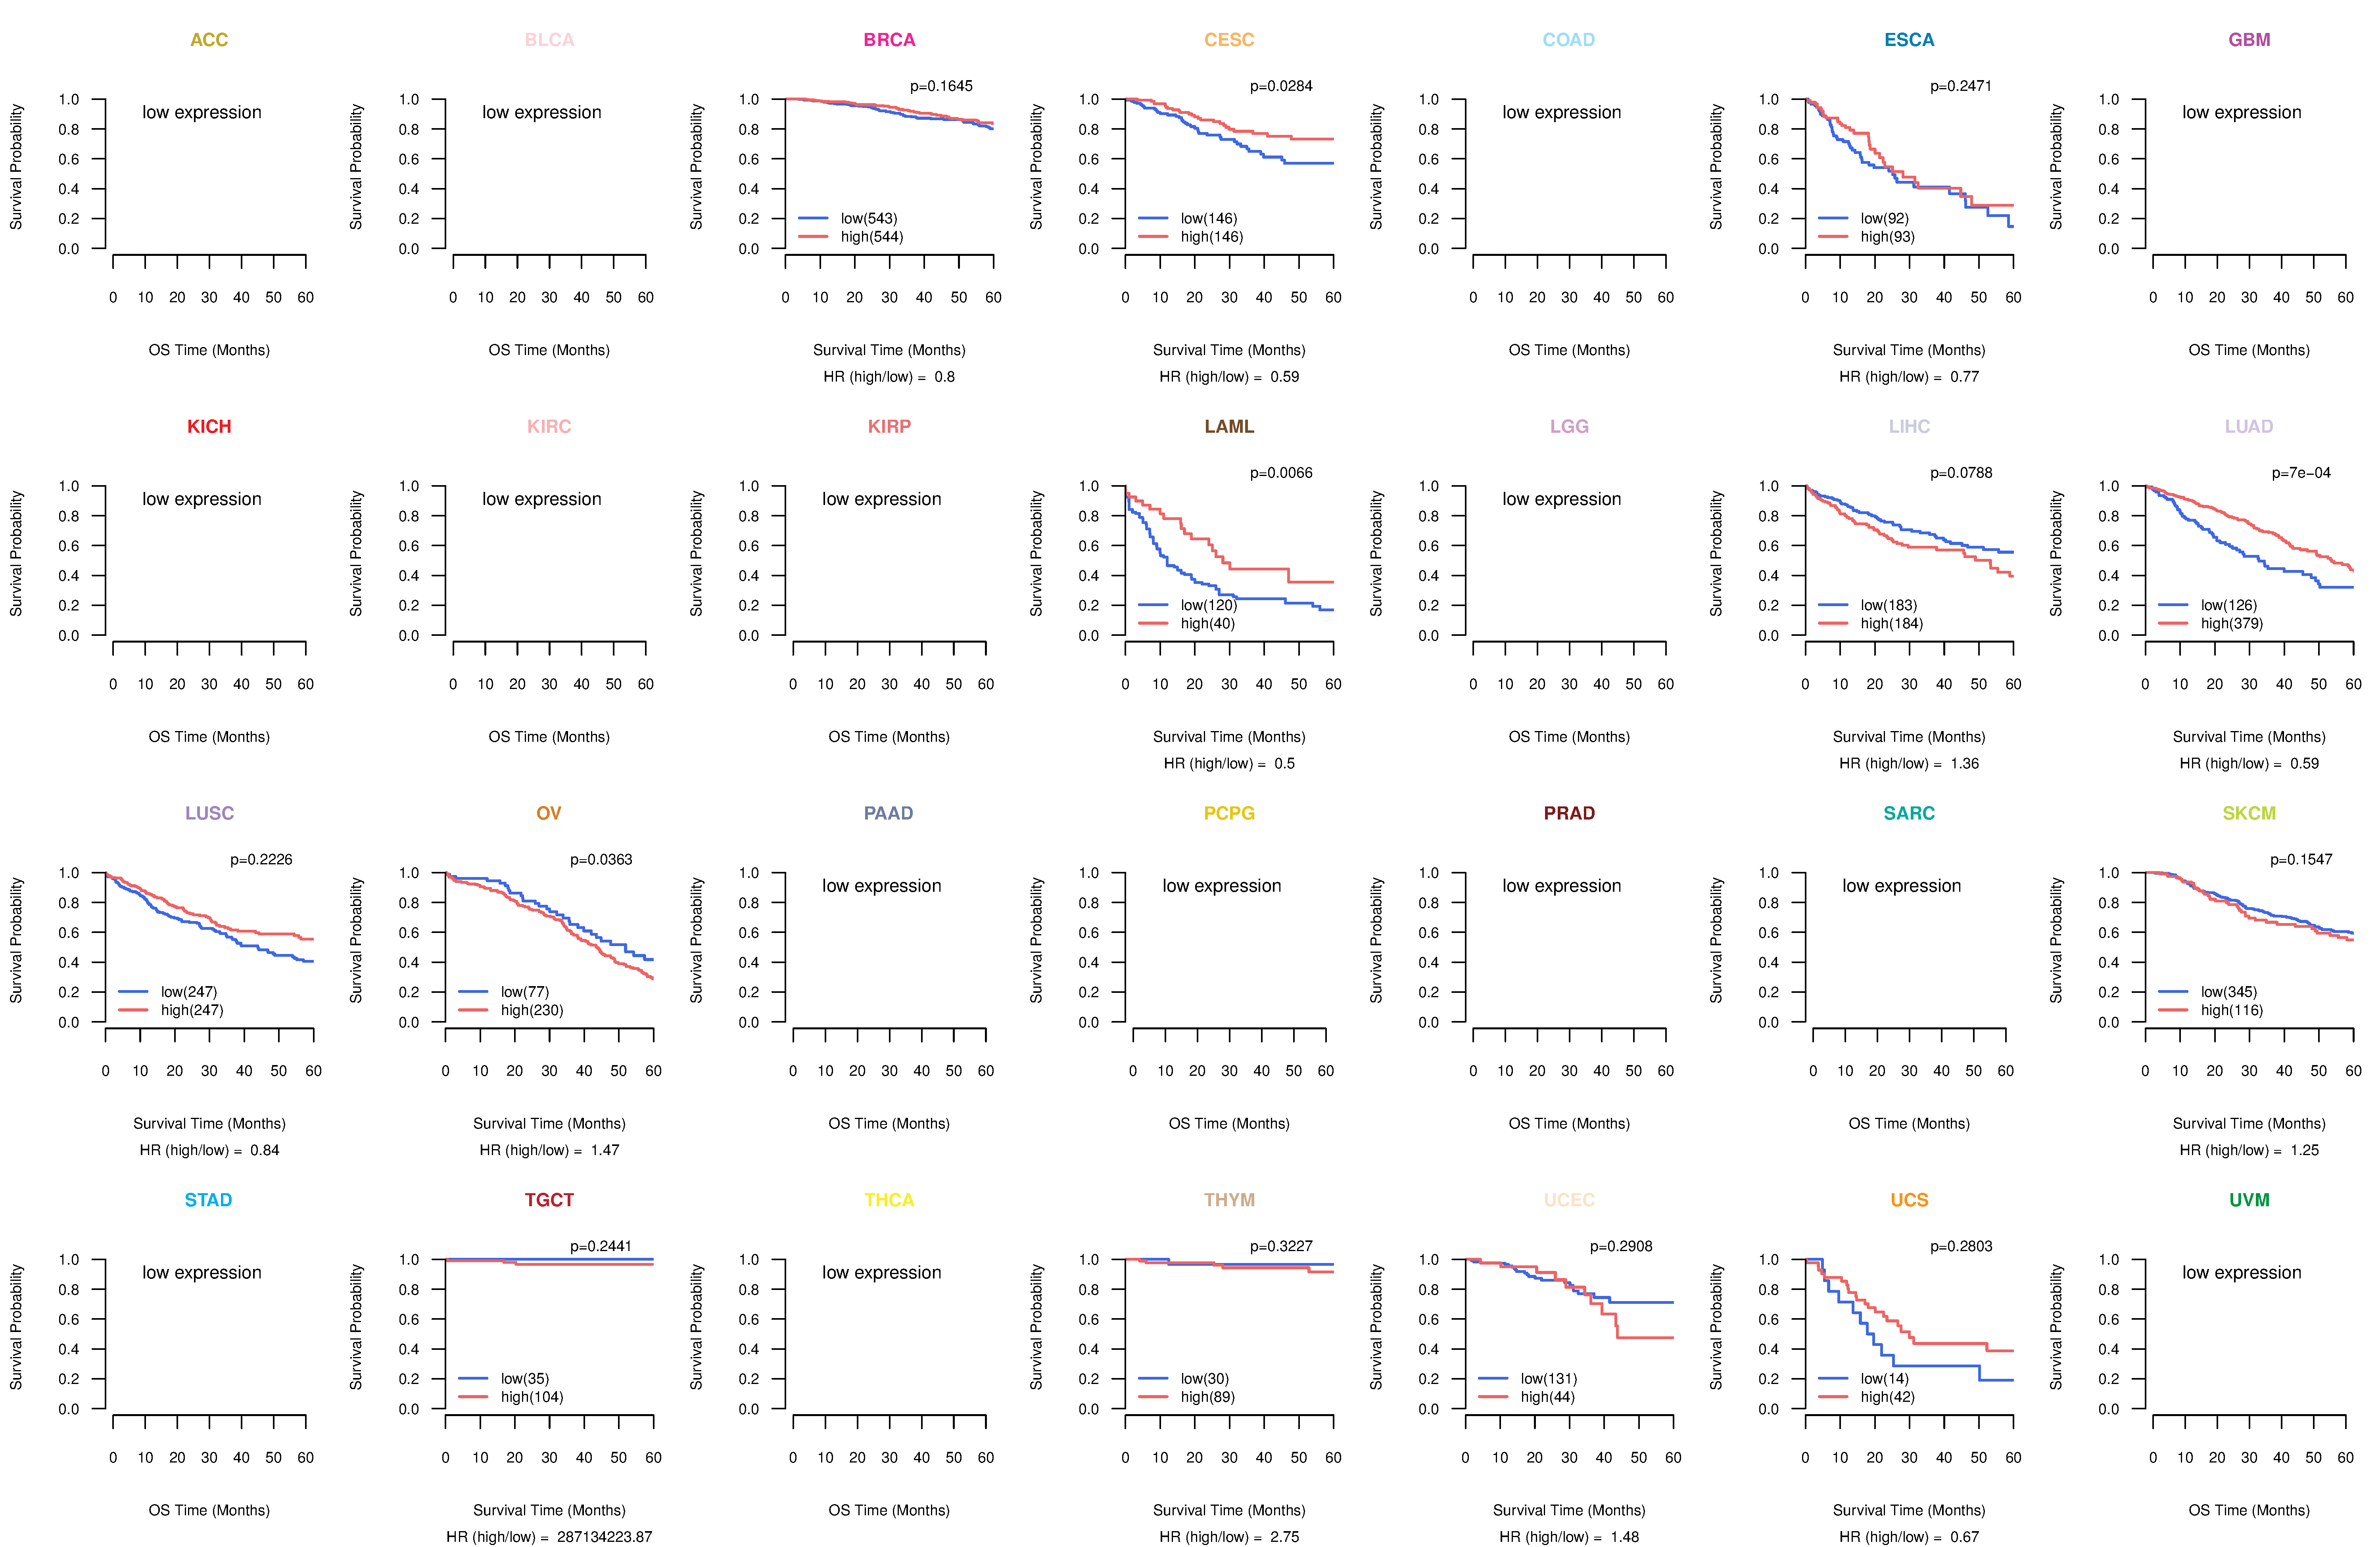
| Kaplan-Meier plots with logrank tests of overall survival (OS) using 28 cancer types (TCGA IlluminaHiSeq_RNASeqV2, pan-cancer normalized log2(norm_counts+1) data, version 2016-08-16) (TCGA clinicalMatrix, phenotype data, version 2016-04-27) * Click on the image to enlarge it in a new window. |
 |
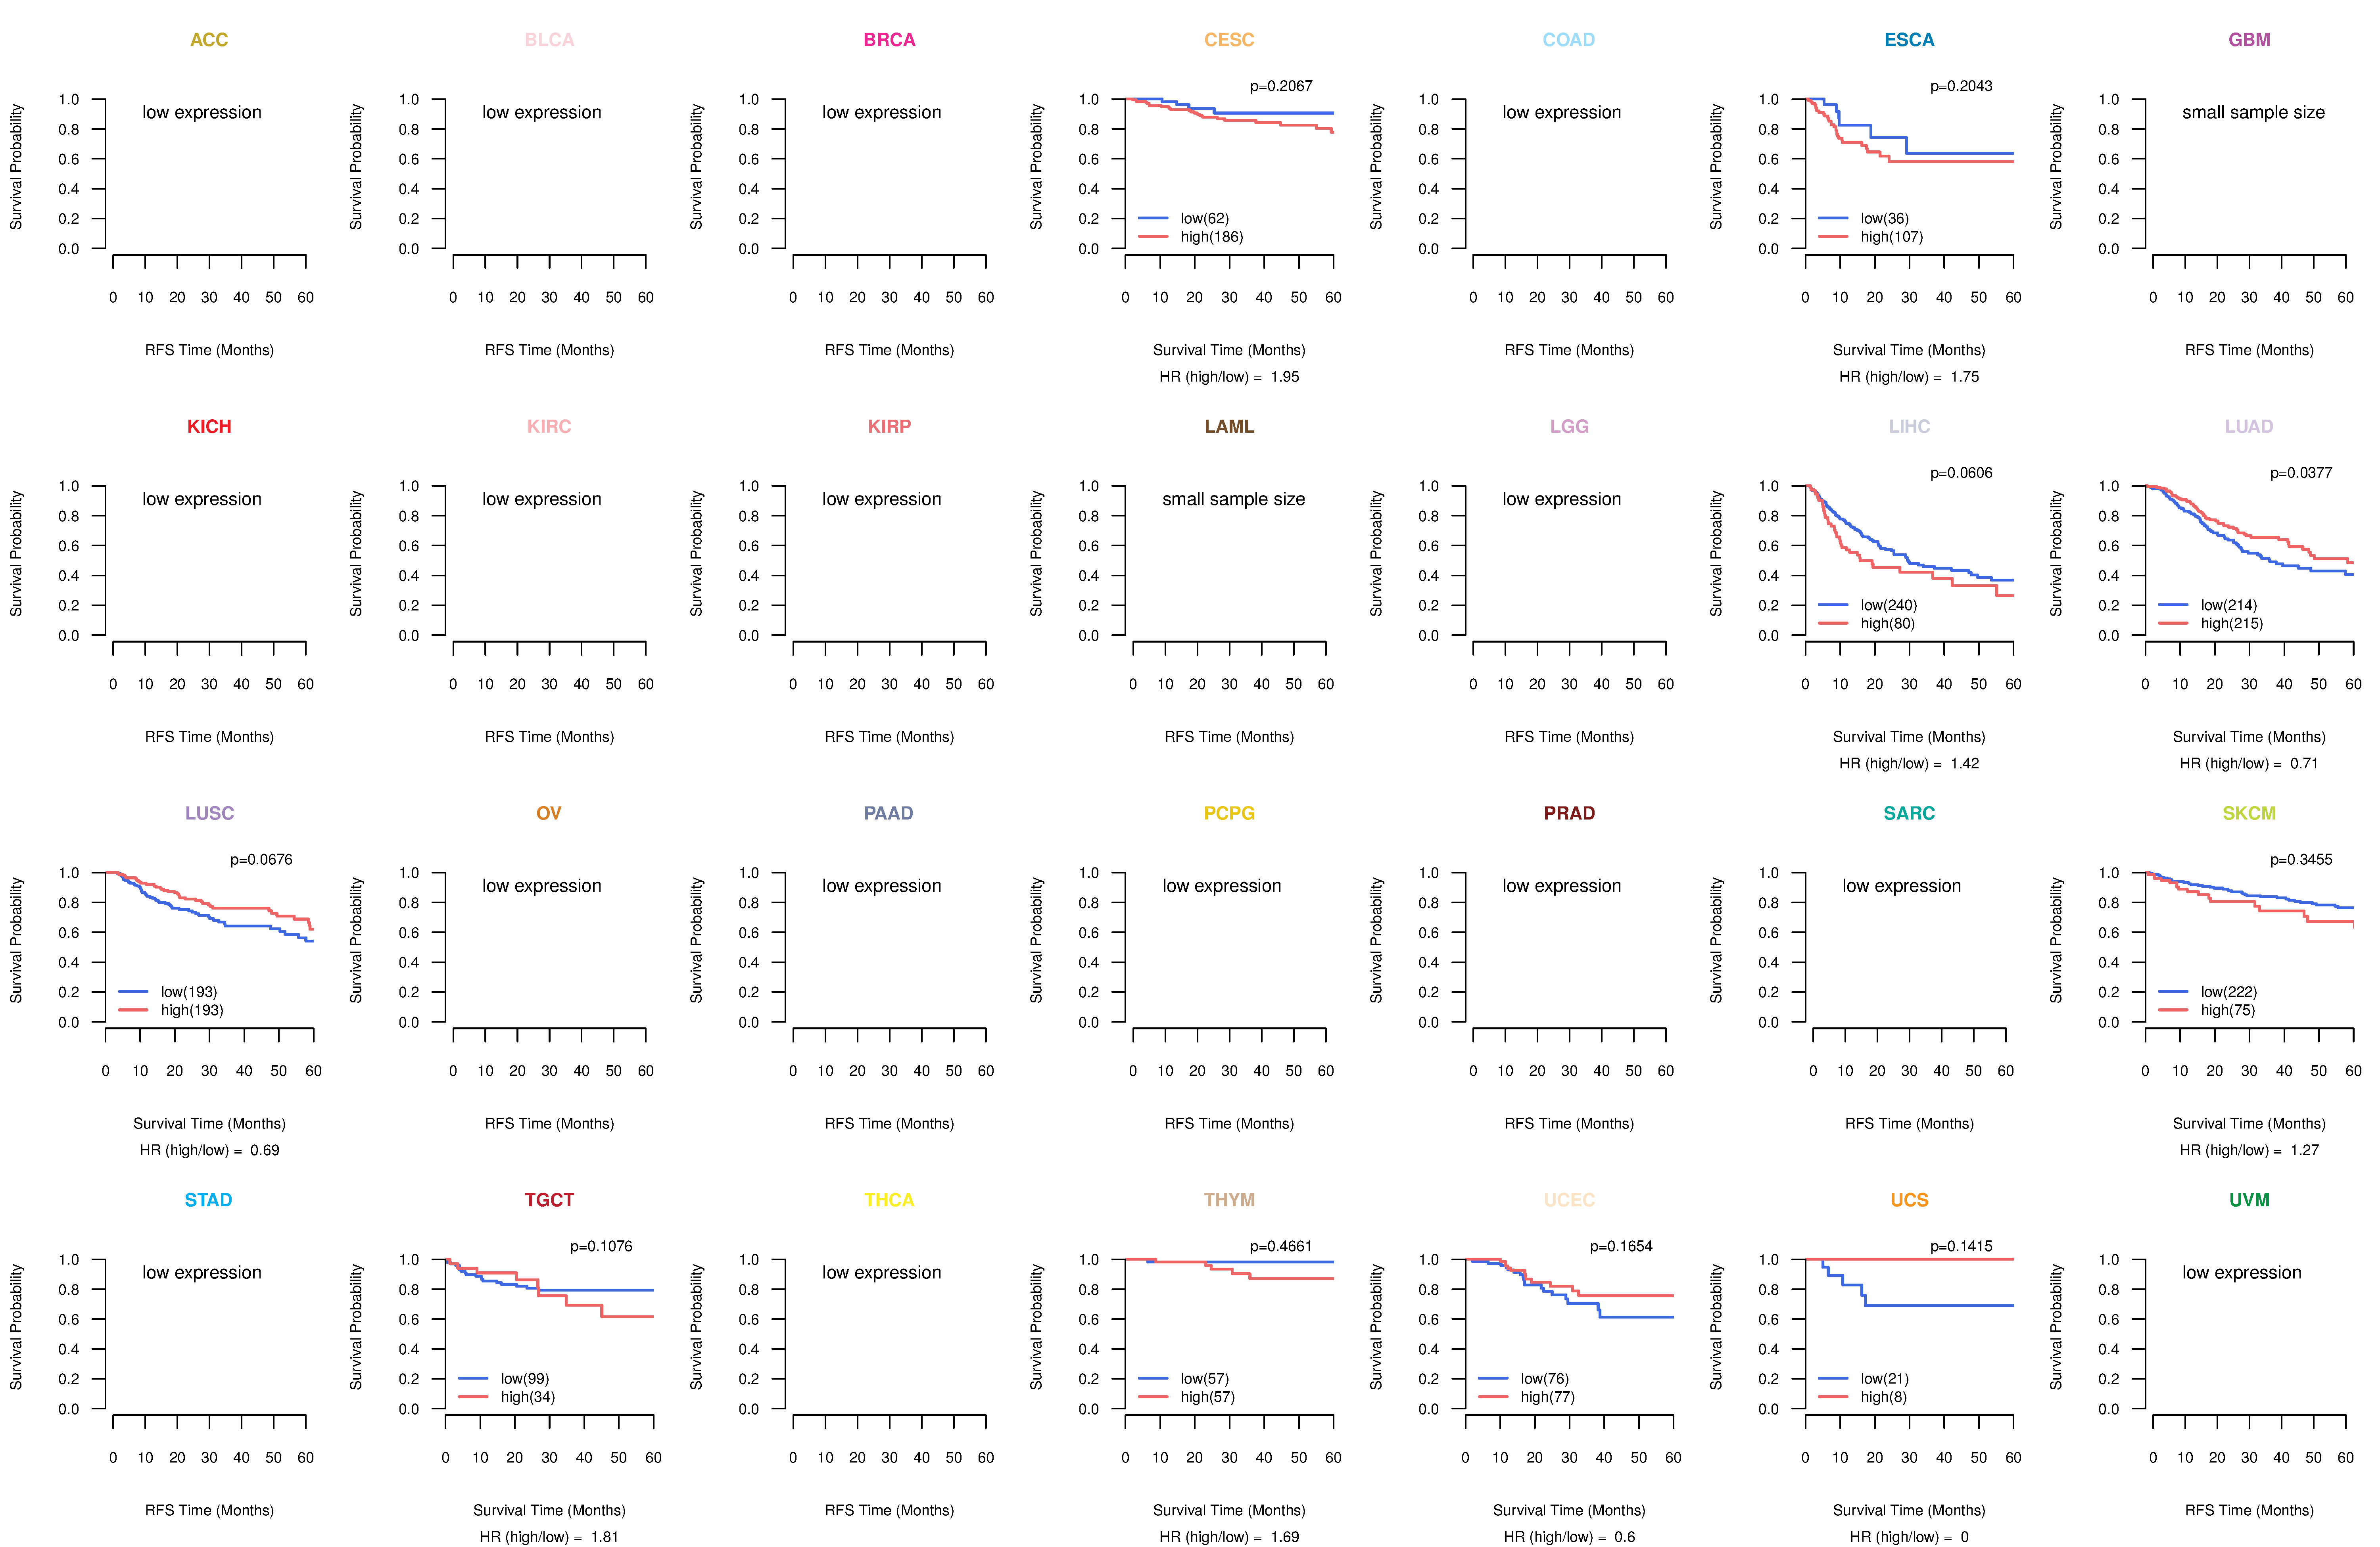
| Kaplan-Meier plots with logrank test of relapse free survival (RFS) using 28 cancer types (TCGA IlluminaHiSeq_RNASeqV2, pan-cancer normalized log2(norm_counts+1) data, version 2016-08-16) (TCGA clinicalMatrix, phenotype data, version 2016-04-27) * Click on the image enlarge it in a new window. |
 |
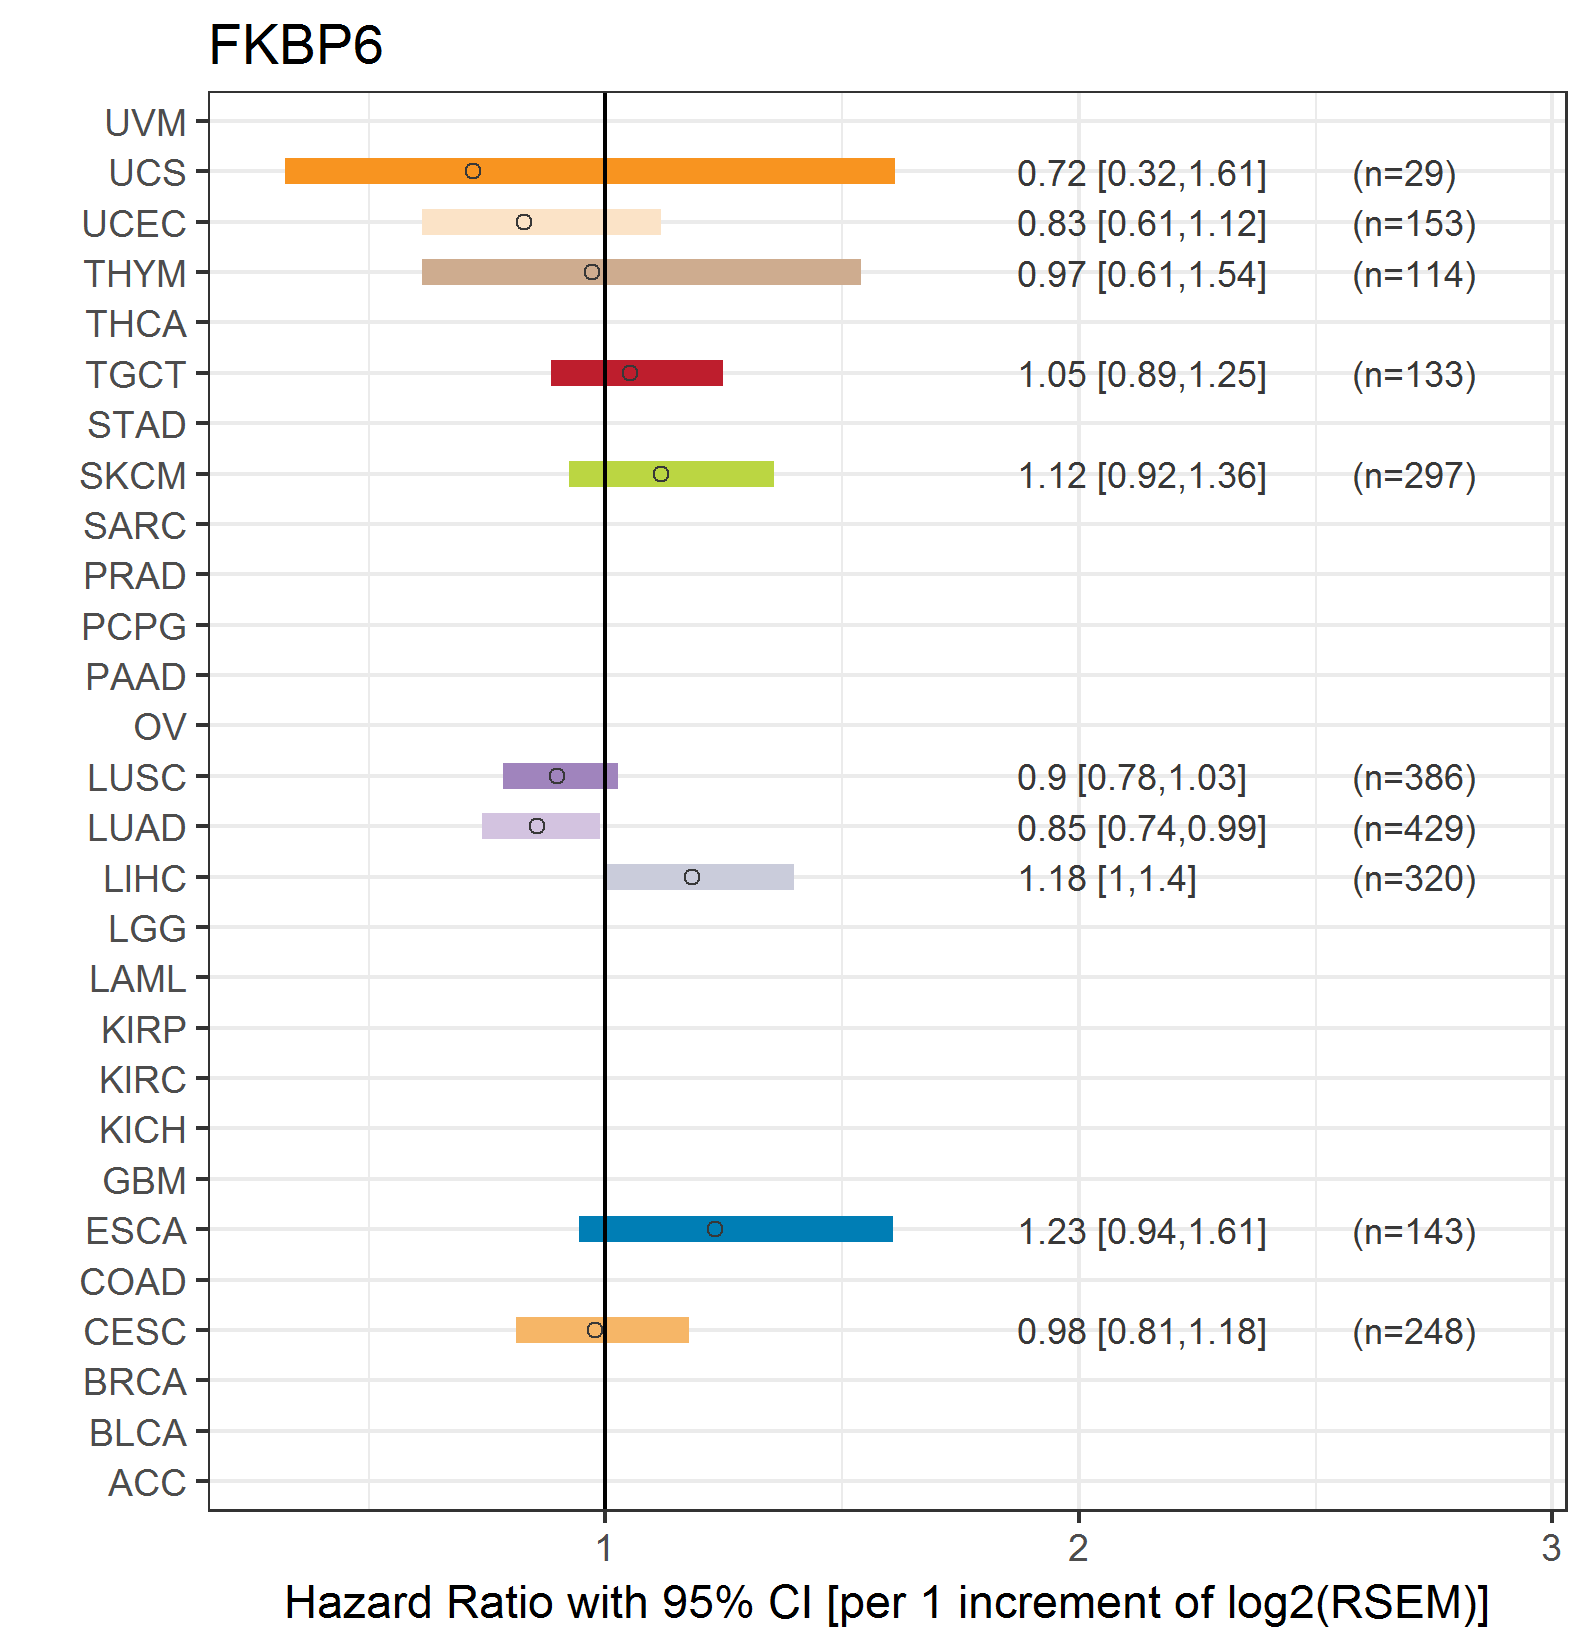
| Forest plot of Cox proportional hazard ratio (HR) and 95% CI of overall survival (OS) using 28 cancer types (TCGA IlluminaHiSeq_RNASeqV2, pan-cancer normalized log2(norm_counts+1) data, version 2016-08-16) (TCGA clinicalMatrix, phenotype data, version 2016-04-27) * Click on the image enlarge it in a new window. |
 |
| Forest plot of Cox proportional hazard ratio (HR) and 95% CI of relapse free survival (RFS) using 28 cancer types (TCGA IlluminaHiSeq_RNASeqV2, pan-cancer normalized log2(norm_counts+1) data, version 2016-08-16) (TCGA clinicalMatrix, phenotype data, version 2016-04-27) * Click on the image enlarge it in a new window. |
 |
| Top |
| TissGeneClin for FKBP6 |
| TissGeneDrug for FKBP6 |
| Drug information targeting TissGene (DrugBank Version 5.0.6, 2017-04-01) |
| DrugBank ID | Drug name | Drug activity | Drug type | Drug status |
| Top |
| TissGeneDisease for FKBP6 |
| Disease information associated with TissGene (DisGeNet, 2016-06-01) |
| Disease ID | Disease name | # pubmeds | Source |
| umls:C0004509 | Azoospermia | 5 | BeFree,GAD |
| umls:C0175702 | Williams Syndrome | 4 | BeFree |
| umls:C0021364 | Male infertility | 3 | BeFree,RGD |
| umls:C0002395 | Alzheimer's Disease | 1 | BeFree |
| umls:C0020437 | Hypercalcemia | 1 | BeFree |
| umls:C0028960 | Oligospermia | 1 | GAD |
| umls:C0374997 | Helicobacter pylori (H. pylori) infection in conditions classified elsewhere and of unspecified site | 1 | BeFree |
| umls:C0848676 | Subfertility, Male | 1 | BeFree |
| umls:C1862939 | AMYOTROPHIC LATERAL SCLEROSIS 1 | 1 | BeFree |
|
Copyright 2016-Present - The University of Texas Health Science Center at Houston (UTHealth) Web File Viewing | How to Report, Fraud, Waste and Abuse | State of Texas | Statewide Search | Texas Homeland Security | Site Policies |