 |
| |
| |
| |
| |
| |
| |
|

| TissGeneSummary for PDE8B |
 Gene summary Gene summary |
| Basic gene information | Gene symbol | PDE8B |
| Gene name | phosphodiesterase 8B | |
| Synonyms | ADSD|PPNAD3 | |
| Cytomap | UCSC genome browser: 5q13.3 | |
| Type of gene | protein-coding | |
| RefGenes | NM_001029851.2, NM_001029852.2,NM_001029853.2,NM_001029854.2,NM_003719.3, | |
| Description | 3',5' cyclic nucleotide phosphodiesterase 8Bcell proliferation-inducing gene 22 proteinhigh affinity cAMP-specific and IBMX-insensitive 3',5'-cyclic phosphodiesterase 8BhsPDE8B | |
| Modification date | 20141207 | |
| dbXrefs | MIM : 603390 | |
| HGNC : HGNC | ||
| Ensembl : ENSG00000113231 | ||
| HPRD : 04546 | ||
| Vega : OTTHUMG00000102170 | ||
| Protein | UniProt: go to UniProt's Cross Reference DB Table | |
| Expression | CleanEX: HS_PDE8B | |
| BioGPS: 8622 | ||
| Pathway | NCI Pathway Interaction Database: PDE8B | |
| KEGG: PDE8B | ||
| REACTOME: PDE8B | ||
| Pathway Commons: PDE8B | ||
| Context | iHOP: PDE8B | |
| ligand binding site mutation search in PubMed: PDE8B | ||
| UCL Cancer Institute: PDE8B | ||
| Assigned class in TissGDB* | C | |
| Included tissue-specific gene expression resources | HPA,GTEx | |
| Specific-tissues in normal samples (assigned by TissGDB using HPA, TiGER, and GTEx) | Thyroid gland | |
| Cancer types related to the specific-tissues in cancer samples (assigned by TissGDB using TCGA) | THCA | |
| Reference showing the relevant tissue of PDE8B | ||
| Description by TissGene annotations | ||
| * Class A consists of genes with literature evidence and is part of the cTissGenes. Class B consists of only cTissGenes without additional evidence. The remaining genes belong to Class C. |
| Gene ontology having evidence of Inferred from Direct Assay (IDA) from Entrez |
| GO ID | GO term | PubMed ID |
| Top |
| TissGeneExp for PDE8B |
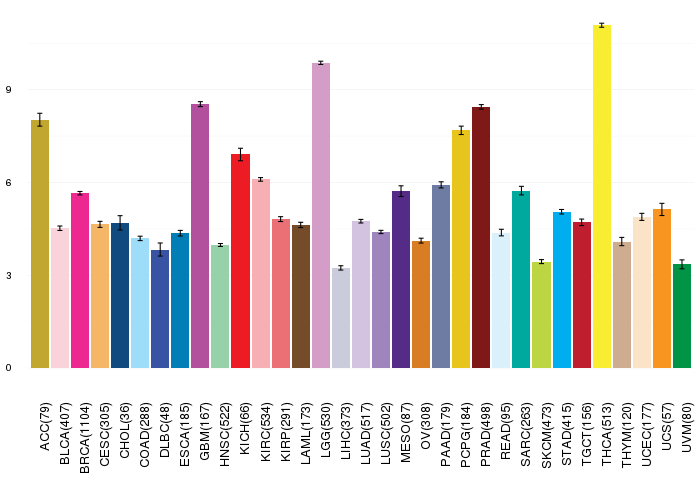
| Gene expressions across 28 cancer types (X-axis: cancer type and Y-axis: log2(norm_counts+1)) (TCGA IlluminaHiSeq_RNASeqV2, pan-cancer normalized log2(norm_counts+1) data, version 2016-08-16) |
 |
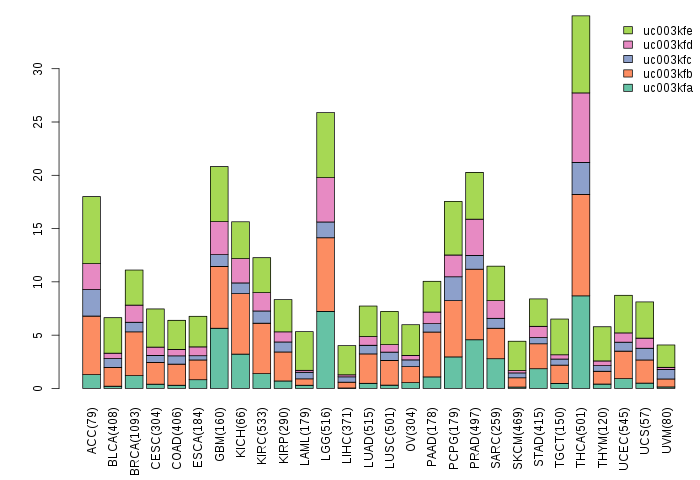
| Gene isoform expressions across 28 cancer types (X-axis: cancer type and Y-axis: log2(norm_counts+1)) (TCGA pan-cancer tcga_rsem_isoform_tpm, version 2016-09-01) |
 |
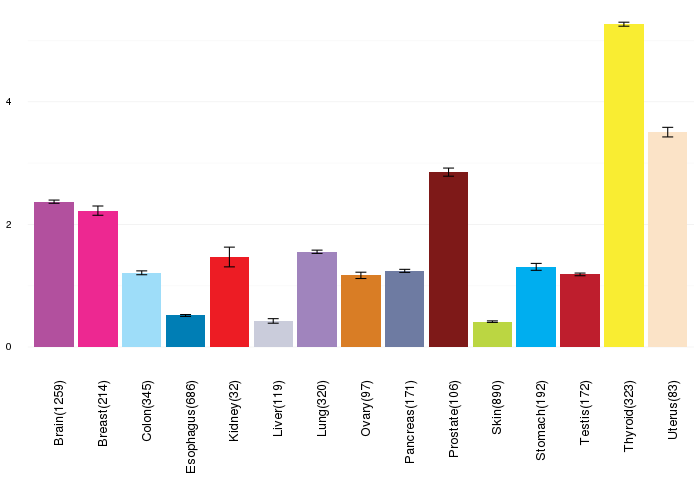
| Gene expressions across normal tissues of GTEx data (GTEx GTEx_Analysis_v6_RNA-seq_RNA-SeQCv1.1.8_gene_rpkm.gct) - Here, we shows the matched tissue types only among our 28 cancer types. |
 |
| Different expressions across 14 cancer types with more than 10 samples between matched tumors and normals (X-axis: cancer type and Y-axis: log2(norm_counts+1)) (TCGA IlluminaHiSeq_RNASeqV2, pan-cancer normalized log2(norm_counts+1) data, version 2016-08-16) |
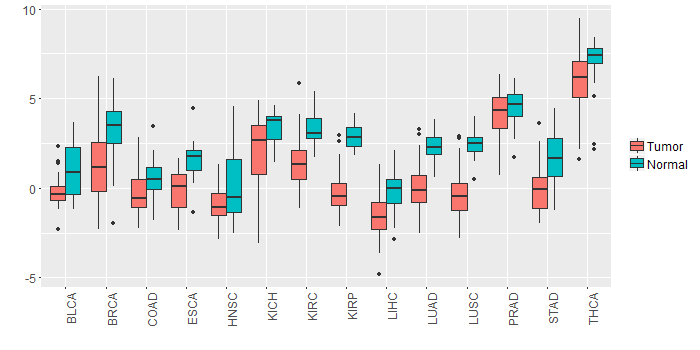 |
| - Significantly differentially expressed cancer types and information. (|Fold change|>1 and FDR<0.05) |
| Cancer type | Mean(exp) in tumor | Mean(exp) in matched normal | Log2FC | P-val. | FDR |
| LUSC | -0.369612485 | 2.463016927 | -2.832629412 | 5.09E-23 | 8.68E-22 |
| THCA | 6.063678276 | 7.198685056 | -1.13500678 | 2.51E-05 | 7.67E-05 |
| KIRC | 1.2949541 | 3.325370767 | -2.030416667 | 8.03E-21 | 6.82E-20 |
| BRCA | 1.275370693 | 3.311275957 | -2.035905263 | 9.31E-18 | 5.69E-17 |
| LUAD | 0.017354723 | 2.343751274 | -2.326396552 | 2.04E-21 | 4.92E-20 |
| LIHC | -1.540039622 | -0.189203622 | -1.350836 | 4.94E-08 | 3.74E-07 |
| KIRP | -0.154943122 | 2.824906878 | -2.97985 | 6.21E-16 | 2.08E-14 |
| KICH | 2.080800378 | 3.380348378 | -1.299548 | 0.00397 | 0.007661891 |
| HNSC | -0.871102134 | 0.239679261 | -1.110781395 | 0.00214 | 0.00655102 |
| STAD | -0.007518122 | 1.750569378 | -1.7580875 | 1.44E-05 | 0.000156452 |
| Top |
| TissGene-miRNA for PDE8B |
| Significantly anti-correlated miRNAs of TissGene across 28 cancer types (Gene-miRNA relations from TargetScanHuman Relsease 7.1, Conserved_Site_Context_Scores.txt.zip, 06.01.2016) (TCGA IlluminaHiSeq_miRNASeq, log2(RPM+1) data, version 2016-11-21) (TCGA IlluminaHiSeq_RNASeqV2, log2(normalized_count+1) data, version 2016-08-16) (Spearman’s Rank Correlation (p-value<0.05 and coefficient<-0.25)) |
| Cancer type | miRNA id | miRNA accession | P-val. | Coeff. | # samples |
| TGCT | hsa-miR-376c-3p | MIMAT0000720 | 0.0003 | -0.29 | 155 |
| Top |
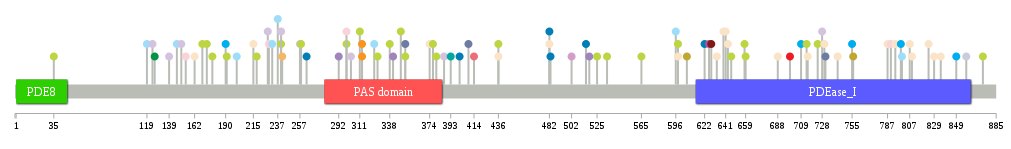
| TissGeneMut for PDE8B |
| TissGeneSNV for PDE8B |
| nsSNV counts per each loci. Different colors of circles represent different cancer types. Circle size denotes number of samples. (TCGA somatic mutation (SNPs and small INDELs) data, version 2016-04-25) * Click on the image to enlarge it in a new window. |
 |
 |
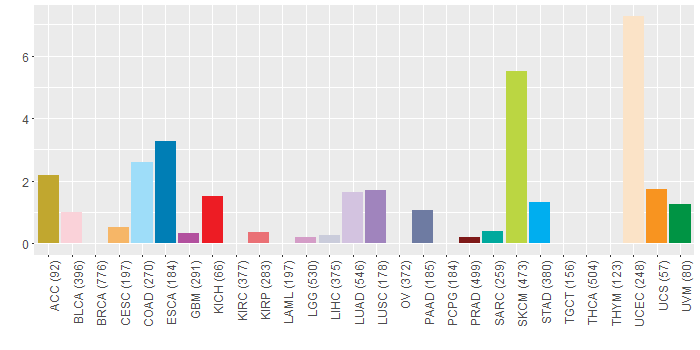
| Somatic nucleotide variants of TissGene across 28 cancer types (X-axis: cancer type and Y-axis: % of mutated samples) The numbers in parentheses are numbers of samples with mutation (nsSNVs). (TCGA somatic mutation (SNPs and small INDELs) data, version 2016-04-25) |
 |
| - nsSNVs sorted by frequency. |
| AAchange | Cancer type | # samples |
| p.R787H | READ | 1 |
| p.K525E | SKCM | 1 |
| p.S835Y | UCEC | 1 |
| p.D658N | SKCM | 1 |
| p.R237K | COAD | 1 |
| p.N669D | HNSC | 1 |
| p.W341L | LUSC | 1 |
| p.G352E | SKCM | 1 |
| p.D755N | STAD | 1 |
| p.Q292* | LUSC | 1 |
| p.R426* | HNSC | 1 |
| p.N387S | LUAD | 1 |
| p.R787H | UCEC | 1 |
| p.L169F | SKCM | 1 |
| p.T596S | COAD | 1 |
| p.A626T | GBM | 1 |
| p.L643S | UCEC | 1 |
| p.L229V | BLCA | 1 |
| p.G352R | PAAD | 1 |
| p.H659Y | SKCM | 1 |
| p.G35S | SKCM | 1 |
| p.G518R | LUSC | 1 |
| p.R324W | COAD | 1 |
| p.F374C | UCEC | 1 |
| p.R598W | SKCM | 1 |
| p.R414K | KIRP | 1 |
| p.L482* | UCEC | 1 |
| p.R436C | SKCM | 1 |
| p.D146N | COAD | 1 |
| p.L482X | ESCA | 1 |
| p.A474T | READ | 1 |
| p.D849N | STAD | 1 |
| p.G303C | LUAD | 1 |
| p.N241T | CESC | 1 |
| p.A628T | PRAD | 1 |
| p.E809K | UCEC | 1 |
| p.D873N | SKCM | 1 |
| p.R154T | BLCA | 1 |
| p.G311E | SKCM | 1 |
| p.R436C | UCEC | 1 |
| p.A201D | READ | 1 |
| p.R598W | UCEC | 1 |
| p.A162D | UCEC | 1 |
| p.L173F | SKCM | 1 |
| p.F190C | STAD | 1 |
| p.R483W | ESCA | 1 |
| p.R714Q | SKCM | 1 |
| p.L534F | SKCM | 1 |
| p.E728Q | LUAD | 1 |
| p.P228T | LUAD | 1 |
| p.R824Q | UCEC | 1 |
| p.E178K | SKCM | 1 |
| p.F263I | ESCA | 1 |
| p.W150L | LUAD | 1 |
| p.C196X | READ | 1 |
| p.R329W | READ | 1 |
| p.S401Y | ESCA | 1 |
| p.A606T | ACC | 1 |
| p.R409S | PAAD | 1 |
| p.P296S | HNSC | 1 |
| p.C756W | ACC | 1 |
| p.R515T | ESCA | 1 |
| p.D699G | KICH | 1 |
| p.L479V | HNSC | 1 |
| p.V724I | SKCM | 1 |
| p.T807P | UCEC | 1 |
| p.D641N | UCEC | 1 |
| p.I393S | SARC | 1 |
| p.D709G | STAD | 1 |
| p.I829T | UCEC | 1 |
| p.H445Q | HNSC | 1 |
| p.S742N | UCEC | 1 |
| p.K633N | UCEC | 1 |
| p.K731N | PAAD | 1 |
| p.A139S | LUAD | 1 |
| p.E119D | COAD | 1 |
| p.P124L | LUAD | 1 |
| p.E299K | SKCM | 1 |
| p.L576Q | HNSC | 1 |
| p.E258K | SKCM | 1 |
| p.S800C | COAD | 1 |
| p.S639R | UCEC | 1 |
| p.A232T | COAD | 1 |
| p.V646M | SKCM | 1 |
| p.L327F | SKCM | 1 |
| p.E240K | SKCM | 1 |
| p.T730P | UCEC | 1 |
| p.S218L | SKCM | 1 |
| p.S215L | UCEC | 1 |
| p.E299K | BLCA | 1 |
| p.I799V | STAD | 1 |
| p.M858K | LIHC | 1 |
| p.R200W | COAD | 1 |
| p.E794* | UCEC | 1 |
| p.E240K | LUAD | 1 |
| p.R126K | UVM | 1 |
| p.E313* | UCS | 1 |
| p.G338E | SKCM | 1 |
| p.E565K | SKCM | 1 |
| p.S502N | LGG | 1 |
| p.S440Y | HNSC | 1 |
| p.D641N | HNSC | 1 |
| p.T568M | READ | 1 |
| p.D622Y | ESCA | 1 |
| p.T715M | UCEC | 1 |
| p.H688Y | UCEC | 1 |
| p.E750K | HNSC | 1 |
| p.R348K | SKCM | 1 |
| p.L380P | SKCM | 1 |
| p.D191N | SKCM | 1 |
| p.L377F | SKCM | 1 |
| p.G257A | LUAD | 1 |
| p.E313X | UCS | 1 |
| p.D790N | BLCA | 1 |
| Top |
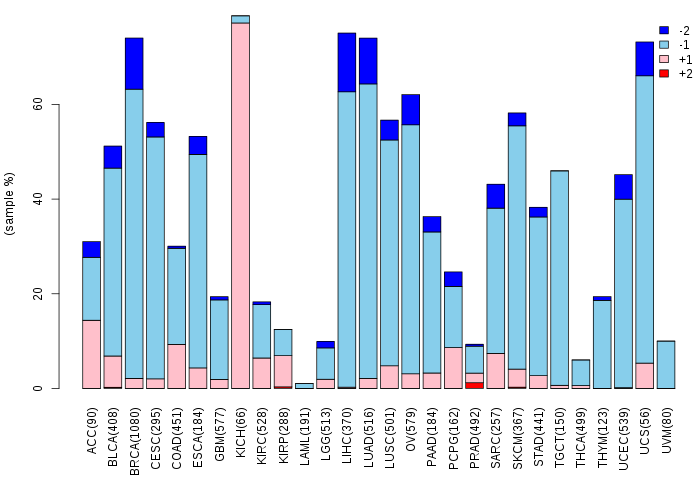
| TissGeneCNV for PDE8B |
| Copy number variations of TissGene across 28 cancer types (X-axis: cancer type and Y-axis: % of CNV samples) (TCGA Gistic2_CopyNumber_Gistic2_all_data_by_genes, Gistic2 copy number data, version 2016-08-16) |
 |
| Top |
| TissGeneFusions for PDE8B |
| Fusion genes including TissGene (ChimerDB 3.0, 2016-12-01 and TCGA fusion Portal 2015-12-01) |
| Database | Src | Cancer type | Sample | Fusion gene | ORF | 5'-gene BP | 3'-gene BP |
| Chimerdb3.0 | ChiTaRs | NA | M85313 | PDE8B-TERF2IP | chr5:76523439 | chr16:75690999 |
| Top |
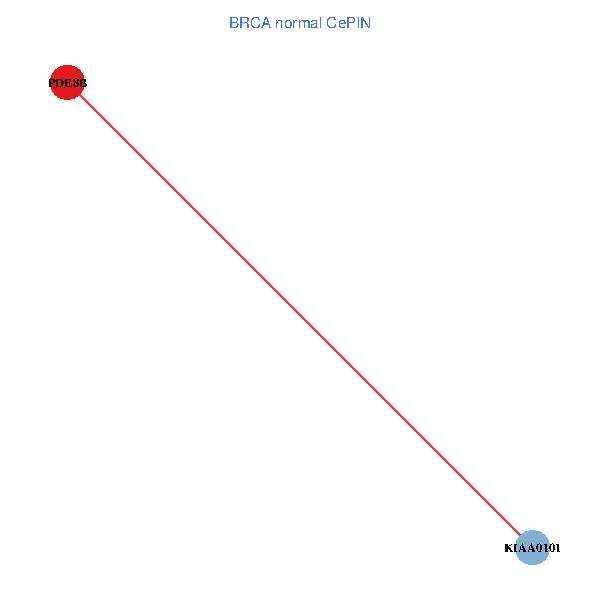
| TissGeneNet for PDE8B |
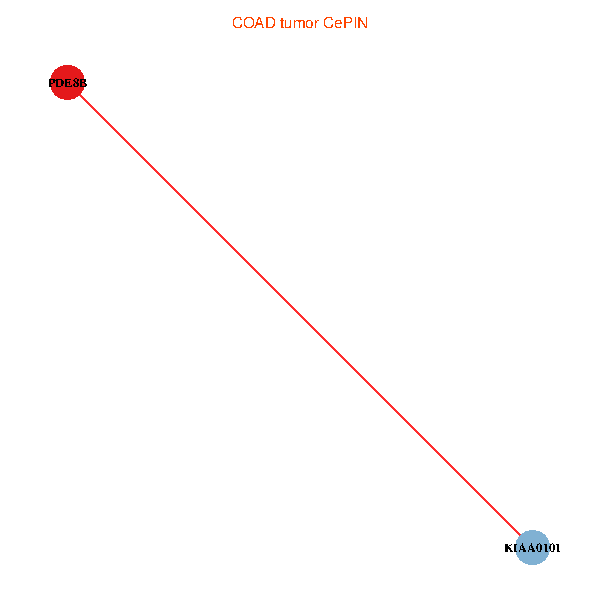
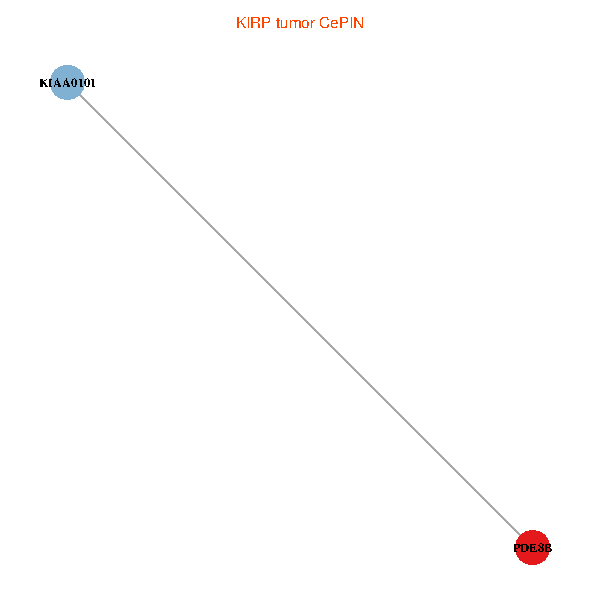
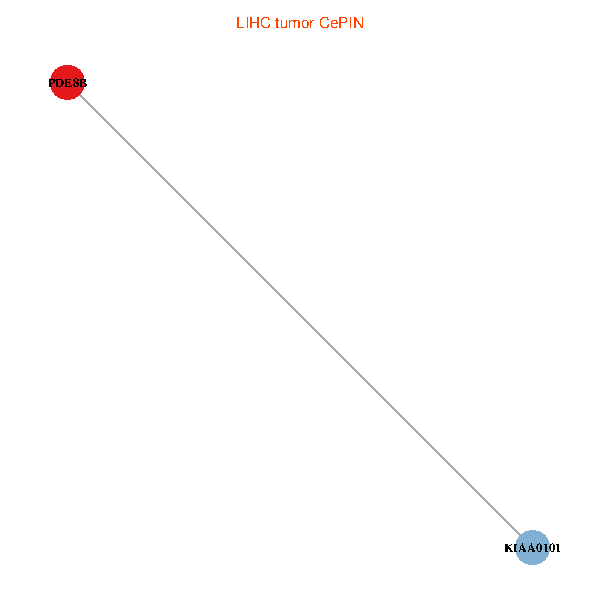
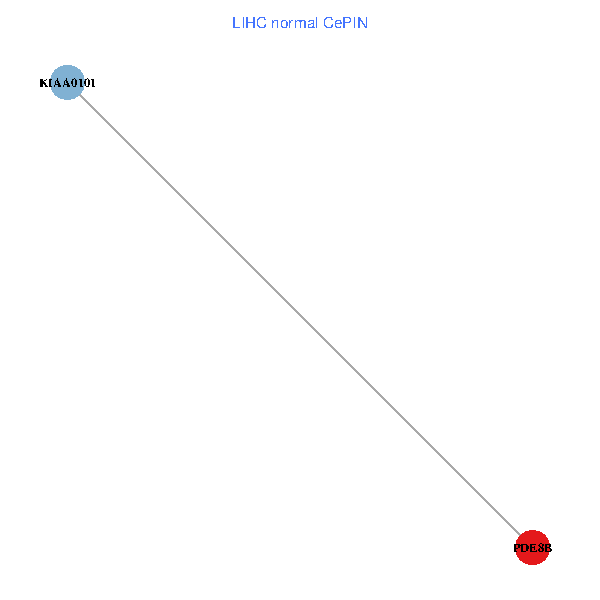
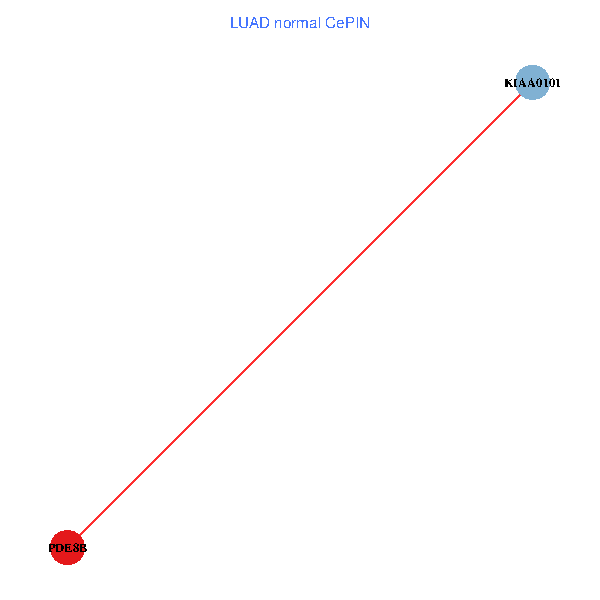
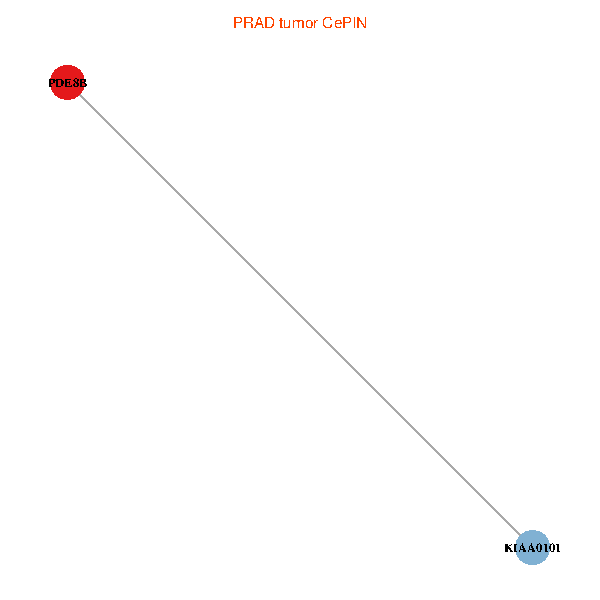
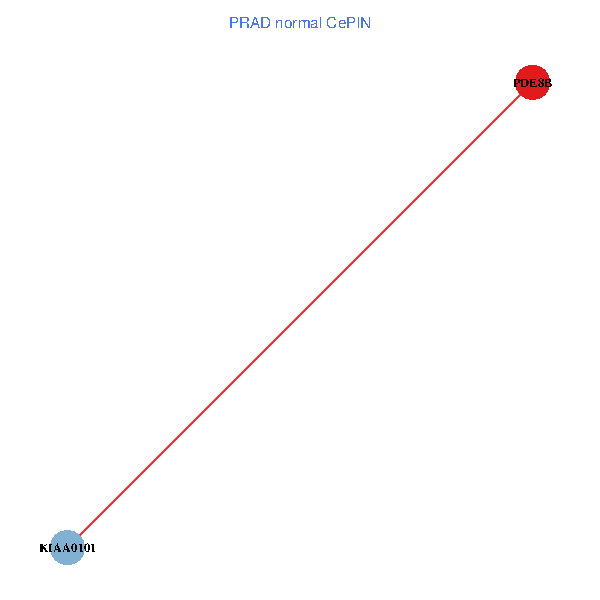
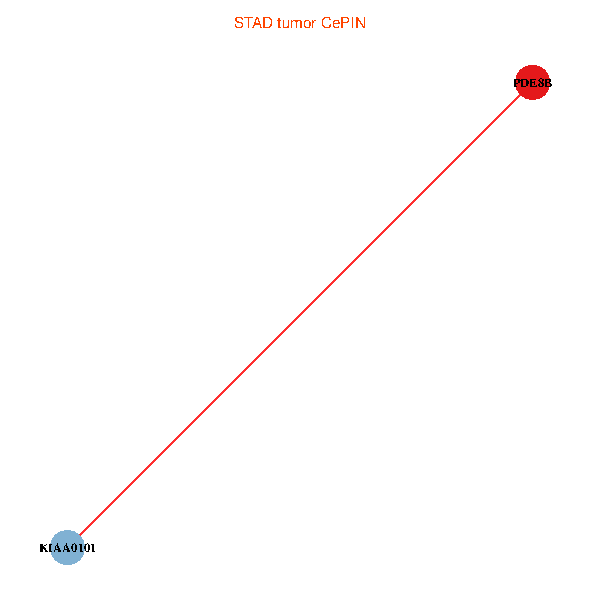
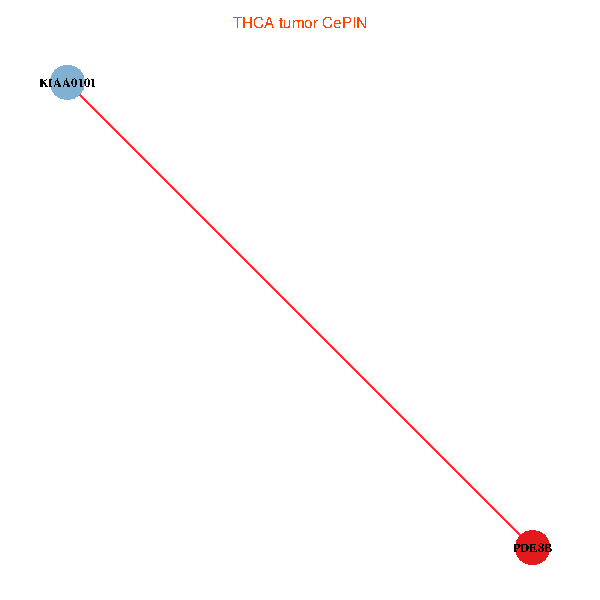
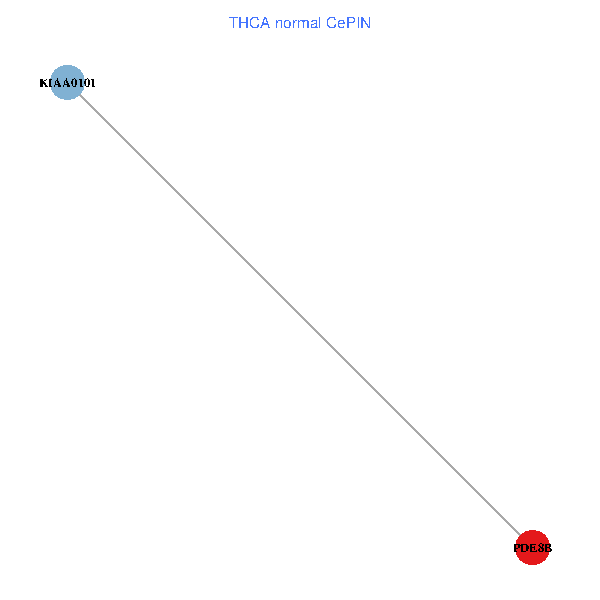
| Co-expressed gene networks based on protein-protein interaction data (CePIN) (TCGA IlluminaHiSeq_RNASeqV2, pan-cancer normalized log2(norm_counts+1) data, version 2016-08-16) (PINA2 ppi data) |
| BRCA (tumor) | BRCA (normal) |
| PDE8B, KIAA0101 (tumor) | PDE8B, KIAA0101 (normal) |
 |  |
| COAD (tumor) | COAD (normal) |
| PDE8B, KIAA0101 (tumor) | PDE8B, KIAA0101 (normal) |
 |  |
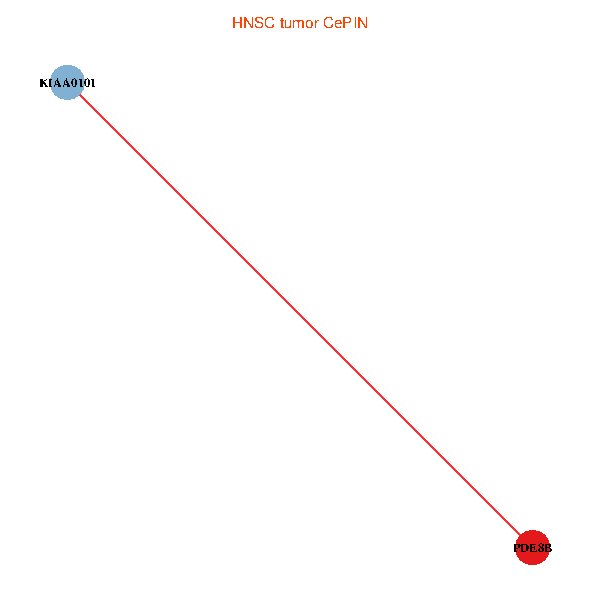
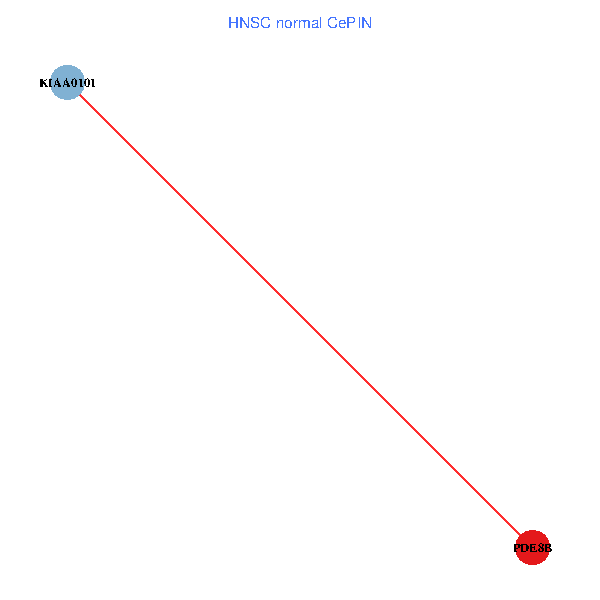
| HNSC (tumor) | HNSC (normal) |
| PDE8B, KIAA0101 (tumor) | PDE8B, KIAA0101 (normal) |
 |  |
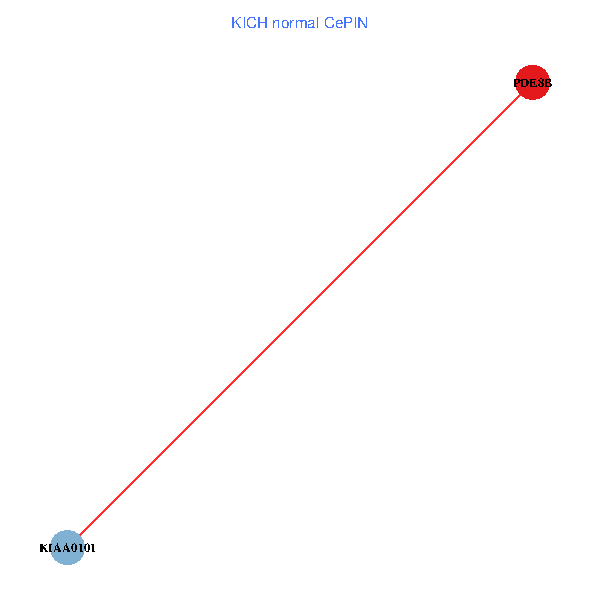
| KICH (tumor) | KICH (normal) |
| PDE8B, KIAA0101 (tumor) | PDE8B, KIAA0101 (normal) |
 |  |
| KIRC (tumor) | KIRC (normal) |
| PDE8B, KIAA0101 (tumor) | PDE8B, KIAA0101 (normal) |
 |  |
| KIRP (tumor) | KIRP (normal) |
| PDE8B, KIAA0101 (tumor) | PDE8B, KIAA0101 (normal) |
 |  |
| LIHC (tumor) | LIHC (normal) |
| PDE8B, KIAA0101 (tumor) | PDE8B, KIAA0101 (normal) |
 |  |
| LUAD (tumor) | LUAD (normal) |
| PDE8B, KIAA0101 (tumor) | PDE8B, KIAA0101 (normal) |
 |  |
| LUSC (tumor) | LUSC (normal) |
| PDE8B, KIAA0101 (tumor) | PDE8B, KIAA0101 (normal) |
 |  |
| PRAD (tumor) | PRAD (normal) |
| PDE8B, KIAA0101 (tumor) | PDE8B, KIAA0101 (normal) |
 |  |
| STAD (tumor) | STAD (normal) |
| PDE8B, KIAA0101 (tumor) | PDE8B, KIAA0101 (normal) |
 |  |
| THCA (tumor) | THCA (normal) |
| PDE8B, KIAA0101 (tumor) | PDE8B, KIAA0101 (normal) |
 |  |
| Top |
| TissGeneProg for PDE8B |
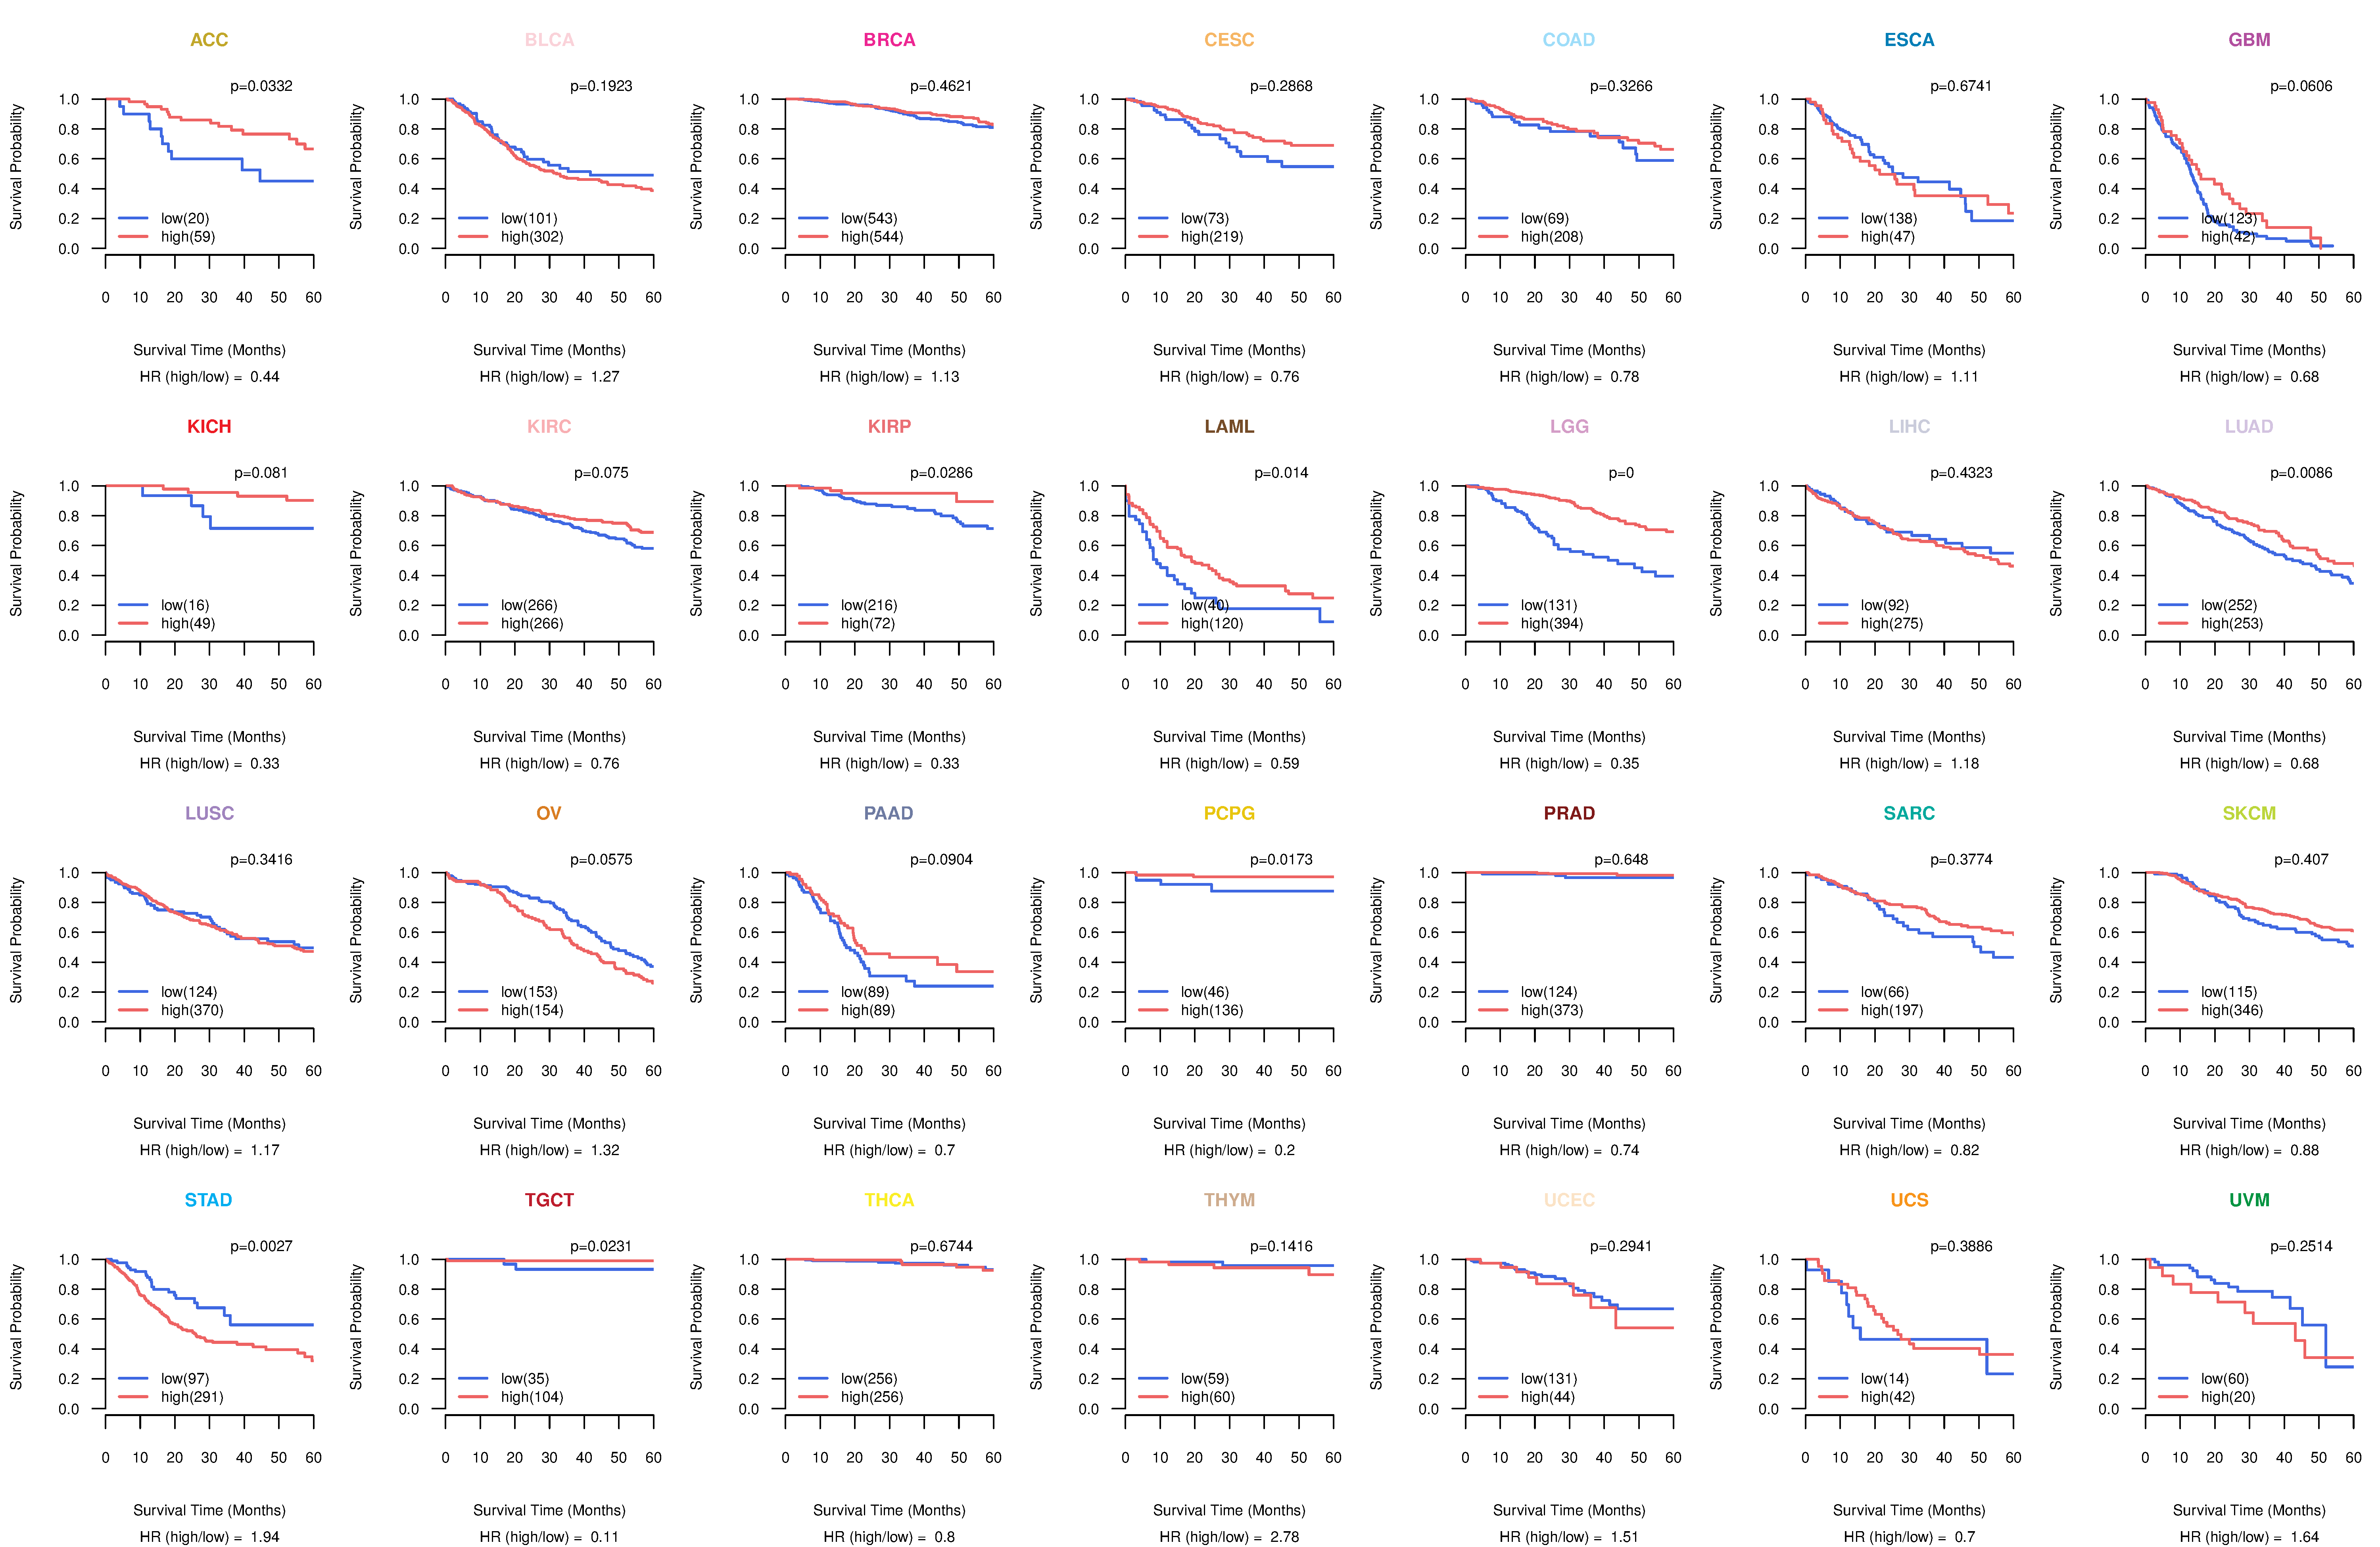
| Kaplan-Meier plots with logrank tests of overall survival (OS) using 28 cancer types (TCGA IlluminaHiSeq_RNASeqV2, pan-cancer normalized log2(norm_counts+1) data, version 2016-08-16) (TCGA clinicalMatrix, phenotype data, version 2016-04-27) * Click on the image to enlarge it in a new window. |
 |
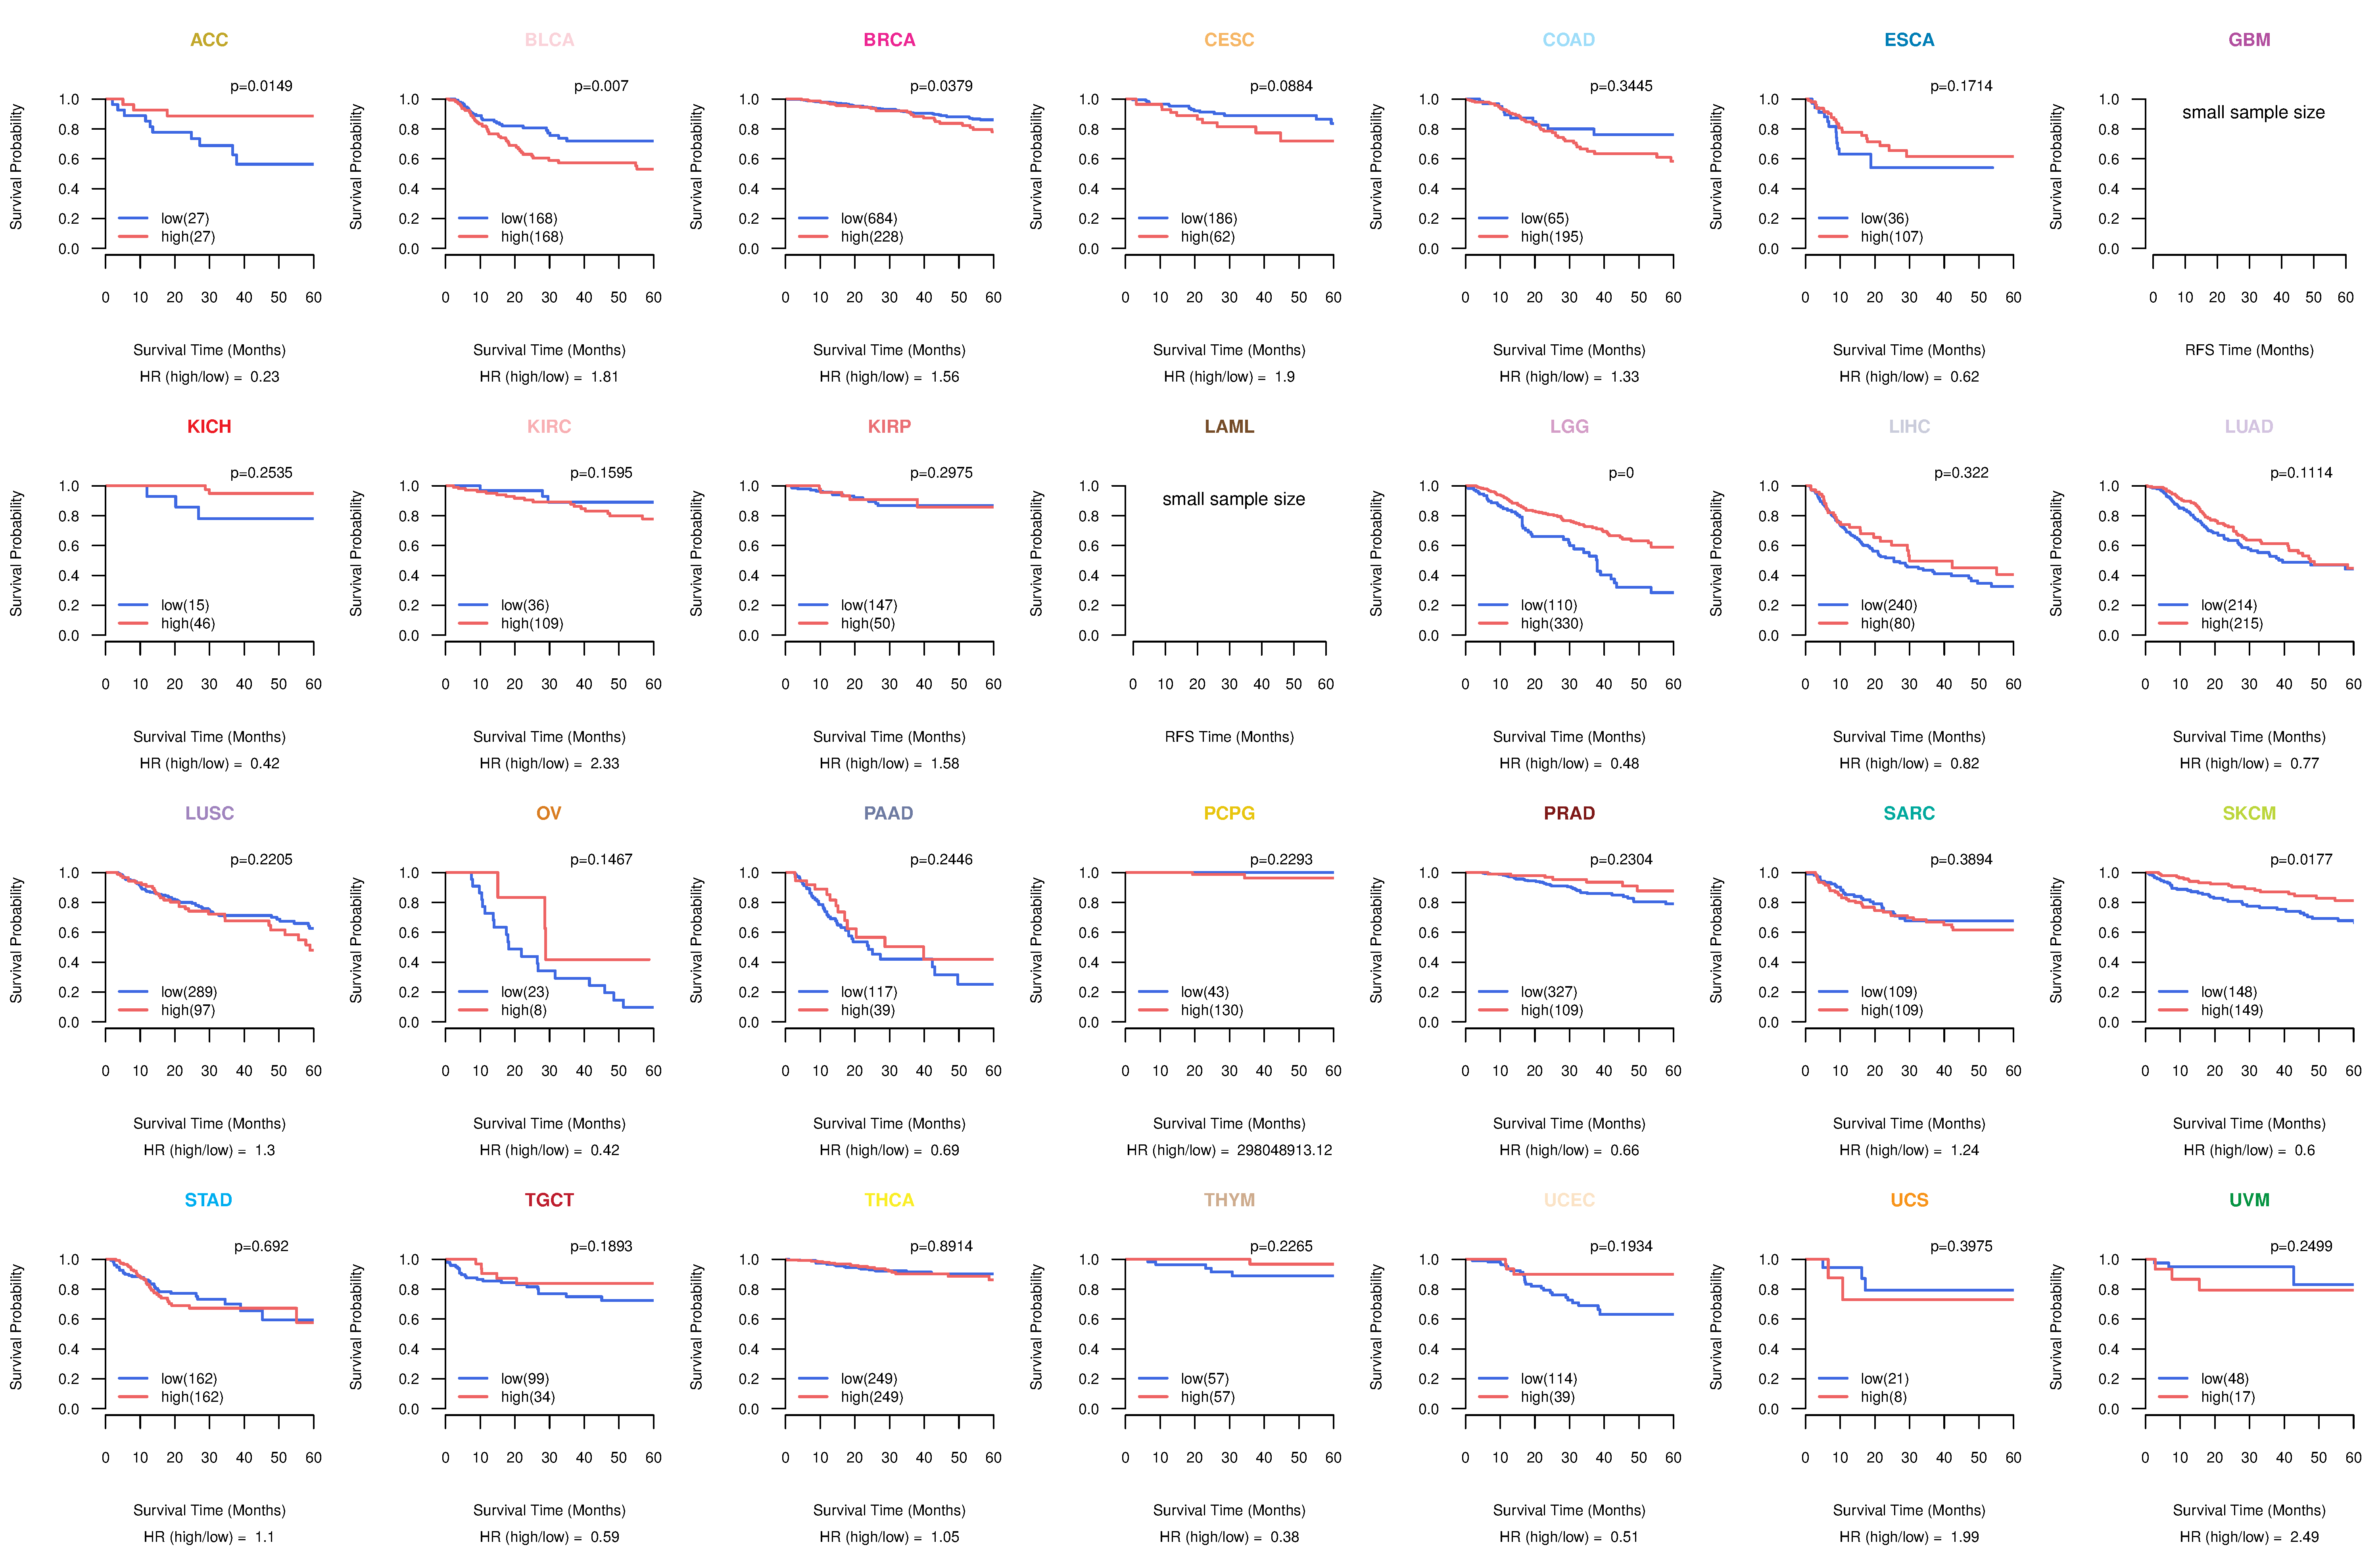
| Kaplan-Meier plots with logrank test of relapse free survival (RFS) using 28 cancer types (TCGA IlluminaHiSeq_RNASeqV2, pan-cancer normalized log2(norm_counts+1) data, version 2016-08-16) (TCGA clinicalMatrix, phenotype data, version 2016-04-27) * Click on the image enlarge it in a new window. |
 |
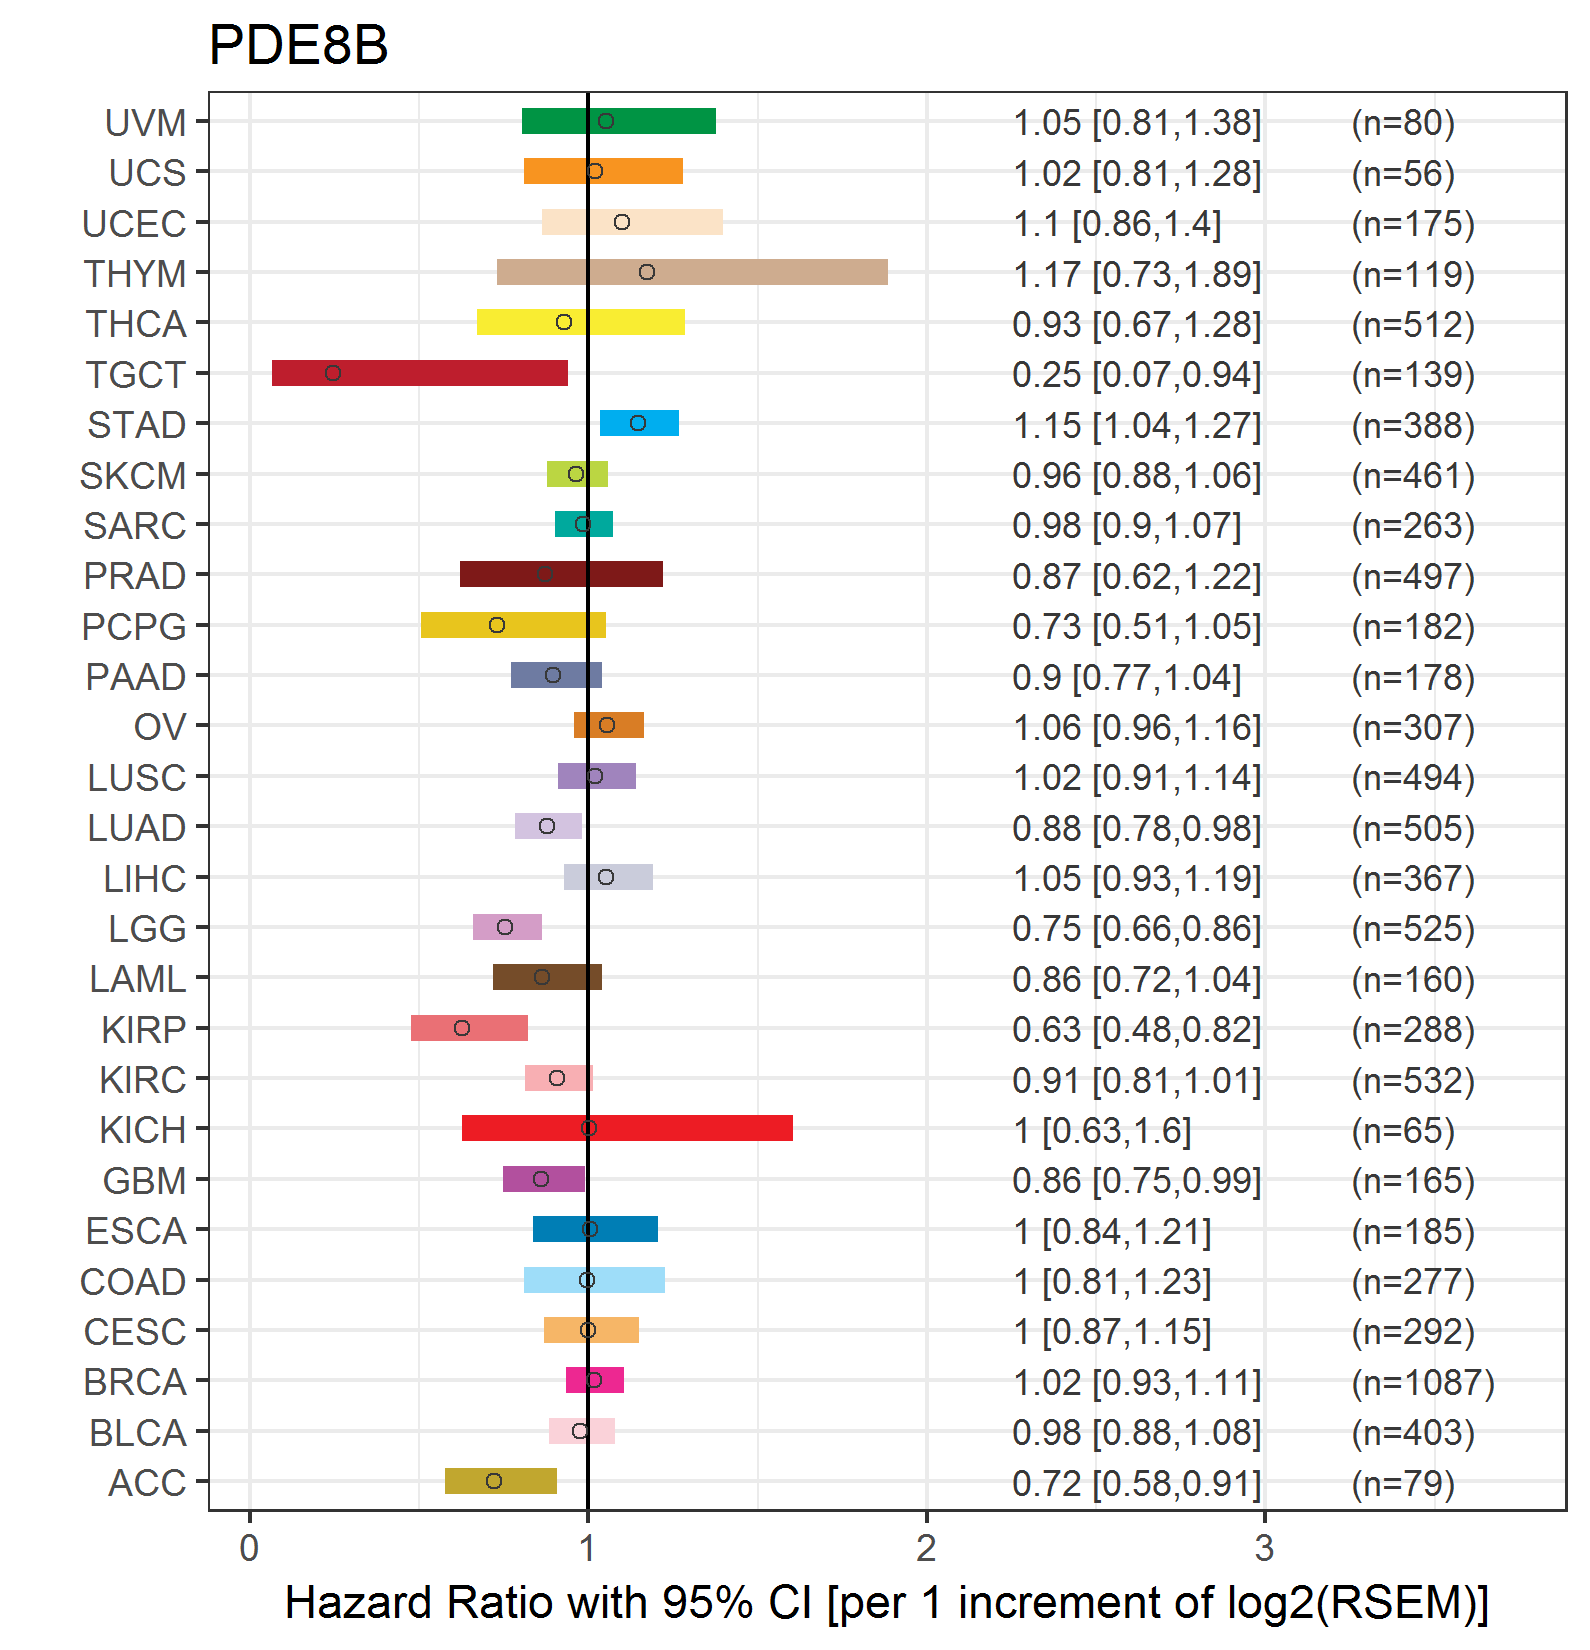
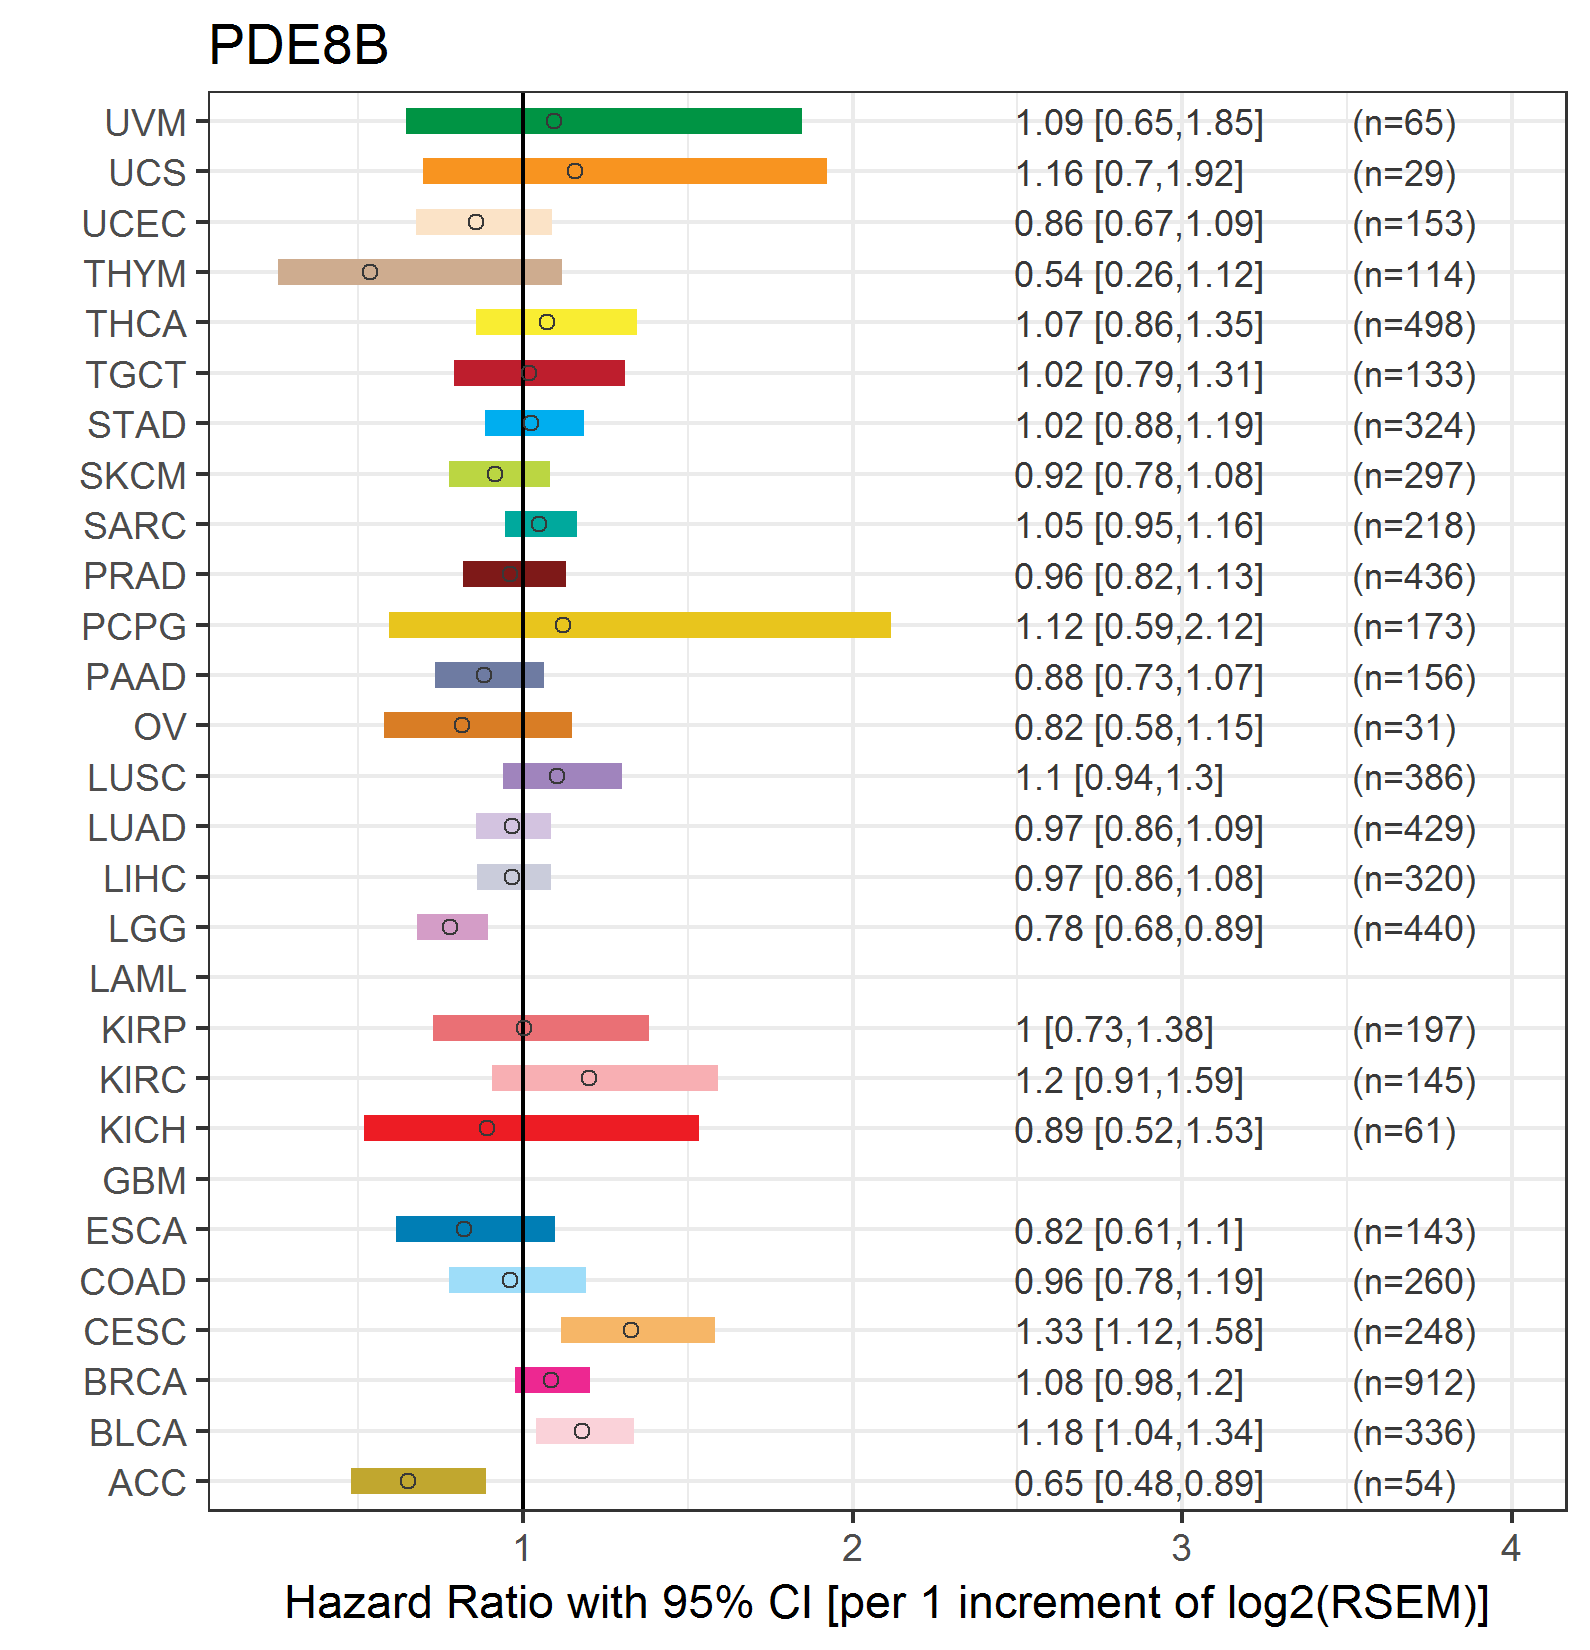
| Forest plot of Cox proportional hazard ratio (HR) and 95% CI of overall survival (OS) using 28 cancer types (TCGA IlluminaHiSeq_RNASeqV2, pan-cancer normalized log2(norm_counts+1) data, version 2016-08-16) (TCGA clinicalMatrix, phenotype data, version 2016-04-27) * Click on the image enlarge it in a new window. |
 |
| Forest plot of Cox proportional hazard ratio (HR) and 95% CI of relapse free survival (RFS) using 28 cancer types (TCGA IlluminaHiSeq_RNASeqV2, pan-cancer normalized log2(norm_counts+1) data, version 2016-08-16) (TCGA clinicalMatrix, phenotype data, version 2016-04-27) * Click on the image enlarge it in a new window. |
 |
| Top |
| TissGeneClin for PDE8B |
| TissGeneDrug for PDE8B |
| Drug information targeting TissGene (DrugBank Version 5.0.6, 2017-04-01) |
| DrugBank ID | Drug name | Drug activity | Drug type | Drug status |
| Top |
| TissGeneDisease for PDE8B |
| Disease information associated with TissGene (DisGeNet, 2016-06-01) |
| Disease ID | Disease name | # pubmeds | Source |
| umls:C0001627 | Congenital adrenal hyperplasia | 4 | BeFree,CTD_human |
| umls:C0001430 | Adenoma | 3 | BeFree,GAD |
| umls:C0010481 | Cushing Syndrome | 3 | BeFree,GAD |
| umls:C0342492 | Adrenal hypertrophy or hyperplasia | 3 | BeFree |
| umls:C1621895 | Adrenal hyperplasia | 3 | BeFree |
| umls:C0001624 | Adrenal Gland Neoplasms | 2 | BeFree |
| umls:C0020676 | Hypothyroidism | 2 | BeFree,GAD |
| umls:C0032002 | Pituitary Diseases | 2 | BeFree |
| umls:C0271790 | Subclinical hypothyroidism | 2 | BeFree |
| umls:C0001618 | Tumors of Adrenal Cortex | 1 | GAD |
| umls:C0002395 | Alzheimer's Disease | 1 | LHGDN |
| umls:C0004364 | Autoimmune Diseases | 1 | BeFree |
| umls:C0004782 | Basal Ganglia Diseases | 1 | CTD_human |
| umls:C0013362 | Dysarthria | 1 | CTD_human |
| umls:C0026650 | Movement Disorders | 1 | BeFree |
| umls:C0026837 | Muscle Rigidity | 1 | CTD_human |
| umls:C0027051 | Myocardial Infarction | 1 | BeFree |
| umls:C0028754 | Obesity | 1 | BeFree |
| umls:C0040128 | Thyroid Diseases | 1 | GAD |
| umls:C0040336 | Tobacco Use Disorder | 1 | GAD |
| umls:C0524851 | Neurodegenerative Disorders | 1 | CTD_human |
| umls:C1836694 | Striatal Degeneration, Autosomal Dominant | 1 | BeFree,CLINVAR,CTD_human,ORPHANET |
| umls:C1997262 | Hypothyroidism in pregnancy | 1 | BeFree |
| umls:C2362324 | Pediatric Obesity | 1 | BeFree |
| umls:C3280094 | PIGMENTED NODULAR ADRENOCORTICAL DISEASE, PRIMARY, 3 | 1 | CLINVAR,UNIPROT |
|
Copyright 2016-Present - The University of Texas Health Science Center at Houston (UTHealth) Web File Viewing | How to Report, Fraud, Waste and Abuse | State of Texas | Statewide Search | Texas Homeland Security | Site Policies |