 |
| |
| |
| |
| |
| |
| |
|

| TissGeneSummary for PTCH2 |
 Gene summary Gene summary |
| Basic gene information | Gene symbol | PTCH2 |
| Gene name | patched 2 | |
| Synonyms | PTC2 | |
| Cytomap | UCSC genome browser: 1p34.1 | |
| Type of gene | protein-coding | |
| RefGenes | NM_001166292.1, NM_003738.4, | |
| Description | patched homolog 2protein patched homolog 2 | |
| Modification date | 20141207 | |
| dbXrefs | MIM : 603673 | |
| HGNC : HGNC | ||
| Ensembl : ENSG00000117425 | ||
| HPRD : 04722 | ||
| Vega : OTTHUMG00000008490 | ||
| Protein | UniProt: go to UniProt's Cross Reference DB Table | |
| Expression | CleanEX: HS_PTCH2 | |
| BioGPS: 8643 | ||
| Pathway | NCI Pathway Interaction Database: PTCH2 | |
| KEGG: PTCH2 | ||
| REACTOME: PTCH2 | ||
| Pathway Commons: PTCH2 | ||
| Context | iHOP: PTCH2 | |
| ligand binding site mutation search in PubMed: PTCH2 | ||
| UCL Cancer Institute: PTCH2 | ||
| Assigned class in TissGDB* | C | |
| Included tissue-specific gene expression resources | TiGER,GTEx | |
| Specific-tissues in normal samples (assigned by TissGDB using HPA, TiGER, and GTEx) | Testis | |
| Cancer types related to the specific-tissues in cancer samples (assigned by TissGDB using TCGA) | TGCT | |
| Reference showing the relevant tissue of PTCH2 | ||
| Description by TissGene annotations | Cancer gene | |
| * Class A consists of genes with literature evidence and is part of the cTissGenes. Class B consists of only cTissGenes without additional evidence. The remaining genes belong to Class C. |
| Gene ontology having evidence of Inferred from Direct Assay (IDA) from Entrez |
| GO ID | GO term | PubMed ID |
| Top |
| TissGeneExp for PTCH2 |
| Gene expressions across 28 cancer types (X-axis: cancer type and Y-axis: log2(norm_counts+1)) (TCGA IlluminaHiSeq_RNASeqV2, pan-cancer normalized log2(norm_counts+1) data, version 2016-08-16) |
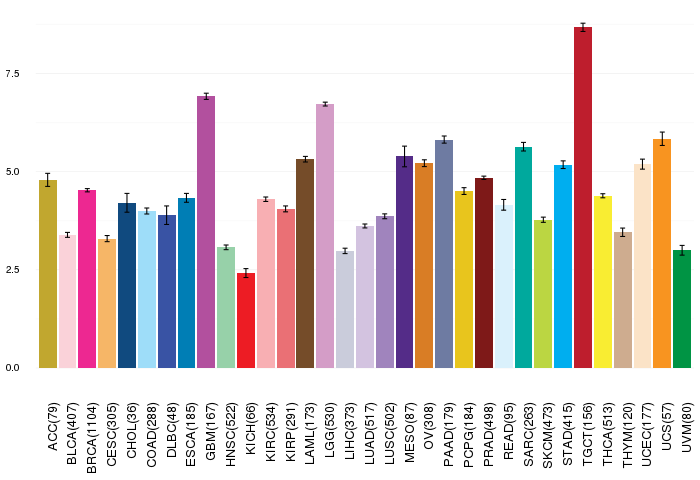 |
| Gene isoform expressions across 28 cancer types (X-axis: cancer type and Y-axis: log2(norm_counts+1)) (TCGA pan-cancer tcga_rsem_isoform_tpm, version 2016-09-01) |
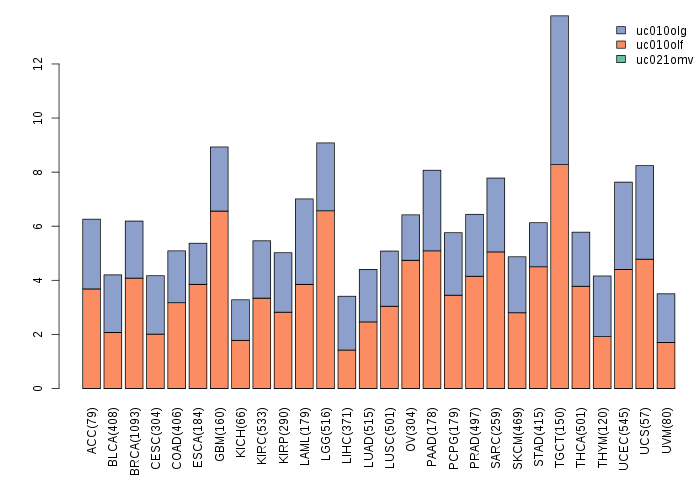 |
| Gene expressions across normal tissues of GTEx data (GTEx GTEx_Analysis_v6_RNA-seq_RNA-SeQCv1.1.8_gene_rpkm.gct) - Here, we shows the matched tissue types only among our 28 cancer types. |
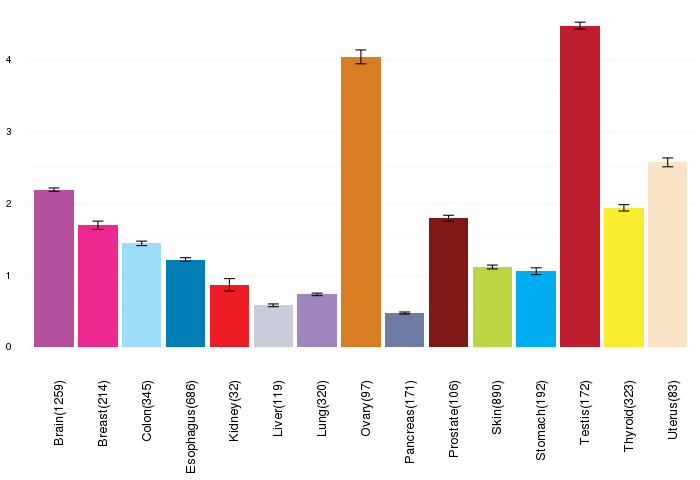 |
| Different expressions across 14 cancer types with more than 10 samples between matched tumors and normals (X-axis: cancer type and Y-axis: log2(norm_counts+1)) (TCGA IlluminaHiSeq_RNASeqV2, pan-cancer normalized log2(norm_counts+1) data, version 2016-08-16) |
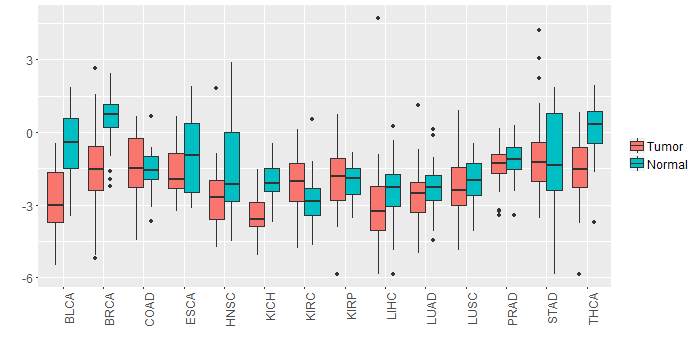 |
| - Significantly differentially expressed cancer types and information. (|Fold change|>1 and FDR<0.05) |
| Cancer type | Mean(exp) in tumor | Mean(exp) in matched normal | Log2FC | P-val. | FDR |
| BRCA | -1.468515452 | 0.621304723 | -2.089820175 | 5.07E-32 | 7.47E-31 |
| KICH | -3.443143733 | -1.985155733 | -1.457988 | 1.47E-07 | 6.56E-07 |
| THCA | -1.587737903 | 0.163102775 | -1.750840678 | 1.02E-13 | 1.06E-12 |
| HNSC | -2.747444012 | -1.59333471 | -1.154109302 | 0.00127 | 0.004165452 |
| BLCA | -2.792490891 | -0.549917207 | -2.242573684 | 4.47E-05 | 0.000590014 |
| Top |
| TissGene-miRNA for PTCH2 |
| Significantly anti-correlated miRNAs of TissGene across 28 cancer types (Gene-miRNA relations from TargetScanHuman Relsease 7.1, Conserved_Site_Context_Scores.txt.zip, 06.01.2016) (TCGA IlluminaHiSeq_miRNASeq, log2(RPM+1) data, version 2016-11-21) (TCGA IlluminaHiSeq_RNASeqV2, log2(normalized_count+1) data, version 2016-08-16) (Spearman’s Rank Correlation (p-value<0.05 and coefficient<-0.25)) |
| Cancer type | miRNA id | miRNA accession | P-val. | Coeff. | # samples |
| Top |
| TissGeneMut for PTCH2 |
| TissGeneSNV for PTCH2 |
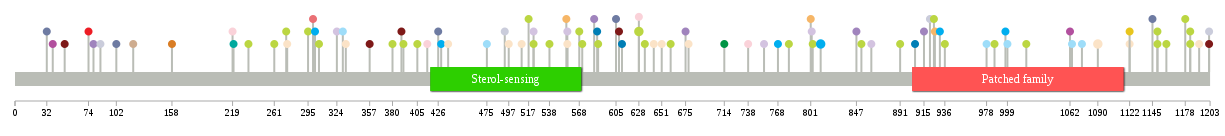
| nsSNV counts per each loci. Different colors of circles represent different cancer types. Circle size denotes number of samples. (TCGA somatic mutation (SNPs and small INDELs) data, version 2016-04-25) * Click on the image to enlarge it in a new window. |
 |
 |
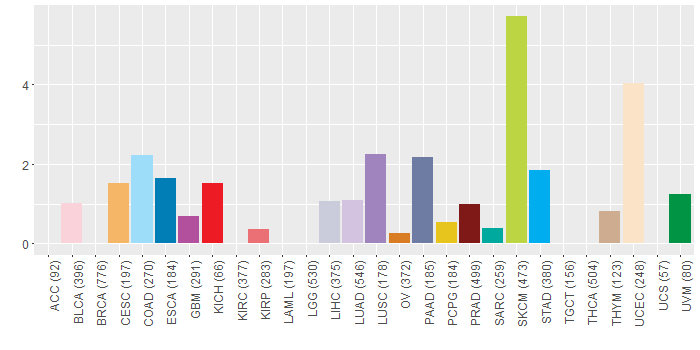
| Somatic nucleotide variants of TissGene across 28 cancer types (X-axis: cancer type and Y-axis: % of mutated samples) The numbers in parentheses are numbers of samples with mutation (nsSNVs). (TCGA somatic mutation (SNPs and small INDELs) data, version 2016-04-25) |
 |
| - nsSNVs sorted by frequency. |
| AAchange | Cancer type | # samples |
| p.A1090V | UCEC | 2 |
| p.R811H | STAD | 2 |
| p.S628F | SKCM | 2 |
| p.V471I | READ | 2 |
| p.R415Q | BLCA | 1 |
| p.V862L | LUAD | 1 |
| p.R357Q | PRAD | 1 |
| p.Q1122H | UCEC | 1 |
| p.G429R | STAD | 1 |
| p.P273L | SKCM | 1 |
| p.D586E | ESCA | 1 |
| p.S660F | SKCM | 1 |
| p.P852S | SKCM | 1 |
| p.A926V | CESC | 1 |
| p.M510L | UCEC | 1 |
| p.S324I | LUAD | 1 |
| p.R235W | SKCM | 1 |
| p.A801T | CESC | 1 |
| p.V978I | COAD | 1 |
| p.T714M | UVM | 1 |
| p.R847T | LUSC | 1 |
| p.S1159F | SKCM | 1 |
| p.A119E | THYM | 1 |
| p.T538I | SKCM | 1 |
| p.E738* | BLCA | 1 |
| p.R643Q | UCEC | 1 |
| p.Q220H | SARC | 1 |
| p.E295K | SKCM | 1 |
| p.R208H | HNSC | 1 |
| p.S391F | SKCM | 1 |
| p.P1061S | HNSC | 1 |
| p.P306L | SKCM | 1 |
| p.E493G | LIHC | 1 |
| p.V1105M | HNSC | 1 |
| p.P986L | SKCM | 1 |
| p.E583K | LUSC | 1 |
| p.L1074F | COAD | 1 |
| p.R555W | CESC | 1 |
| p.R732S | HNSC | 1 |
| p.E925K | SKCM | 1 |
| p.A389V | PRAD | 1 |
| p.R754S | LUAD | 1 |
| p.P522L | LUAD | 1 |
| p.G803E | SKCM | 1 |
| p.A755T | HNSC | 1 |
| p.S380F | SKCM | 1 |
| p.R556W | LUAD | 1 |
| p.E219K | BLCA | 1 |
| p.R333W | UCEC | 1 |
| p.E79D | LUSC | 1 |
| p.E314Q | HNSC | 1 |
| p.N1192H | UCEC | 1 |
| p.A997V | STAD | 1 |
| p.A768V | STAD | 1 |
| p.E651D | UCEC | 1 |
| p.K158* | OV | 1 |
| p.E330K | COAD | 1 |
| p.R931W | STAD | 1 |
| p.A38G | GBM | 1 |
| p.Q675* | LUSC | 1 |
| p.R497C | UCEC | 1 |
| p.G426D | PAAD | 1 |
| p.G587R | SKCM | 1 |
| p.R779C | SKCM | 1 |
| p.M302I | STAD | 1 |
| p.Q1122* | PCPG | 1 |
| p.P1150S | SKCM | 1 |
| p.M491I | DLBC | 1 |
| p.S628F | BLCA | 1 |
| p.A1145T | PAAD | 1 |
| p.S802T | LUAD | 1 |
| p.G499R | HNSC | 1 |
| p.P261Q | SKCM | 1 |
| p.A32V | PAAD | 1 |
| p.E634K | SKCM | 1 |
| p.A517V | SKCM | 1 |
| p.P678L | UCEC | 1 |
| p.A608V | PRAD | 1 |
| p.Q611K | ESCA | 1 |
| p.G50R | PRAD | 1 |
| p.E936K | SKCM | 1 |
| p.T1202A | LIHC | 1 |
| p.D891N | SKCM | 1 |
| p.T1202I | PRAD | 1 |
| p.M405I | SKCM | 1 |
| p.A436V | HNSC | 1 |
| p.P1018S | SKCM | 1 |
| p.V1062M | GBM | 1 |
| p.P522L | SKCM | 1 |
| p.R915C | LUSC | 1 |
| p.W86R | LIHC | 1 |
| p.W1183* | SKCM | 1 |
| p.G300E | KIRP | 1 |
| p.P1178S | SKCM | 1 |
| p.F568L | SKCM | 1 |
| p.H605Q | PAAD | 1 |
| p.A921T | LIHC | 1 |
| p.D1064N | COAD | 1 |
| p.N274S | UCEC | 1 |
| p.E906Q | ESCA | 1 |
| p.W1183X | SKCM | 1 |
| p.A475V | COAD | 1 |
| p.M999T | COAD | 1 |
| p.P1150L | SKCM | 1 |
| p.E102K | PAAD | 1 |
| p.P571S | SKCM | 1 |
| p.A436V | UCEC | 1 |
| p.R74H | KICH | 1 |
| p.R556W | UCEC | 1 |
| Top |
| TissGeneCNV for PTCH2 |
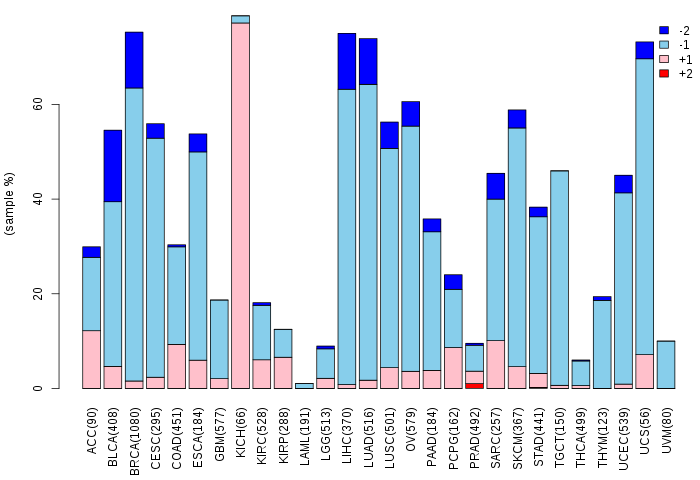
| Copy number variations of TissGene across 28 cancer types (X-axis: cancer type and Y-axis: % of CNV samples) (TCGA Gistic2_CopyNumber_Gistic2_all_data_by_genes, Gistic2 copy number data, version 2016-08-16) |
 |
| Top |
| TissGeneFusions for PTCH2 |
| Fusion genes including TissGene (ChimerDB 3.0, 2016-12-01 and TCGA fusion Portal 2015-12-01) |
| Database | Src | Cancer type | Sample | Fusion gene | ORF | 5'-gene BP | 3'-gene BP |
| Top |
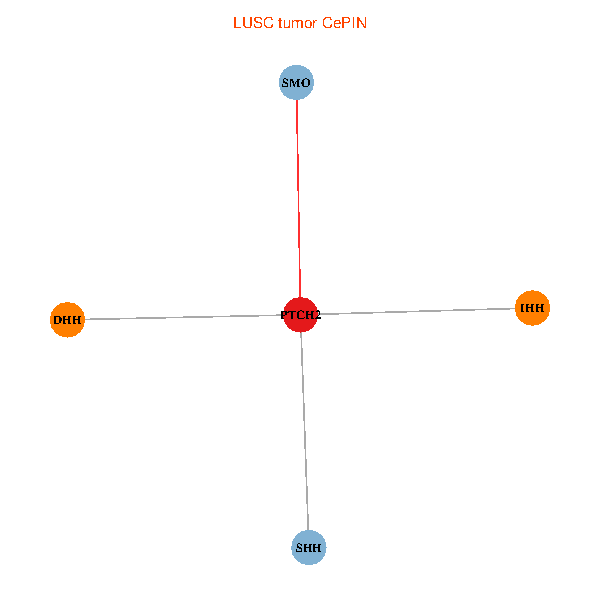
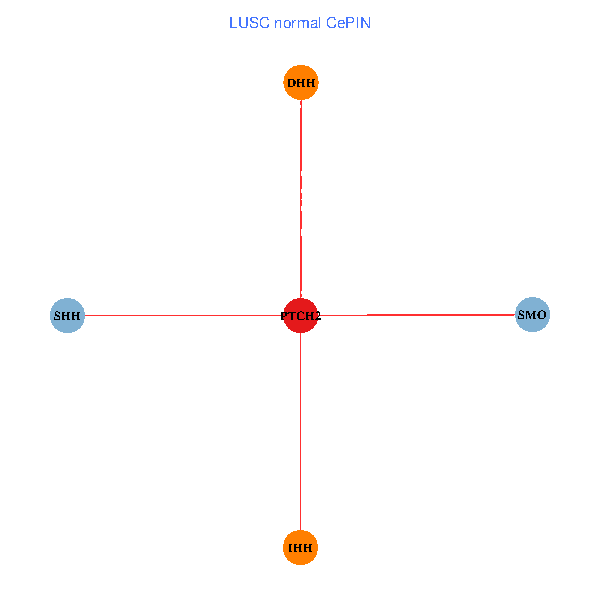
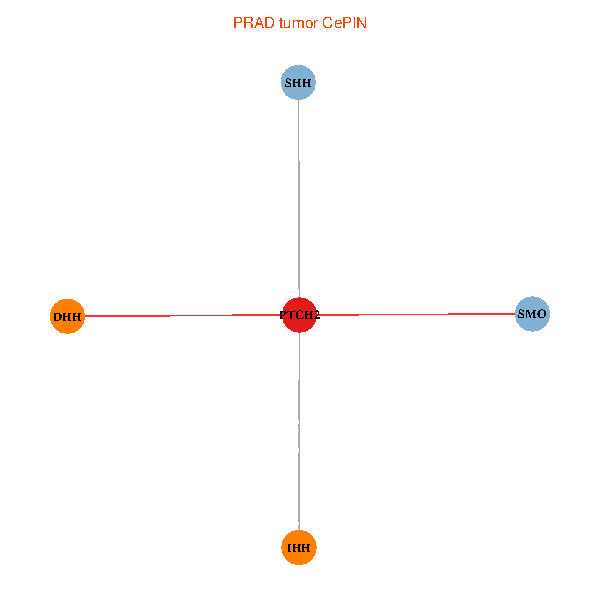
| TissGeneNet for PTCH2 |
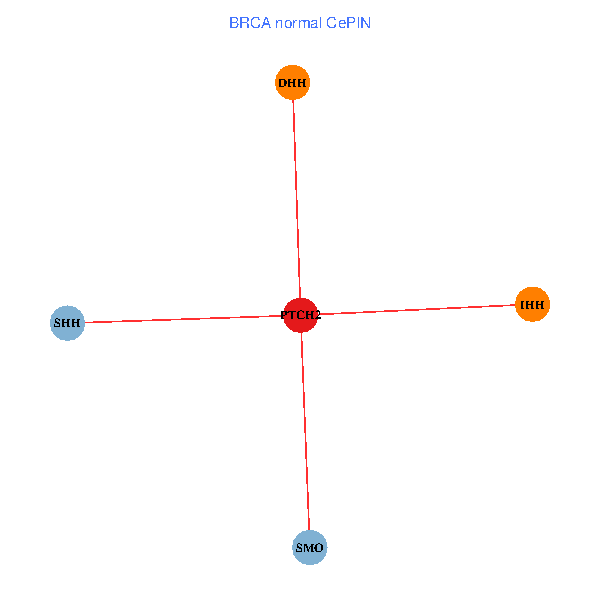
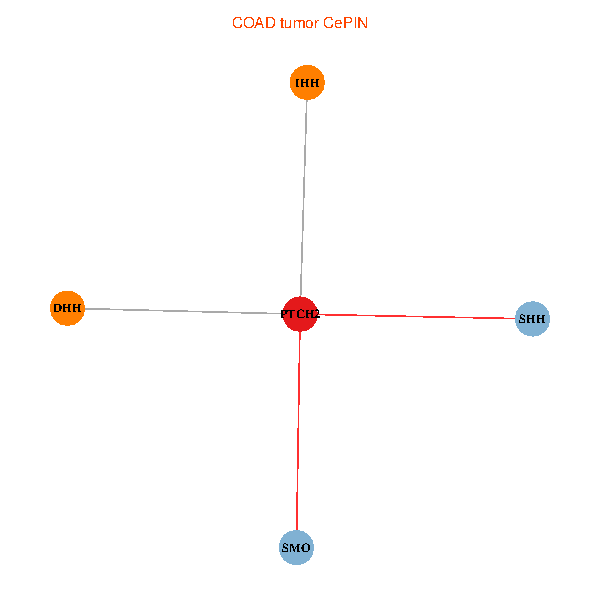
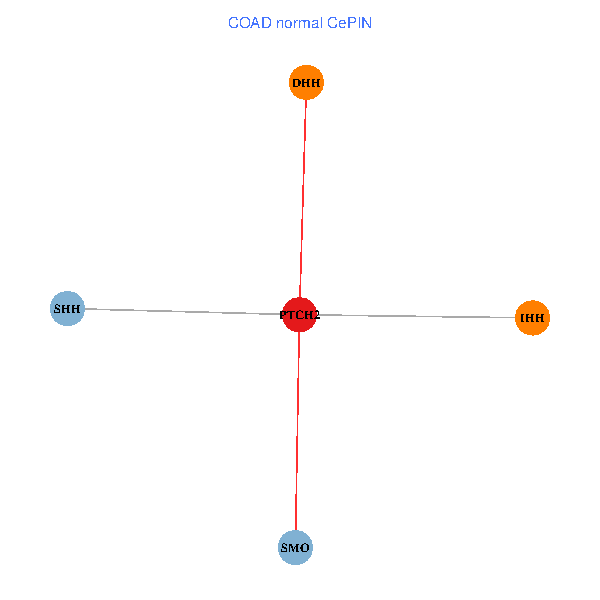
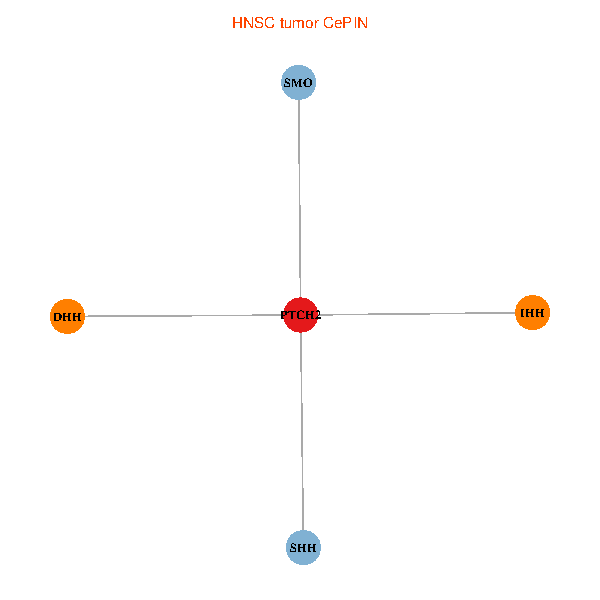
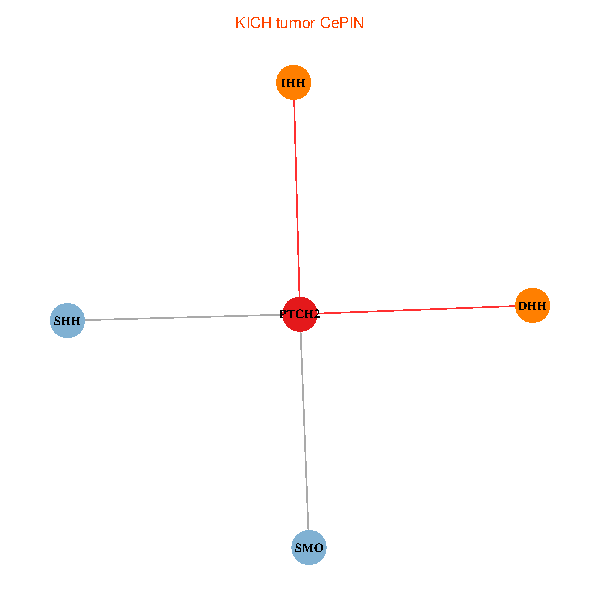
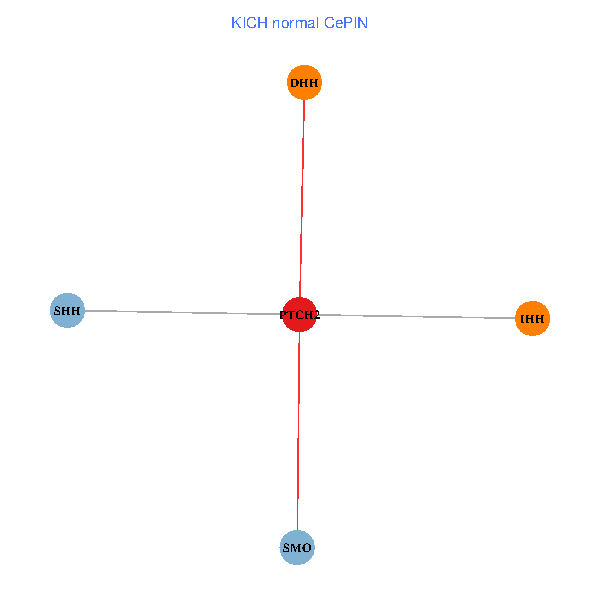
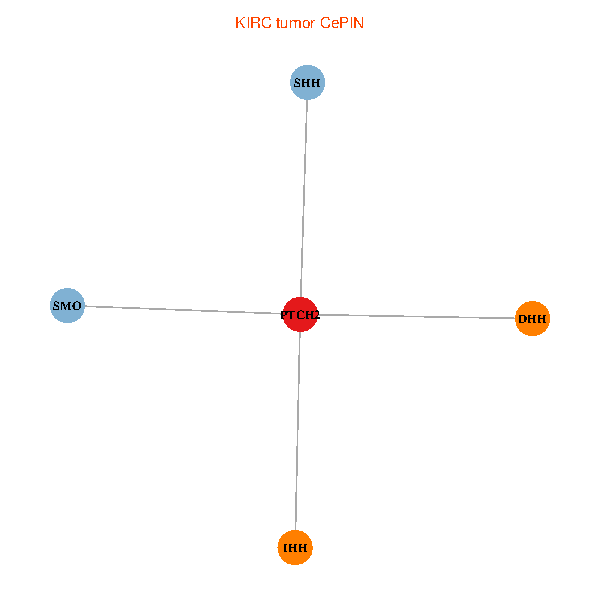
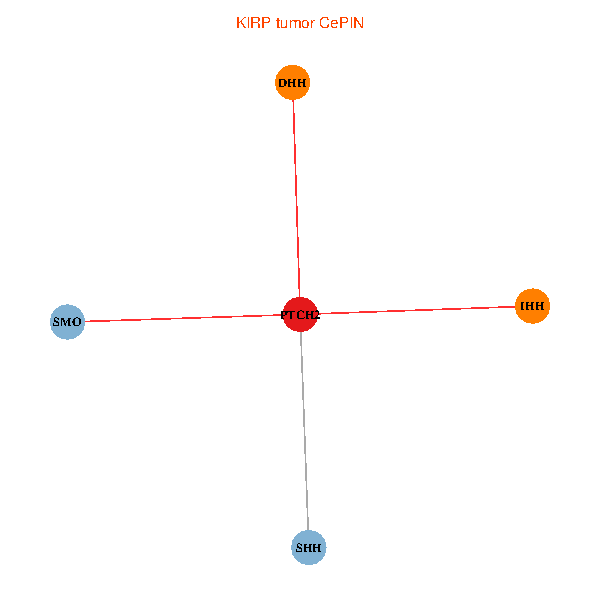
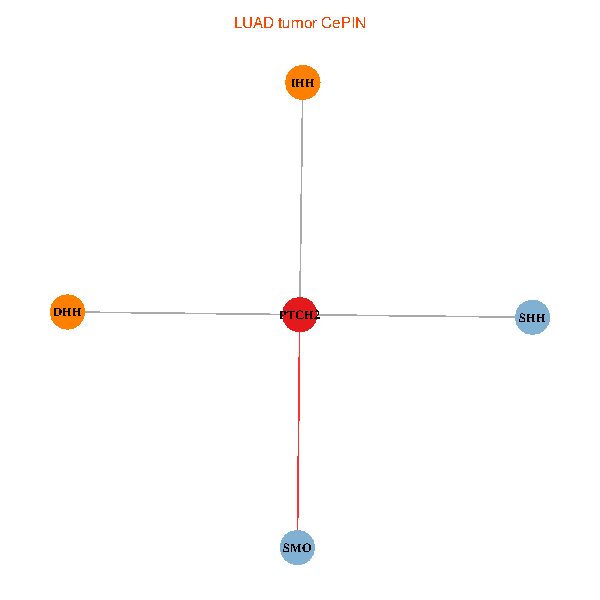
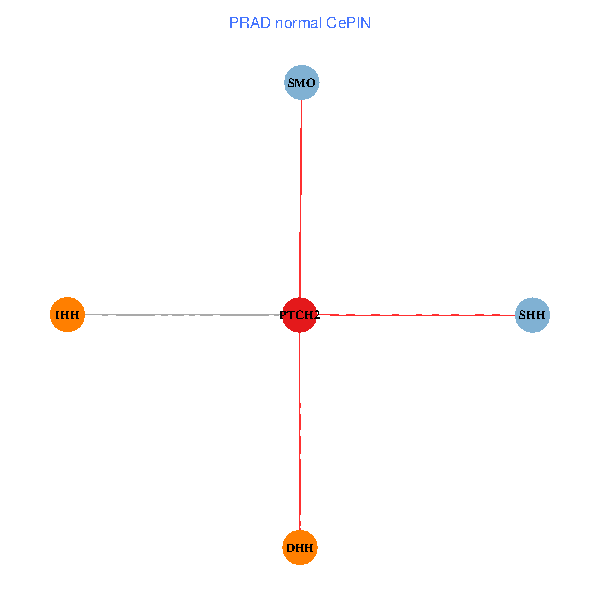
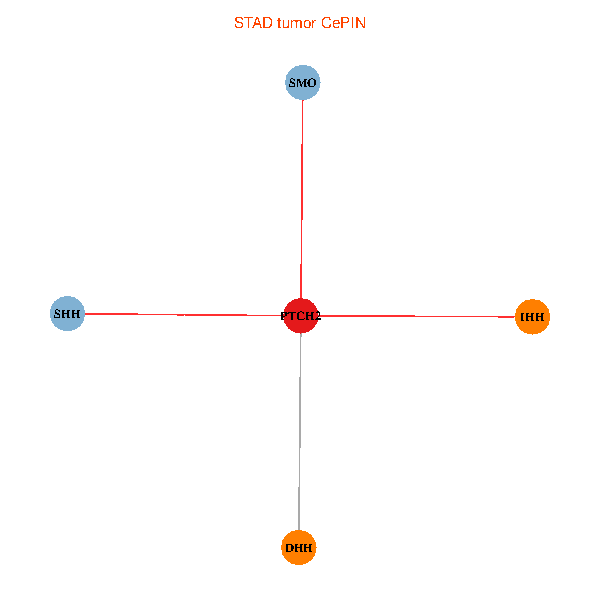
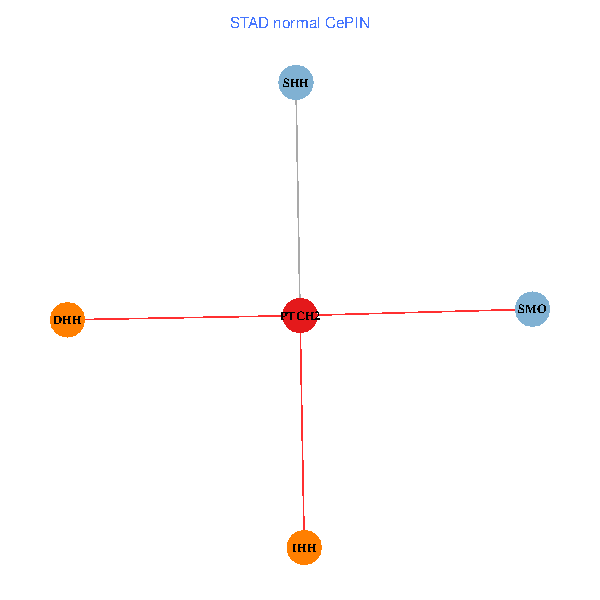
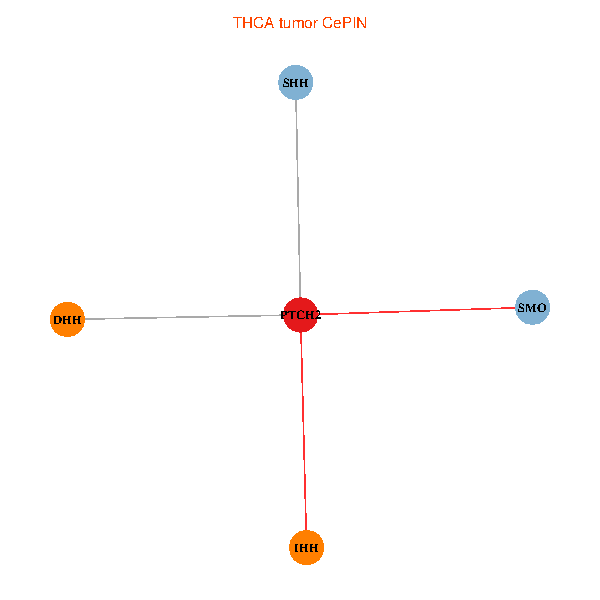
| Co-expressed gene networks based on protein-protein interaction data (CePIN) (TCGA IlluminaHiSeq_RNASeqV2, pan-cancer normalized log2(norm_counts+1) data, version 2016-08-16) (PINA2 ppi data) |
| BRCA (tumor) | BRCA (normal) |
| PTCH2, SHH, IHH, SMO, DHH (tumor) | PTCH2, SHH, IHH, SMO, DHH (normal) |
 |  |
| COAD (tumor) | COAD (normal) |
| PTCH2, SHH, IHH, SMO, DHH (tumor) | PTCH2, SHH, IHH, SMO, DHH (normal) |
 |  |
| HNSC (tumor) | HNSC (normal) |
| PTCH2, SHH, IHH, SMO, DHH (tumor) | PTCH2, SHH, IHH, SMO, DHH (normal) |
 |  |
| KICH (tumor) | KICH (normal) |
| PTCH2, SHH, IHH, SMO, DHH (tumor) | PTCH2, SHH, IHH, SMO, DHH (normal) |
 |  |
| KIRC (tumor) | KIRC (normal) |
| PTCH2, SHH, IHH, SMO, DHH (tumor) | PTCH2, SHH, IHH, SMO, DHH (normal) |
 |  |
| KIRP (tumor) | KIRP (normal) |
| PTCH2, SHH, IHH, SMO, DHH (tumor) | PTCH2, SHH, IHH, SMO, DHH (normal) |
 |  |
| LIHC (tumor) | LIHC (normal) |
| PTCH2, SHH, IHH, SMO, DHH (tumor) | PTCH2, SHH, IHH, SMO, DHH (normal) |
 |  |
| LUAD (tumor) | LUAD (normal) |
| PTCH2, SHH, IHH, SMO, DHH (tumor) | PTCH2, SHH, IHH, SMO, DHH (normal) |
 | 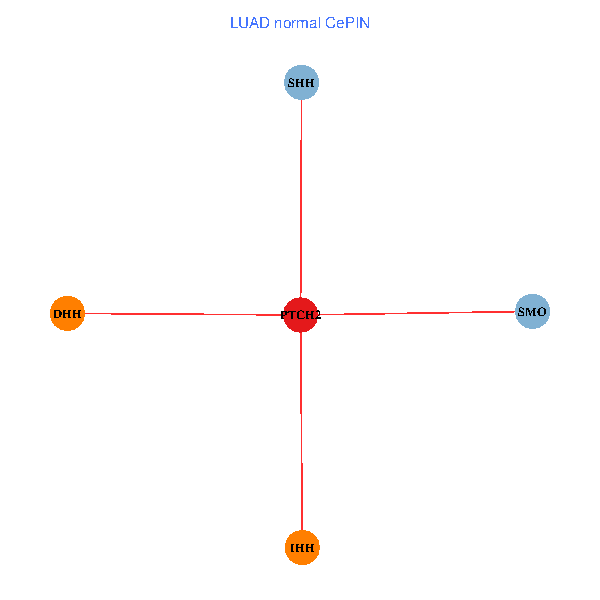 |
| LUSC (tumor) | LUSC (normal) |
| PTCH2, SHH, IHH, SMO, DHH (tumor) | PTCH2, SHH, IHH, SMO, DHH (normal) |
 |  |
| PRAD (tumor) | PRAD (normal) |
| PTCH2, SHH, IHH, SMO, DHH (tumor) | PTCH2, SHH, IHH, SMO, DHH (normal) |
 |  |
| STAD (tumor) | STAD (normal) |
| PTCH2, SHH, IHH, SMO, DHH (tumor) | PTCH2, SHH, IHH, SMO, DHH (normal) |
 |  |
| THCA (tumor) | THCA (normal) |
| PTCH2, SHH, IHH, SMO, DHH (tumor) | PTCH2, SHH, IHH, SMO, DHH (normal) |
 |  |
| Top |
| TissGeneProg for PTCH2 |
| Kaplan-Meier plots with logrank tests of overall survival (OS) using 28 cancer types (TCGA IlluminaHiSeq_RNASeqV2, pan-cancer normalized log2(norm_counts+1) data, version 2016-08-16) (TCGA clinicalMatrix, phenotype data, version 2016-04-27) * Click on the image to enlarge it in a new window. |
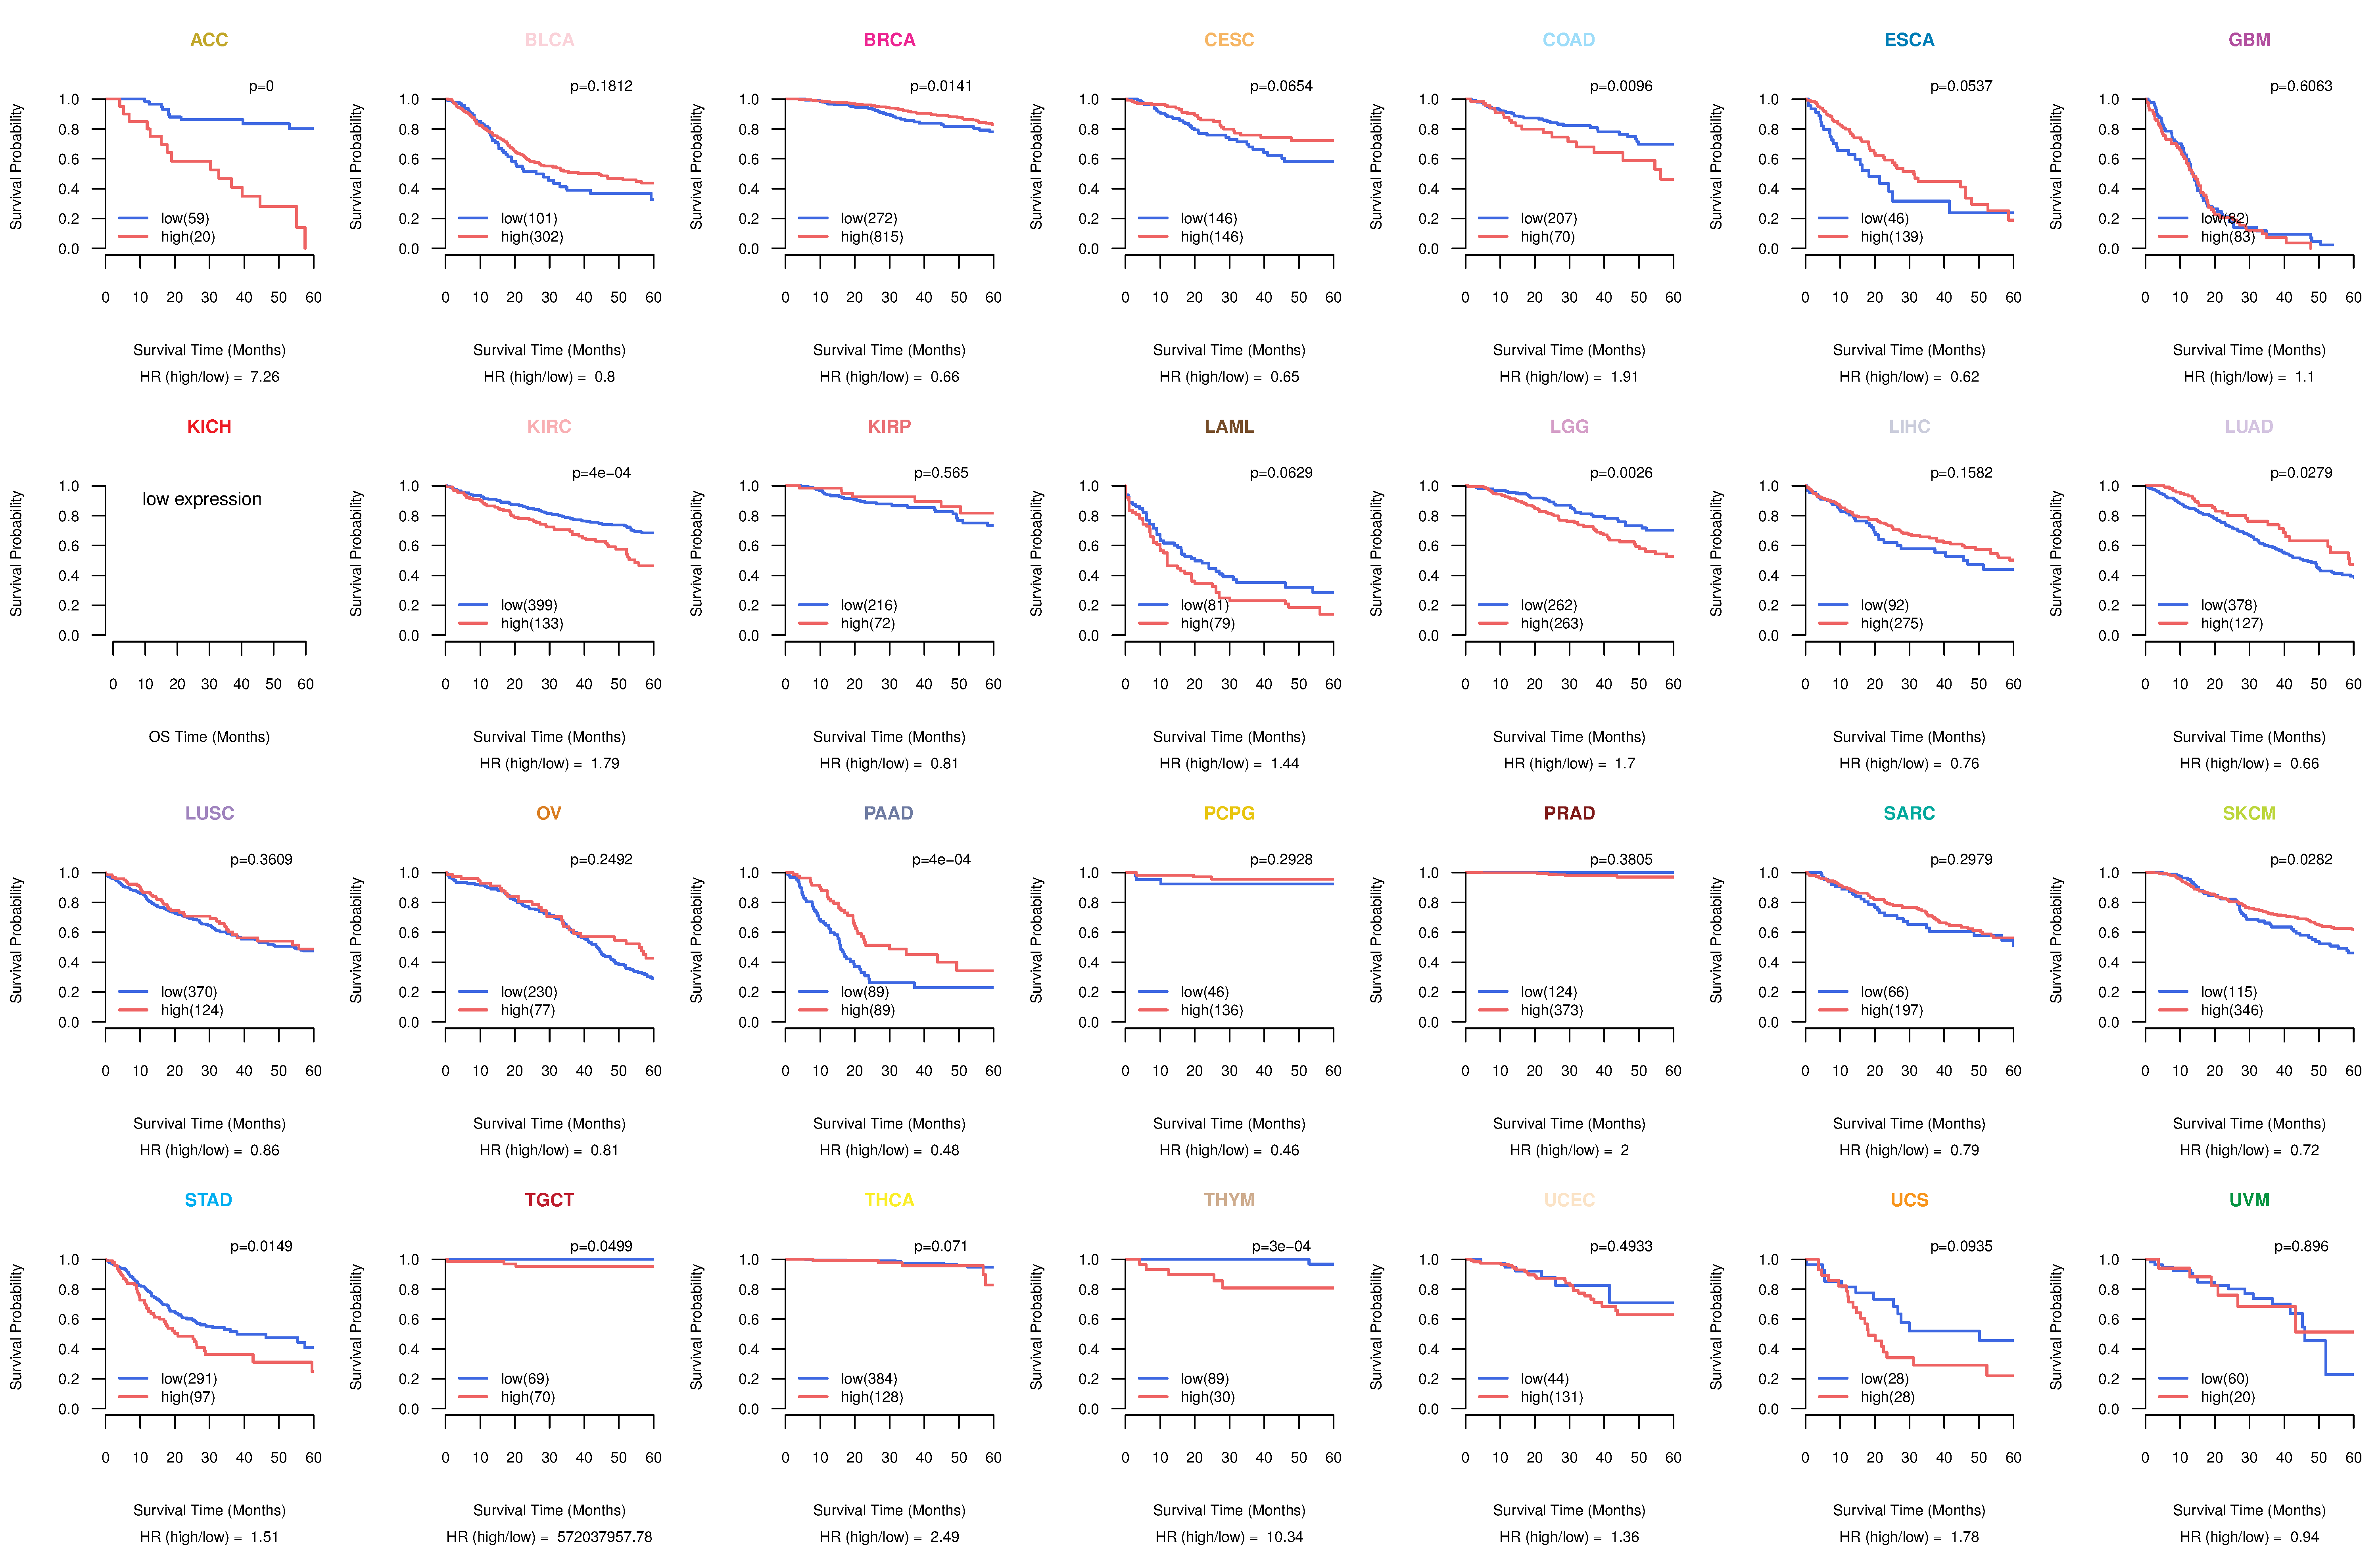 |
| Kaplan-Meier plots with logrank test of relapse free survival (RFS) using 28 cancer types (TCGA IlluminaHiSeq_RNASeqV2, pan-cancer normalized log2(norm_counts+1) data, version 2016-08-16) (TCGA clinicalMatrix, phenotype data, version 2016-04-27) * Click on the image enlarge it in a new window. |
 |
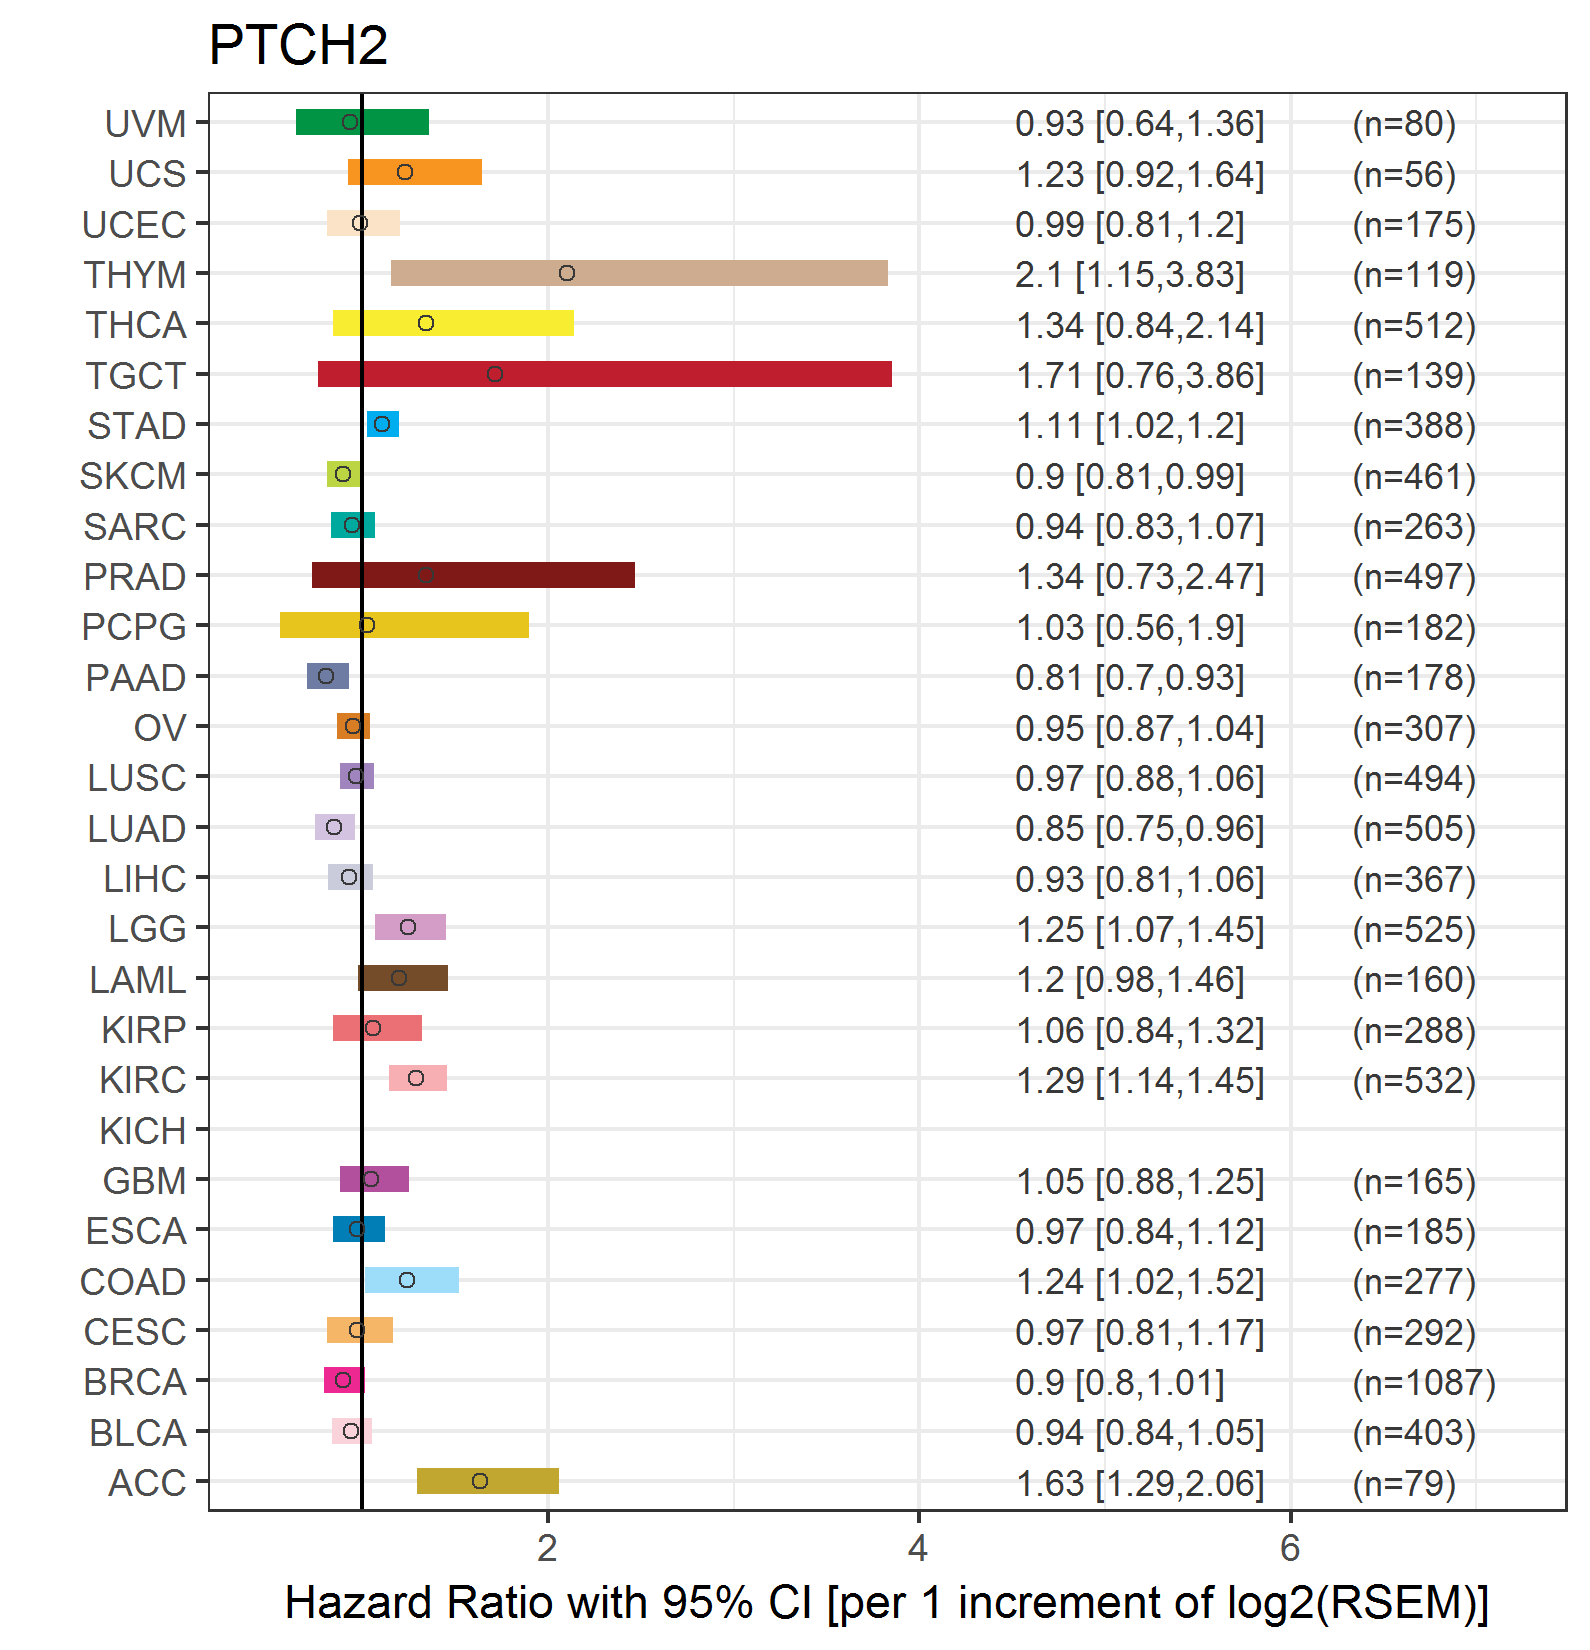
| Forest plot of Cox proportional hazard ratio (HR) and 95% CI of overall survival (OS) using 28 cancer types (TCGA IlluminaHiSeq_RNASeqV2, pan-cancer normalized log2(norm_counts+1) data, version 2016-08-16) (TCGA clinicalMatrix, phenotype data, version 2016-04-27) * Click on the image enlarge it in a new window. |
 |
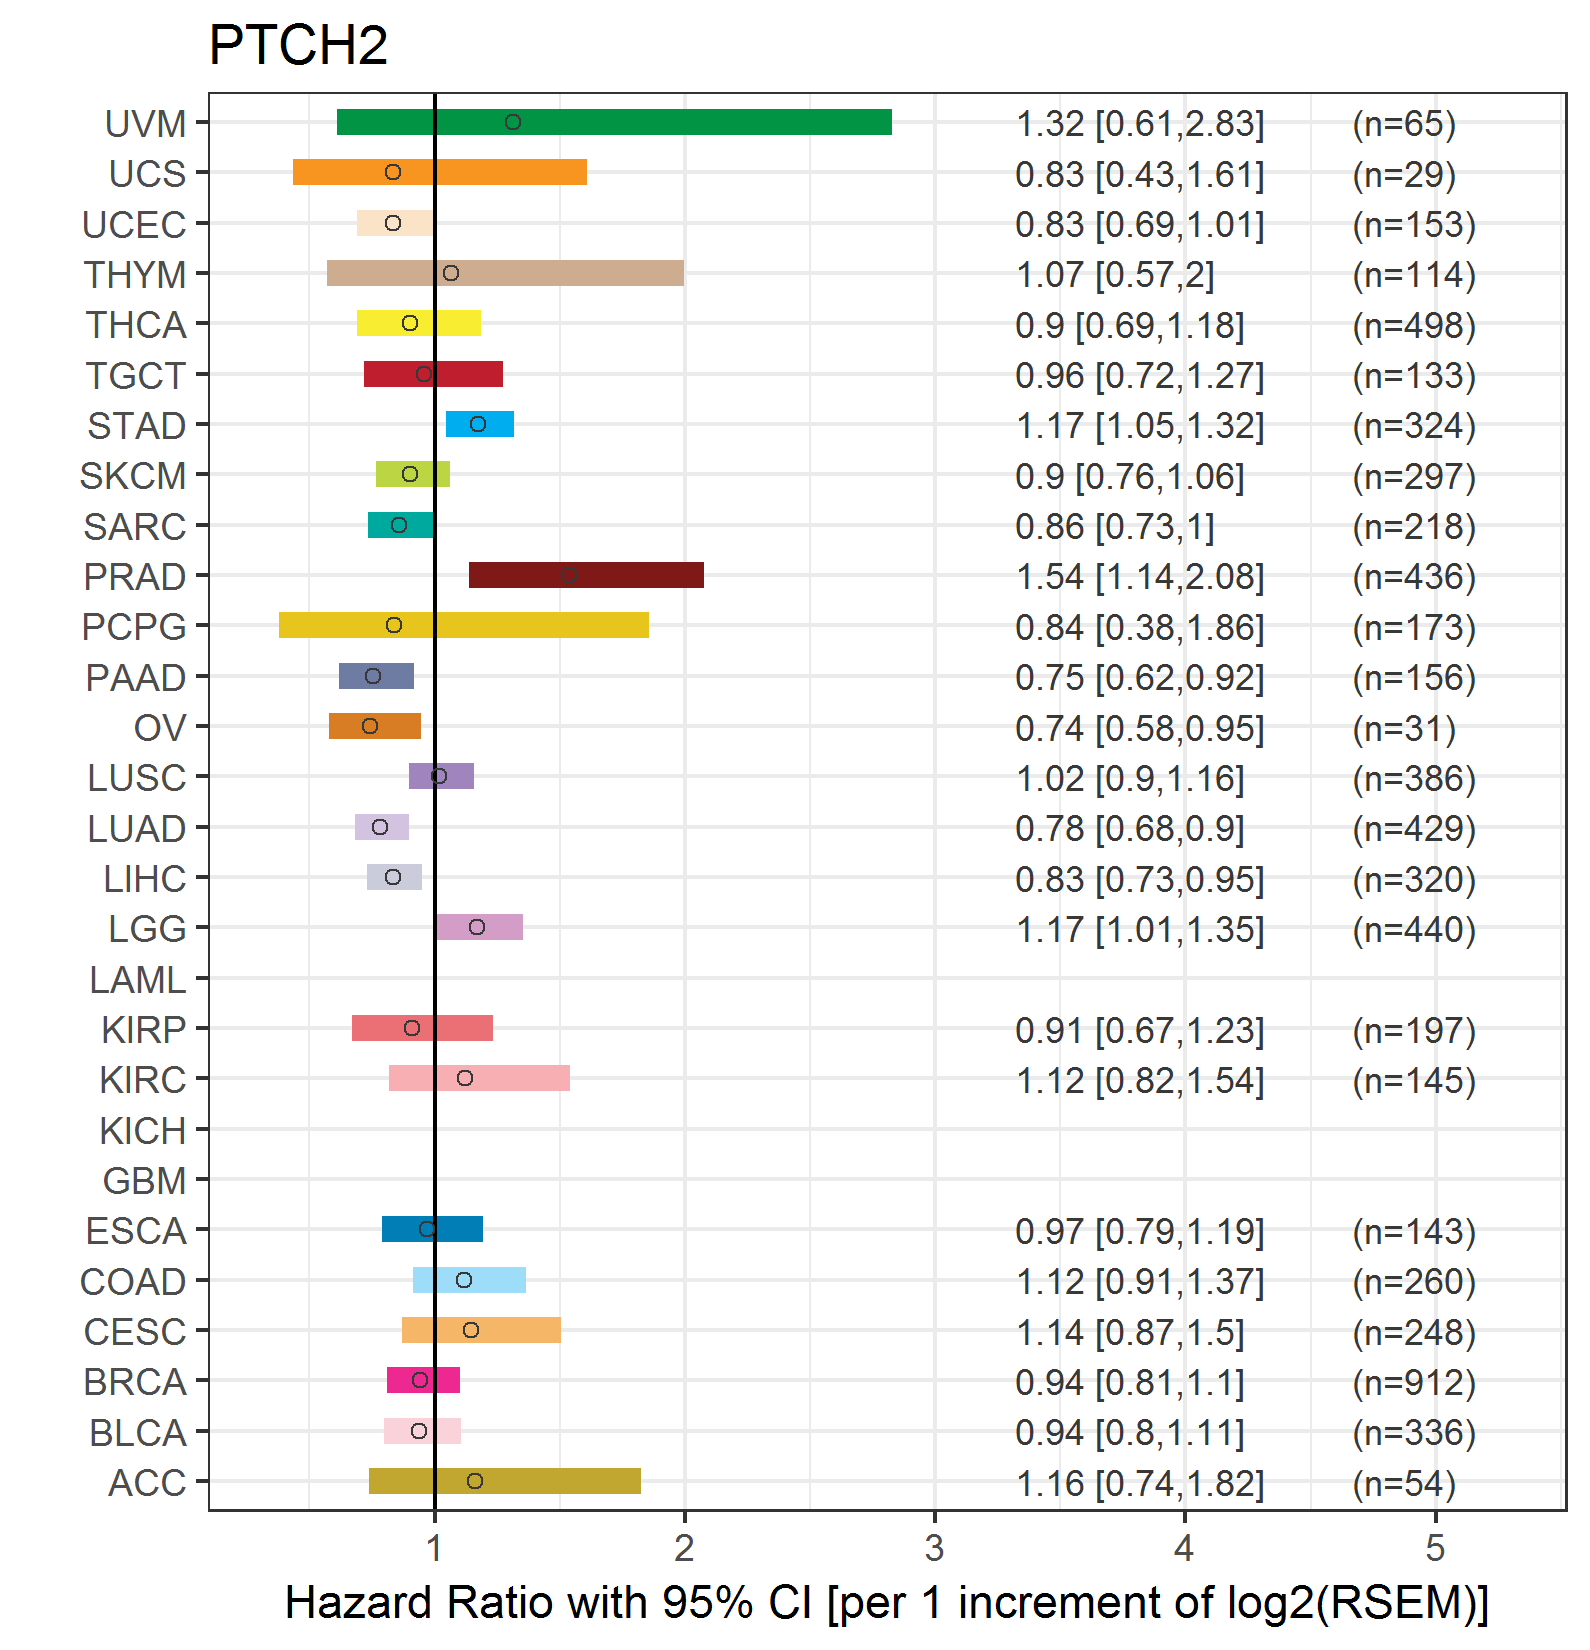
| Forest plot of Cox proportional hazard ratio (HR) and 95% CI of relapse free survival (RFS) using 28 cancer types (TCGA IlluminaHiSeq_RNASeqV2, pan-cancer normalized log2(norm_counts+1) data, version 2016-08-16) (TCGA clinicalMatrix, phenotype data, version 2016-04-27) * Click on the image enlarge it in a new window. |
 |
| Top |
| TissGeneClin for PTCH2 |
| TissGeneDrug for PTCH2 |
| Drug information targeting TissGene (DrugBank Version 5.0.6, 2017-04-01) |
| DrugBank ID | Drug name | Drug activity | Drug type | Drug status |
| Top |
| TissGeneDisease for PTCH2 |
| Disease information associated with TissGene (DisGeNet, 2016-06-01) |
| Disease ID | Disease name | # pubmeds | Source |
| umls:C0004779 | Basal Cell Nevus Syndrome | 4 | BeFree,CLINVAR,ORPHANET |
| umls:C0238463 | Papillary thyroid carcinoma | 3 | BeFree |
| umls:C0007133 | Carcinoma, Papillary | 2 | BeFree |
| umls:C0205647 | Follicular adenoma | 2 | BeFree |
| umls:C0549473 | Thyroid carcinoma | 2 | BeFree |
| umls:C3811653 | Experimental Organism Basal Cell Carcinoma | 2 | BeFree |
| umls:C0005684 | Malignant neoplasm of urinary bladder | 1 | GAD |
| umls:C0007115 | Malignant neoplasm of thyroid | 1 | BeFree |
| umls:C0023492 | Leukemia, T-Cell | 1 | BeFree |
| umls:C0024299 | Lymphoma | 1 | BeFree |
| umls:C0025149 | Medulloblastoma | 1 | BeFree,CLINVAR,CTD_human |
| umls:C0027819 | Neuroblastoma | 1 | BeFree |
| umls:C0031511 | Pheochromocytoma | 1 | BeFree |
| umls:C0040128 | Thyroid Diseases | 1 | BeFree |
| umls:C0205696 | Anaplastic carcinoma | 1 | BeFree |
| umls:C0596263 | Carcinogenesis | 1 | BeFree |
| umls:C0700095 | Central neuroblastoma | 1 | BeFree |
| umls:C0812437 | Oculo-dento-digital syndrome | 1 | BeFree |
| umls:C0007117 | Basal cell carcinoma | 0 | CTD_human |
| umls:C0024433 | Macrostomia | 0 | CTD_human |
| umls:C3150792 | MACROSTOMIA, ISOLATED | 0 | ORPHANET |
|
Copyright 2016-Present - The University of Texas Health Science Center at Houston (UTHealth) Web File Viewing | How to Report, Fraud, Waste and Abuse | State of Texas | Statewide Search | Texas Homeland Security | Site Policies |