 |
| |
| |
| |
| |
| |
| |
|

| TissGeneSummary for H1FX |
 Gene summary Gene summary |
| Basic gene information | Gene symbol | H1FX |
| Gene name | H1 histone family, member X | |
| Synonyms | H1.10|H1X | |
| Cytomap | UCSC genome browser: 3q21.3 | |
| Type of gene | protein-coding | |
| RefGenes | NM_006026.3, | |
| Description | histone H1x | |
| Modification date | 20141215 | |
| dbXrefs | MIM : 602785 | |
| HGNC : HGNC | ||
| Ensembl : ENSG00000184897 | ||
| HPRD : 04151 | ||
| Vega : OTTHUMG00000159450 | ||
| Protein | UniProt: go to UniProt's Cross Reference DB Table | |
| Expression | CleanEX: HS_H1FX | |
| BioGPS: 8971 | ||
| Pathway | NCI Pathway Interaction Database: H1FX | |
| KEGG: H1FX | ||
| REACTOME: H1FX | ||
| Pathway Commons: H1FX | ||
| Context | iHOP: H1FX | |
| ligand binding site mutation search in PubMed: H1FX | ||
| UCL Cancer Institute: H1FX | ||
| Assigned class in TissGDB* | C | |
| Included tissue-specific gene expression resources | HPA,TiGER | |
| Specific-tissues in normal samples (assigned by TissGDB using HPA, TiGER, and GTEx) | Bone marrowLung | |
| Cancer types related to the specific-tissues in cancer samples (assigned by TissGDB using TCGA) | LAMLLUAD,LUSC | |
| Reference showing the relevant tissue of H1FX | ||
| Description by TissGene annotations | TissgsLTS | |
| * Class A consists of genes with literature evidence and is part of the cTissGenes. Class B consists of only cTissGenes without additional evidence. The remaining genes belong to Class C. |
| Gene ontology having evidence of Inferred from Direct Assay (IDA) from Entrez |
| GO ID | GO term | PubMed ID |
| Top |
| TissGeneExp for H1FX |
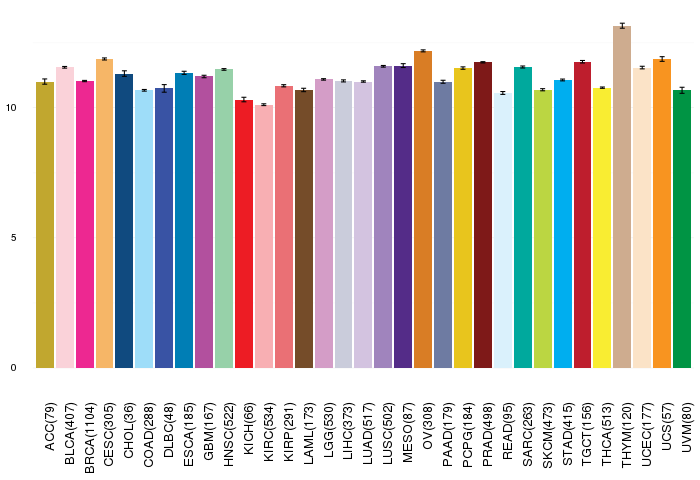
| Gene expressions across 28 cancer types (X-axis: cancer type and Y-axis: log2(norm_counts+1)) (TCGA IlluminaHiSeq_RNASeqV2, pan-cancer normalized log2(norm_counts+1) data, version 2016-08-16) |
 |
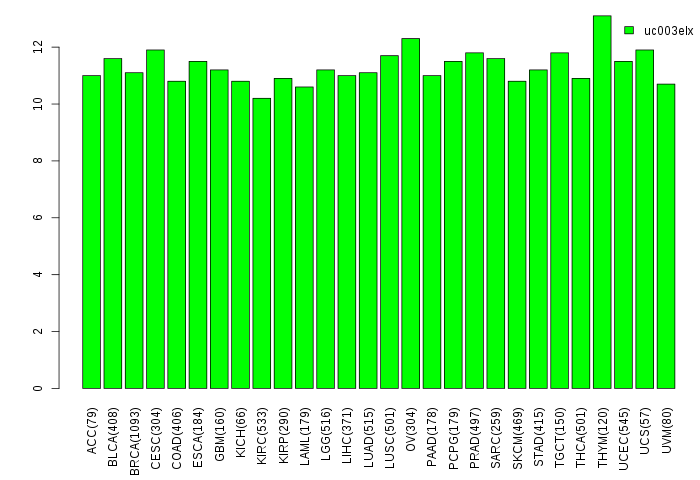
| Gene isoform expressions across 28 cancer types (X-axis: cancer type and Y-axis: log2(norm_counts+1)) (TCGA pan-cancer tcga_rsem_isoform_tpm, version 2016-09-01) |
 |
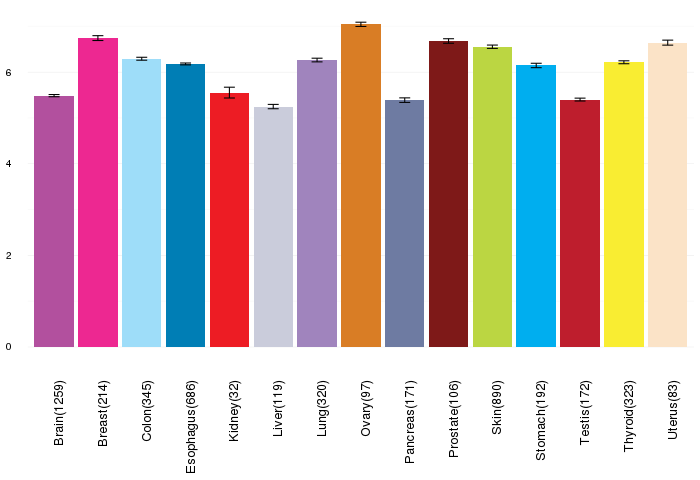
| Gene expressions across normal tissues of GTEx data (GTEx GTEx_Analysis_v6_RNA-seq_RNA-SeQCv1.1.8_gene_rpkm.gct) - Here, we shows the matched tissue types only among our 28 cancer types. |
 |
| Different expressions across 14 cancer types with more than 10 samples between matched tumors and normals (X-axis: cancer type and Y-axis: log2(norm_counts+1)) (TCGA IlluminaHiSeq_RNASeqV2, pan-cancer normalized log2(norm_counts+1) data, version 2016-08-16) |
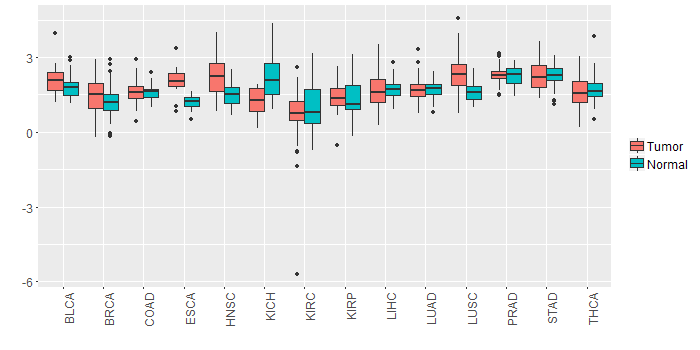 |
| - Significantly differentially expressed cancer types and information. (|Fold change|>1 and FDR<0.05) |
| Cancer type | Mean(exp) in tumor | Mean(exp) in matched normal | Log2FC | P-val. | FDR |
| KICH | 1.17671941 | 2.26432741 | -1.087608 | 1.16E-05 | 3.64E-05 |
| Top |
| TissGene-miRNA for H1FX |
| Significantly anti-correlated miRNAs of TissGene across 28 cancer types (Gene-miRNA relations from TargetScanHuman Relsease 7.1, Conserved_Site_Context_Scores.txt.zip, 06.01.2016) (TCGA IlluminaHiSeq_miRNASeq, log2(RPM+1) data, version 2016-11-21) (TCGA IlluminaHiSeq_RNASeqV2, log2(normalized_count+1) data, version 2016-08-16) (Spearman’s Rank Correlation (p-value<0.05 and coefficient<-0.25)) |
| Cancer type | miRNA id | miRNA accession | P-val. | Coeff. | # samples |
| Top |
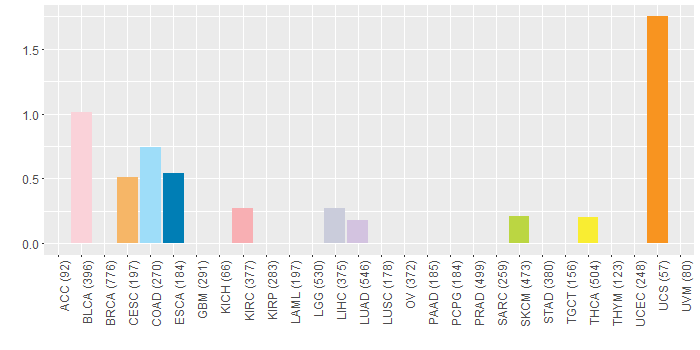
| TissGeneMut for H1FX |
| TissGeneSNV for H1FX |
| nsSNV counts per each loci. Different colors of circles represent different cancer types. Circle size denotes number of samples. (TCGA somatic mutation (SNPs and small INDELs) data, version 2016-04-25) * Click on the image to enlarge it in a new window. |
 |
 |
| Somatic nucleotide variants of TissGene across 28 cancer types (X-axis: cancer type and Y-axis: % of mutated samples) The numbers in parentheses are numbers of samples with mutation (nsSNVs). (TCGA somatic mutation (SNPs and small INDELs) data, version 2016-04-25) |
 |
| - nsSNVs sorted by frequency. |
| AAchange | Cancer type | # samples |
| p.K146N | HNSC | 1 |
| p.Q83H | BLCA | 1 |
| p.G46D | COAD | 1 |
| p.K75N | BLCA | 1 |
| p.E15K | THCA | 1 |
| p.S154C | LUAD | 1 |
| p.S154F | BLCA | 1 |
| p.A95T | SKCM | 1 |
| p.K37N | BLCA | 1 |
| p.K188N | KIRC | 1 |
| p.S65W | ESCA | 1 |
| p.E4G | LIHC | 1 |
| p.E73K | BLCA | 1 |
| p.E6Q | CESC | 1 |
| p.K185Q | UCS | 1 |
| p.A190V | COAD | 1 |
| Top |
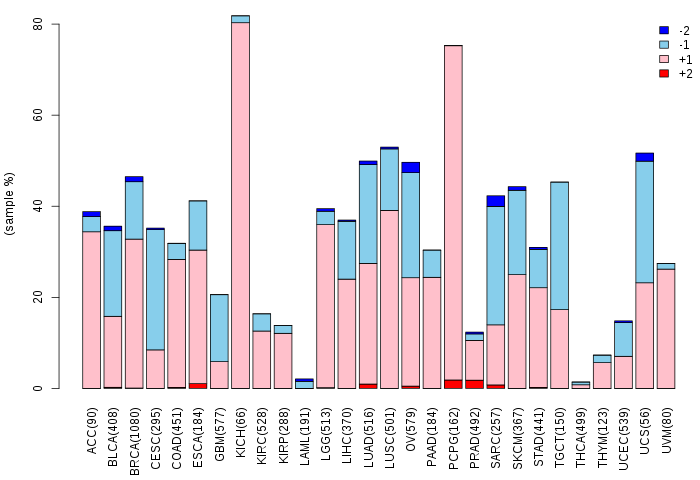
| TissGeneCNV for H1FX |
| Copy number variations of TissGene across 28 cancer types (X-axis: cancer type and Y-axis: % of CNV samples) (TCGA Gistic2_CopyNumber_Gistic2_all_data_by_genes, Gistic2 copy number data, version 2016-08-16) |
 |
| Top |
| TissGeneFusions for H1FX |
| Fusion genes including TissGene (ChimerDB 3.0, 2016-12-01 and TCGA fusion Portal 2015-12-01) |
| Database | Src | Cancer type | Sample | Fusion gene | ORF | 5'-gene BP | 3'-gene BP |
| Chimerdb3.0 | ChiTaRs | NA | AV705114 | H1FX-HEXIM1 | chr3:129035118 | chr17:43227547 | |
| Chimerdb3.0 | ChiTaRs | NA | BI906151 | ATXN1-H1FX | chr6:16492183 | chr3:129034893 | |
| Chimerdb3.0 | ChiTaRs | NA | AW612361 | H1FX-H1FX | chr3:129034289 | chr3:129033841 | |
| Chimerdb3.0 | ChiTaRs | NA | BF750874 | PRR14L-H1FX | chr22:32077545 | chr3:129033614 |
| Top |
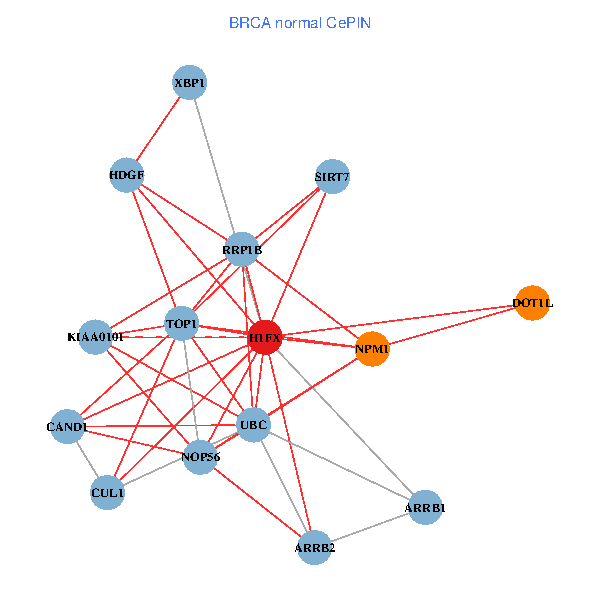
| TissGeneNet for H1FX |
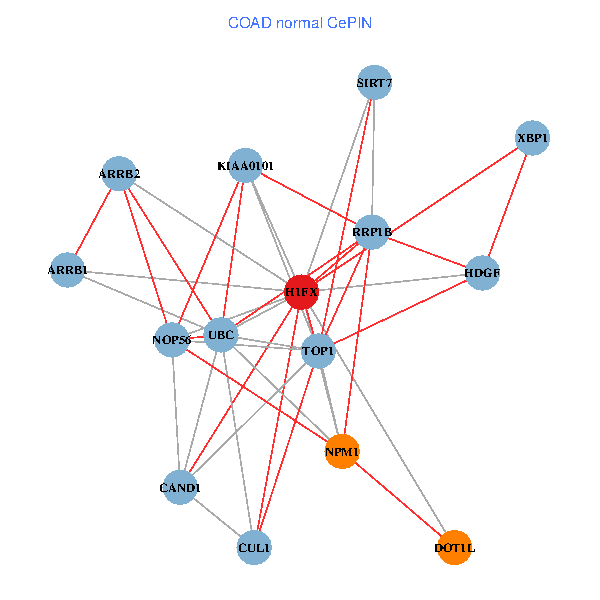
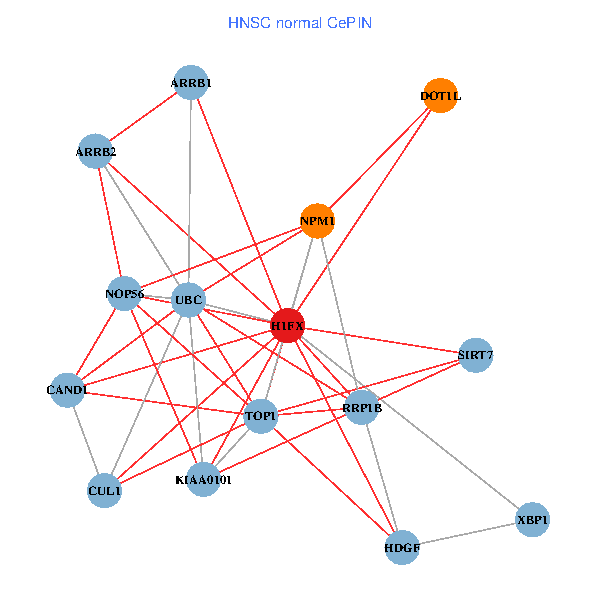
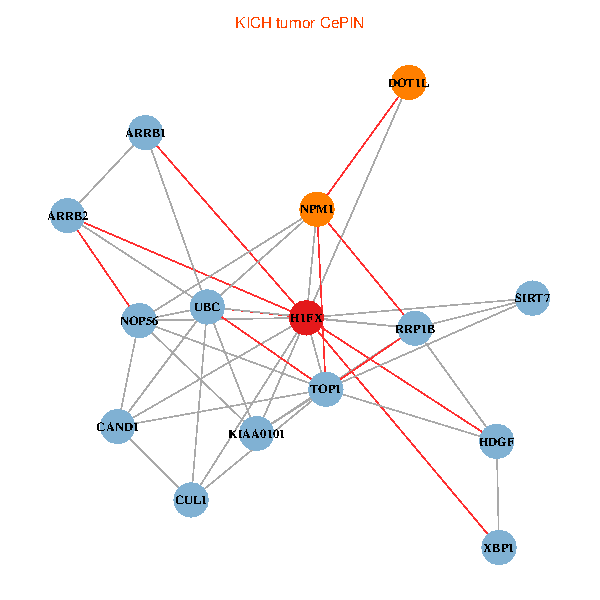
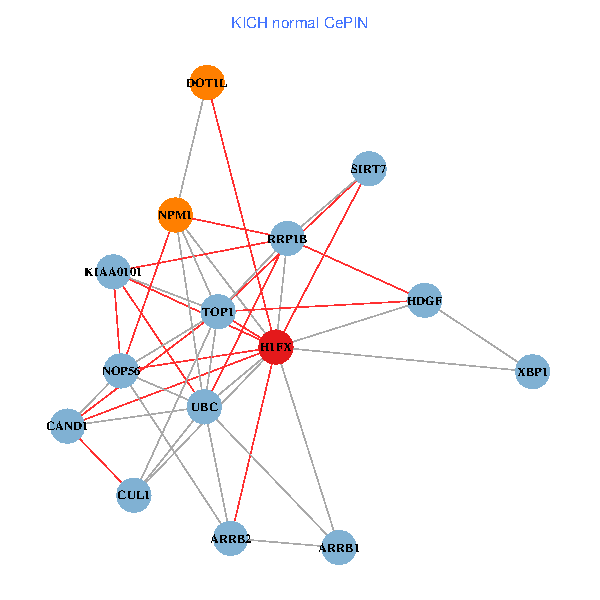
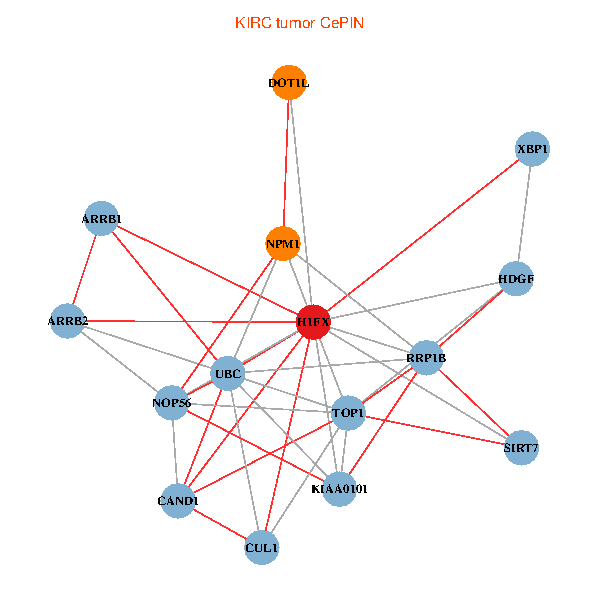
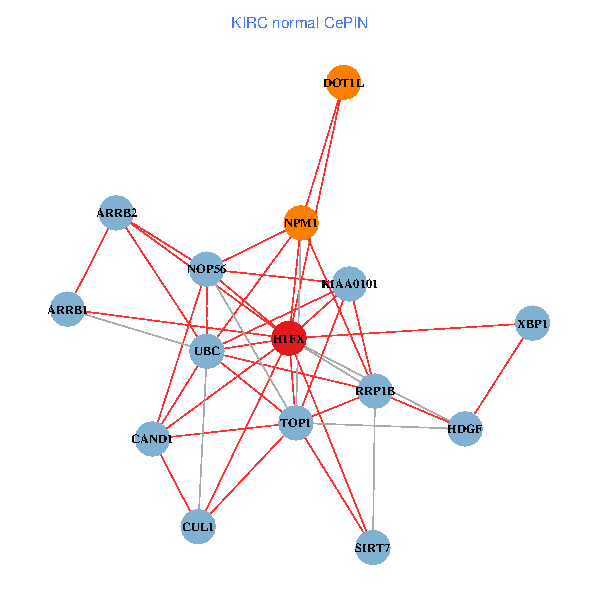
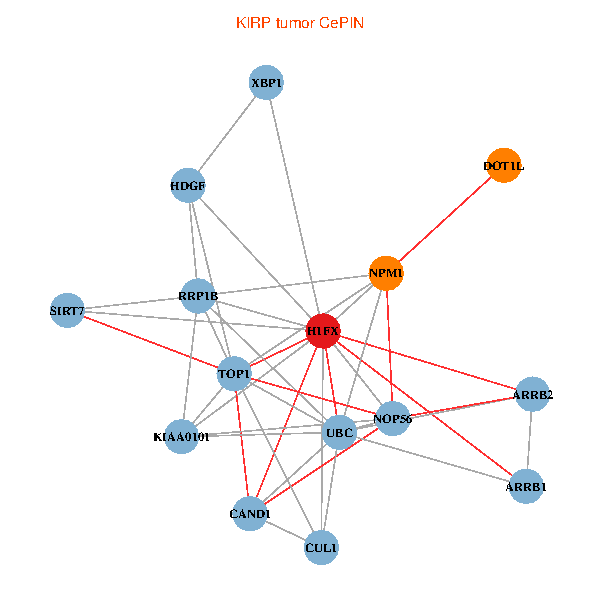
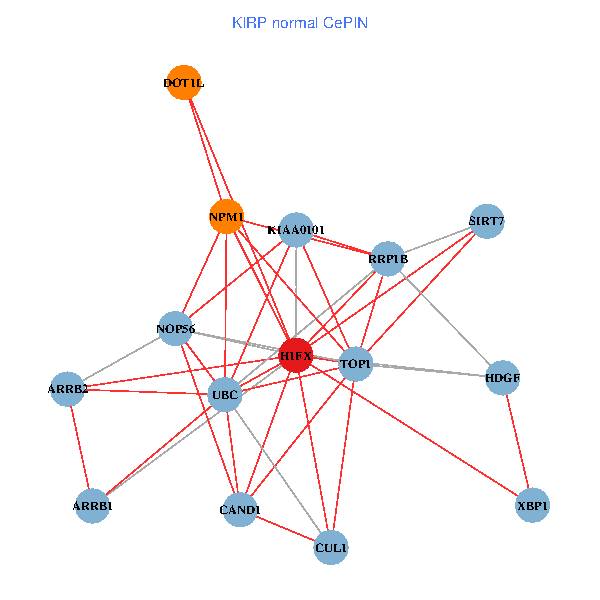
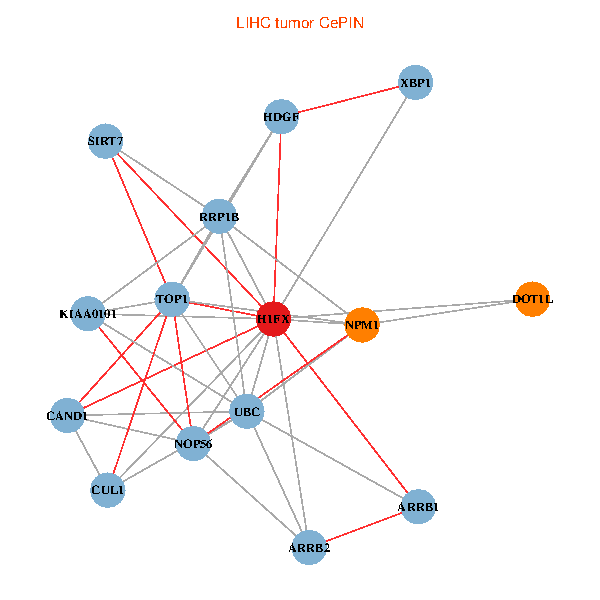
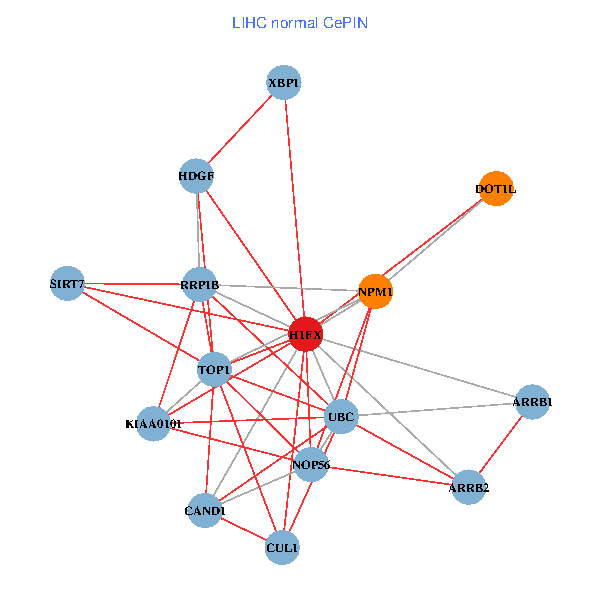
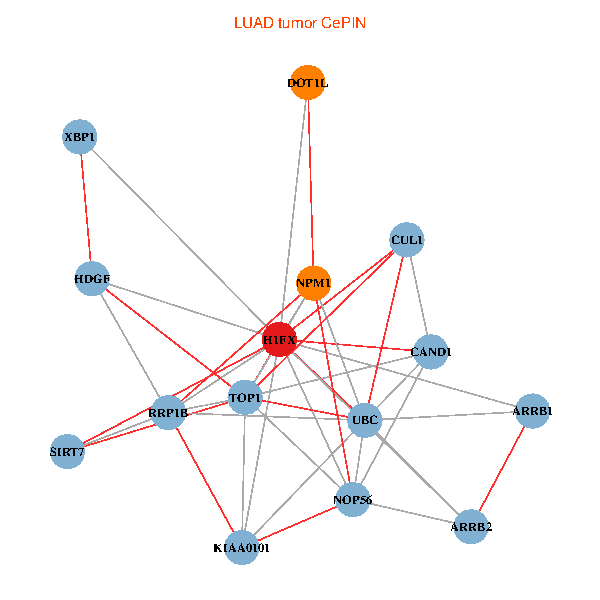
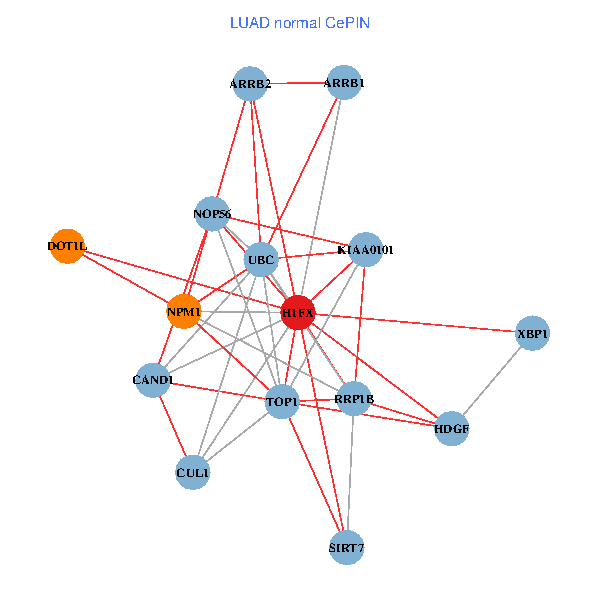
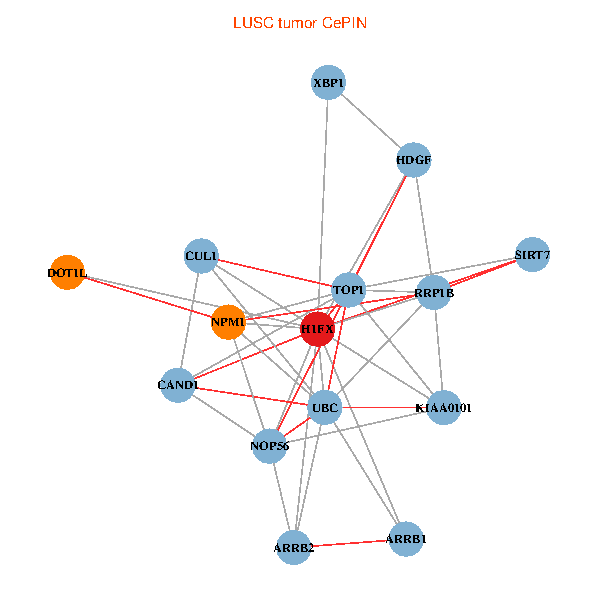
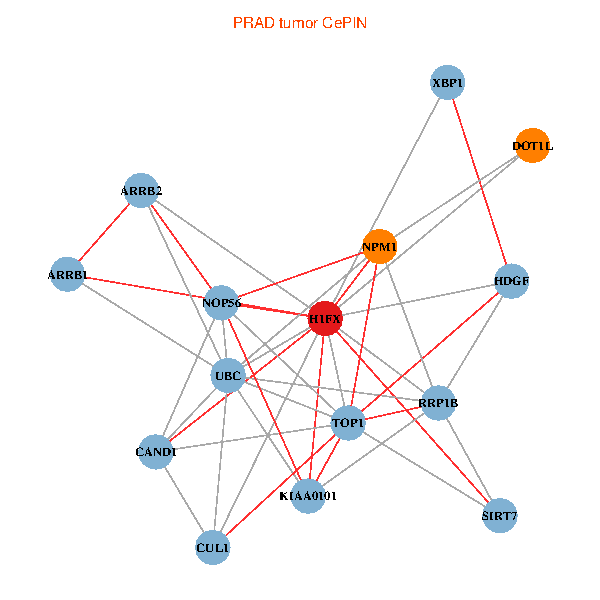
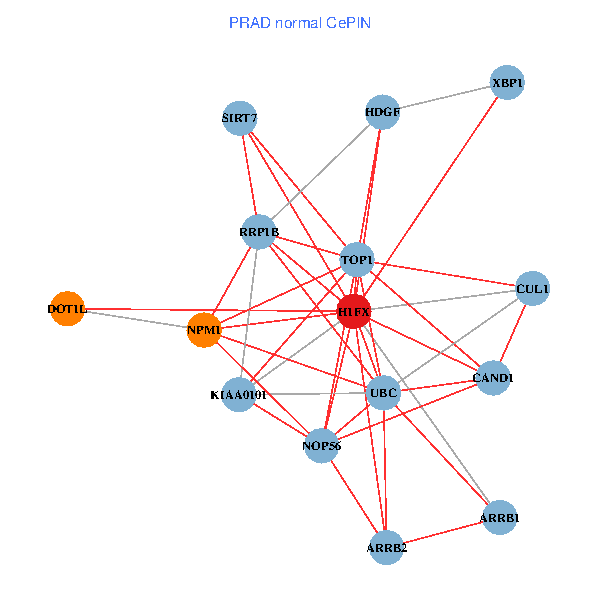
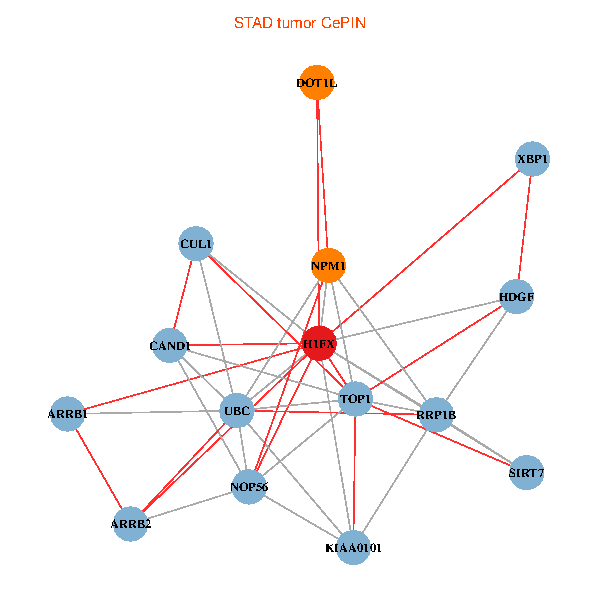
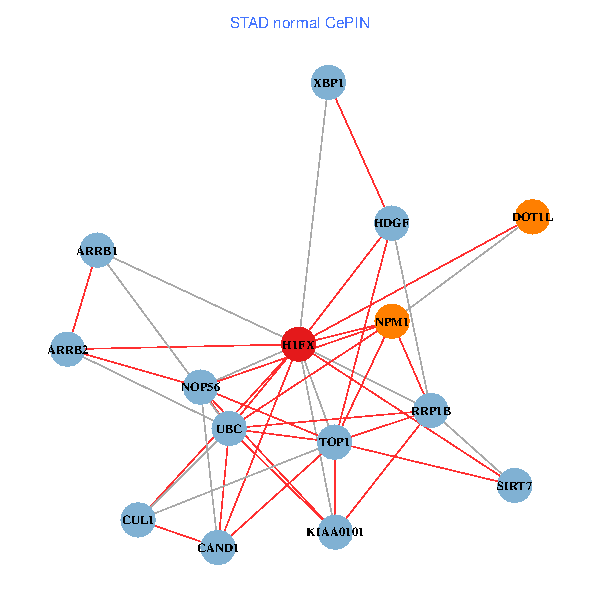
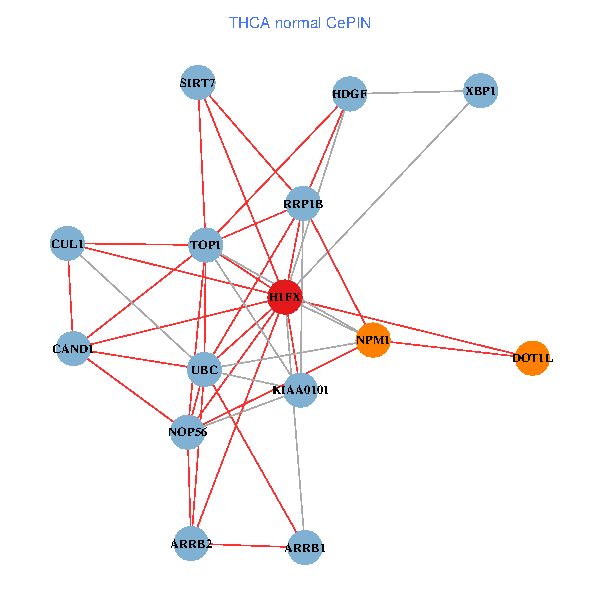
| Co-expressed gene networks based on protein-protein interaction data (CePIN) (TCGA IlluminaHiSeq_RNASeqV2, pan-cancer normalized log2(norm_counts+1) data, version 2016-08-16) (PINA2 ppi data) |
| BRCA (tumor) | BRCA (normal) |
| H1FX, SIRT7, CAND1, UBC, KIAA0101, CUL1, HDGF, ARRB2, NOP56, ARRB1, DOT1L, NPM1, TOP1, XBP1, RRP1B (tumor) | H1FX, SIRT7, CAND1, UBC, KIAA0101, CUL1, HDGF, ARRB2, NOP56, ARRB1, DOT1L, NPM1, TOP1, XBP1, RRP1B (normal) |
 |  |
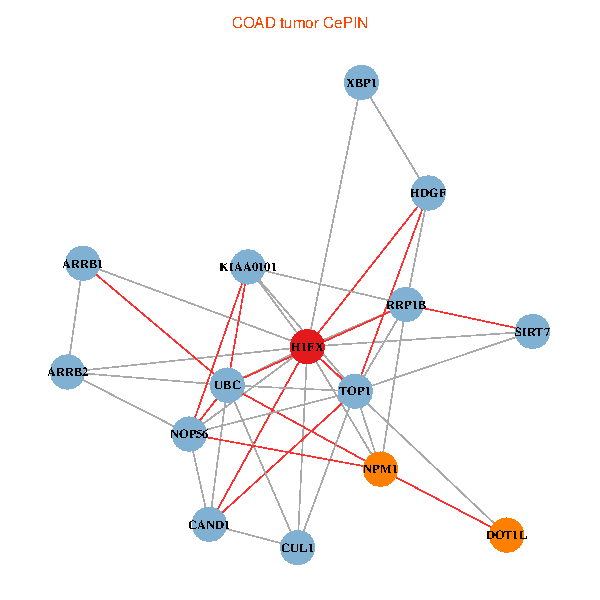
| COAD (tumor) | COAD (normal) |
| H1FX, SIRT7, CAND1, UBC, KIAA0101, CUL1, HDGF, ARRB2, NOP56, ARRB1, DOT1L, NPM1, TOP1, XBP1, RRP1B (tumor) | H1FX, SIRT7, CAND1, UBC, KIAA0101, CUL1, HDGF, ARRB2, NOP56, ARRB1, DOT1L, NPM1, TOP1, XBP1, RRP1B (normal) |
 |  |
| HNSC (tumor) | HNSC (normal) |
| H1FX, SIRT7, CAND1, UBC, KIAA0101, CUL1, HDGF, ARRB2, NOP56, ARRB1, DOT1L, NPM1, TOP1, XBP1, RRP1B (tumor) | H1FX, SIRT7, CAND1, UBC, KIAA0101, CUL1, HDGF, ARRB2, NOP56, ARRB1, DOT1L, NPM1, TOP1, XBP1, RRP1B (normal) |
 |  |
| KICH (tumor) | KICH (normal) |
| H1FX, SIRT7, CAND1, UBC, KIAA0101, CUL1, HDGF, ARRB2, NOP56, ARRB1, DOT1L, NPM1, TOP1, XBP1, RRP1B (tumor) | H1FX, SIRT7, CAND1, UBC, KIAA0101, CUL1, HDGF, ARRB2, NOP56, ARRB1, DOT1L, NPM1, TOP1, XBP1, RRP1B (normal) |
 |  |
| KIRC (tumor) | KIRC (normal) |
| H1FX, SIRT7, CAND1, UBC, KIAA0101, CUL1, HDGF, ARRB2, NOP56, ARRB1, DOT1L, NPM1, TOP1, XBP1, RRP1B (tumor) | H1FX, SIRT7, CAND1, UBC, KIAA0101, CUL1, HDGF, ARRB2, NOP56, ARRB1, DOT1L, NPM1, TOP1, XBP1, RRP1B (normal) |
 |  |
| KIRP (tumor) | KIRP (normal) |
| H1FX, SIRT7, CAND1, UBC, KIAA0101, CUL1, HDGF, ARRB2, NOP56, ARRB1, DOT1L, NPM1, TOP1, XBP1, RRP1B (tumor) | H1FX, SIRT7, CAND1, UBC, KIAA0101, CUL1, HDGF, ARRB2, NOP56, ARRB1, DOT1L, NPM1, TOP1, XBP1, RRP1B (normal) |
 |  |
| LIHC (tumor) | LIHC (normal) |
| H1FX, SIRT7, CAND1, UBC, KIAA0101, CUL1, HDGF, ARRB2, NOP56, ARRB1, DOT1L, NPM1, TOP1, XBP1, RRP1B (tumor) | H1FX, SIRT7, CAND1, UBC, KIAA0101, CUL1, HDGF, ARRB2, NOP56, ARRB1, DOT1L, NPM1, TOP1, XBP1, RRP1B (normal) |
 |  |
| LUAD (tumor) | LUAD (normal) |
| H1FX, SIRT7, CAND1, UBC, KIAA0101, CUL1, HDGF, ARRB2, NOP56, ARRB1, DOT1L, NPM1, TOP1, XBP1, RRP1B (tumor) | H1FX, SIRT7, CAND1, UBC, KIAA0101, CUL1, HDGF, ARRB2, NOP56, ARRB1, DOT1L, NPM1, TOP1, XBP1, RRP1B (normal) |
 |  |
| LUSC (tumor) | LUSC (normal) |
| H1FX, SIRT7, CAND1, UBC, KIAA0101, CUL1, HDGF, ARRB2, NOP56, ARRB1, DOT1L, NPM1, TOP1, XBP1, RRP1B (tumor) | H1FX, SIRT7, CAND1, UBC, KIAA0101, CUL1, HDGF, ARRB2, NOP56, ARRB1, DOT1L, NPM1, TOP1, XBP1, RRP1B (normal) |
 |  |
| PRAD (tumor) | PRAD (normal) |
| H1FX, SIRT7, CAND1, UBC, KIAA0101, CUL1, HDGF, ARRB2, NOP56, ARRB1, DOT1L, NPM1, TOP1, XBP1, RRP1B (tumor) | H1FX, SIRT7, CAND1, UBC, KIAA0101, CUL1, HDGF, ARRB2, NOP56, ARRB1, DOT1L, NPM1, TOP1, XBP1, RRP1B (normal) |
 |  |
| STAD (tumor) | STAD (normal) |
| H1FX, SIRT7, CAND1, UBC, KIAA0101, CUL1, HDGF, ARRB2, NOP56, ARRB1, DOT1L, NPM1, TOP1, XBP1, RRP1B (tumor) | H1FX, SIRT7, CAND1, UBC, KIAA0101, CUL1, HDGF, ARRB2, NOP56, ARRB1, DOT1L, NPM1, TOP1, XBP1, RRP1B (normal) |
 |  |
| THCA (tumor) | THCA (normal) |
| H1FX, SIRT7, CAND1, UBC, KIAA0101, CUL1, HDGF, ARRB2, NOP56, ARRB1, DOT1L, NPM1, TOP1, XBP1, RRP1B (tumor) | H1FX, SIRT7, CAND1, UBC, KIAA0101, CUL1, HDGF, ARRB2, NOP56, ARRB1, DOT1L, NPM1, TOP1, XBP1, RRP1B (normal) |
 |  |
| Top |
| TissGeneProg for H1FX |
| Kaplan-Meier plots with logrank tests of overall survival (OS) using 28 cancer types (TCGA IlluminaHiSeq_RNASeqV2, pan-cancer normalized log2(norm_counts+1) data, version 2016-08-16) (TCGA clinicalMatrix, phenotype data, version 2016-04-27) * Click on the image to enlarge it in a new window. |
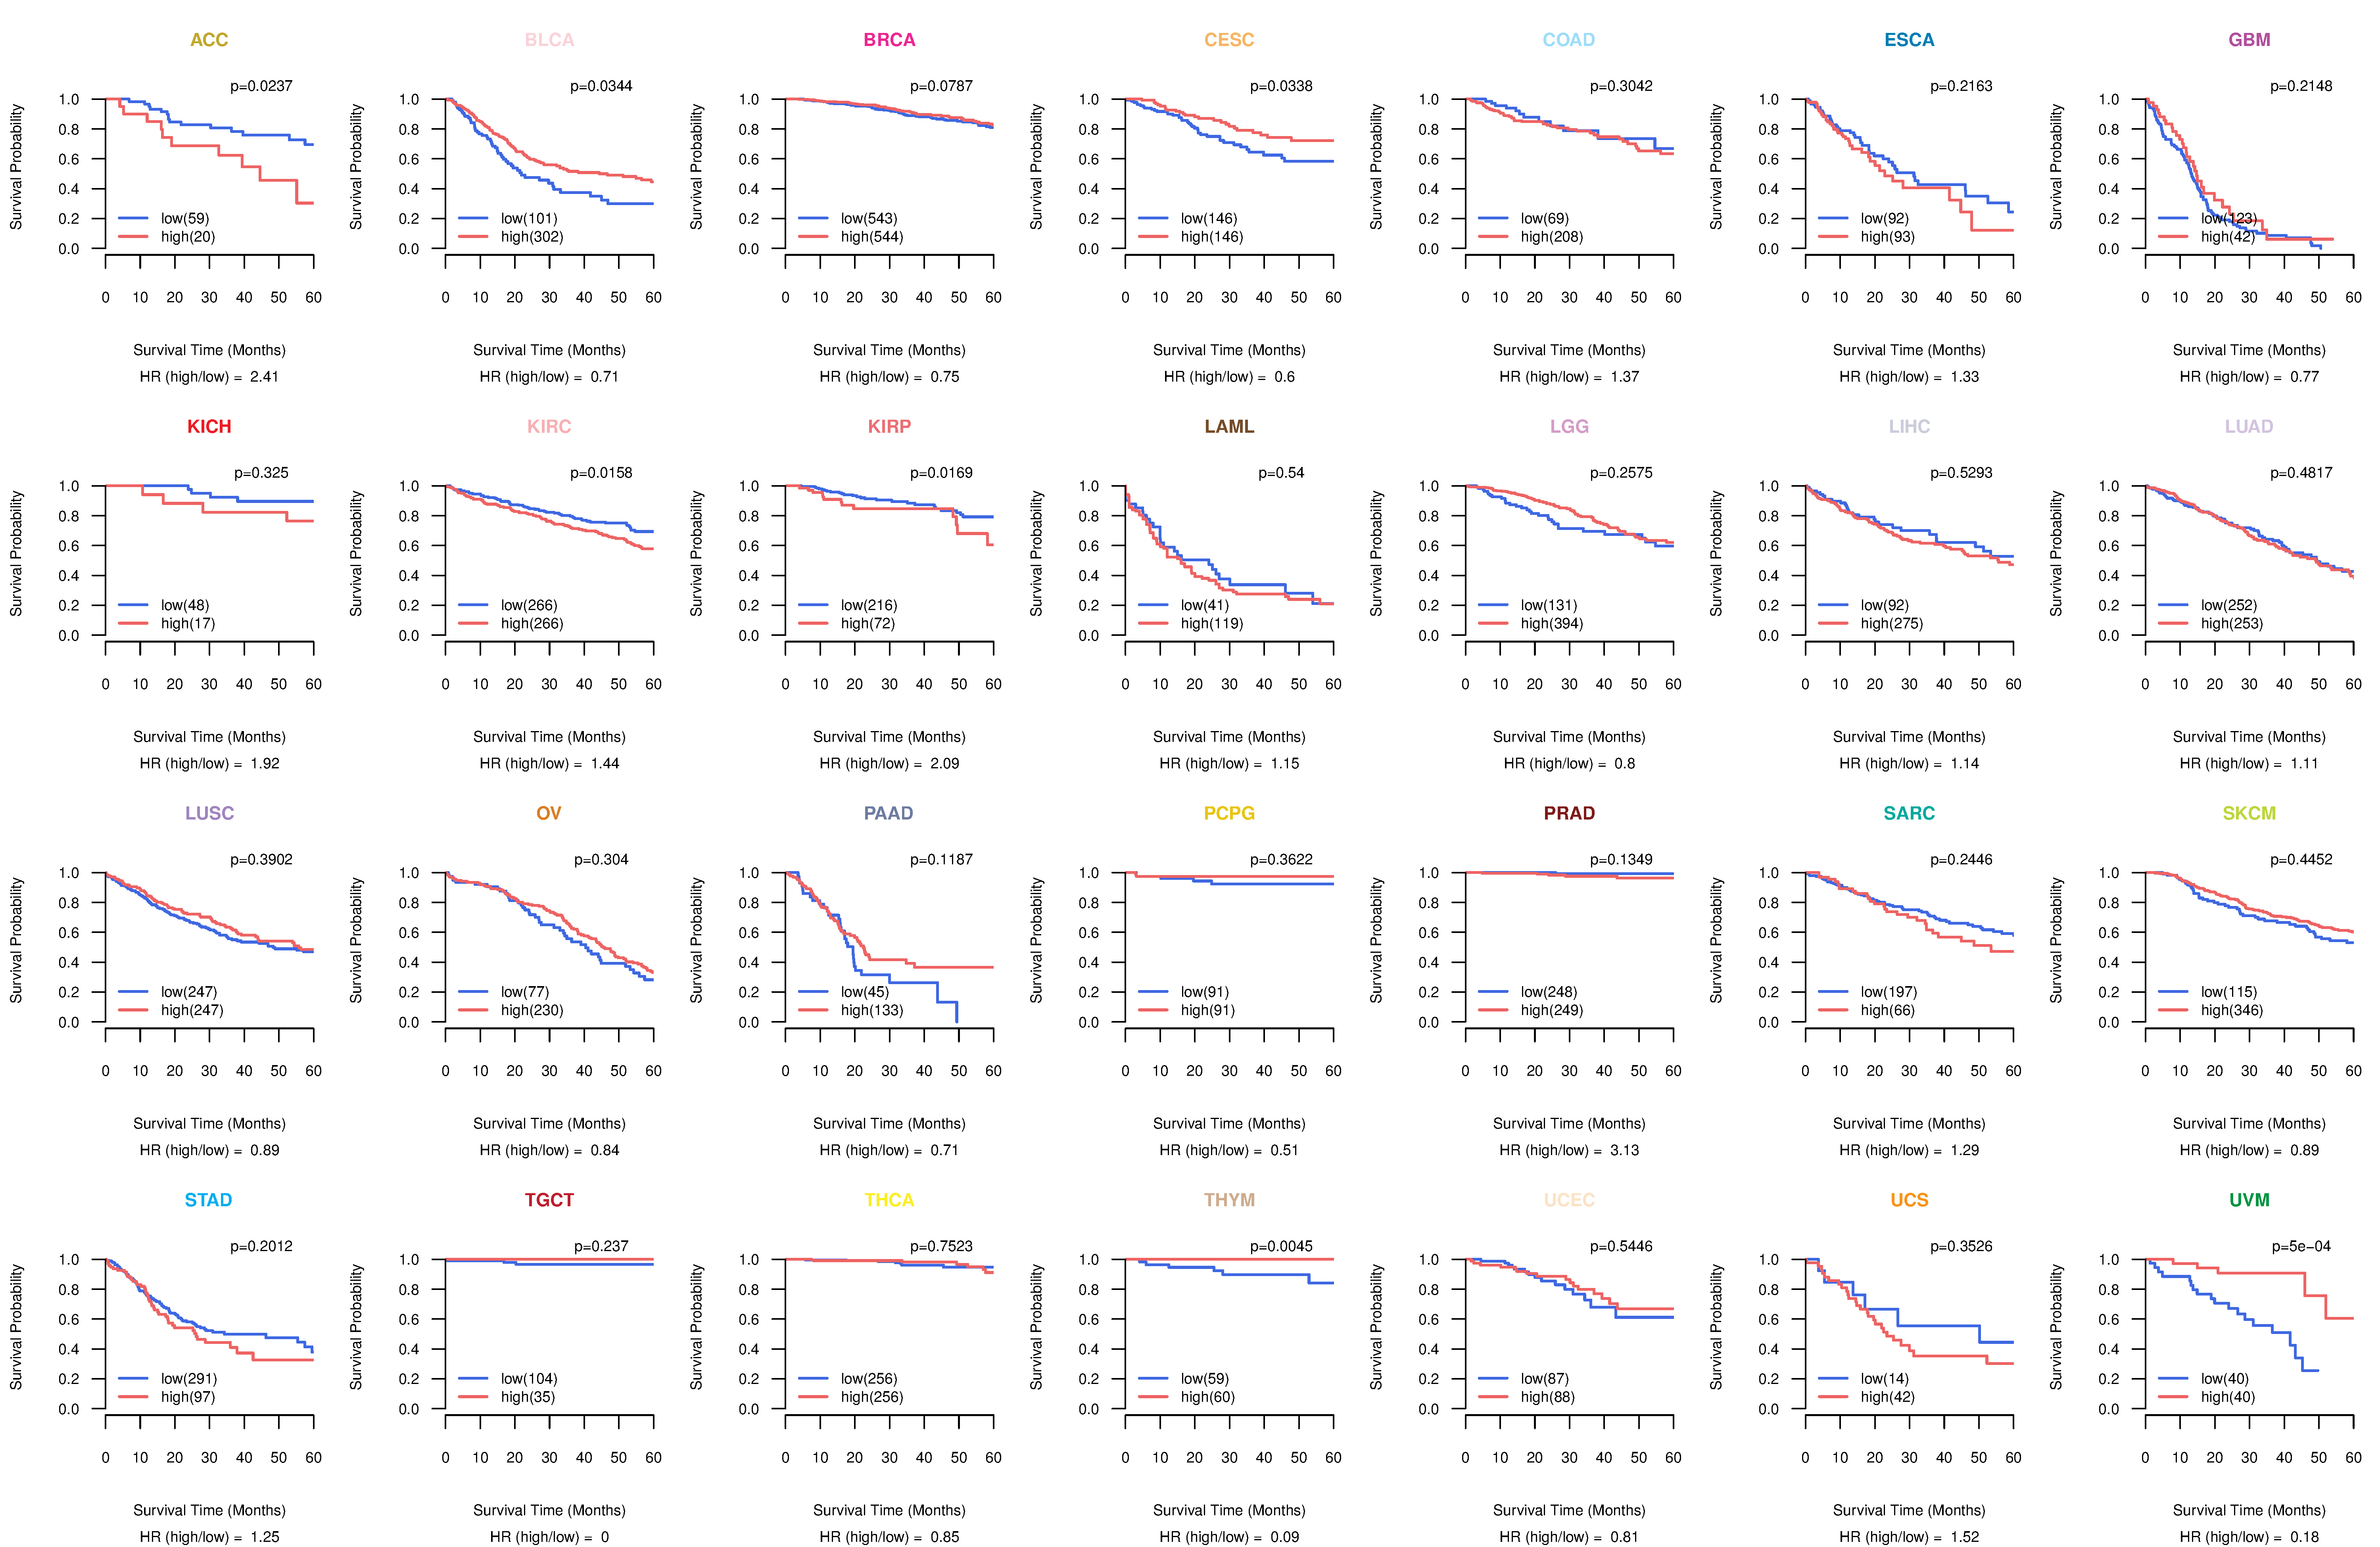 |
| Kaplan-Meier plots with logrank test of relapse free survival (RFS) using 28 cancer types (TCGA IlluminaHiSeq_RNASeqV2, pan-cancer normalized log2(norm_counts+1) data, version 2016-08-16) (TCGA clinicalMatrix, phenotype data, version 2016-04-27) * Click on the image enlarge it in a new window. |
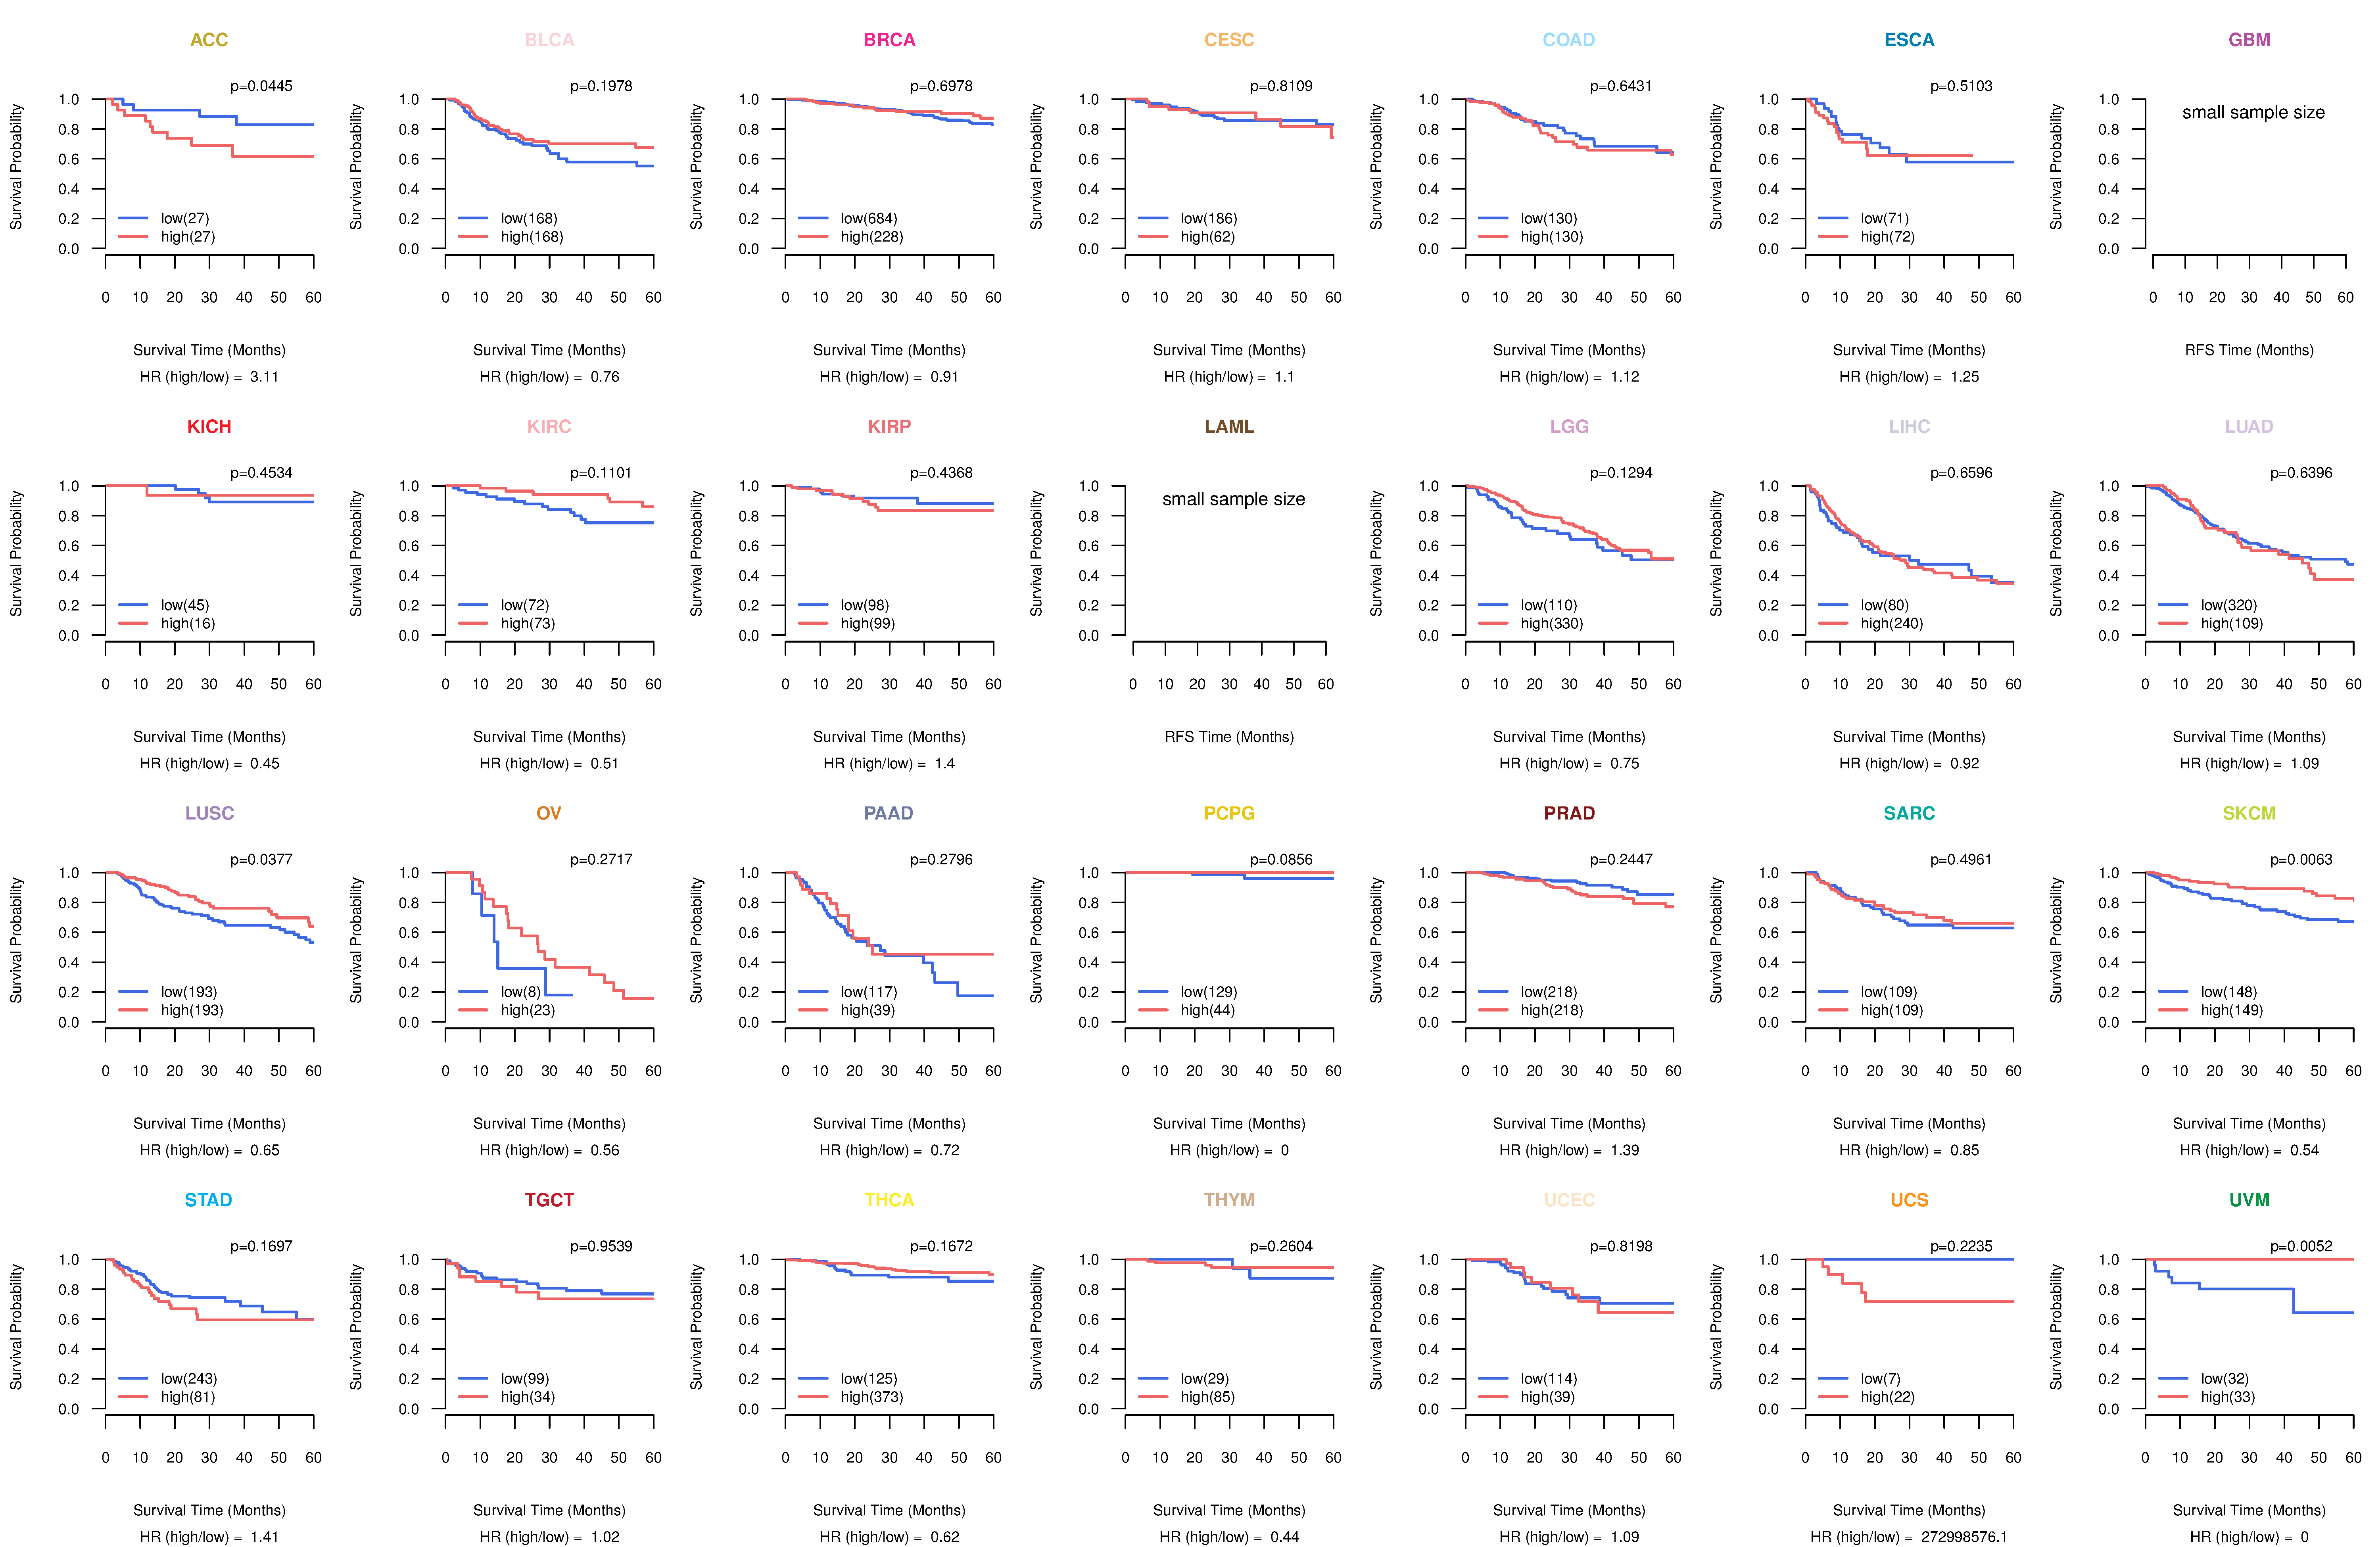 |
| Forest plot of Cox proportional hazard ratio (HR) and 95% CI of overall survival (OS) using 28 cancer types (TCGA IlluminaHiSeq_RNASeqV2, pan-cancer normalized log2(norm_counts+1) data, version 2016-08-16) (TCGA clinicalMatrix, phenotype data, version 2016-04-27) * Click on the image enlarge it in a new window. |
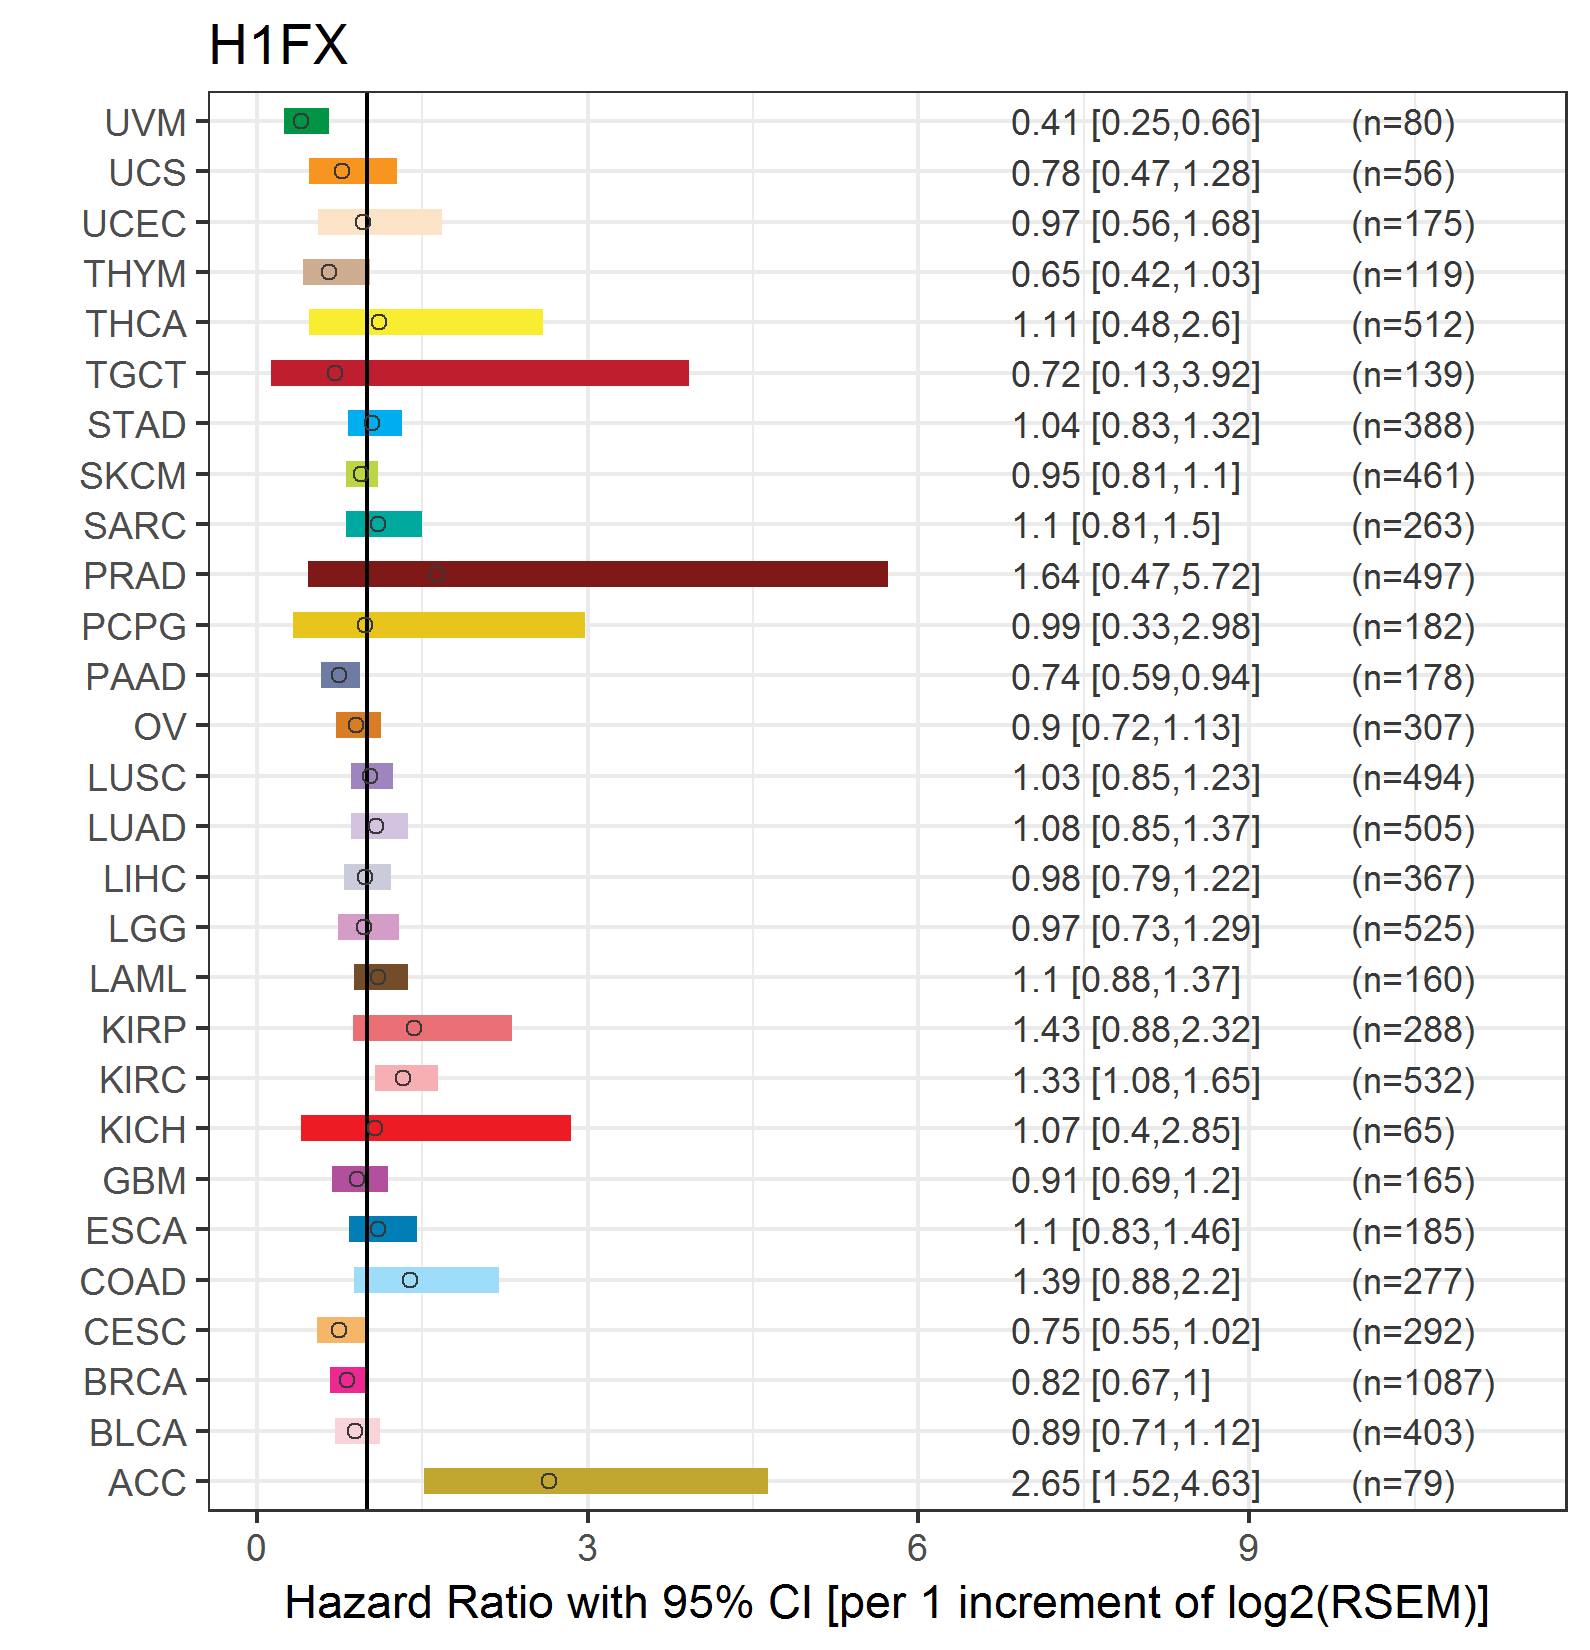 |
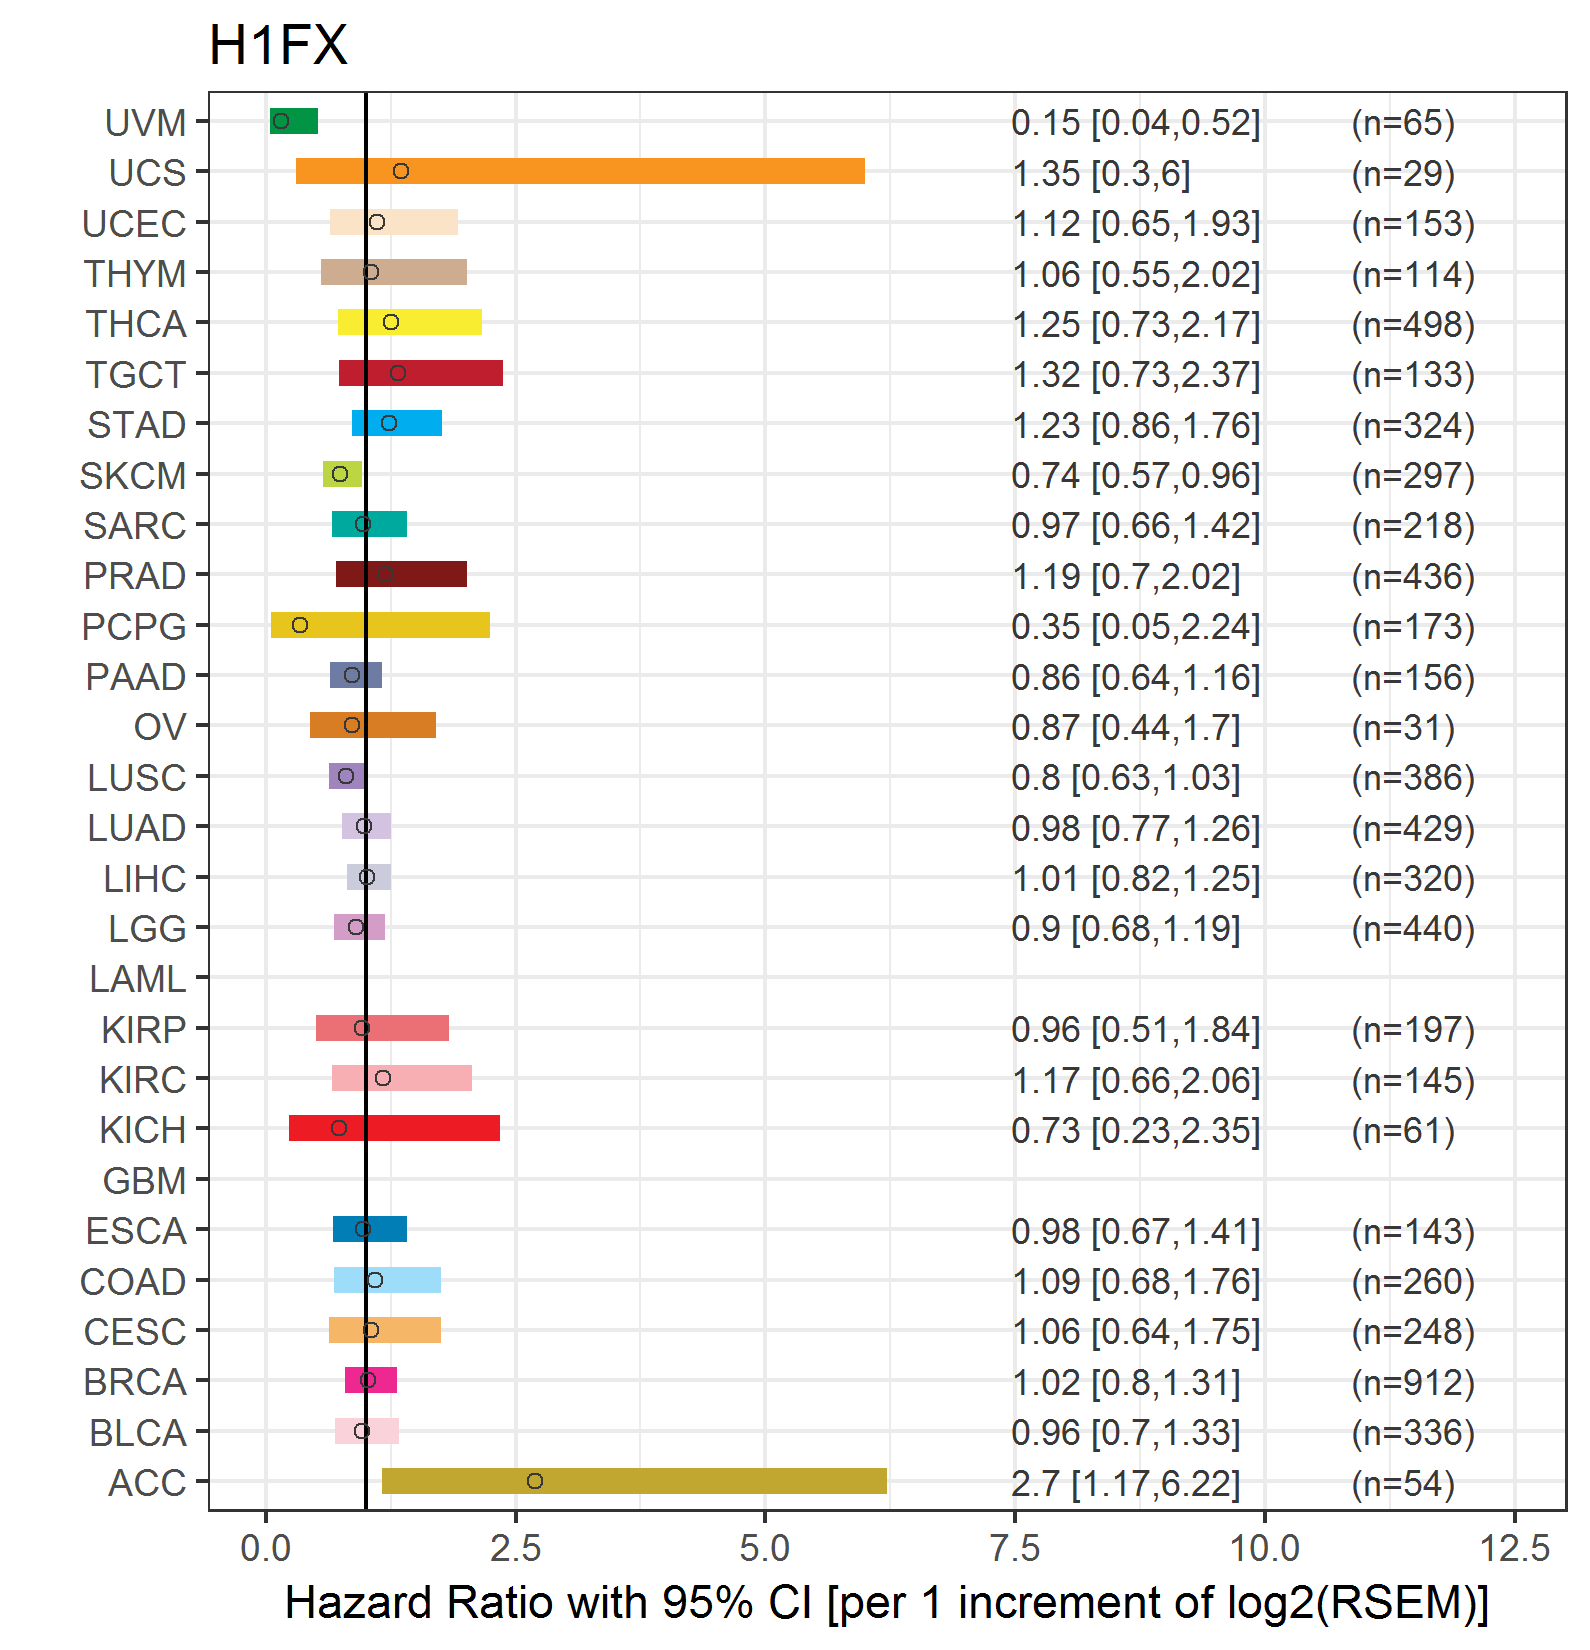
| Forest plot of Cox proportional hazard ratio (HR) and 95% CI of relapse free survival (RFS) using 28 cancer types (TCGA IlluminaHiSeq_RNASeqV2, pan-cancer normalized log2(norm_counts+1) data, version 2016-08-16) (TCGA clinicalMatrix, phenotype data, version 2016-04-27) * Click on the image enlarge it in a new window. |
 |
| Top |
| TissGeneClin for H1FX |
| TissGeneDrug for H1FX |
| Drug information targeting TissGene (DrugBank Version 5.0.6, 2017-04-01) |
| DrugBank ID | Drug name | Drug activity | Drug type | Drug status |
| Top |
| TissGeneDisease for H1FX |
| Disease information associated with TissGene (DisGeNet, 2016-06-01) |
| Disease ID | Disease name | # pubmeds | Source |
| umls:C0206754 | Neuroendocrine Tumors | 1 | BeFree |
|
Copyright 2016-Present - The University of Texas Health Science Center at Houston (UTHealth) Web File Viewing | How to Report, Fraud, Waste and Abuse | State of Texas | Statewide Search | Texas Homeland Security | Site Policies |