 |
| |
| |
| |
| |
| |
| |
|

| TissGeneSummary for RSPH1 |
 Gene summary Gene summary |
| Basic gene information | Gene symbol | RSPH1 |
| Gene name | radial spoke head 1 homolog (Chlamydomonas) | |
| Synonyms | CT79|RSP44|RSPH10A|TSA2|TSGA2 | |
| Cytomap | UCSC genome browser: 21q22.3 | |
| Type of gene | protein-coding | |
| RefGenes | NM_001286506.1, NM_080860.3, | |
| Description | cancer/testis antigen 79male meiotic metaphase chromosome-associated acidic proteinmeichroacidinradial spoke head 1 homologtestes specific gene A2 homologtestis specific A2 homolog | |
| Modification date | 20141207 | |
| dbXrefs | MIM : 609314 | |
| HGNC : HGNC | ||
| Ensembl : ENSG00000160188 | ||
| HPRD : 11651 | ||
| Vega : OTTHUMG00000086804 | ||
| Protein | UniProt: go to UniProt's Cross Reference DB Table | |
| Expression | CleanEX: HS_RSPH1 | |
| BioGPS: 89765 | ||
| Pathway | NCI Pathway Interaction Database: RSPH1 | |
| KEGG: RSPH1 | ||
| REACTOME: RSPH1 | ||
| Pathway Commons: RSPH1 | ||
| Context | iHOP: RSPH1 | |
| ligand binding site mutation search in PubMed: RSPH1 | ||
| UCL Cancer Institute: RSPH1 | ||
| Assigned class in TissGDB* | C | |
| Included tissue-specific gene expression resources | TiGER,GTEx | |
| Specific-tissues in normal samples (assigned by TissGDB using HPA, TiGER, and GTEx) | PancreasTestis | |
| Cancer types related to the specific-tissues in cancer samples (assigned by TissGDB using TCGA) | PAADTGCT | |
| Reference showing the relevant tissue of RSPH1 | ||
| Description by TissGene annotations | ||
| * Class A consists of genes with literature evidence and is part of the cTissGenes. Class B consists of only cTissGenes without additional evidence. The remaining genes belong to Class C. |
| Gene ontology having evidence of Inferred from Direct Assay (IDA) from Entrez |
| GO ID | GO term | PubMed ID |
| Top |
| TissGeneExp for RSPH1 |
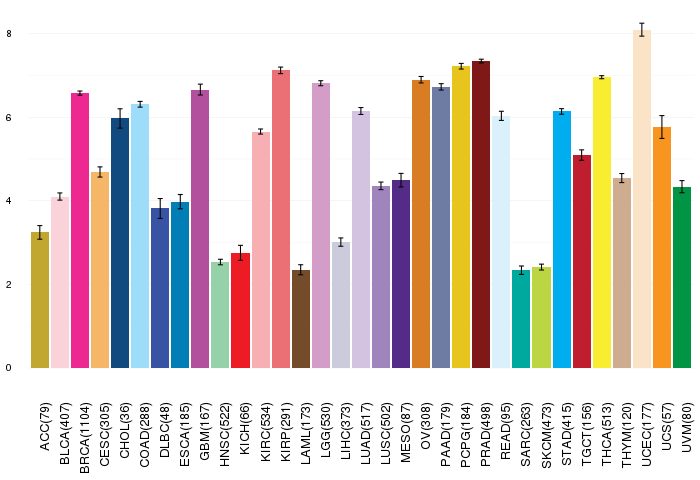
| Gene expressions across 28 cancer types (X-axis: cancer type and Y-axis: log2(norm_counts+1)) (TCGA IlluminaHiSeq_RNASeqV2, pan-cancer normalized log2(norm_counts+1) data, version 2016-08-16) |
 |
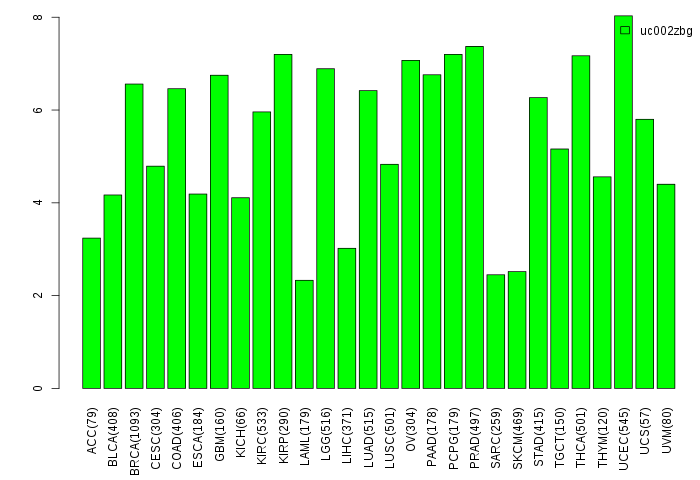
| Gene isoform expressions across 28 cancer types (X-axis: cancer type and Y-axis: log2(norm_counts+1)) (TCGA pan-cancer tcga_rsem_isoform_tpm, version 2016-09-01) |
 |
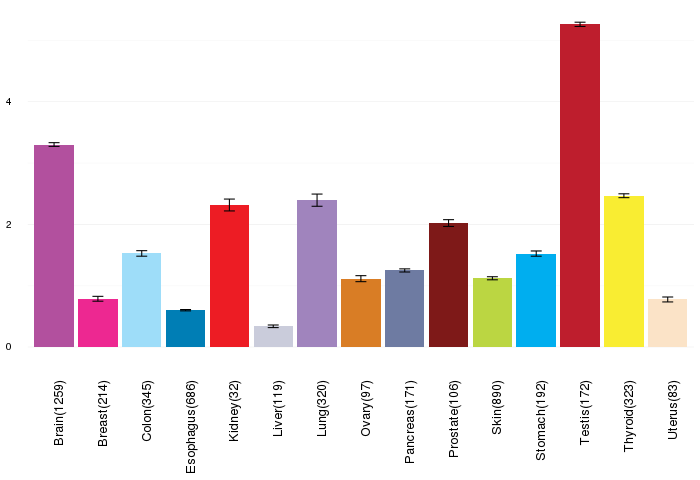
| Gene expressions across normal tissues of GTEx data (GTEx GTEx_Analysis_v6_RNA-seq_RNA-SeQCv1.1.8_gene_rpkm.gct) - Here, we shows the matched tissue types only among our 28 cancer types. |
 |
| Different expressions across 14 cancer types with more than 10 samples between matched tumors and normals (X-axis: cancer type and Y-axis: log2(norm_counts+1)) (TCGA IlluminaHiSeq_RNASeqV2, pan-cancer normalized log2(norm_counts+1) data, version 2016-08-16) |
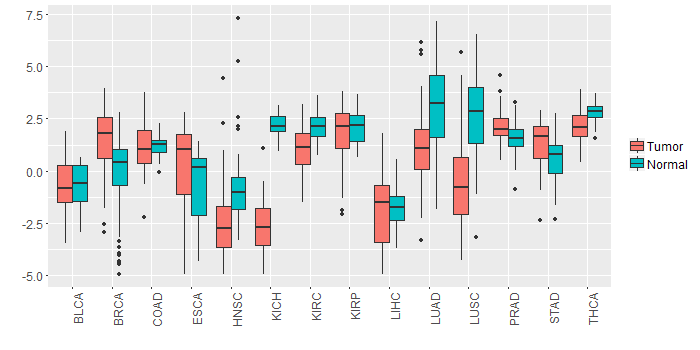 |
| - Significantly differentially expressed cancer types and information. (|Fold change|>1 and FDR<0.05) |
| Cancer type | Mean(exp) in tumor | Mean(exp) in matched normal | Log2FC | P-val. | FDR |
| KIRC | 1.002862714 | 2.117250214 | -1.1143875 | 1.98E-11 | 7.52E-11 |
| BRCA | 1.472817173 | -0.107988968 | 1.58080614 | 1.50E-12 | 6.63E-12 |
| KICH | -2.618848897 | 2.134495103 | -4.753344 | 1.39E-16 | 4.25E-15 |
| LUSC | -0.665402074 | 2.709380279 | -3.374782353 | 7.01E-12 | 2.97E-11 |
| LUAD | 1.156844275 | 2.939680482 | -1.782836207 | 9.35E-06 | 2.74E-05 |
| HNSC | -2.336479502 | -0.651307409 | -1.685172093 | 0.000186 | 0.000766484 |
| Top |
| TissGene-miRNA for RSPH1 |
| Significantly anti-correlated miRNAs of TissGene across 28 cancer types (Gene-miRNA relations from TargetScanHuman Relsease 7.1, Conserved_Site_Context_Scores.txt.zip, 06.01.2016) (TCGA IlluminaHiSeq_miRNASeq, log2(RPM+1) data, version 2016-11-21) (TCGA IlluminaHiSeq_RNASeqV2, log2(normalized_count+1) data, version 2016-08-16) (Spearman’s Rank Correlation (p-value<0.05 and coefficient<-0.25)) |
| Cancer type | miRNA id | miRNA accession | P-val. | Coeff. | # samples |
| Top |
| TissGeneMut for RSPH1 |
| TissGeneSNV for RSPH1 |
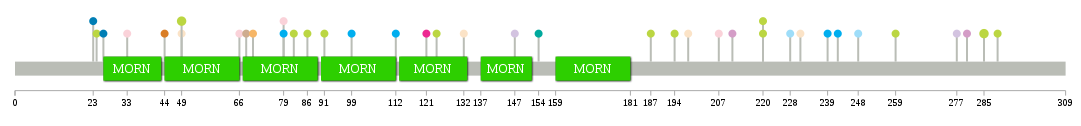
| nsSNV counts per each loci. Different colors of circles represent different cancer types. Circle size denotes number of samples. (TCGA somatic mutation (SNPs and small INDELs) data, version 2016-04-25) * Click on the image to enlarge it in a new window. |
 |
 |
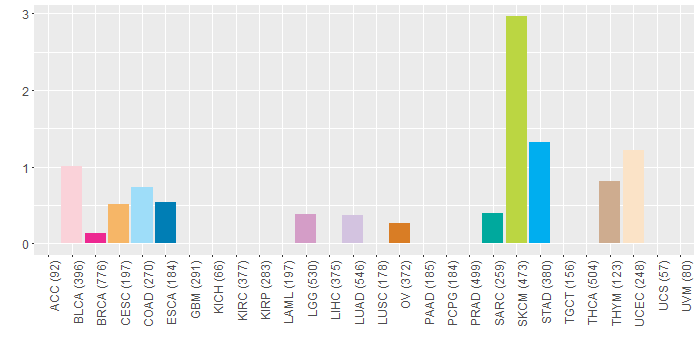
| Somatic nucleotide variants of TissGene across 28 cancer types (X-axis: cancer type and Y-axis: % of mutated samples) The numbers in parentheses are numbers of samples with mutation (nsSNVs). (TCGA somatic mutation (SNPs and small INDELs) data, version 2016-04-25) |
 |
| - nsSNVs sorted by frequency. |
| AAchange | Cancer type | # samples |
| p.E49K | SKCM | 2 |
| p.D232N | HNSC | 2 |
| p.E285K | SKCM | 2 |
| p.W220* | SKCM | 1 |
| p.G194R | SKCM | 1 |
| p.R33H | BLCA | 1 |
| p.T112I | STAD | 1 |
| p.R66Q | BLCA | 1 |
| p.E147D | LUAD | 1 |
| p.A211S | LGG | 1 |
| p.P239L | STAD | 1 |
| p.G124E | SKCM | 1 |
| p.P228L | COAD | 1 |
| p.E198D | UCEC | 1 |
| p.T81I | HNSC | 1 |
| p.I68N | THYM | 1 |
| p.E91K | SKCM | 1 |
| p.E277* | LUAD | 1 |
| p.G23D | ESCA | 1 |
| p.Y44* | OV | 1 |
| p.E259K | SKCM | 1 |
| p.T231M | UCEC | 1 |
| p.E70Q | CESC | 1 |
| p.F82I | SKCM | 1 |
| p.Q121E | BRCA | 1 |
| p.R187C | SKCM | 1 |
| p.W220X | SKCM | 1 |
| p.E49K | UCEC | 1 |
| p.E280D | LGG | 1 |
| p.R99Q | STAD | 1 |
| p.Q79E | BLCA | 1 |
| p.P207L | BLCA | 1 |
| p.E242G | STAD | 1 |
| p.E132K | UCEC | 1 |
| p.D86E | SKCM | 1 |
| p.E26D | ESCA | 1 |
| p.H154R | SARC | 1 |
| p.D289N | SKCM | 1 |
| p.G248R | COAD | 1 |
| p.R53I | READ | 1 |
| p.Q79E | STAD | 1 |
| p.R24W | SKCM | 1 |
| Top |
| TissGeneCNV for RSPH1 |
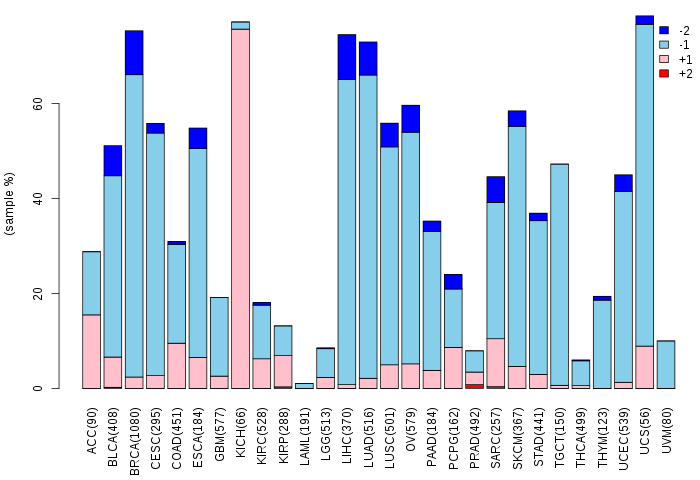
| Copy number variations of TissGene across 28 cancer types (X-axis: cancer type and Y-axis: % of CNV samples) (TCGA Gistic2_CopyNumber_Gistic2_all_data_by_genes, Gistic2 copy number data, version 2016-08-16) |
 |
| Top |
| TissGeneFusions for RSPH1 |
| Fusion genes including TissGene (ChimerDB 3.0, 2016-12-01 and TCGA fusion Portal 2015-12-01) |
| Database | Src | Cancer type | Sample | Fusion gene | ORF | 5'-gene BP | 3'-gene BP |
| Top |
| TissGeneNet for RSPH1 |
| Co-expressed gene networks based on protein-protein interaction data (CePIN) (TCGA IlluminaHiSeq_RNASeqV2, pan-cancer normalized log2(norm_counts+1) data, version 2016-08-16) (PINA2 ppi data) |
| Top |
| TissGeneProg for RSPH1 |
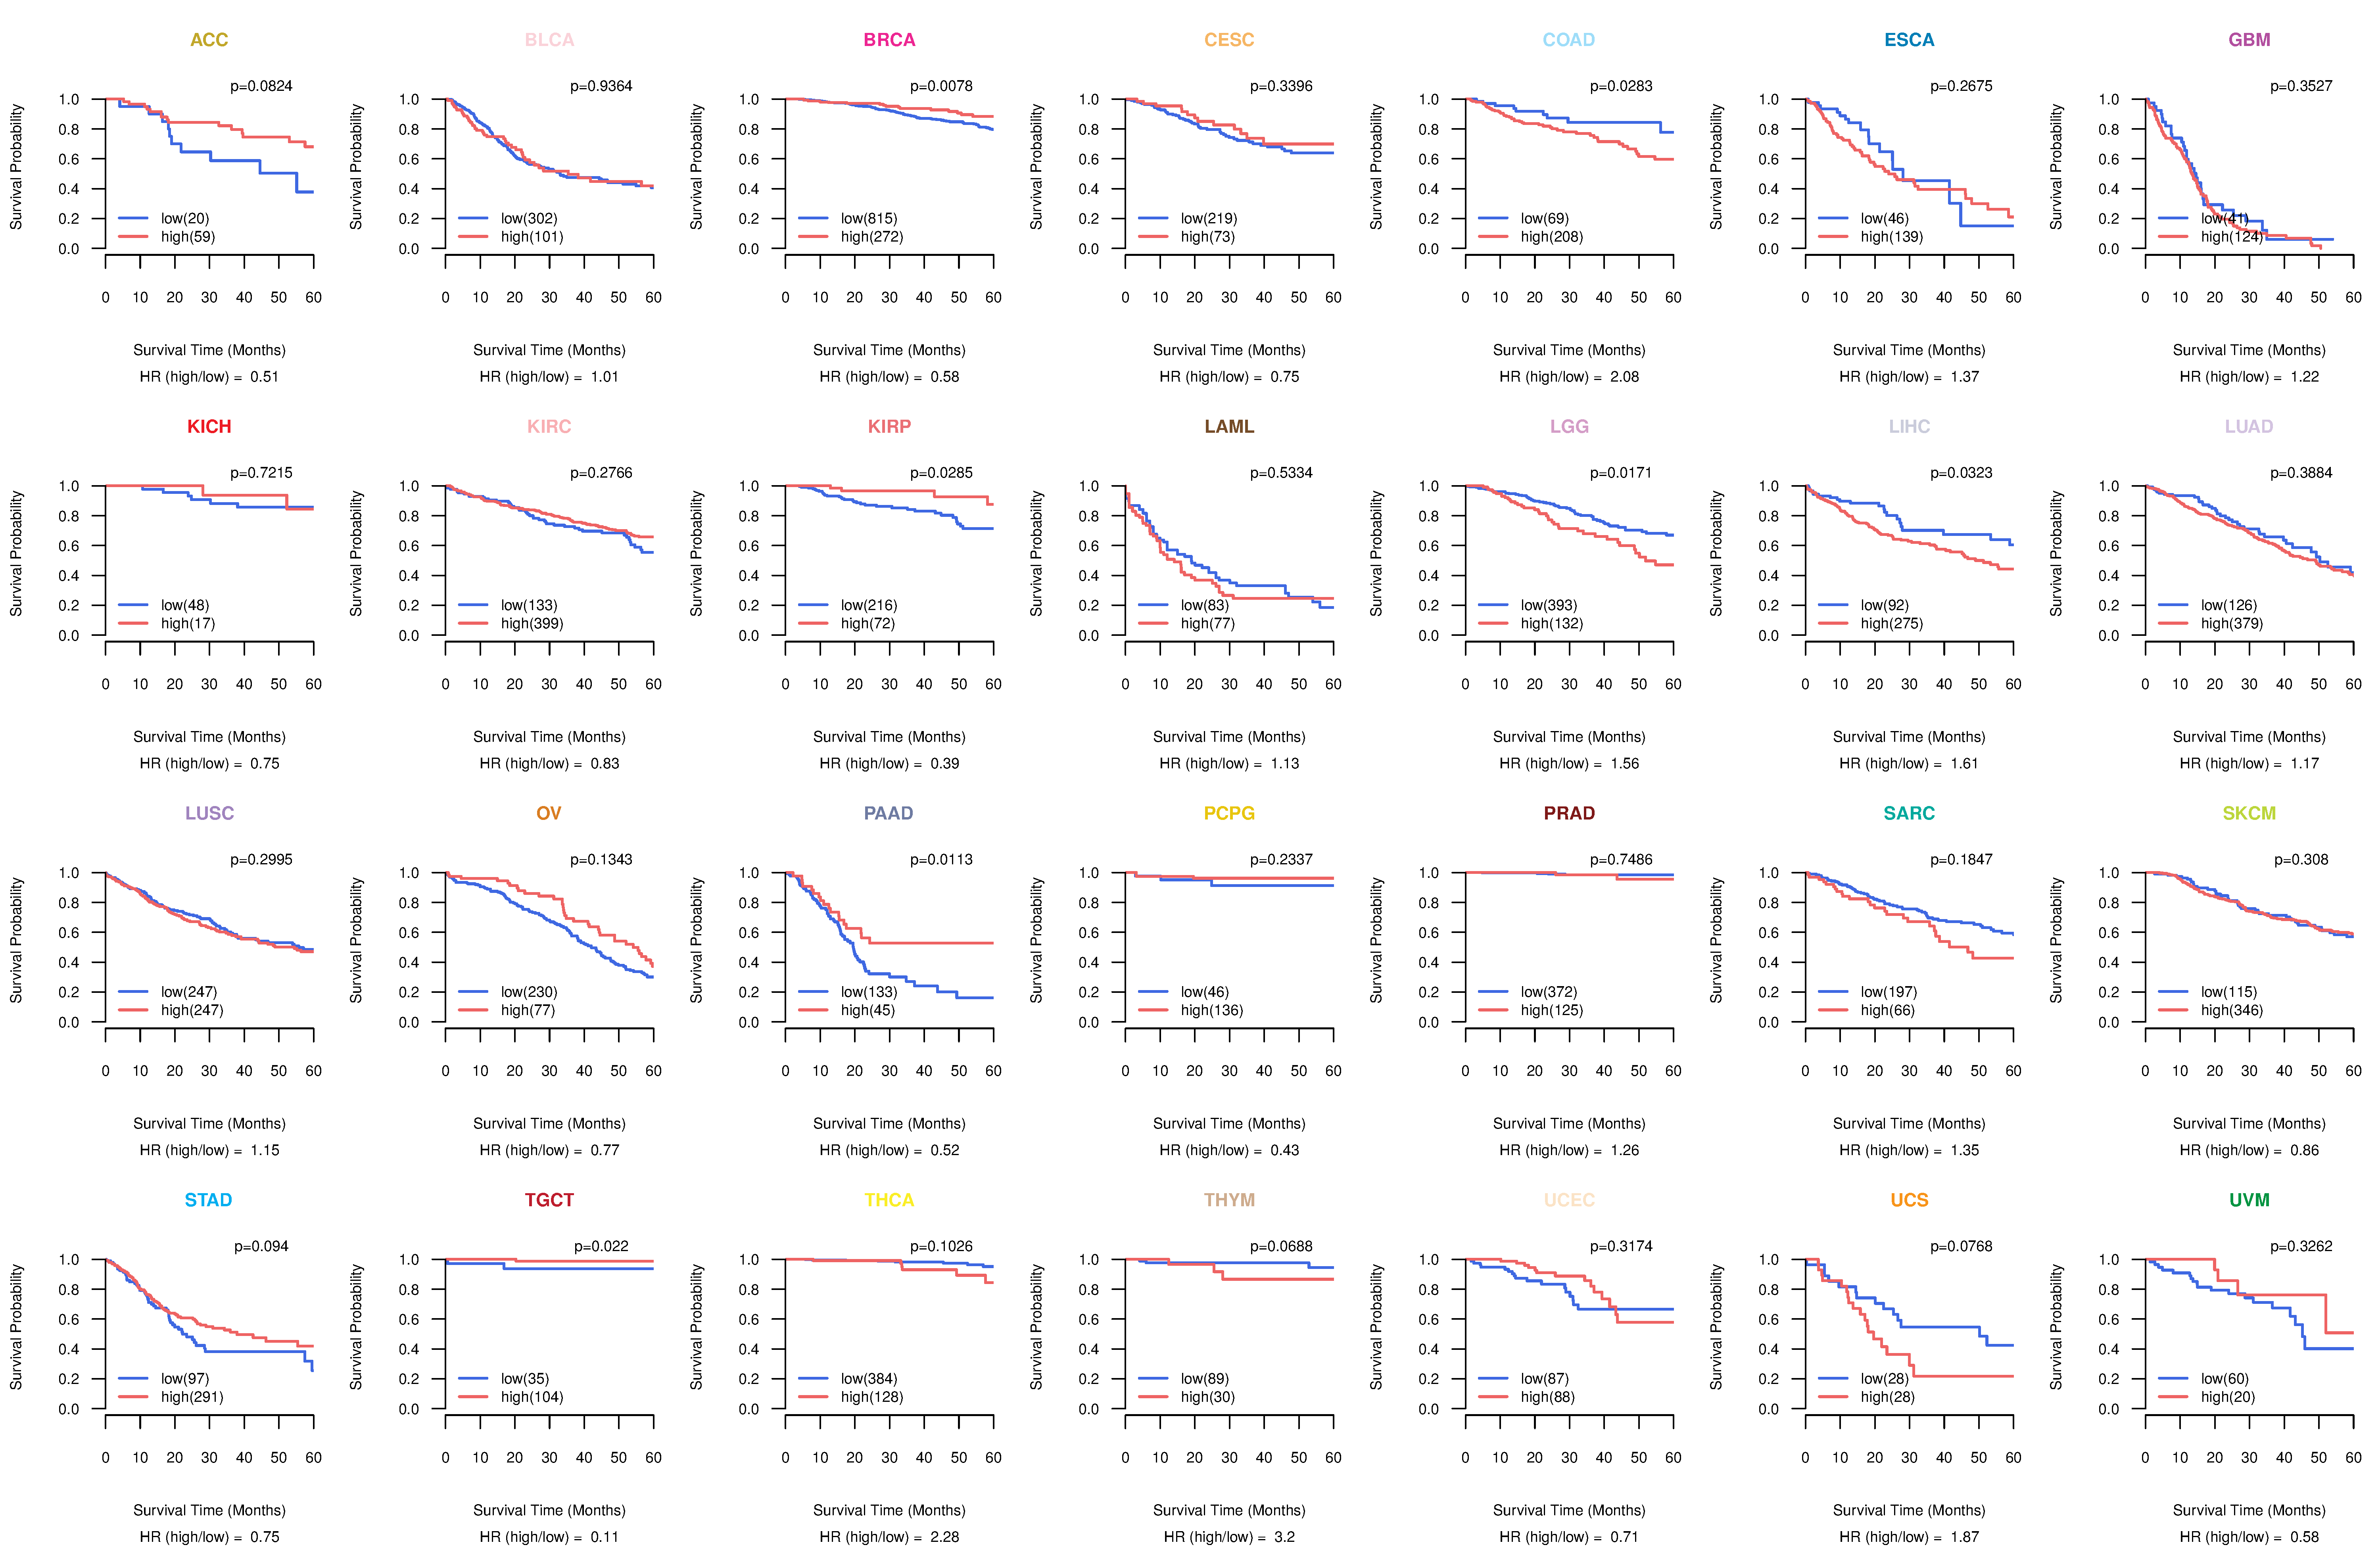
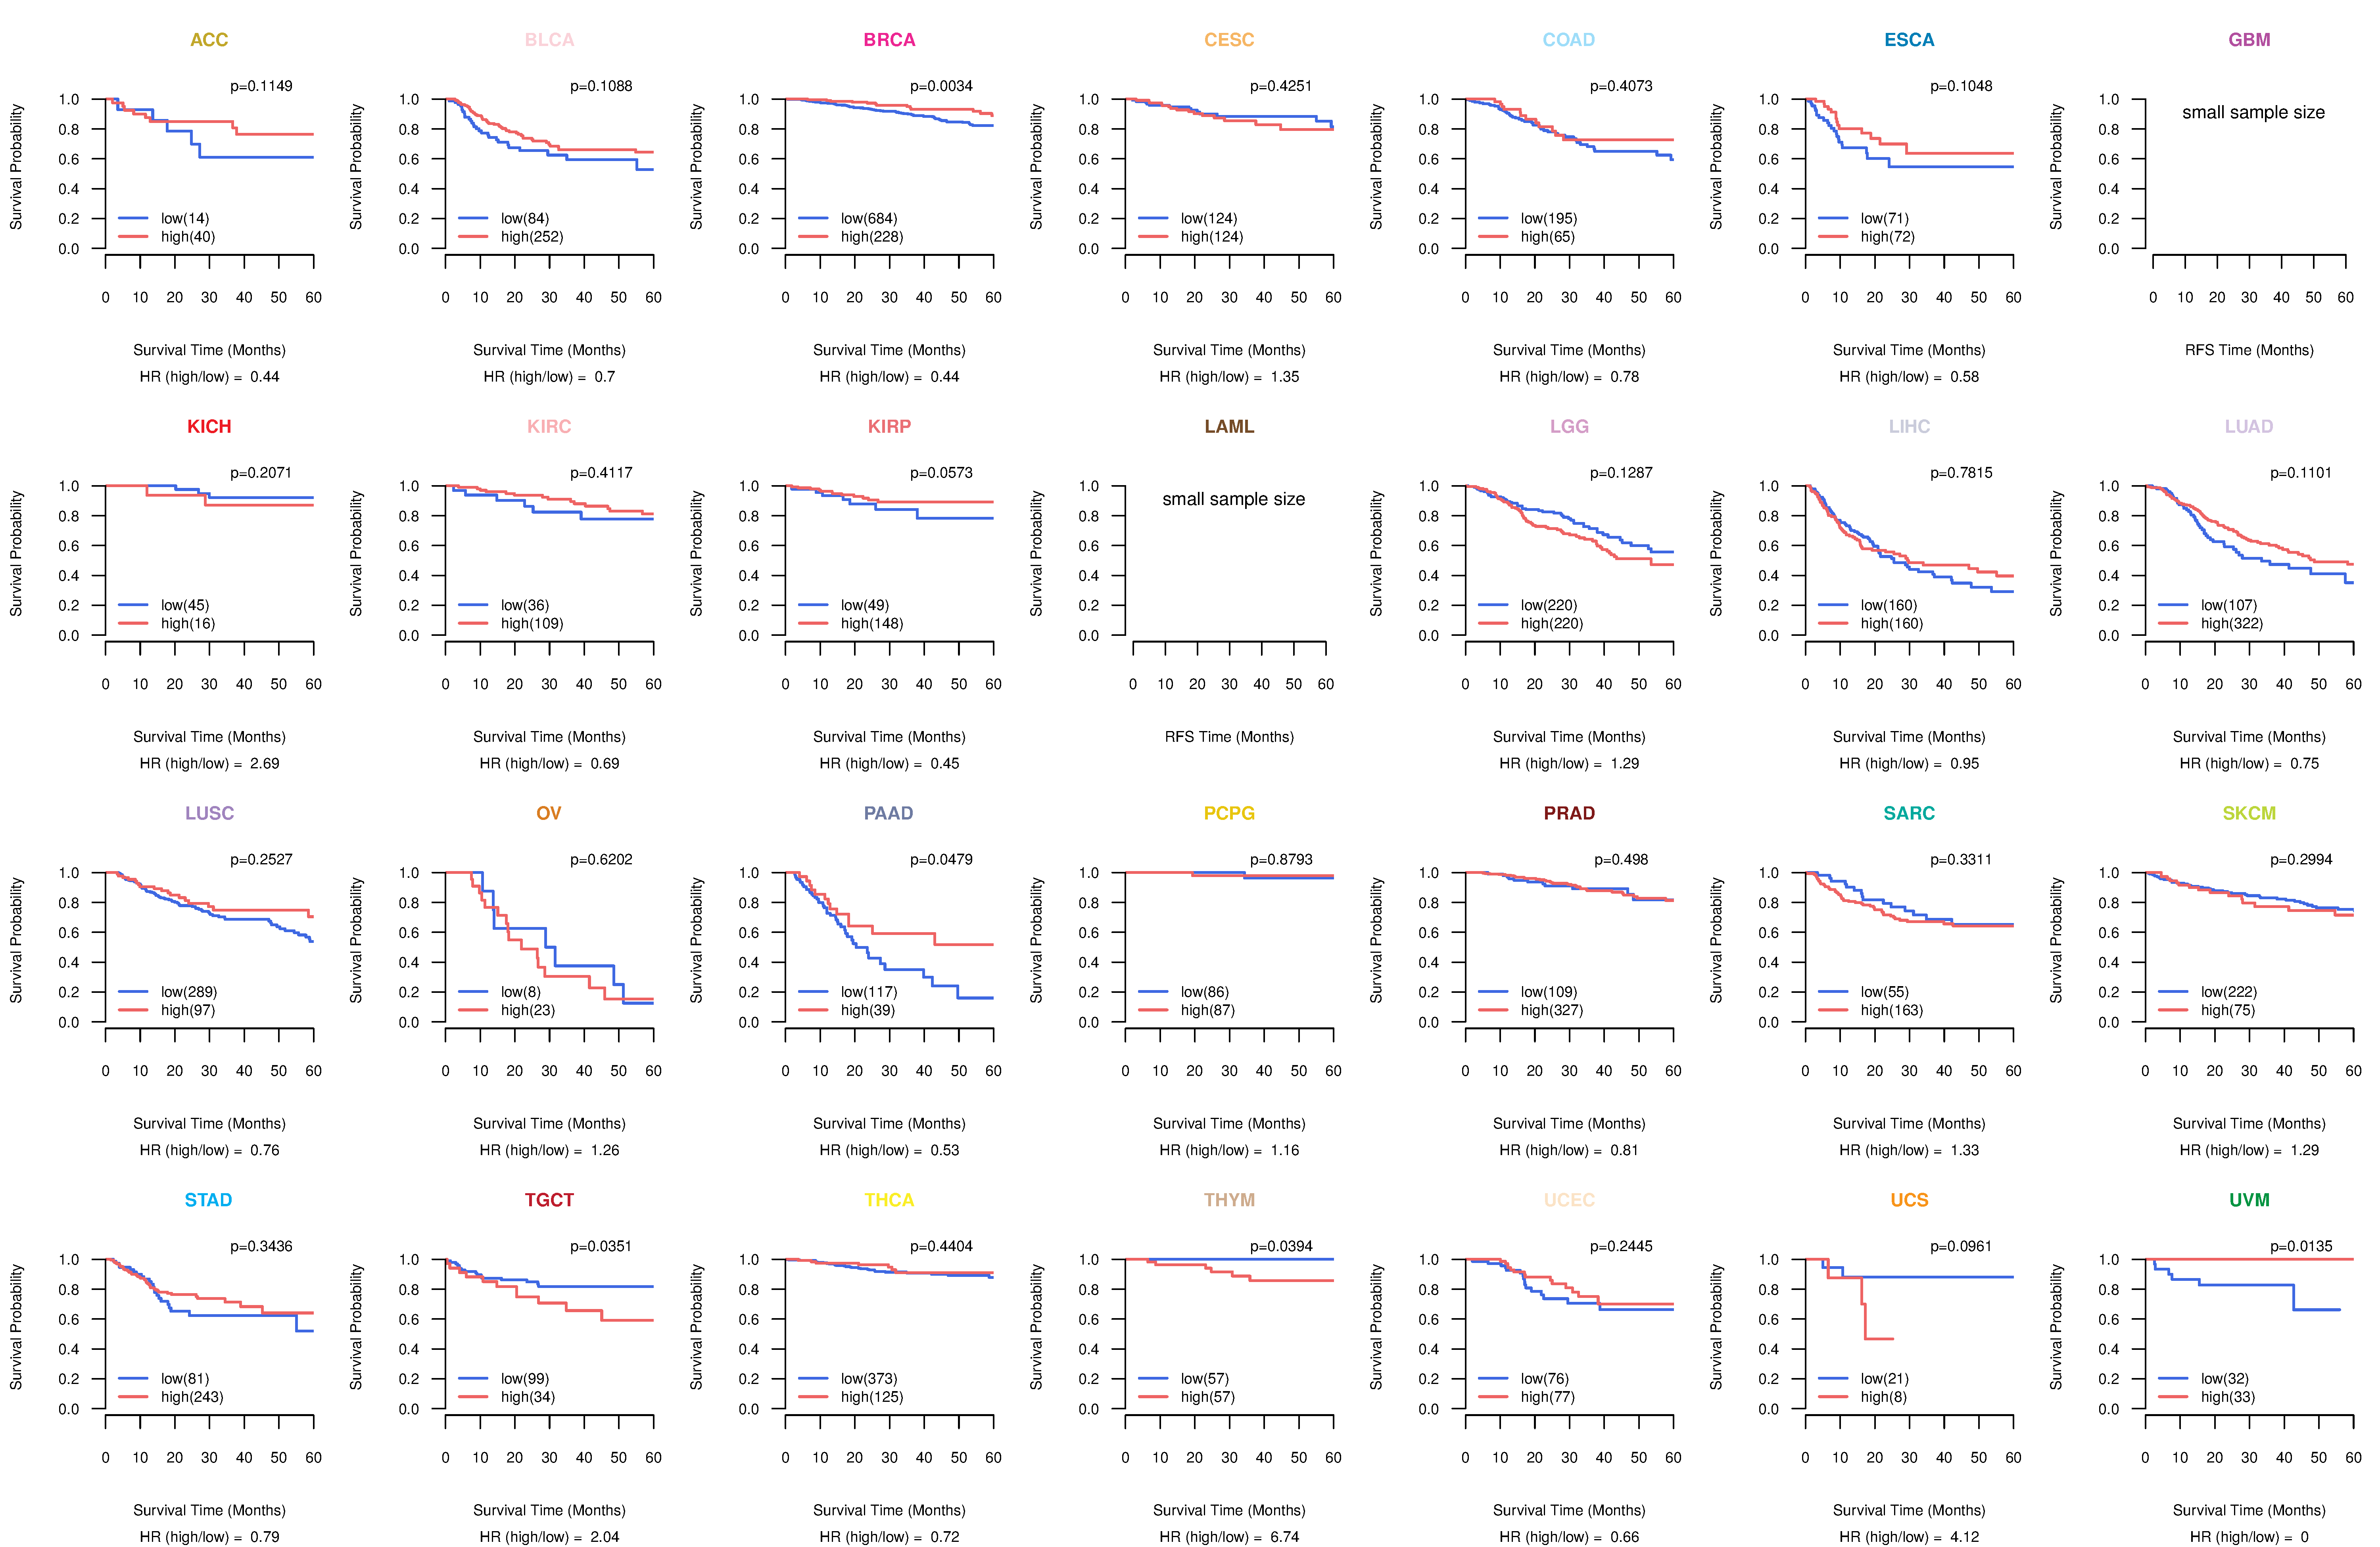
| Kaplan-Meier plots with logrank tests of overall survival (OS) using 28 cancer types (TCGA IlluminaHiSeq_RNASeqV2, pan-cancer normalized log2(norm_counts+1) data, version 2016-08-16) (TCGA clinicalMatrix, phenotype data, version 2016-04-27) * Click on the image to enlarge it in a new window. |
 |
| Kaplan-Meier plots with logrank test of relapse free survival (RFS) using 28 cancer types (TCGA IlluminaHiSeq_RNASeqV2, pan-cancer normalized log2(norm_counts+1) data, version 2016-08-16) (TCGA clinicalMatrix, phenotype data, version 2016-04-27) * Click on the image enlarge it in a new window. |
 |
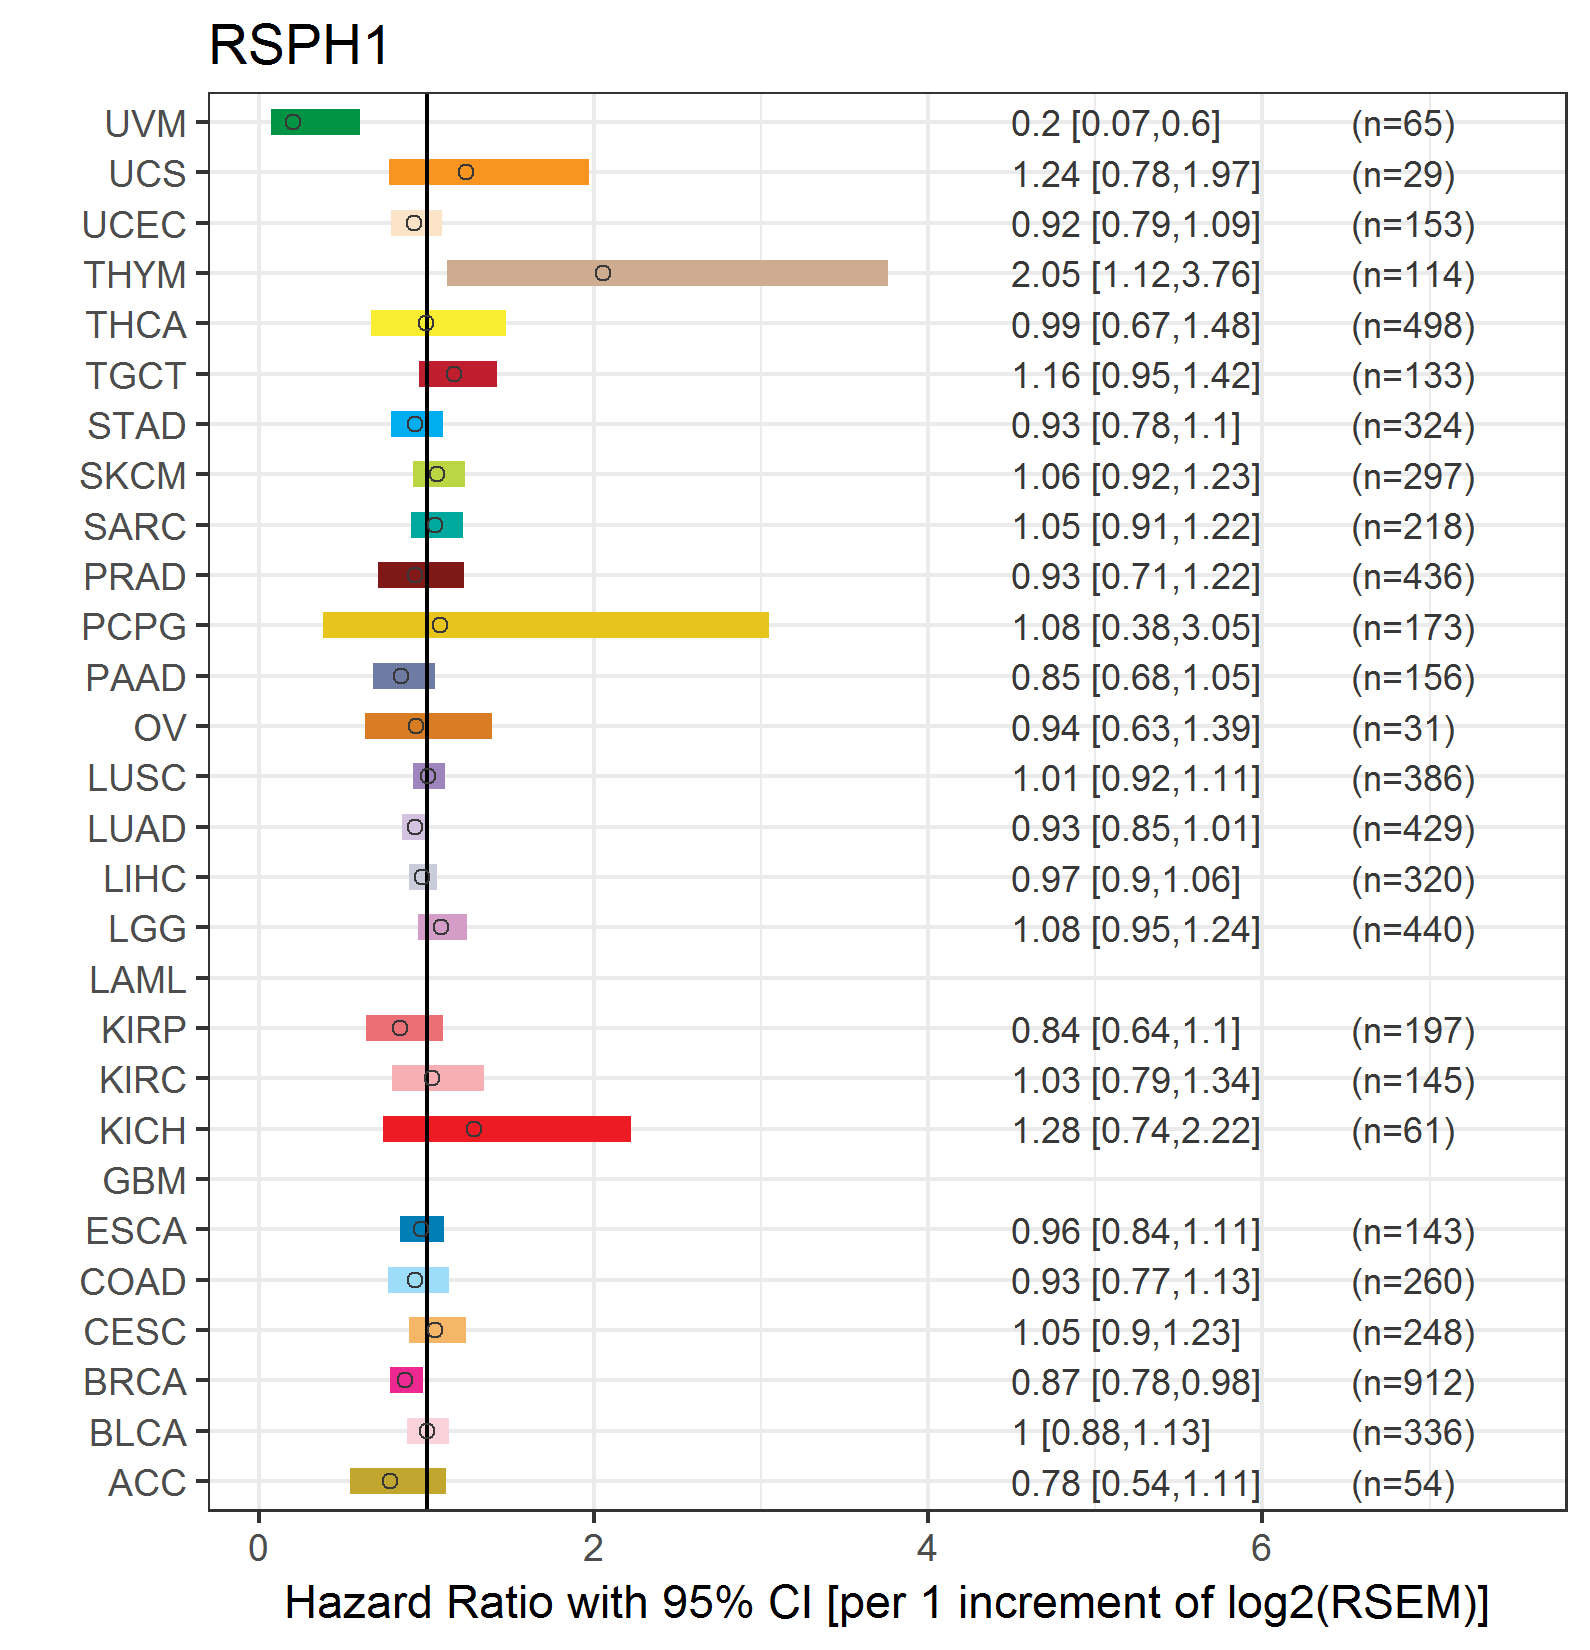
| Forest plot of Cox proportional hazard ratio (HR) and 95% CI of overall survival (OS) using 28 cancer types (TCGA IlluminaHiSeq_RNASeqV2, pan-cancer normalized log2(norm_counts+1) data, version 2016-08-16) (TCGA clinicalMatrix, phenotype data, version 2016-04-27) * Click on the image enlarge it in a new window. |
 |
| Forest plot of Cox proportional hazard ratio (HR) and 95% CI of relapse free survival (RFS) using 28 cancer types (TCGA IlluminaHiSeq_RNASeqV2, pan-cancer normalized log2(norm_counts+1) data, version 2016-08-16) (TCGA clinicalMatrix, phenotype data, version 2016-04-27) * Click on the image enlarge it in a new window. |
 |
| Top |
| TissGeneClin for RSPH1 |
| TissGeneDrug for RSPH1 |
| Drug information targeting TissGene (DrugBank Version 5.0.6, 2017-04-01) |
| DrugBank ID | Drug name | Drug activity | Drug type | Drug status |
| Top |
| TissGeneDisease for RSPH1 |
| Disease information associated with TissGene (DisGeNet, 2016-06-01) |
| Disease ID | Disease name | # pubmeds | Source |
| umls:C0022521 | Kartagener Syndrome | 5 | BeFree,CLINVAR |
| umls:C0008780 | Ciliary Motility Disorders | 4 | BeFree |
| umls:C0239134 | Productive cough | 1 | BeFree |
| umls:C0339985 | Idiopathic bronchiectasis | 1 | BeFree |
| umls:C0852283 | Respiratory Distress Syndrome | 1 | BeFree |
| umls:C3809634 | CILIARY DYSKINESIA, PRIMARY, 24 | 1 | CLINVAR,UNIPROT |
|
Copyright 2016-Present - The University of Texas Health Science Center at Houston (UTHealth) Web File Viewing | How to Report, Fraud, Waste and Abuse | State of Texas | Statewide Search | Texas Homeland Security | Site Policies |