 |
| |
| |
| |
| |
| |
| |
|

| TissGeneSummary for GAL3ST3 |
 Gene summary Gene summary |
| Basic gene information | Gene symbol | GAL3ST3 |
| Gene name | galactose-3-O-sulfotransferase 3 | |
| Synonyms | GAL3ST-3|GAL3ST2 | |
| Cytomap | UCSC genome browser: 11q13.1 | |
| Type of gene | protein-coding | |
| RefGenes | NM_033036.2, | |
| Description | beta-galactose-3-O-sulfotransferase 3gal-beta-1, 3-GalNAc 3'-sulfotransferase 3galactose 3'-sulfotransferasegalbeta1-3GalNAc 3'-sulfotransferase 3 | |
| Modification date | 20141217 | |
| dbXrefs | MIM : 608234 | |
| HGNC : HGNC | ||
| HPRD : 10501 | ||
| Protein | UniProt: go to UniProt's Cross Reference DB Table | |
| Expression | CleanEX: HS_GAL3ST3 | |
| BioGPS: 89792 | ||
| Pathway | NCI Pathway Interaction Database: GAL3ST3 | |
| KEGG: GAL3ST3 | ||
| REACTOME: GAL3ST3 | ||
| Pathway Commons: GAL3ST3 | ||
| Context | iHOP: GAL3ST3 | |
| ligand binding site mutation search in PubMed: GAL3ST3 | ||
| UCL Cancer Institute: GAL3ST3 | ||
| Assigned class in TissGDB* | C | |
| Included tissue-specific gene expression resources | TiGER,GTEx | |
| Specific-tissues in normal samples (assigned by TissGDB using HPA, TiGER, and GTEx) | Thyroid glandEye | |
| Cancer types related to the specific-tissues in cancer samples (assigned by TissGDB using TCGA) | THCAUVM | |
| Reference showing the relevant tissue of GAL3ST3 | ||
| Description by TissGene annotations | ||
| * Class A consists of genes with literature evidence and is part of the cTissGenes. Class B consists of only cTissGenes without additional evidence. The remaining genes belong to Class C. |
| Gene ontology having evidence of Inferred from Direct Assay (IDA) from Entrez |
| GO ID | GO term | PubMed ID |
| Top |
| TissGeneExp for GAL3ST3 |
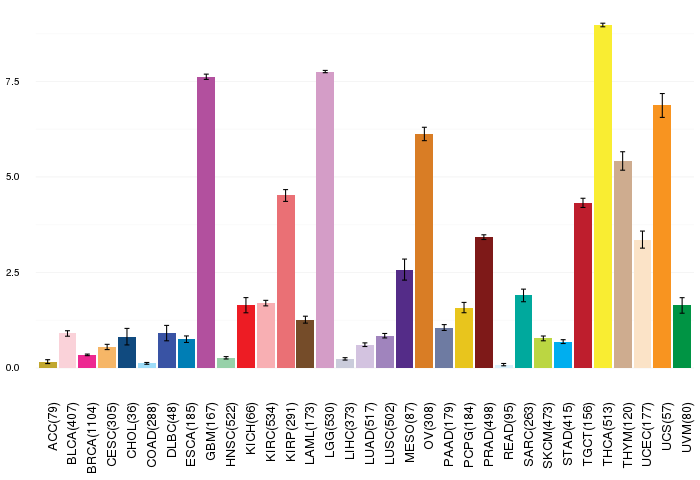
| Gene expressions across 28 cancer types (X-axis: cancer type and Y-axis: log2(norm_counts+1)) (TCGA IlluminaHiSeq_RNASeqV2, pan-cancer normalized log2(norm_counts+1) data, version 2016-08-16) |
 |
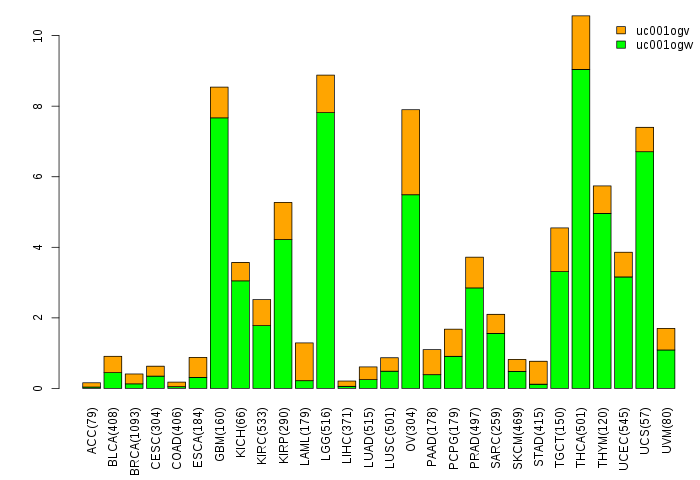
| Gene isoform expressions across 28 cancer types (X-axis: cancer type and Y-axis: log2(norm_counts+1)) (TCGA pan-cancer tcga_rsem_isoform_tpm, version 2016-09-01) |
 |
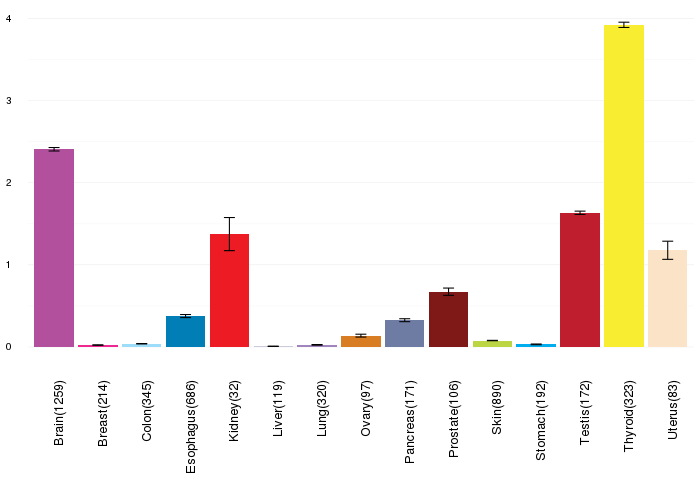
| Gene expressions across normal tissues of GTEx data (GTEx GTEx_Analysis_v6_RNA-seq_RNA-SeQCv1.1.8_gene_rpkm.gct) - Here, we shows the matched tissue types only among our 28 cancer types. |
 |
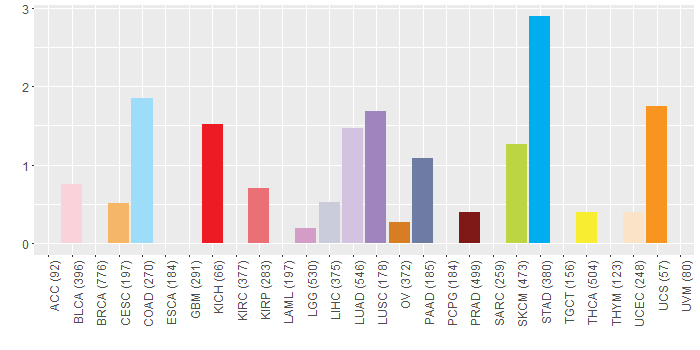
| Different expressions across 14 cancer types with more than 10 samples between matched tumors and normals (X-axis: cancer type and Y-axis: log2(norm_counts+1)) (TCGA IlluminaHiSeq_RNASeqV2, pan-cancer normalized log2(norm_counts+1) data, version 2016-08-16) |
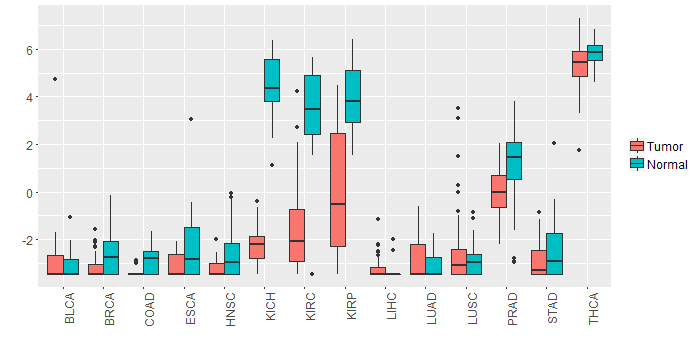 |
| - Significantly differentially expressed cancer types and information. (|Fold change|>1 and FDR<0.05) |
| Cancer type | Mean(exp) in tumor | Mean(exp) in matched normal | Log2FC | P-val. | FDR |
| KIRC | -1.635378855 | 3.545411423 | -5.180790278 | 1.59E-40 | 6.72E-39 |
| KIRP | -0.184923994 | 3.968516631 | -4.153440625 | 2.60E-10 | 2.78E-09 |
| KICH | -2.111913244 | 4.377142756 | -6.489056 | 6.88E-24 | 1.08E-21 |
| PRAD | -0.007020628 | 1.110896679 | -1.117917308 | 2.75E-05 | 0.000133973 |
| Top |
| TissGene-miRNA for GAL3ST3 |
| Significantly anti-correlated miRNAs of TissGene across 28 cancer types (Gene-miRNA relations from TargetScanHuman Relsease 7.1, Conserved_Site_Context_Scores.txt.zip, 06.01.2016) (TCGA IlluminaHiSeq_miRNASeq, log2(RPM+1) data, version 2016-11-21) (TCGA IlluminaHiSeq_RNASeqV2, log2(normalized_count+1) data, version 2016-08-16) (Spearman’s Rank Correlation (p-value<0.05 and coefficient<-0.25)) |
| Cancer type | miRNA id | miRNA accession | P-val. | Coeff. | # samples |
| Top |
| TissGeneMut for GAL3ST3 |
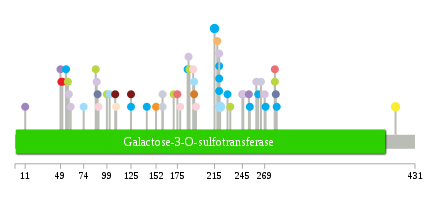
| TissGeneSNV for GAL3ST3 |
| nsSNV counts per each loci. Different colors of circles represent different cancer types. Circle size denotes number of samples. (TCGA somatic mutation (SNPs and small INDELs) data, version 2016-04-25) * Click on the image to enlarge it in a new window. |
 |
 |
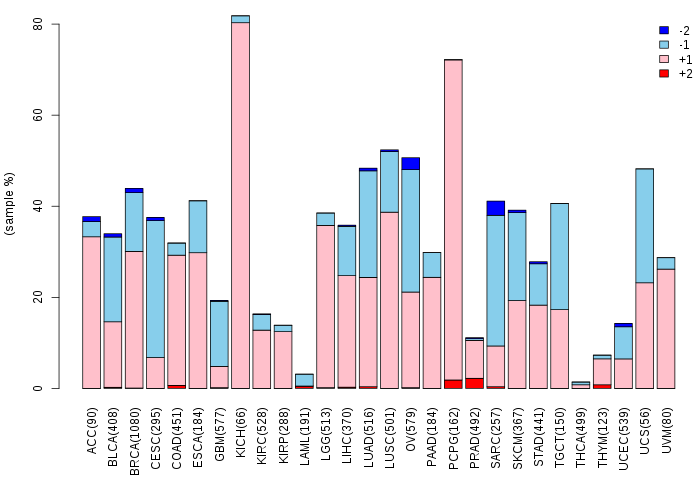
| Somatic nucleotide variants of TissGene across 28 cancer types (X-axis: cancer type and Y-axis: % of mutated samples) The numbers in parentheses are numbers of samples with mutation (nsSNVs). (TCGA somatic mutation (SNPs and small INDELs) data, version 2016-04-25) |
 |
| - nsSNVs sorted by frequency. |
| AAchange | Cancer type | # samples |
| p.A221D | COAD | 3 |
| p.R215H | STAD | 2 |
| p.E410A | THCA | 2 |
| p.A221D | DLBC | 2 |
| p.R152H | UCS | 1 |
| p.R89C | PAAD | 1 |
| p.A193T | OV | 1 |
| p.E232K | SKCM | 1 |
| p.P99S | SKCM | 1 |
| p.V125M | STAD | 1 |
| p.R270H | STAD | 1 |
| p.D220N | STAD | 1 |
| p.A186V | MESO | 1 |
| p.D220E | LUAD | 1 |
| p.D220G | STAD | 1 |
| p.R185C | HNSC | 1 |
| p.A178T | BLCA | 1 |
| p.A87V | SKCM | 1 |
| p.R229C | STAD | 1 |
| p.E188K | SKCM | 1 |
| p.V175I | KIRP | 1 |
| p.P280S | SKCM | 1 |
| p.P108H | PRAD | 1 |
| p.E246D | LUAD | 1 |
| p.A281T | PAAD | 1 |
| p.H90D | BLCA | 1 |
| p.P58Q | LUAD | 1 |
| p.P280A | KIRP | 1 |
| p.R192H | BLCA | 1 |
| p.S57L | SKCM | 1 |
| p.D220S | STAD | 1 |
| p.R253H | STAD | 1 |
| p.E159X | LIHC | 1 |
| p.S50R | KICH | 1 |
| p.V262M | STAD | 1 |
| p.A11D | LUSC | 1 |
| p.R55W | STAD | 1 |
| p.L49F | LUSC | 1 |
| p.R109H | UCEC | 1 |
| p.T74M | COAD | 1 |
| p.A193T | COAD | 1 |
| p.C51G | KICH | 1 |
| p.E88D | LUAD | 1 |
| p.A269G | LUAD | 1 |
| p.E195G | BLCA | 1 |
| p.R218H | CESC | 1 |
| p.A221D | READ | 1 |
| p.D245N | LGG | 1 |
| p.P142L | STAD | 1 |
| p.D260A | LUAD | 1 |
| p.R252W | LUSC | 1 |
| p.E102X | COAD | 1 |
| p.P187T | LUAD | 1 |
| p.A282V | STAD | 1 |
| p.A186V | STAD | 1 |
| p.E214Q | HNSC | 1 |
| p.A265V | LIHC | 1 |
| p.R60H | LUAD | 1 |
| p.A171V | SKCM | 1 |
| p.V125M | PRAD | 1 |
| p.E159* | LIHC | 1 |
| Top |
| TissGeneCNV for GAL3ST3 |
| Copy number variations of TissGene across 28 cancer types (X-axis: cancer type and Y-axis: % of CNV samples) (TCGA Gistic2_CopyNumber_Gistic2_all_data_by_genes, Gistic2 copy number data, version 2016-08-16) |
 |
| Top |
| TissGeneFusions for GAL3ST3 |
| Fusion genes including TissGene (ChimerDB 3.0, 2016-12-01 and TCGA fusion Portal 2015-12-01) |
| Database | Src | Cancer type | Sample | Fusion gene | ORF | 5'-gene BP | 3'-gene BP |
| Top |
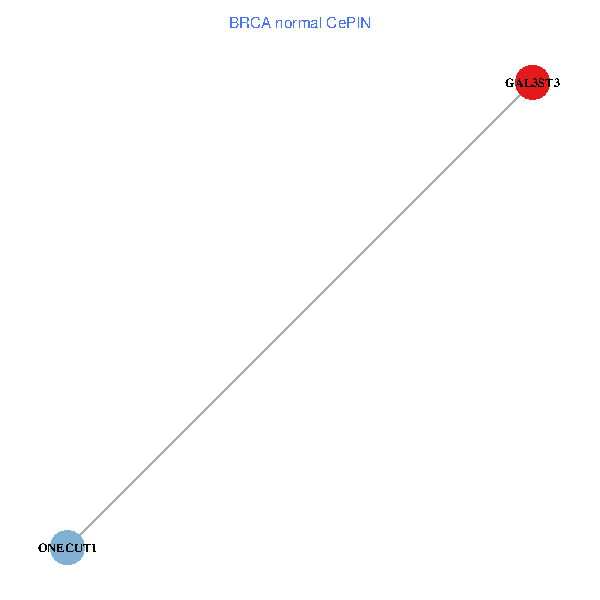
| TissGeneNet for GAL3ST3 |
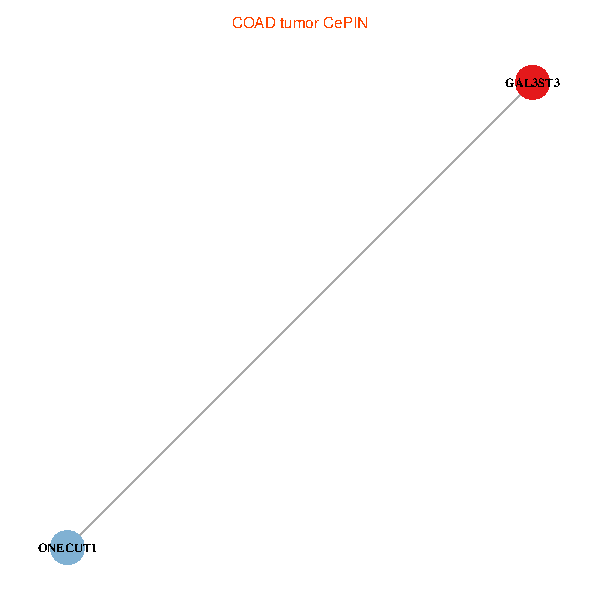
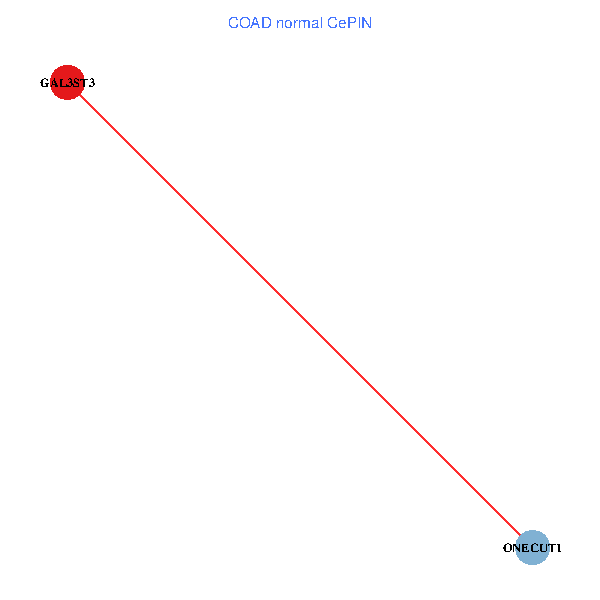
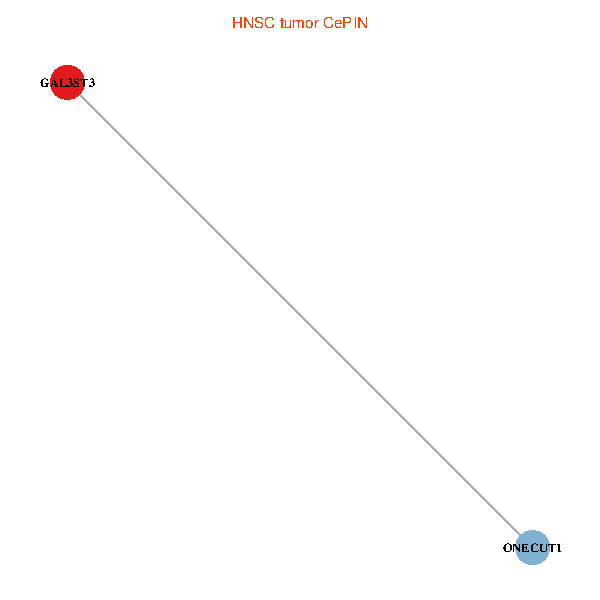
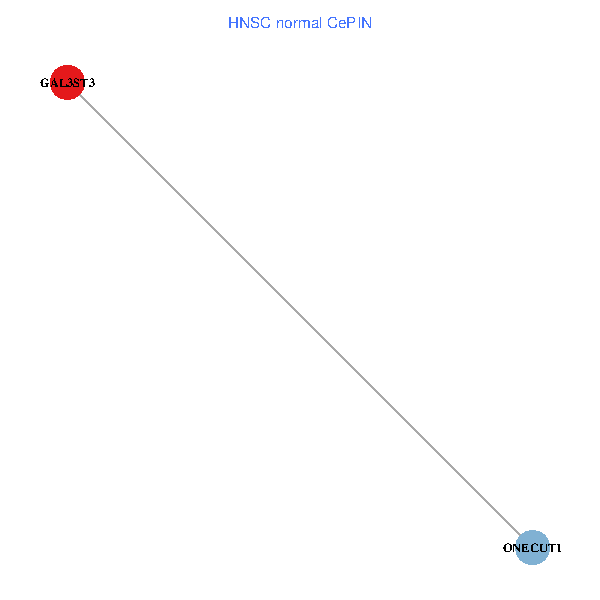
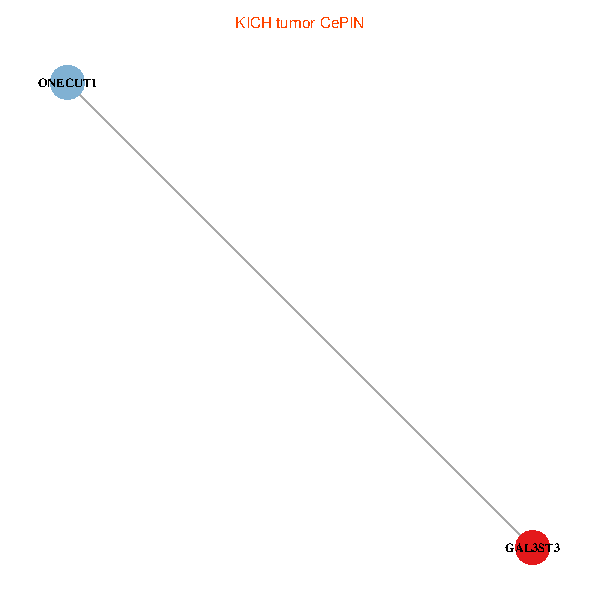
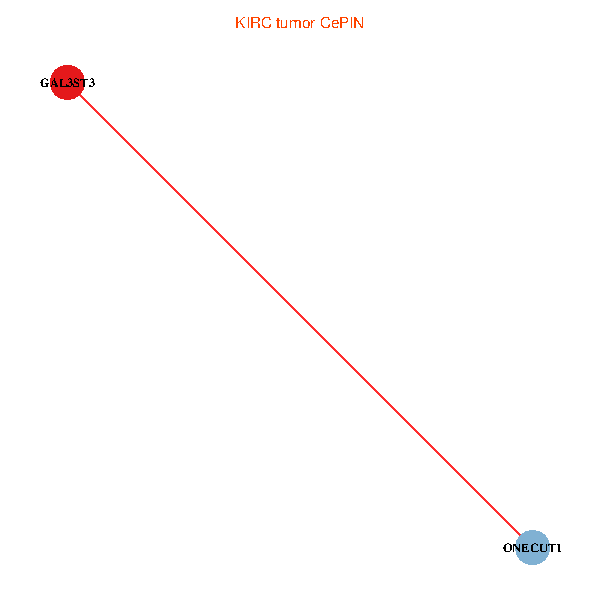
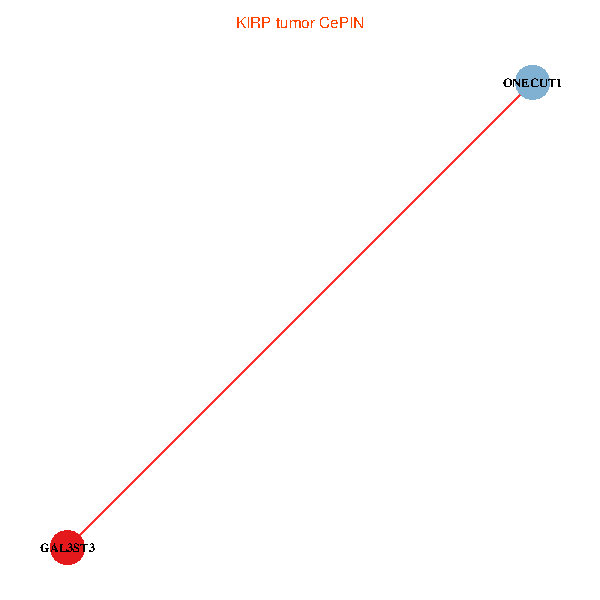
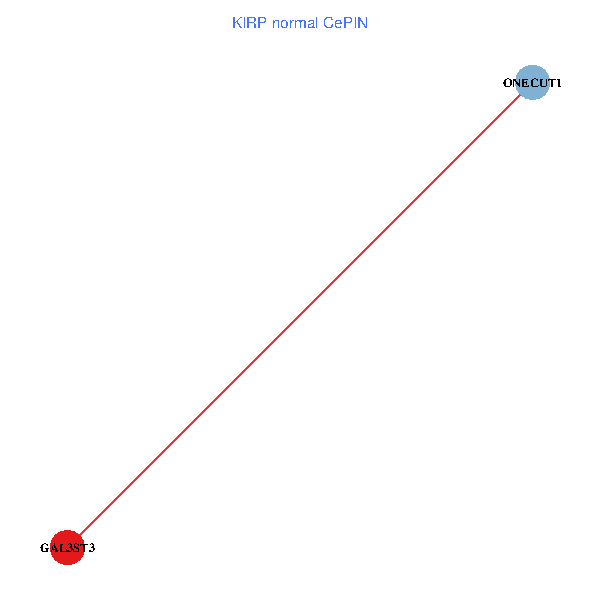
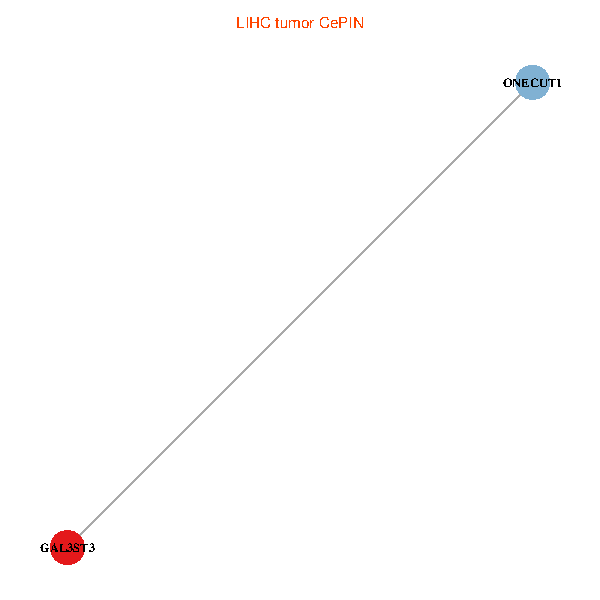
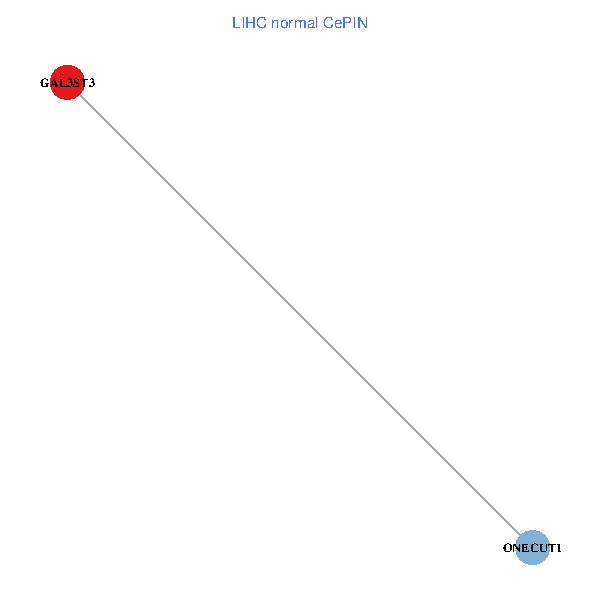
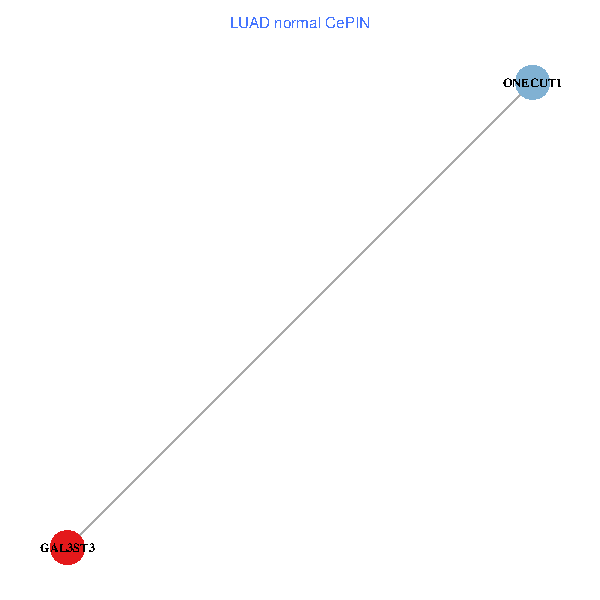
| Co-expressed gene networks based on protein-protein interaction data (CePIN) (TCGA IlluminaHiSeq_RNASeqV2, pan-cancer normalized log2(norm_counts+1) data, version 2016-08-16) (PINA2 ppi data) |
| BRCA (tumor) | BRCA (normal) |
| GAL3ST3, ONECUT1 (tumor) | GAL3ST3, ONECUT1 (normal) |
 |  |
| COAD (tumor) | COAD (normal) |
| GAL3ST3, ONECUT1 (tumor) | GAL3ST3, ONECUT1 (normal) |
 |  |
| HNSC (tumor) | HNSC (normal) |
| GAL3ST3, ONECUT1 (tumor) | GAL3ST3, ONECUT1 (normal) |
 |  |
| KICH (tumor) | KICH (normal) |
| GAL3ST3, ONECUT1 (tumor) | GAL3ST3, ONECUT1 (normal) |
 |  |
| KIRC (tumor) | KIRC (normal) |
| GAL3ST3, ONECUT1 (tumor) | GAL3ST3, ONECUT1 (normal) |
 |  |
| KIRP (tumor) | KIRP (normal) |
| GAL3ST3, ONECUT1 (tumor) | GAL3ST3, ONECUT1 (normal) |
 |  |
| LIHC (tumor) | LIHC (normal) |
| GAL3ST3, ONECUT1 (tumor) | GAL3ST3, ONECUT1 (normal) |
 |  |
| LUAD (tumor) | LUAD (normal) |
| GAL3ST3, ONECUT1 (tumor) | GAL3ST3, ONECUT1 (normal) |
 |  |
| LUSC (tumor) | LUSC (normal) |
| GAL3ST3, ONECUT1 (tumor) | GAL3ST3, ONECUT1 (normal) |
 |  |
| PRAD (tumor) | PRAD (normal) |
| GAL3ST3, ONECUT1 (tumor) | GAL3ST3, ONECUT1 (normal) |
 |  |
| STAD (tumor) | STAD (normal) |
| GAL3ST3, ONECUT1 (tumor) | GAL3ST3, ONECUT1 (normal) |
 |  |
| THCA (tumor) | THCA (normal) |
| GAL3ST3, ONECUT1 (tumor) | GAL3ST3, ONECUT1 (normal) |
 |  |
| Top |
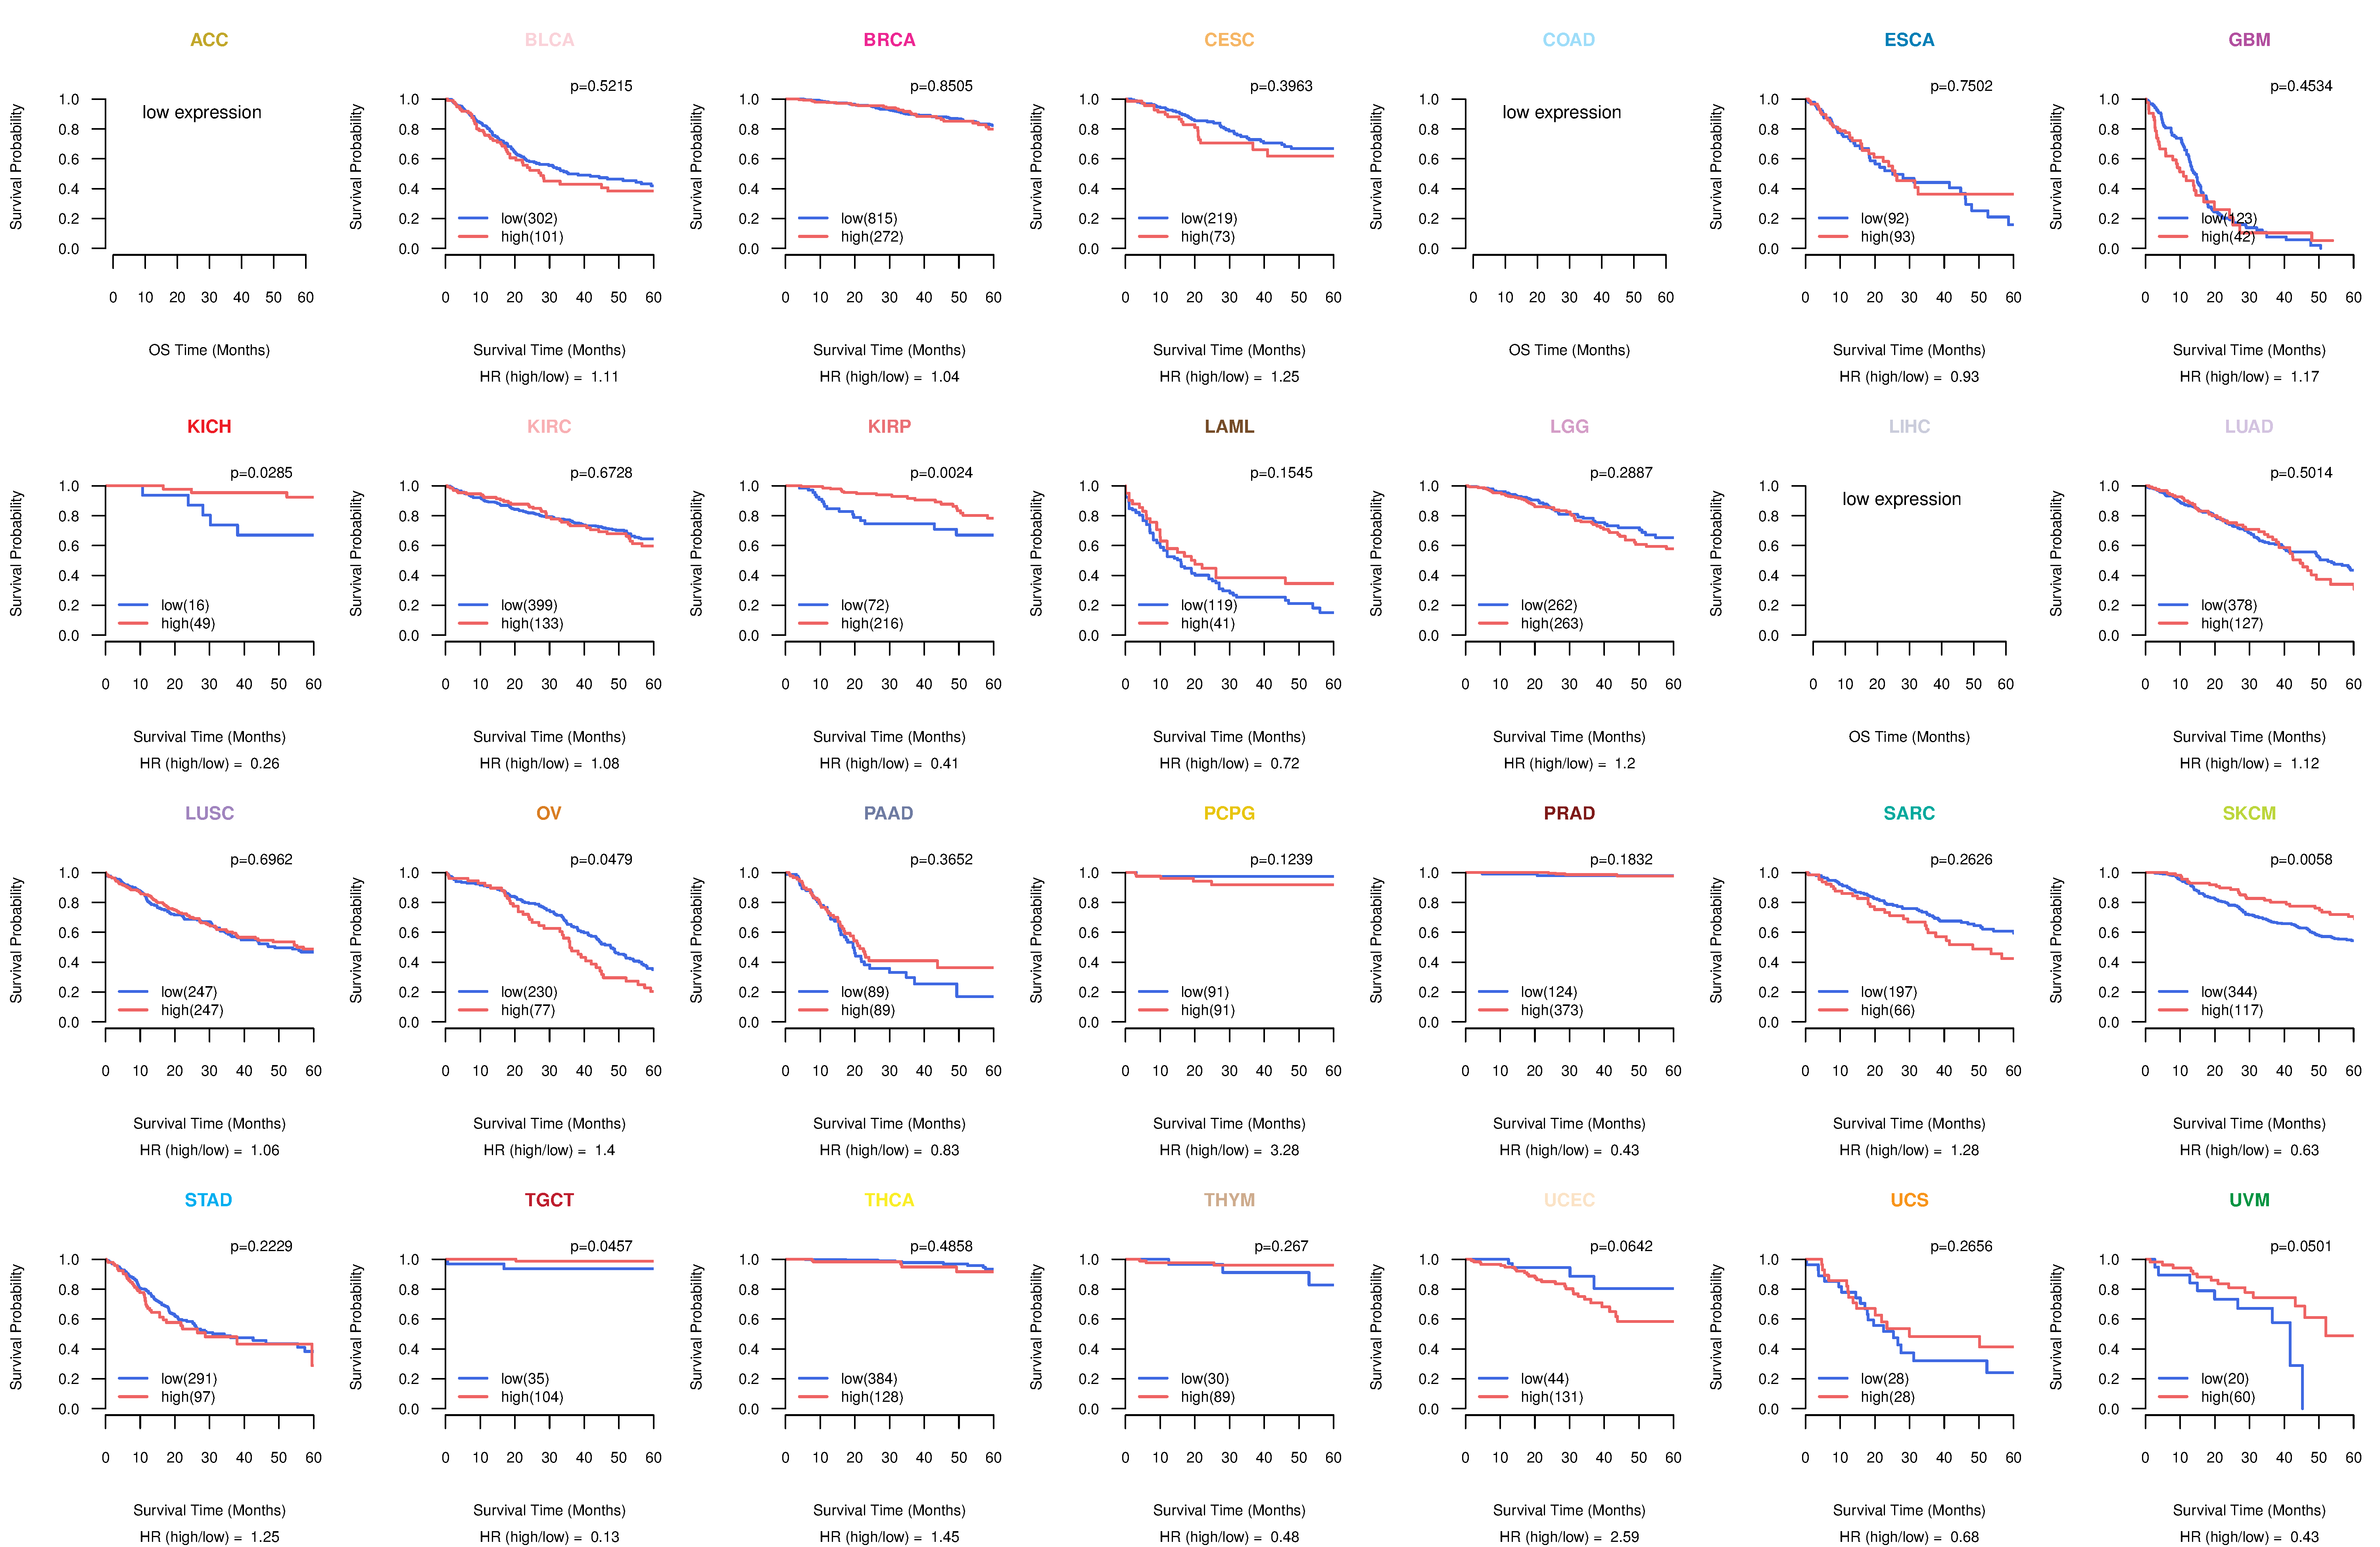
| TissGeneProg for GAL3ST3 |
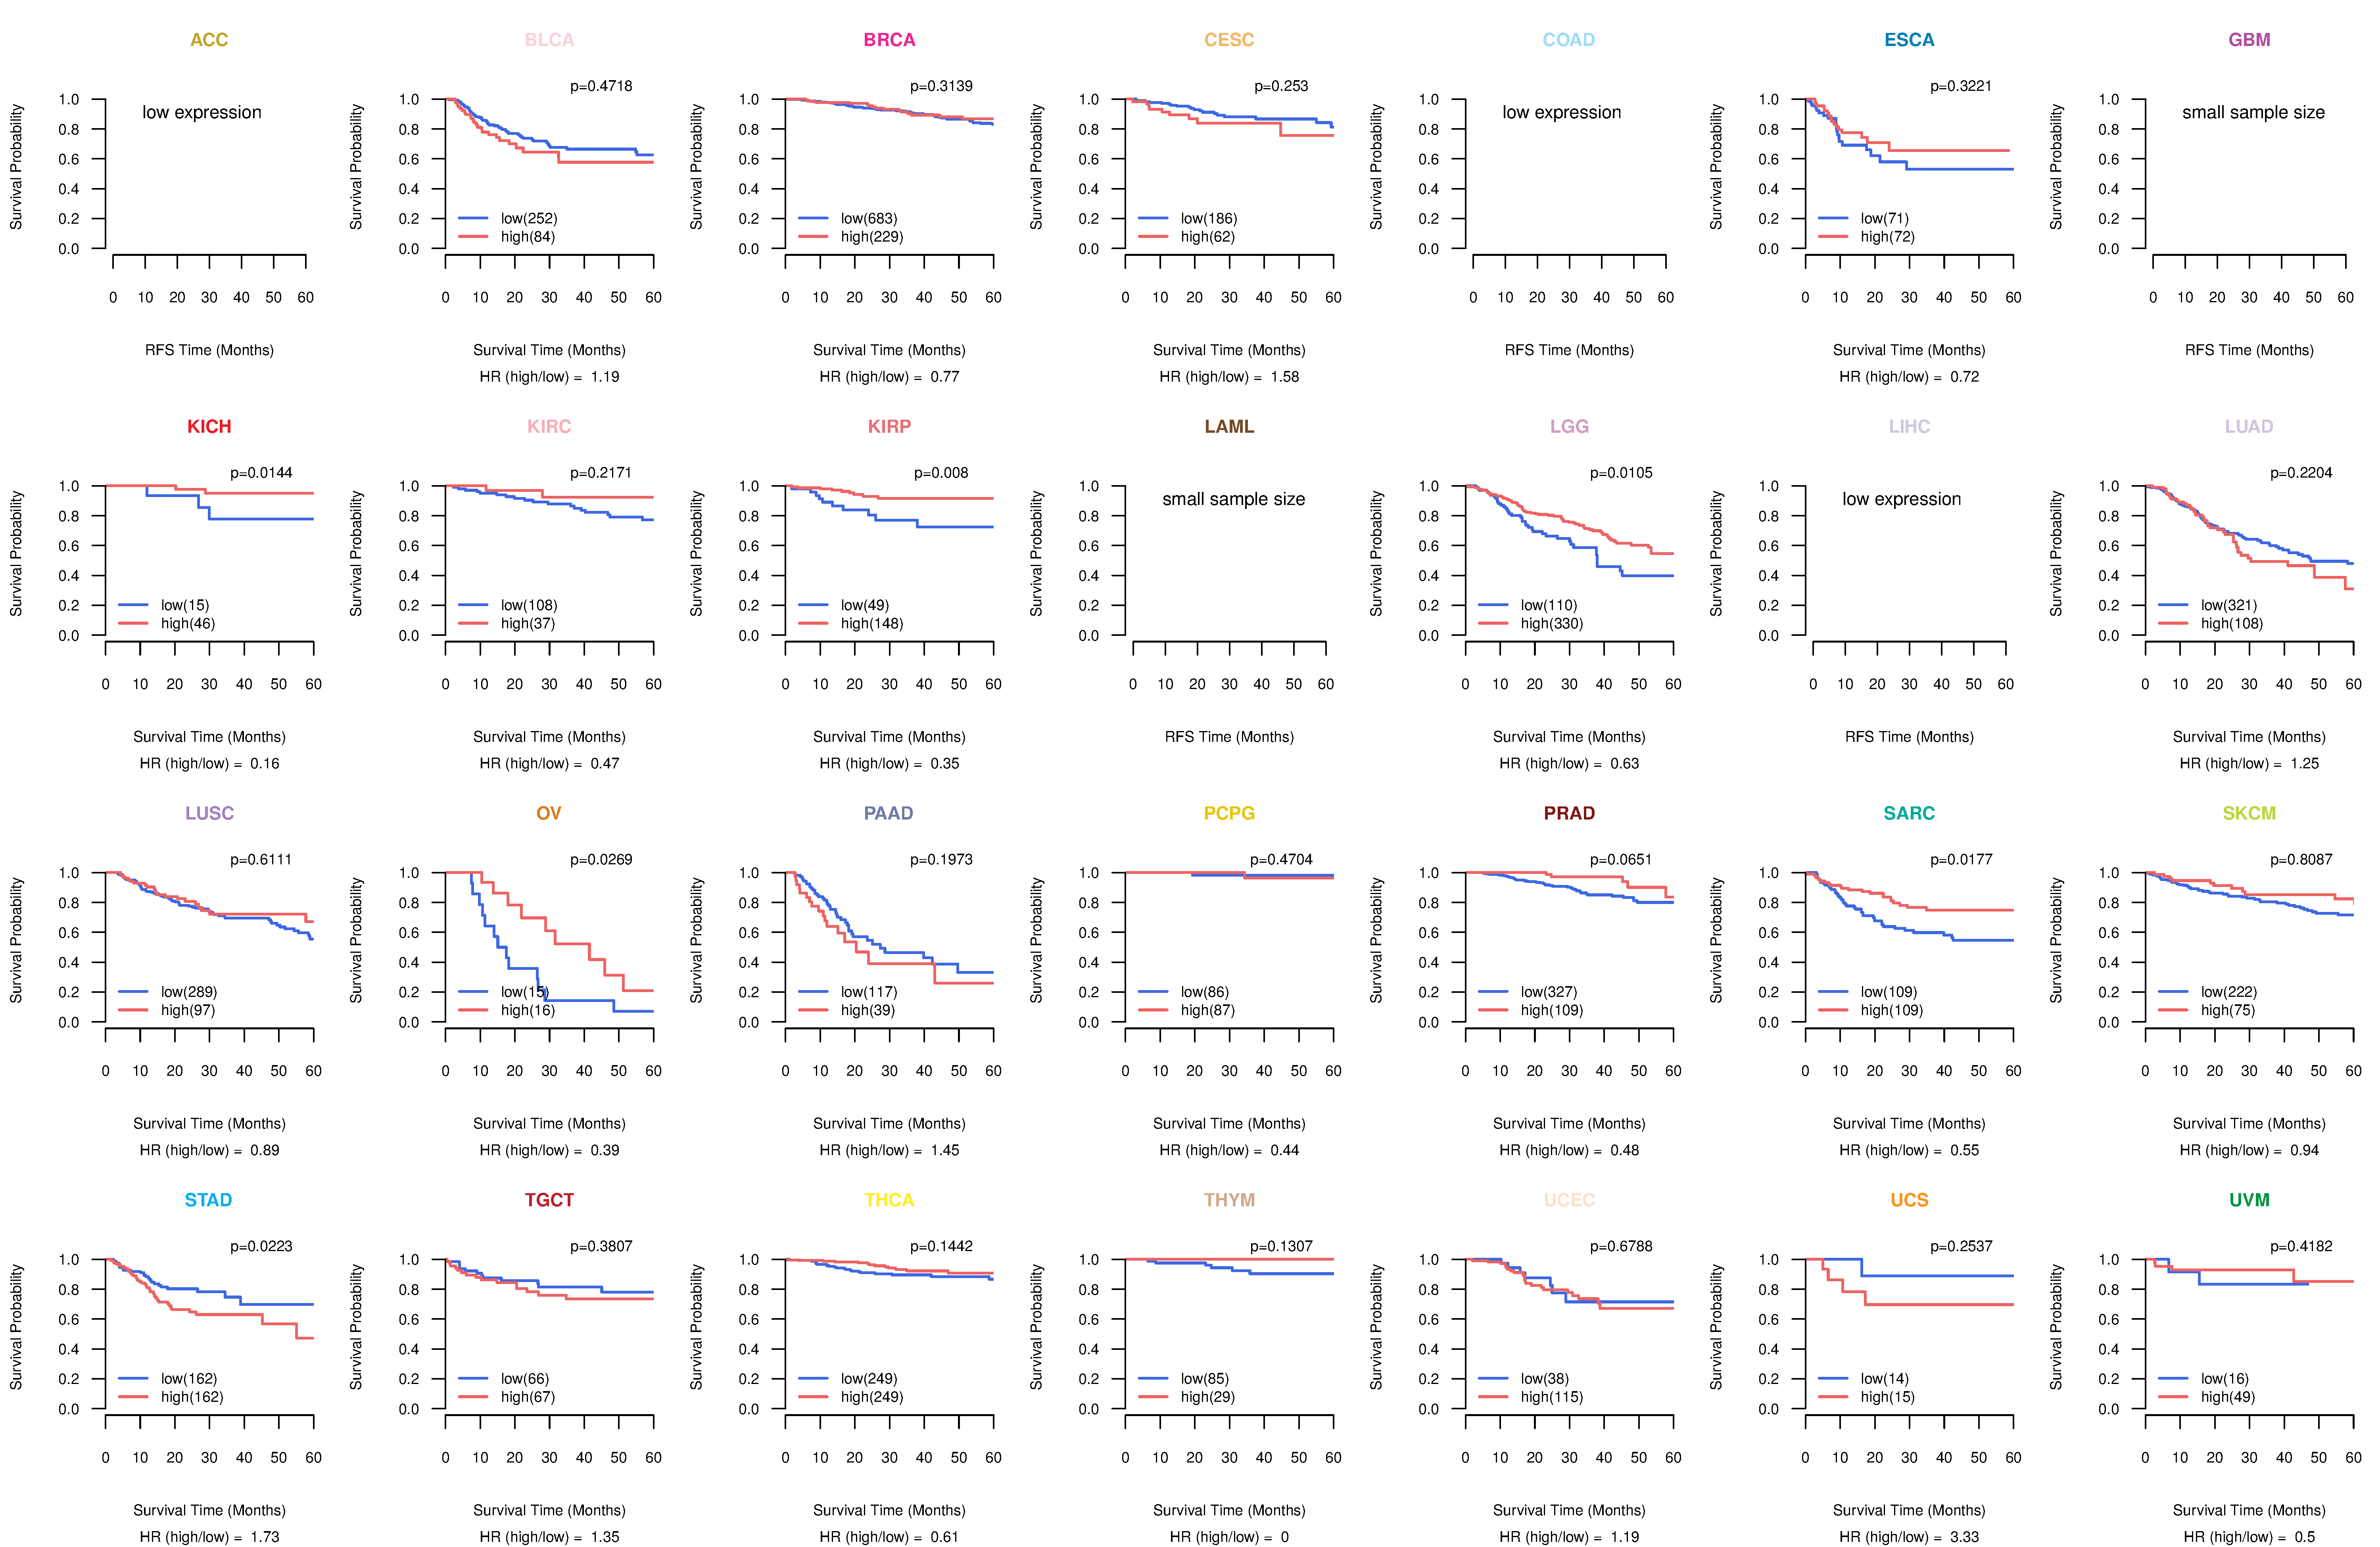
| Kaplan-Meier plots with logrank tests of overall survival (OS) using 28 cancer types (TCGA IlluminaHiSeq_RNASeqV2, pan-cancer normalized log2(norm_counts+1) data, version 2016-08-16) (TCGA clinicalMatrix, phenotype data, version 2016-04-27) * Click on the image to enlarge it in a new window. |
 |
| Kaplan-Meier plots with logrank test of relapse free survival (RFS) using 28 cancer types (TCGA IlluminaHiSeq_RNASeqV2, pan-cancer normalized log2(norm_counts+1) data, version 2016-08-16) (TCGA clinicalMatrix, phenotype data, version 2016-04-27) * Click on the image enlarge it in a new window. |
 |
| Forest plot of Cox proportional hazard ratio (HR) and 95% CI of overall survival (OS) using 28 cancer types (TCGA IlluminaHiSeq_RNASeqV2, pan-cancer normalized log2(norm_counts+1) data, version 2016-08-16) (TCGA clinicalMatrix, phenotype data, version 2016-04-27) * Click on the image enlarge it in a new window. |
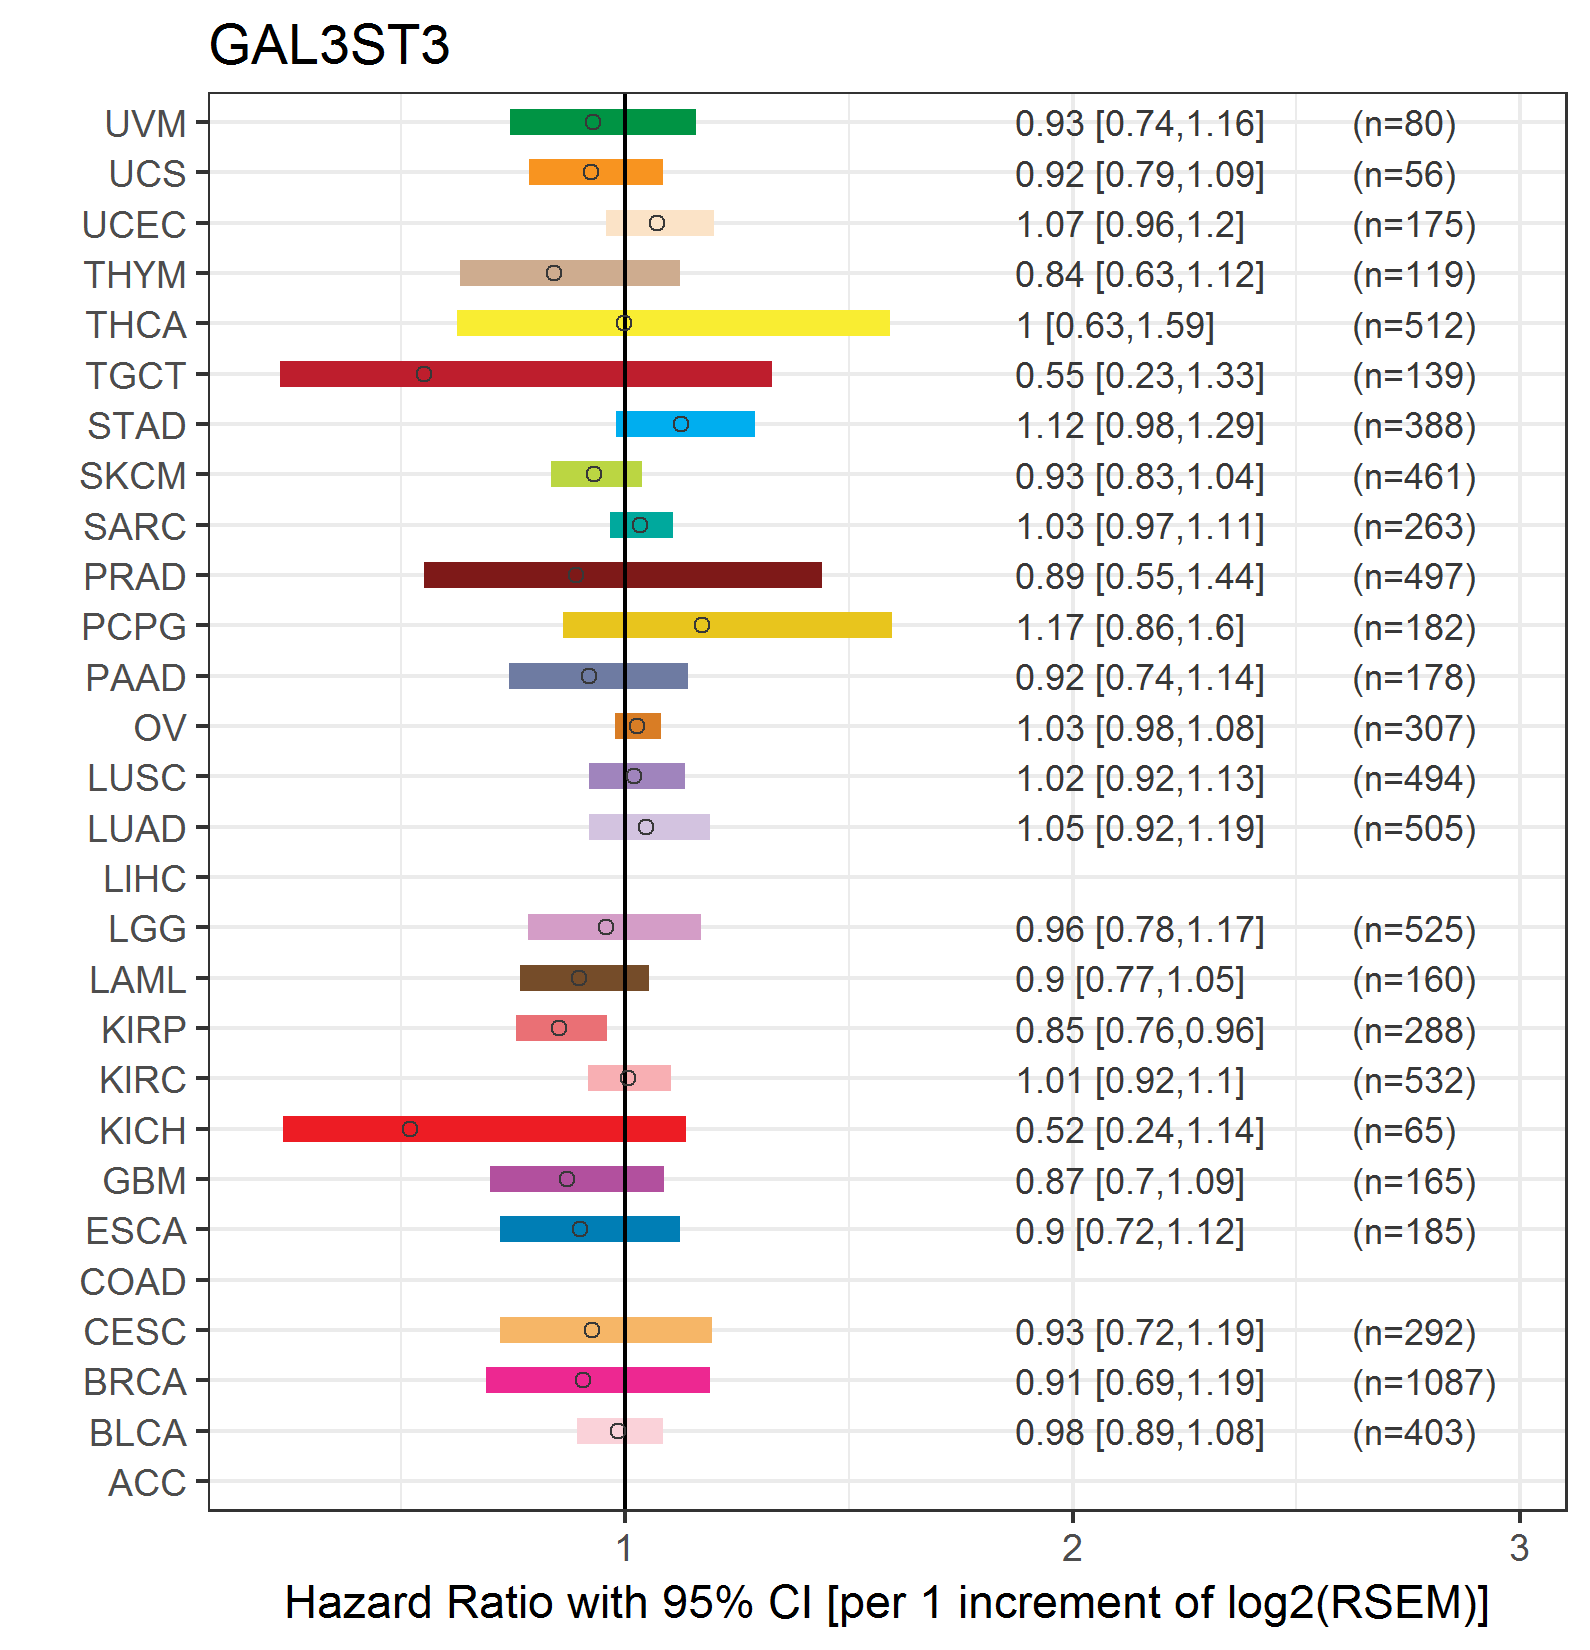 |
| Forest plot of Cox proportional hazard ratio (HR) and 95% CI of relapse free survival (RFS) using 28 cancer types (TCGA IlluminaHiSeq_RNASeqV2, pan-cancer normalized log2(norm_counts+1) data, version 2016-08-16) (TCGA clinicalMatrix, phenotype data, version 2016-04-27) * Click on the image enlarge it in a new window. |
 |
| Top |
| TissGeneClin for GAL3ST3 |
| TissGeneDrug for GAL3ST3 |
| Drug information targeting TissGene (DrugBank Version 5.0.6, 2017-04-01) |
| DrugBank ID | Drug name | Drug activity | Drug type | Drug status |
| Top |
| TissGeneDisease for GAL3ST3 |
| Disease information associated with TissGene (DisGeNet, 2016-06-01) |
| Disease ID | Disease name | # pubmeds | Source |
|
Copyright 2016-Present - The University of Texas Health Science Center at Houston (UTHealth) Web File Viewing | How to Report, Fraud, Waste and Abuse | State of Texas | Statewide Search | Texas Homeland Security | Site Policies |