 |
| |
| |
| |
| |
| |
| |
|

| TissGeneSummary for FATE1 |
 Gene summary Gene summary |
| Basic gene information | Gene symbol | FATE1 |
| Gene name | fetal and adult testis expressed 1 | |
| Synonyms | CT43|FATE | |
| Cytomap | UCSC genome browser: Xq28 | |
| Type of gene | protein-coding | |
| RefGenes | NM_033085.2, | |
| Description | BJ-HCC-2 antigencancer/testis antigen 43fetal and adult testis expressed transcript proteinfetal and adult testis-expressed transcript proteintumor antigen BJ-HCC-2 | |
| Modification date | 20141207 | |
| dbXrefs | MIM : 300450 | |
| HGNC : HGNC | ||
| Ensembl : ENSG00000147378 | ||
| HPRD : 02346 | ||
| Vega : OTTHUMG00000024172 | ||
| Protein | UniProt: go to UniProt's Cross Reference DB Table | |
| Expression | CleanEX: HS_FATE1 | |
| BioGPS: 89885 | ||
| Pathway | NCI Pathway Interaction Database: FATE1 | |
| KEGG: FATE1 | ||
| REACTOME: FATE1 | ||
| Pathway Commons: FATE1 | ||
| Context | iHOP: FATE1 | |
| ligand binding site mutation search in PubMed: FATE1 | ||
| UCL Cancer Institute: FATE1 | ||
| Assigned class in TissGDB* | B | |
| Included tissue-specific gene expression resources | HPA,TiGER,GTEx | |
| Specific-tissues in normal samples (assigned by TissGDB using HPA, TiGER, and GTEx) | Testis | |
| Cancer types related to the specific-tissues in cancer samples (assigned by TissGDB using TCGA) | TGCT | |
| Reference showing the relevant tissue of FATE1 | ||
| Description by TissGene annotations | ||
| * Class A consists of genes with literature evidence and is part of the cTissGenes. Class B consists of only cTissGenes without additional evidence. The remaining genes belong to Class C. |
| Gene ontology having evidence of Inferred from Direct Assay (IDA) from Entrez |
| GO ID | GO term | PubMed ID |
| Top |
| TissGeneExp for FATE1 |
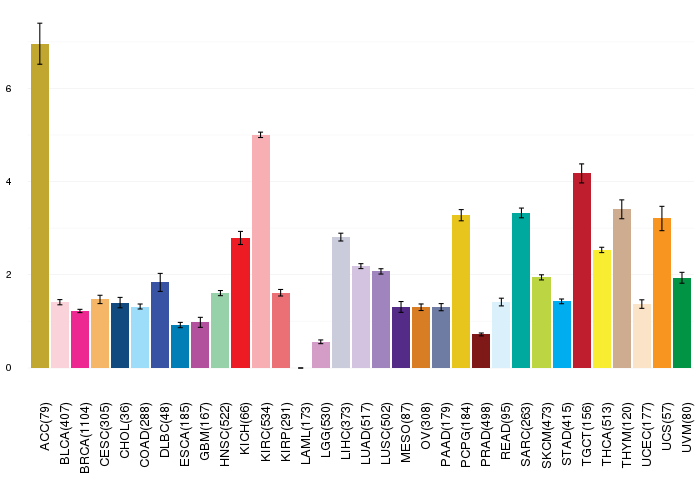
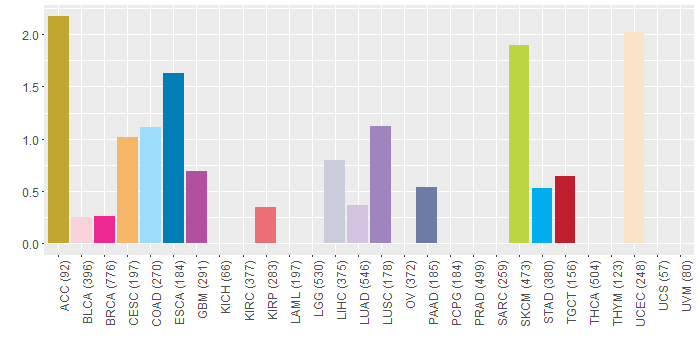
| Gene expressions across 28 cancer types (X-axis: cancer type and Y-axis: log2(norm_counts+1)) (TCGA IlluminaHiSeq_RNASeqV2, pan-cancer normalized log2(norm_counts+1) data, version 2016-08-16) |
 |
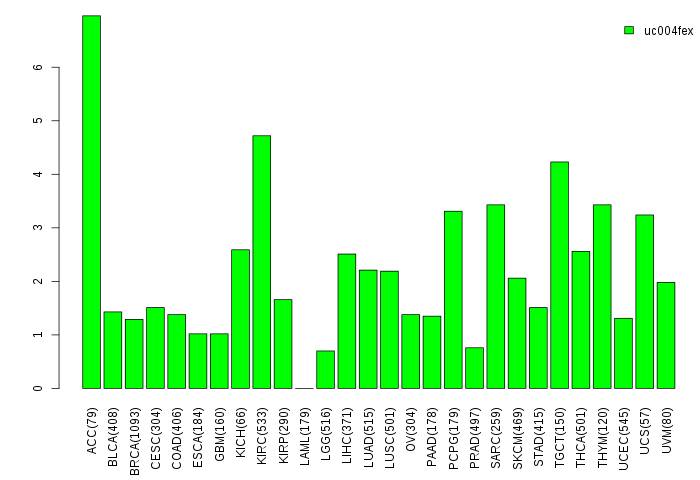
| Gene isoform expressions across 28 cancer types (X-axis: cancer type and Y-axis: log2(norm_counts+1)) (TCGA pan-cancer tcga_rsem_isoform_tpm, version 2016-09-01) |
 |
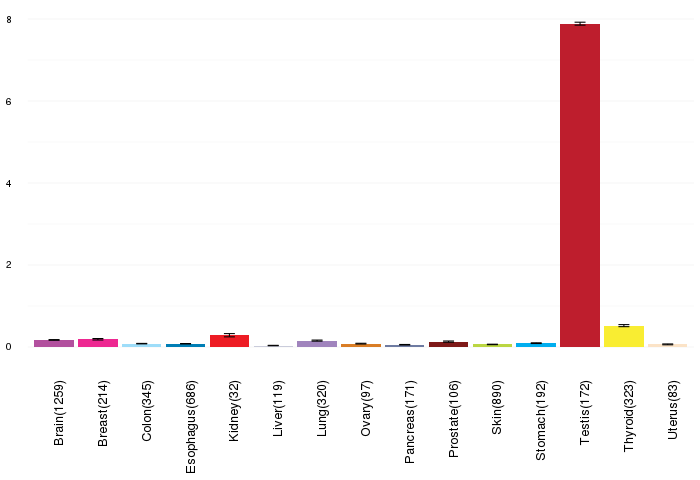
| Gene expressions across normal tissues of GTEx data (GTEx GTEx_Analysis_v6_RNA-seq_RNA-SeQCv1.1.8_gene_rpkm.gct) - Here, we shows the matched tissue types only among our 28 cancer types. |
 |
| Different expressions across 14 cancer types with more than 10 samples between matched tumors and normals (X-axis: cancer type and Y-axis: log2(norm_counts+1)) (TCGA IlluminaHiSeq_RNASeqV2, pan-cancer normalized log2(norm_counts+1) data, version 2016-08-16) |
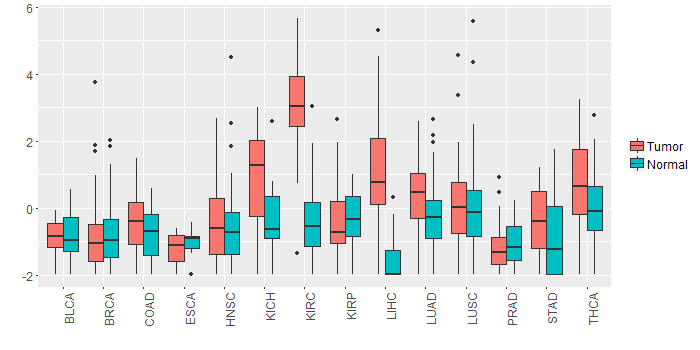 |
| - Significantly differentially expressed cancer types and information. (|Fold change|>1 and FDR<0.05) |
| Cancer type | Mean(exp) in tumor | Mean(exp) in matched normal | Log2FC | P-val. | FDR |
| KIRC | 3.029842504 | -0.41813944 | 3.447981944 | 1.74E-38 | 6.39E-37 |
| LIHC | 0.87107556 | -1.63108844 | 2.502164 | 1.25E-15 | 4.21E-14 |
| KICH | 0.93541956 | -0.38558444 | 1.321004 | 0.000338 | 0.000801024 |
| Top |
| TissGene-miRNA for FATE1 |
| Significantly anti-correlated miRNAs of TissGene across 28 cancer types (Gene-miRNA relations from TargetScanHuman Relsease 7.1, Conserved_Site_Context_Scores.txt.zip, 06.01.2016) (TCGA IlluminaHiSeq_miRNASeq, log2(RPM+1) data, version 2016-11-21) (TCGA IlluminaHiSeq_RNASeqV2, log2(normalized_count+1) data, version 2016-08-16) (Spearman’s Rank Correlation (p-value<0.05 and coefficient<-0.25)) |
| Cancer type | miRNA id | miRNA accession | P-val. | Coeff. | # samples |
| Top |
| TissGeneMut for FATE1 |
| TissGeneSNV for FATE1 |
| nsSNV counts per each loci. Different colors of circles represent different cancer types. Circle size denotes number of samples. (TCGA somatic mutation (SNPs and small INDELs) data, version 2016-04-25) * Click on the image to enlarge it in a new window. |
 |
| Somatic nucleotide variants of TissGene across 28 cancer types (X-axis: cancer type and Y-axis: % of mutated samples) The numbers in parentheses are numbers of samples with mutation (nsSNVs). (TCGA somatic mutation (SNPs and small INDELs) data, version 2016-04-25) |
 |
| - nsSNVs sorted by frequency. |
| AAchange | Cancer type | # samples |
| p.H111Y | SKCM | 3 |
| p.E153K | SKCM | 2 |
| p.E128Q | BRCA | 1 |
| p.A10V | COAD | 1 |
| p.R109H | UCEC | 1 |
| p.E153K | BLCA | 1 |
| p.A150T | UCEC | 1 |
| p.T73N | ESCA | 1 |
| p.R89* | LUAD | 1 |
| p.K76M | STAD | 1 |
| p.R74Q | SKCM | 1 |
| p.Q183P | STAD | 1 |
| p.L16M | ACC | 1 |
| p.A156T | GBM | 1 |
| p.E13K | CESC | 1 |
| p.Y142X | KIRP | 1 |
| p.W178C | TGCT | 1 |
| p.R114L | LIHC | 1 |
| p.R74P | UCEC | 1 |
| p.G92D | UCEC | 1 |
| p.W178X | LIHC | 1 |
| p.Y101* | LUAD | 1 |
| p.R66Q | SKCM | 1 |
| p.A172G | ACC | 1 |
| p.R146W | LUSC | 1 |
| p.E100X | LIHC | 1 |
| p.A122V | COAD | 1 |
| p.S91L | SKCM | 1 |
| p.R109H | PAAD | 1 |
| p.Q29K | UCEC | 1 |
| p.G26A | ESCA | 1 |
| p.R114P | BRCA | 1 |
| p.A2E | ESCA | 1 |
| p.G46S | SKCM | 1 |
| p.W68* | SKCM | 1 |
| p.K77N | GBM | 1 |
| p.H160N | LUSC | 1 |
| p.N28D | COAD | 1 |
| p.R114C | CESC | 1 |
| Top |
| TissGeneCNV for FATE1 |
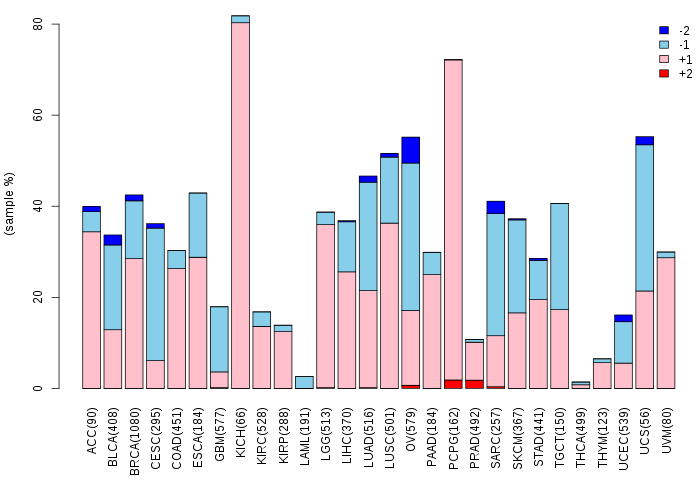
| Copy number variations of TissGene across 28 cancer types (X-axis: cancer type and Y-axis: % of CNV samples) (TCGA Gistic2_CopyNumber_Gistic2_all_data_by_genes, Gistic2 copy number data, version 2016-08-16) |
 |
| Top |
| TissGeneFusions for FATE1 |
| Fusion genes including TissGene (ChimerDB 3.0, 2016-12-01 and TCGA fusion Portal 2015-12-01) |
| Database | Src | Cancer type | Sample | Fusion gene | ORF | 5'-gene BP | 3'-gene BP |
| Chimerdb3.0 | ChiTaRs | NA | AK057369 | FATE1-TMEM131 | chrX:150891630 | chr2:98372803 | |
| TCGAfusionPortal | PRADA | BRCA | TCGA-A8-A08G-01A | MTMR1-FATE1 | Out-of-frame | ChrX:149887172 | ChrX:150889867 |
| Top |
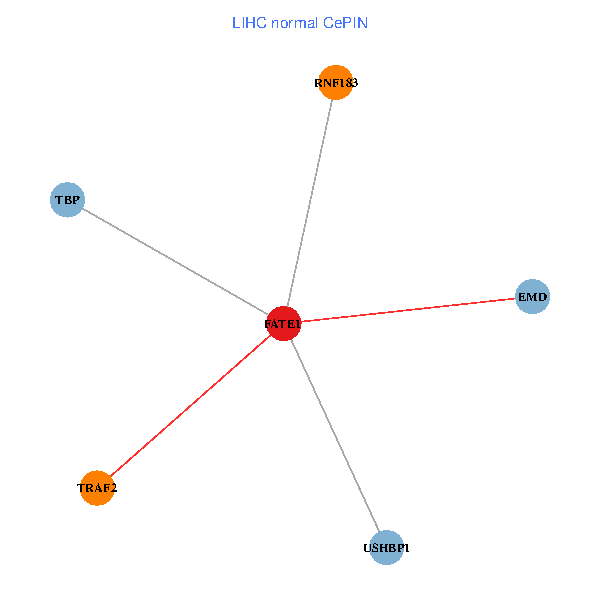
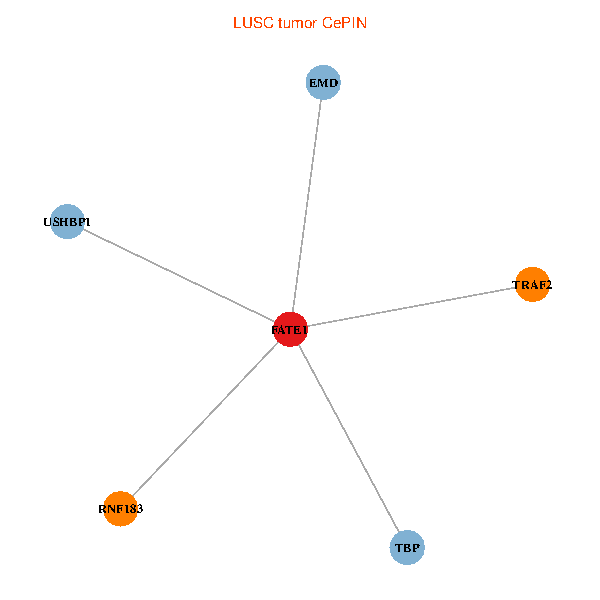
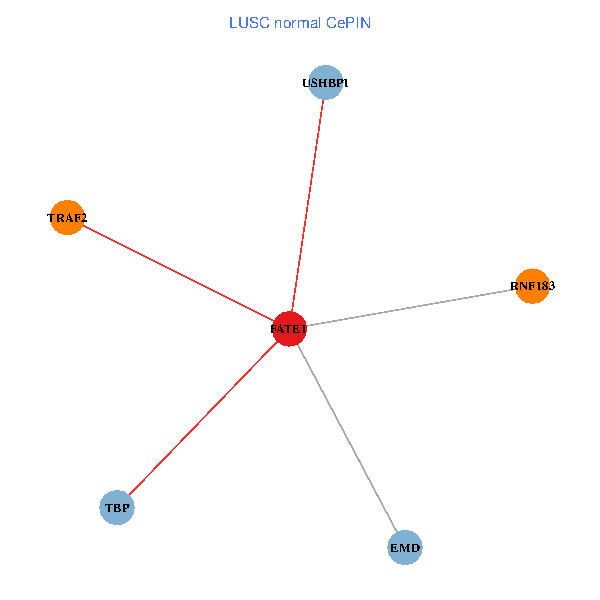
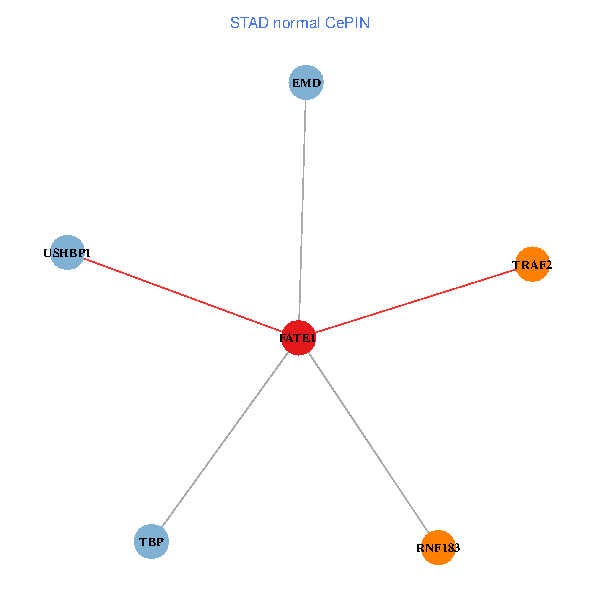
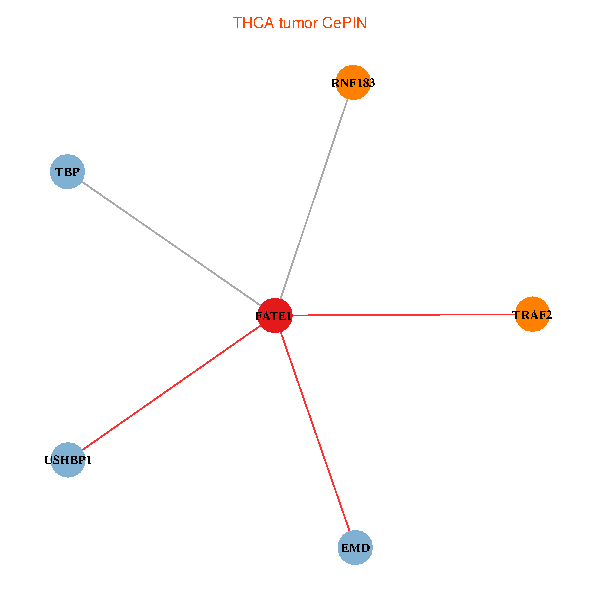
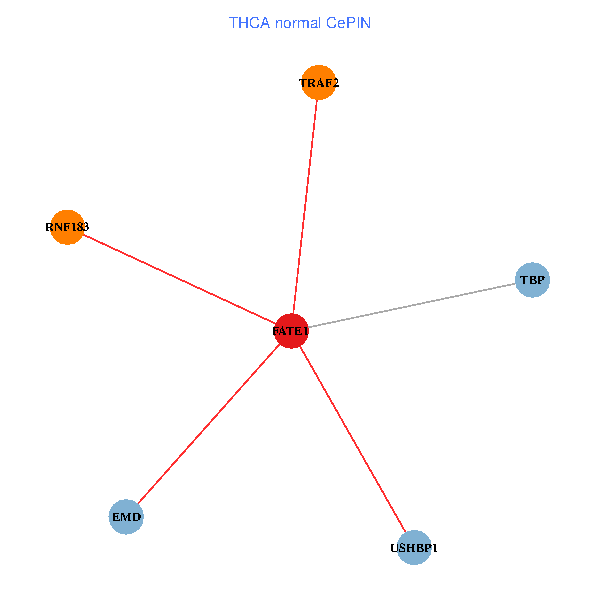
| TissGeneNet for FATE1 |
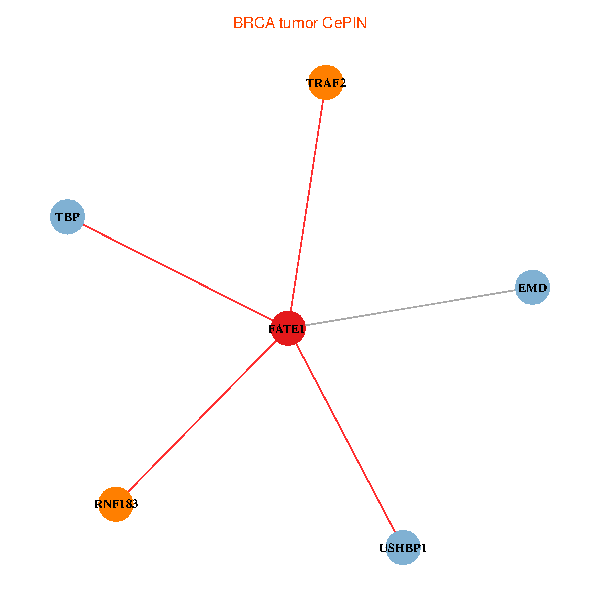
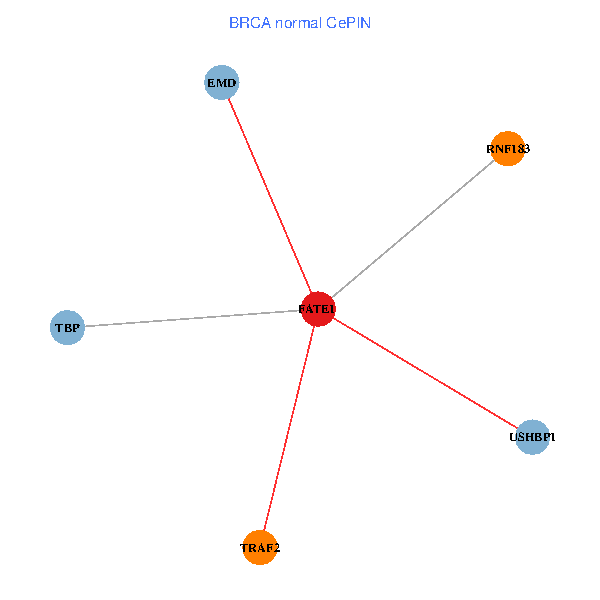
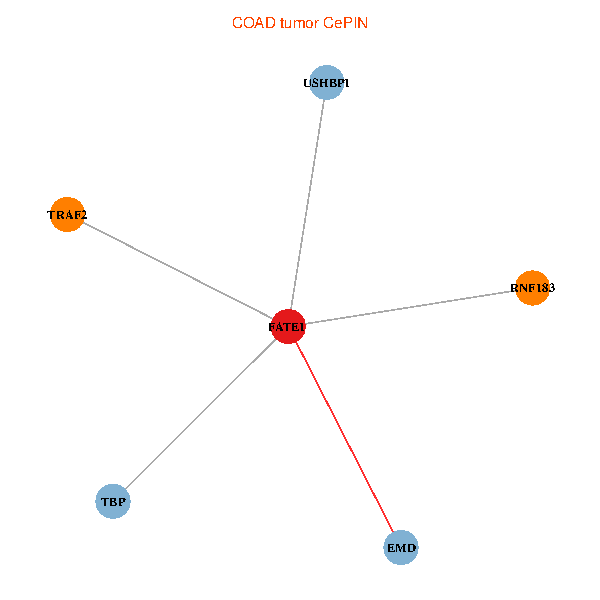
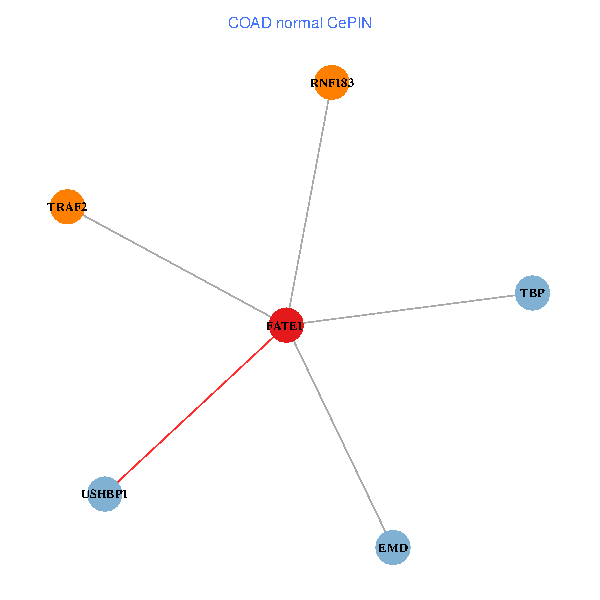
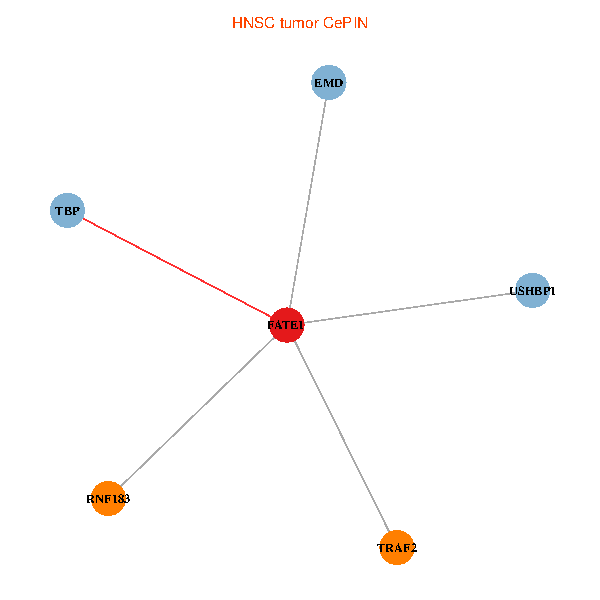
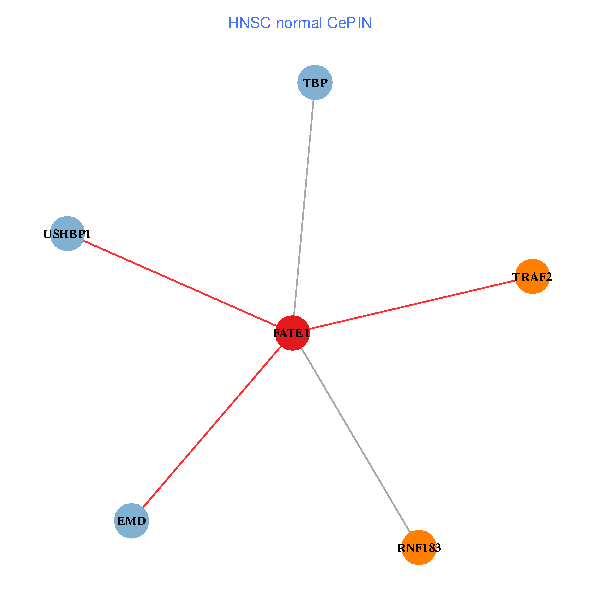
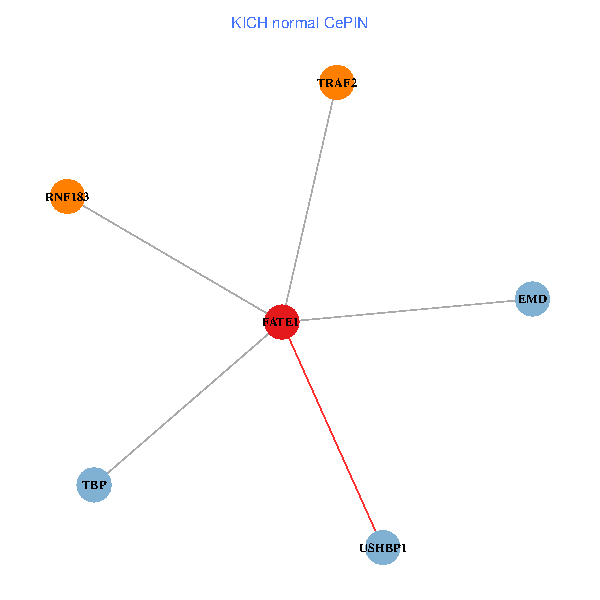
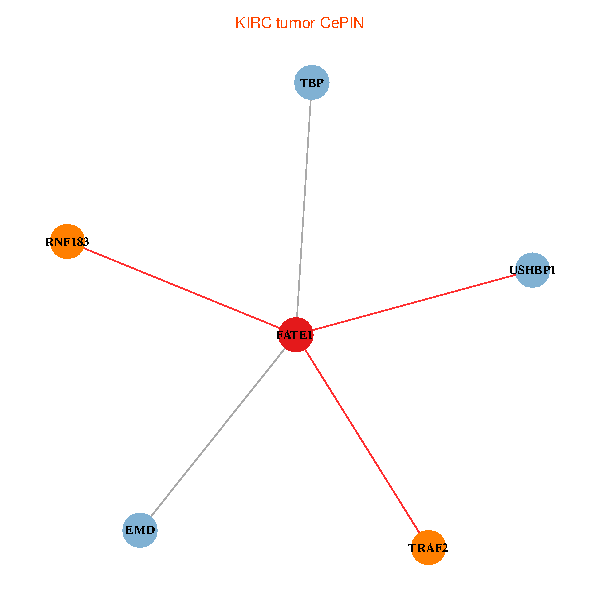
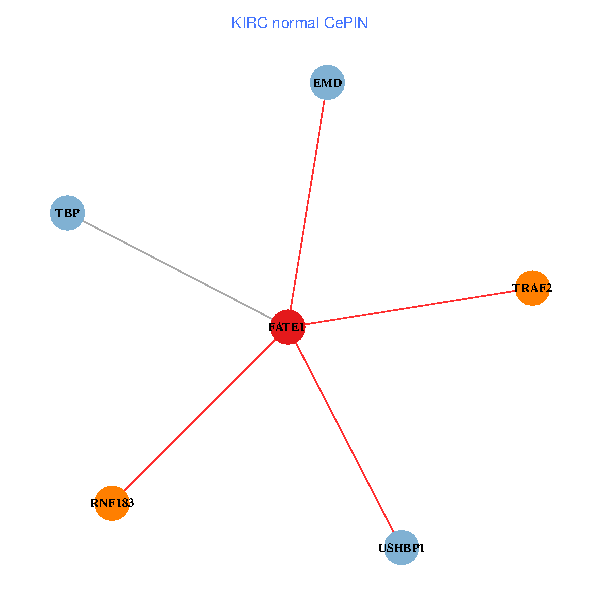
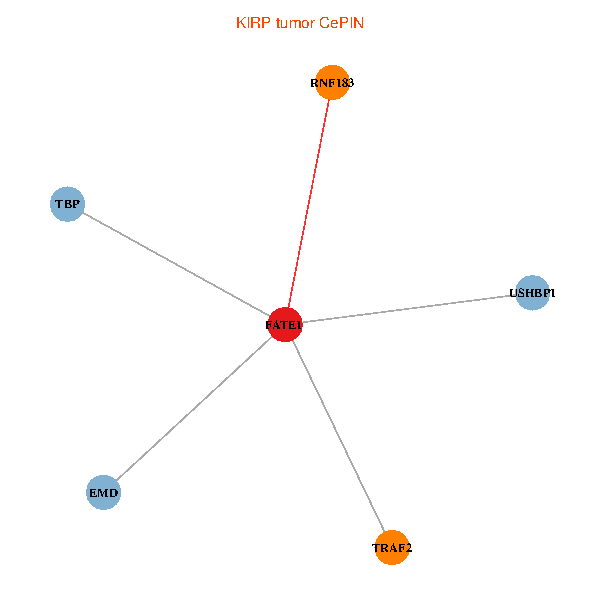
| Co-expressed gene networks based on protein-protein interaction data (CePIN) (TCGA IlluminaHiSeq_RNASeqV2, pan-cancer normalized log2(norm_counts+1) data, version 2016-08-16) (PINA2 ppi data) |
| BRCA (tumor) | BRCA (normal) |
| FATE1, TBP, EMD, TRAF2, USHBP1, RNF183 (tumor) | FATE1, TBP, EMD, TRAF2, USHBP1, RNF183 (normal) |
 |  |
| COAD (tumor) | COAD (normal) |
| FATE1, TBP, EMD, TRAF2, USHBP1, RNF183 (tumor) | FATE1, TBP, EMD, TRAF2, USHBP1, RNF183 (normal) |
 |  |
| HNSC (tumor) | HNSC (normal) |
| FATE1, TBP, EMD, TRAF2, USHBP1, RNF183 (tumor) | FATE1, TBP, EMD, TRAF2, USHBP1, RNF183 (normal) |
 |  |
| KICH (tumor) | KICH (normal) |
| FATE1, TBP, EMD, TRAF2, USHBP1, RNF183 (tumor) | FATE1, TBP, EMD, TRAF2, USHBP1, RNF183 (normal) |
 |  |
| KIRC (tumor) | KIRC (normal) |
| FATE1, TBP, EMD, TRAF2, USHBP1, RNF183 (tumor) | FATE1, TBP, EMD, TRAF2, USHBP1, RNF183 (normal) |
 |  |
| KIRP (tumor) | KIRP (normal) |
| FATE1, TBP, EMD, TRAF2, USHBP1, RNF183 (tumor) | FATE1, TBP, EMD, TRAF2, USHBP1, RNF183 (normal) |
 |  |
| LIHC (tumor) | LIHC (normal) |
| FATE1, TBP, EMD, TRAF2, USHBP1, RNF183 (tumor) | FATE1, TBP, EMD, TRAF2, USHBP1, RNF183 (normal) |
 |  |
| LUAD (tumor) | LUAD (normal) |
| FATE1, TBP, EMD, TRAF2, USHBP1, RNF183 (tumor) | FATE1, TBP, EMD, TRAF2, USHBP1, RNF183 (normal) |
 |  |
| LUSC (tumor) | LUSC (normal) |
| FATE1, TBP, EMD, TRAF2, USHBP1, RNF183 (tumor) | FATE1, TBP, EMD, TRAF2, USHBP1, RNF183 (normal) |
 |  |
| PRAD (tumor) | PRAD (normal) |
| FATE1, TBP, EMD, TRAF2, USHBP1, RNF183 (tumor) | FATE1, TBP, EMD, TRAF2, USHBP1, RNF183 (normal) |
 |  |
| STAD (tumor) | STAD (normal) |
| FATE1, TBP, EMD, TRAF2, USHBP1, RNF183 (tumor) | FATE1, TBP, EMD, TRAF2, USHBP1, RNF183 (normal) |
 |  |
| THCA (tumor) | THCA (normal) |
| FATE1, TBP, EMD, TRAF2, USHBP1, RNF183 (tumor) | FATE1, TBP, EMD, TRAF2, USHBP1, RNF183 (normal) |
 |  |
| Top |
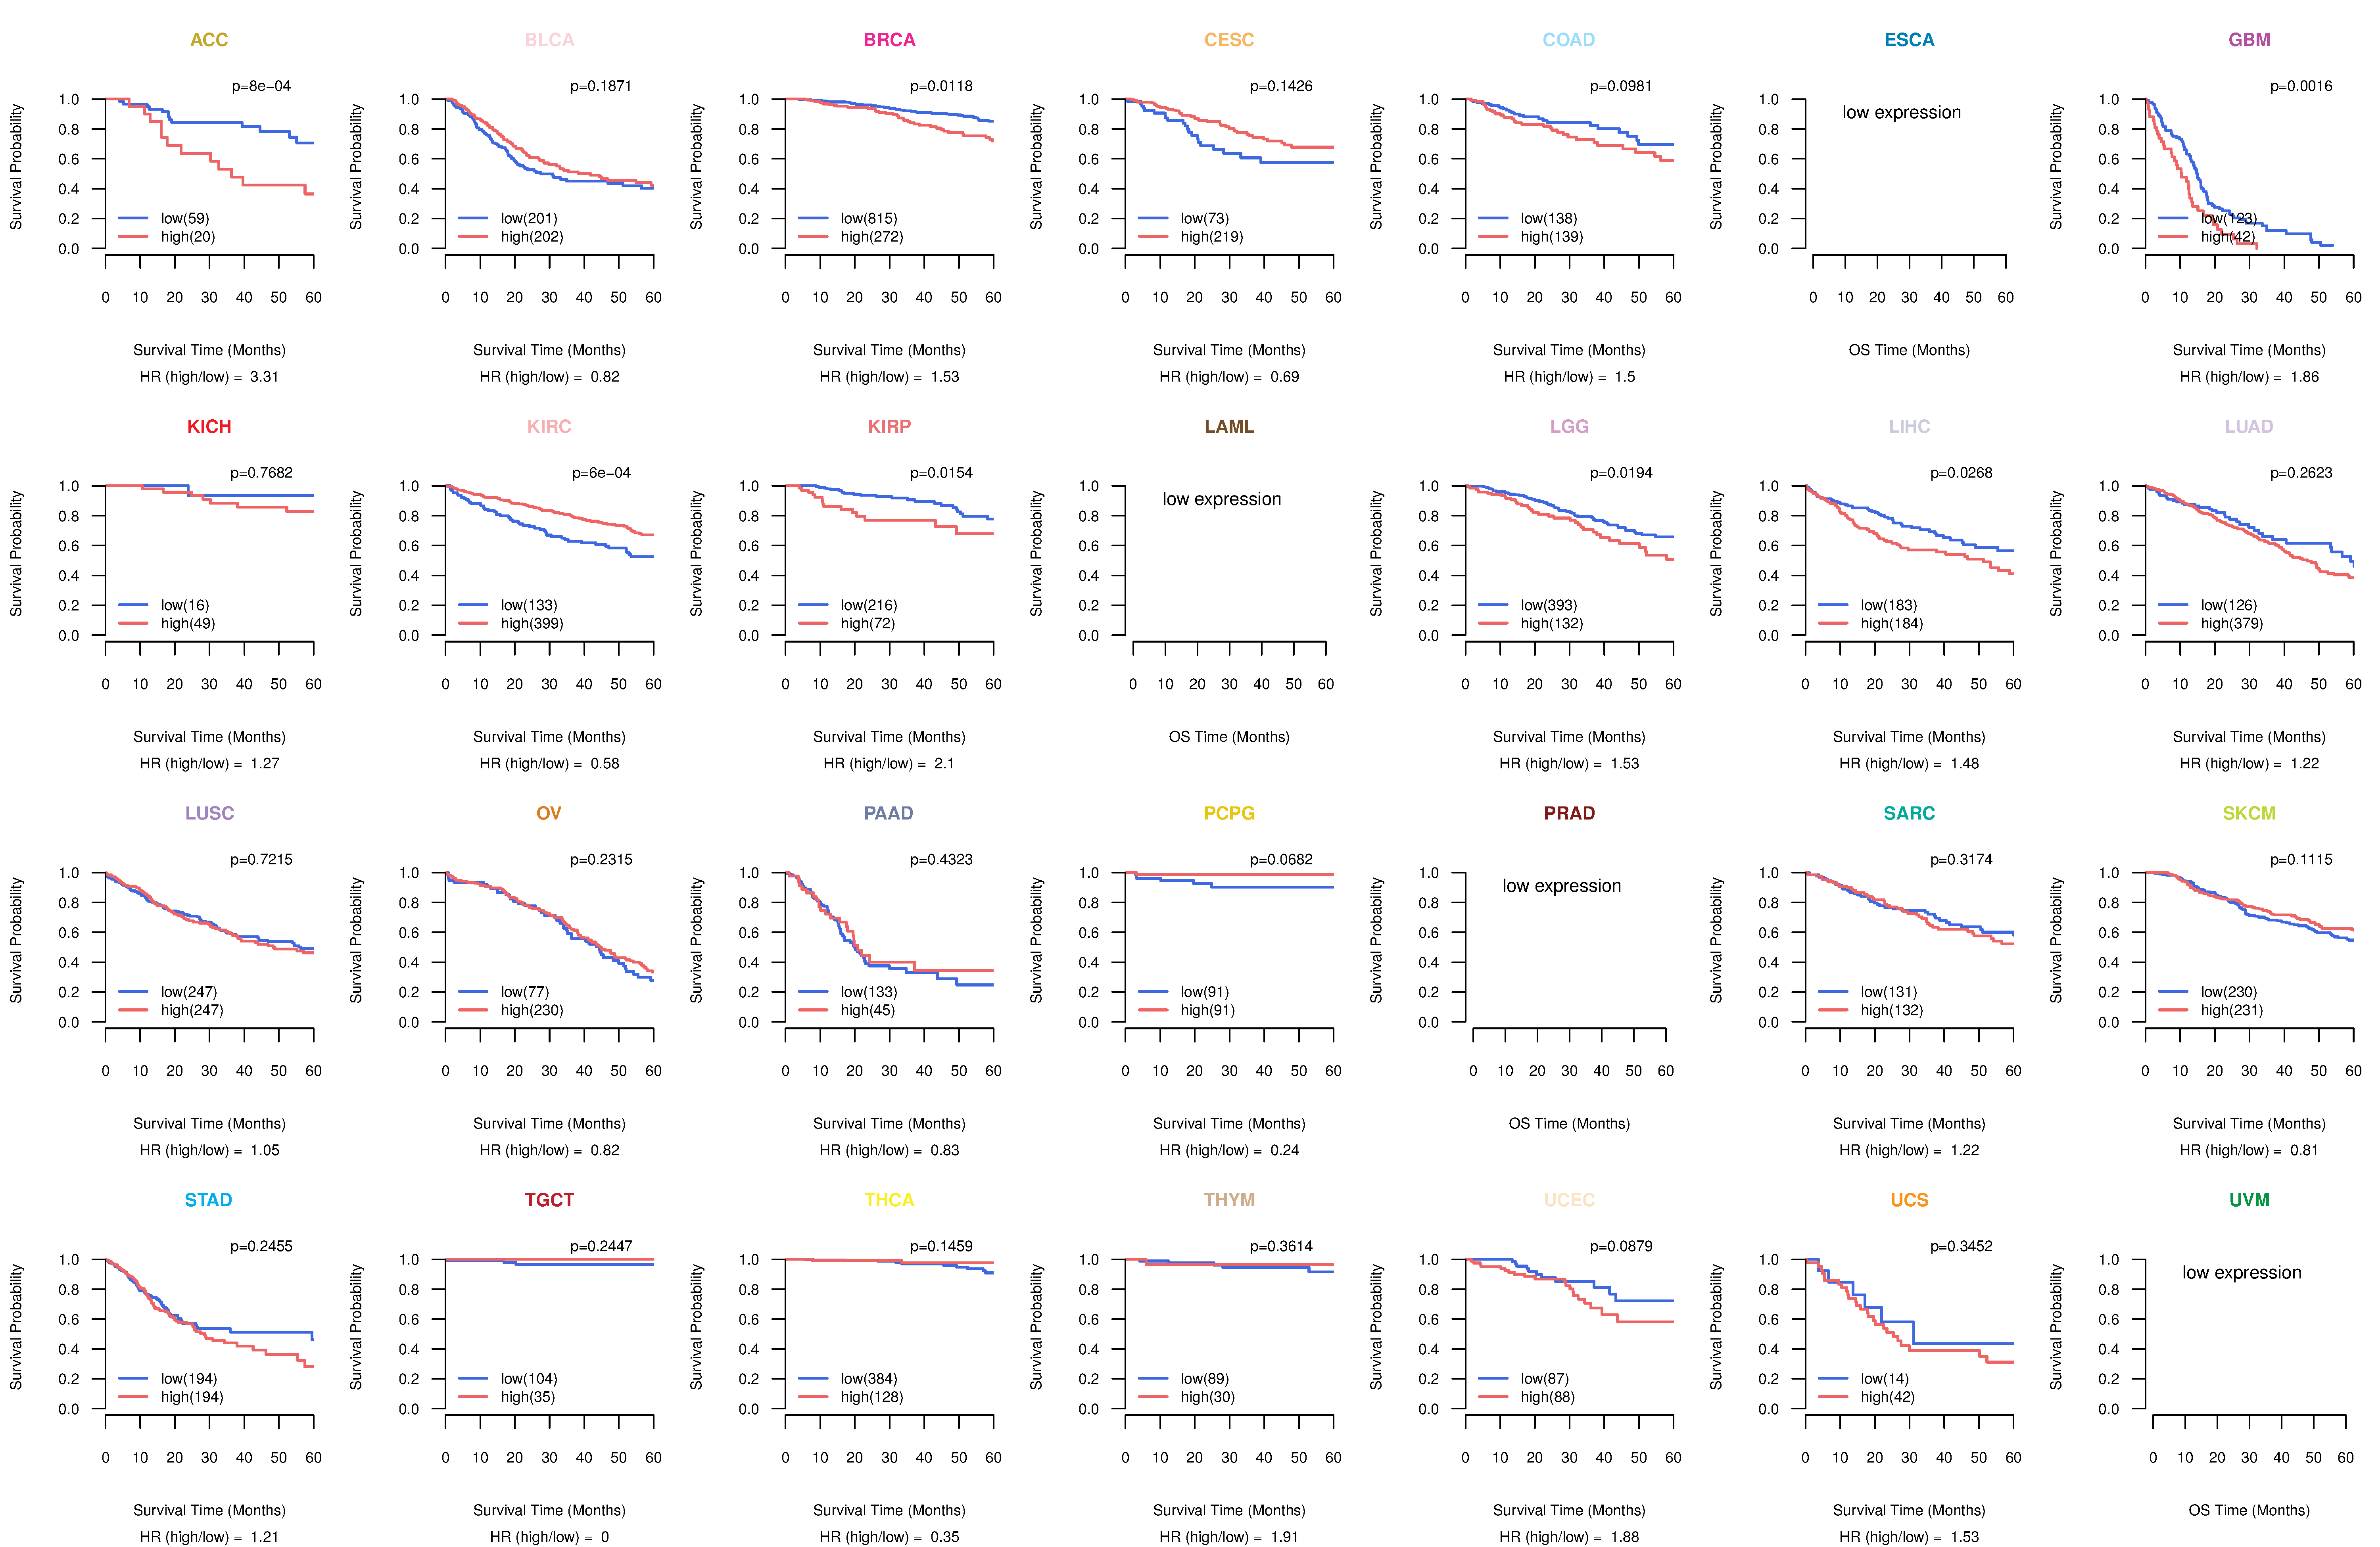
| TissGeneProg for FATE1 |
| Kaplan-Meier plots with logrank tests of overall survival (OS) using 28 cancer types (TCGA IlluminaHiSeq_RNASeqV2, pan-cancer normalized log2(norm_counts+1) data, version 2016-08-16) (TCGA clinicalMatrix, phenotype data, version 2016-04-27) * Click on the image to enlarge it in a new window. |
 |
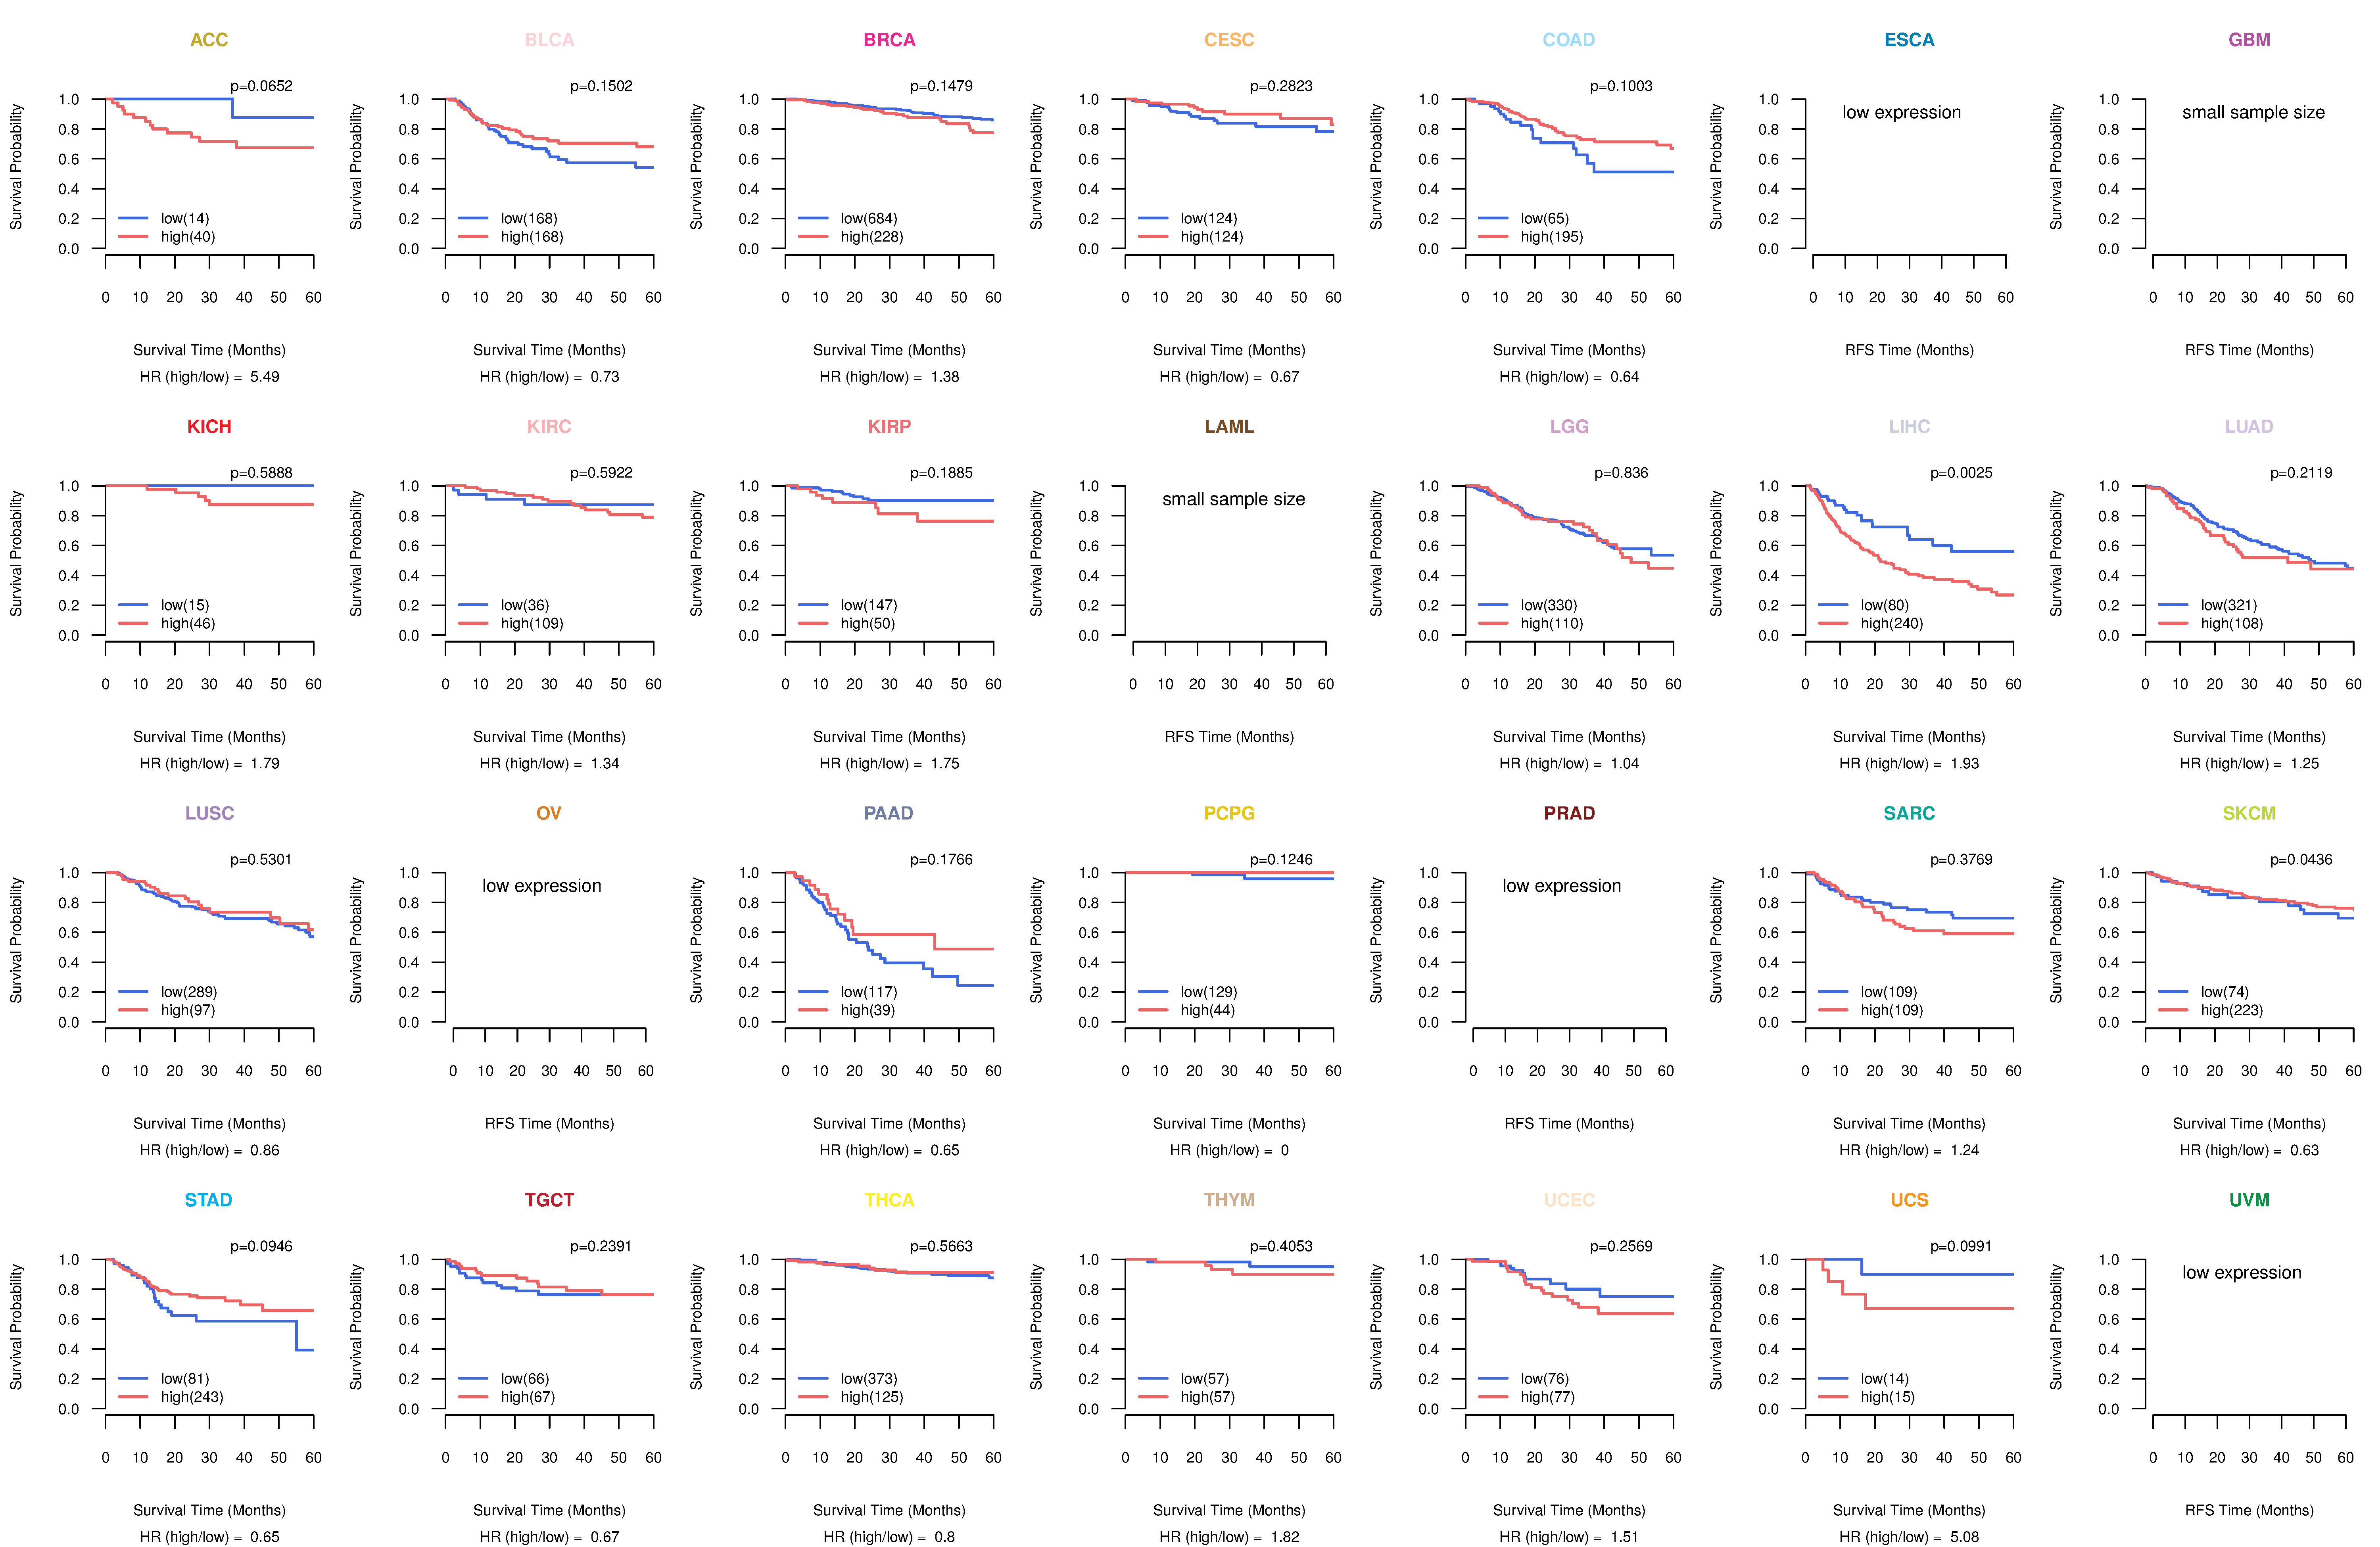
| Kaplan-Meier plots with logrank test of relapse free survival (RFS) using 28 cancer types (TCGA IlluminaHiSeq_RNASeqV2, pan-cancer normalized log2(norm_counts+1) data, version 2016-08-16) (TCGA clinicalMatrix, phenotype data, version 2016-04-27) * Click on the image enlarge it in a new window. |
 |
| Forest plot of Cox proportional hazard ratio (HR) and 95% CI of overall survival (OS) using 28 cancer types (TCGA IlluminaHiSeq_RNASeqV2, pan-cancer normalized log2(norm_counts+1) data, version 2016-08-16) (TCGA clinicalMatrix, phenotype data, version 2016-04-27) * Click on the image enlarge it in a new window. |
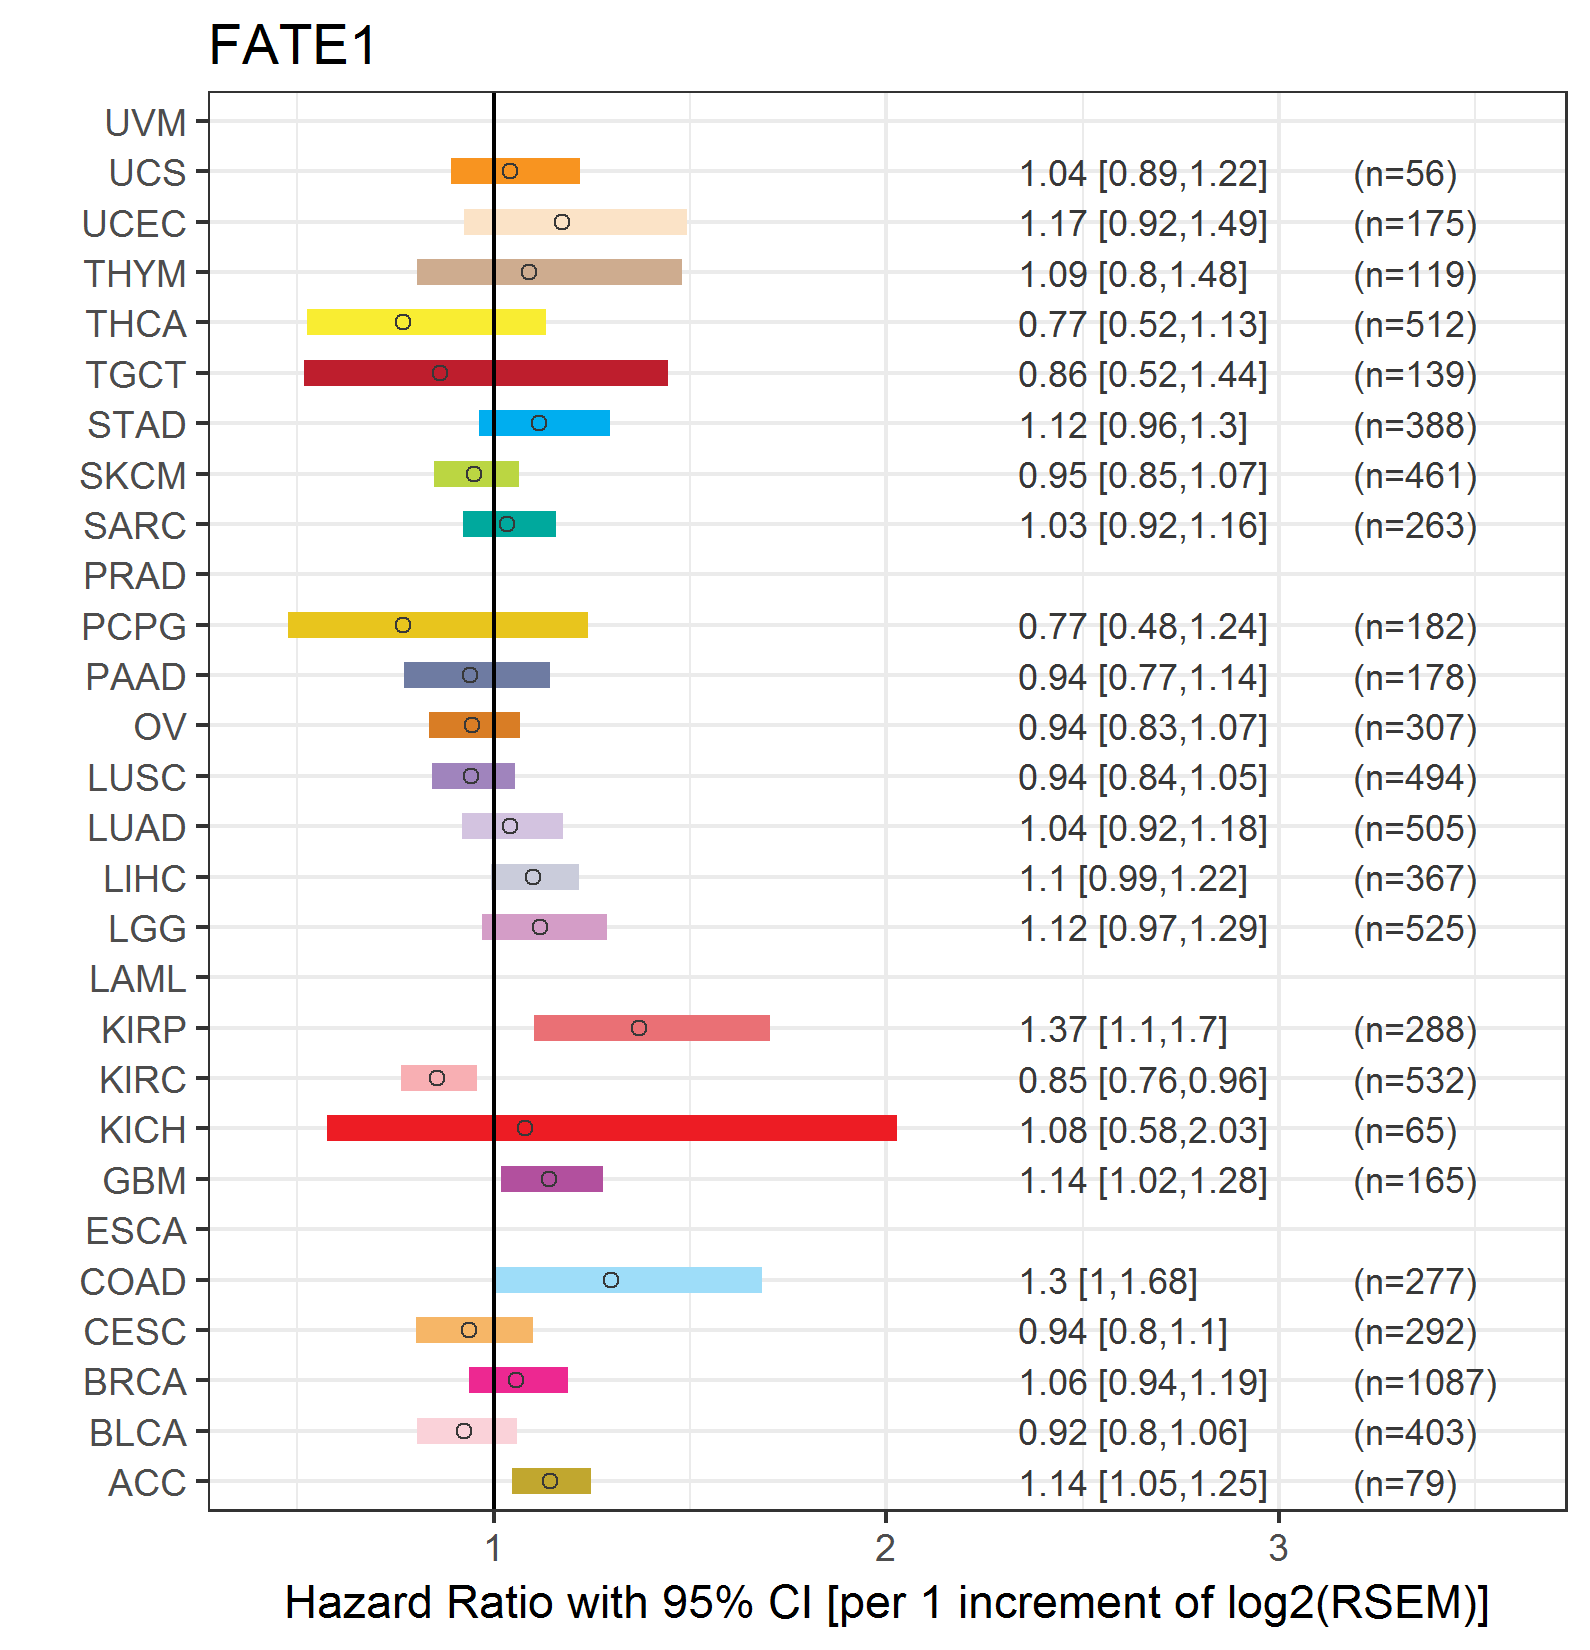 |
| Forest plot of Cox proportional hazard ratio (HR) and 95% CI of relapse free survival (RFS) using 28 cancer types (TCGA IlluminaHiSeq_RNASeqV2, pan-cancer normalized log2(norm_counts+1) data, version 2016-08-16) (TCGA clinicalMatrix, phenotype data, version 2016-04-27) * Click on the image enlarge it in a new window. |
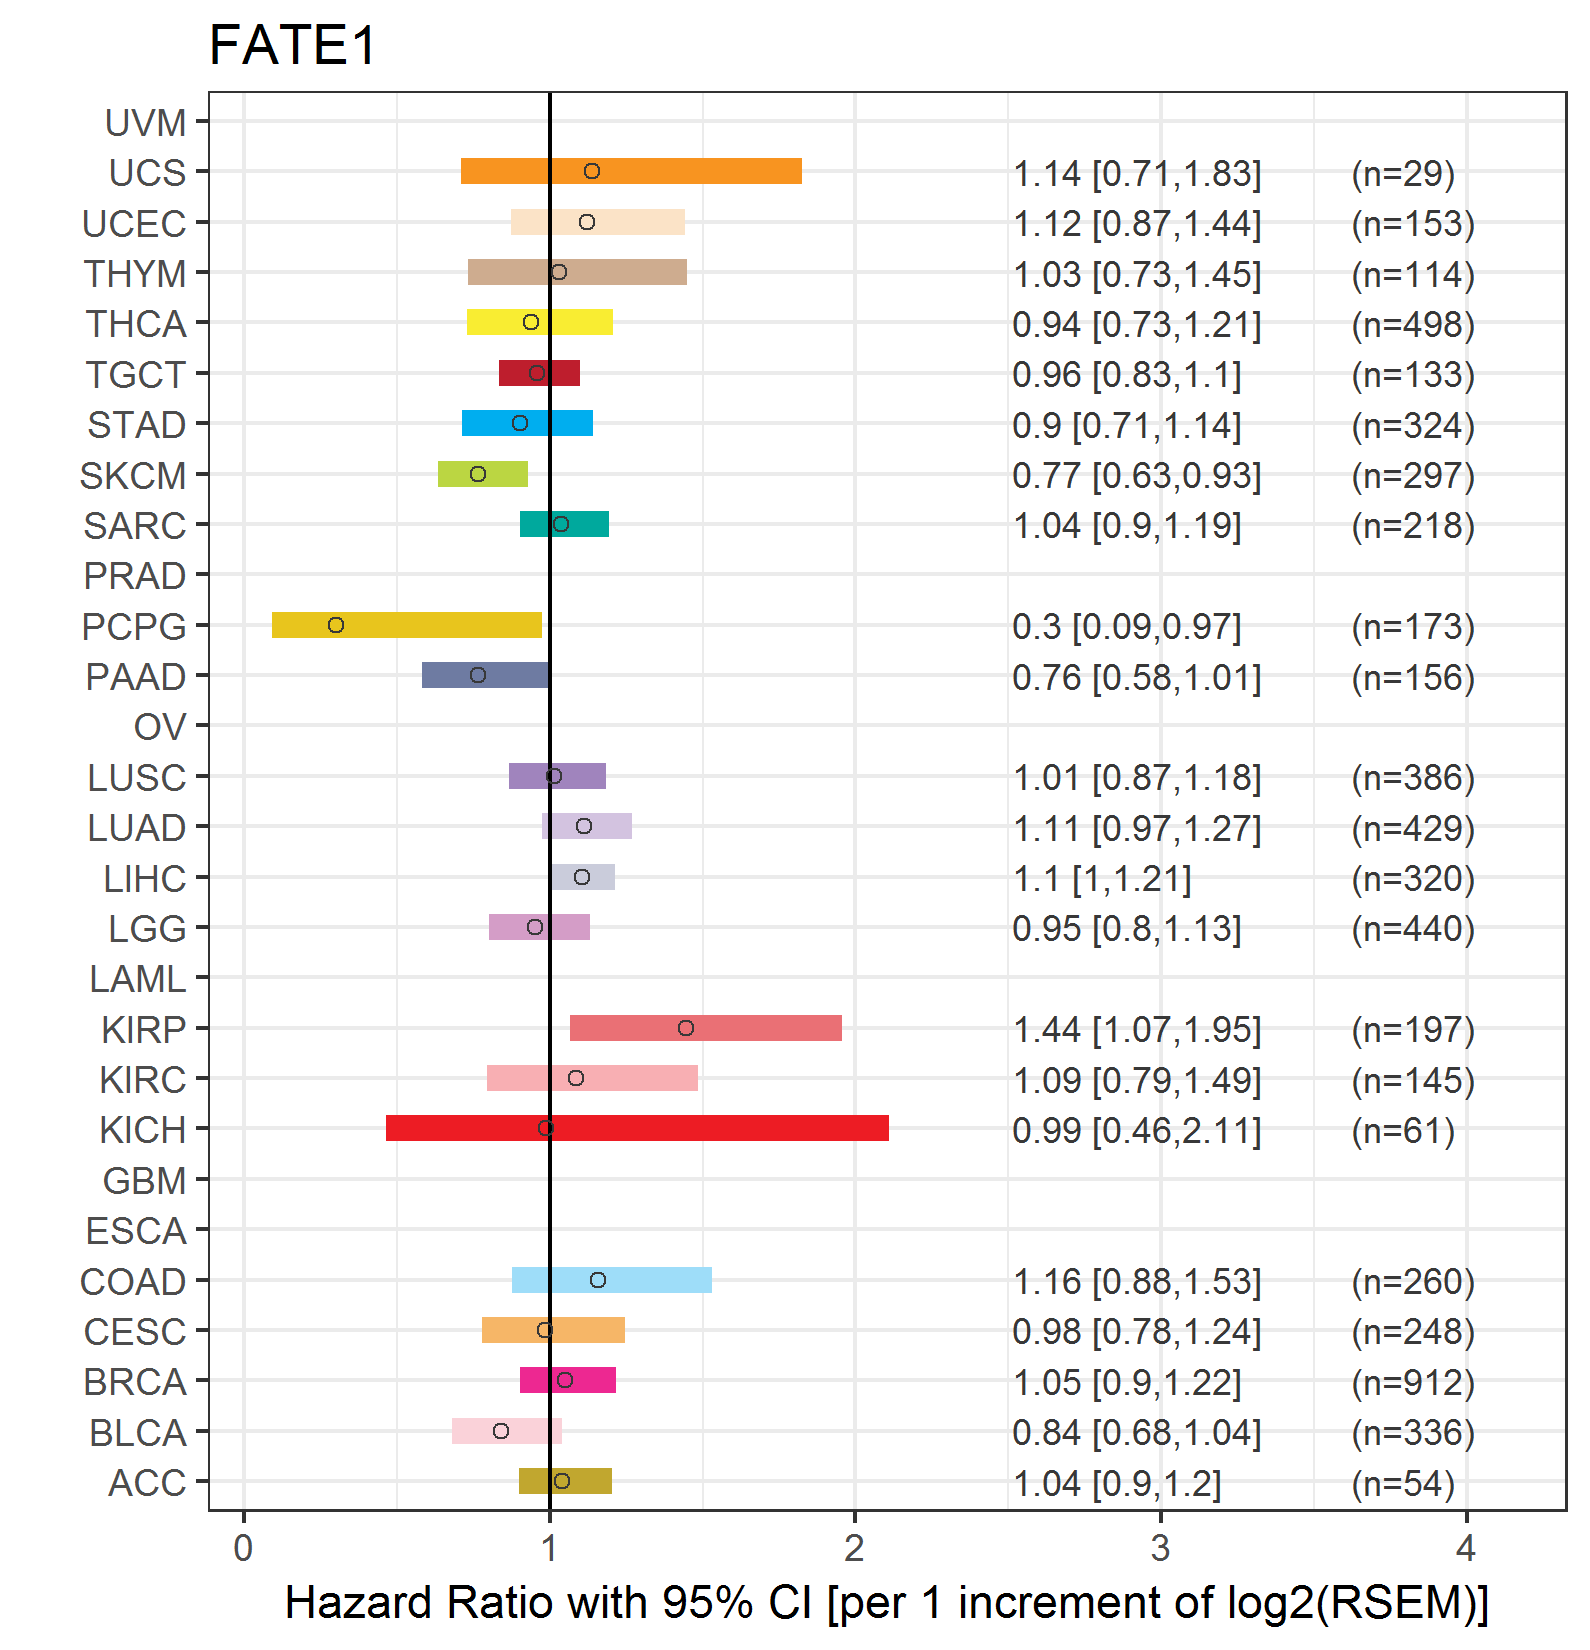 |
| Top |
| TissGeneClin for FATE1 |
| TissGeneDrug for FATE1 |
| Drug information targeting TissGene (DrugBank Version 5.0.6, 2017-04-01) |
| DrugBank ID | Drug name | Drug activity | Drug type | Drug status |
| Top |
| TissGeneDisease for FATE1 |
| Disease information associated with TissGene (DisGeNet, 2016-06-01) |
| Disease ID | Disease name | # pubmeds | Source |
| umls:C0006142 | Malignant neoplasm of breast | 1 | BeFree |
| umls:C0021364 | Male infertility | 1 | BeFree |
| umls:C0022104 | Irritable Bowel Syndrome | 1 | BeFree |
| umls:C0026769 | Multiple Sclerosis | 1 | BeFree |
| umls:C0153594 | Malignant neoplasm of testis | 1 | BeFree |
| umls:C0220756 | Niemann-Pick Disease, Type C | 1 | BeFree |
| umls:C0432306 | Ichthyosis Bullosa of Siemens | 1 | BeFree |
| umls:C0678222 | Breast Carcinoma | 1 | BeFree |
| umls:C0750952 | Biliary Tract Cancer | 1 | BeFree |
| umls:C2239176 | Liver carcinoma | 1 | CTD_human |
|
Copyright 2016-Present - The University of Texas Health Science Center at Houston (UTHealth) Web File Viewing | How to Report, Fraud, Waste and Abuse | State of Texas | Statewide Search | Texas Homeland Security | Site Policies |