 |
| |
| |
| |
| |
| |
| |
|

| TissGeneSummary for CLDN10 |
 Gene summary Gene summary |
| Basic gene information | Gene symbol | CLDN10 |
| Gene name | claudin 10 | |
| Synonyms | CPETRL3|OSP-L | |
| Cytomap | UCSC genome browser: 13q31-q34 | |
| Type of gene | protein-coding | |
| RefGenes | NM_001160100.1, NM_006984.4,NM_182848.3, | |
| Description | OSP-like proteinclaudin-10 | |
| Modification date | 20141207 | |
| dbXrefs | HGNC : HGNC | |
| Ensembl : ENSG00000134873 | ||
| HPRD : 13063 | ||
| Vega : OTTHUMG00000017217 | ||
| Protein | UniProt: go to UniProt's Cross Reference DB Table | |
| Expression | CleanEX: HS_CLDN10 | |
| BioGPS: 9071 | ||
| Pathway | NCI Pathway Interaction Database: CLDN10 | |
| KEGG: CLDN10 | ||
| REACTOME: CLDN10 | ||
| Pathway Commons: CLDN10 | ||
| Context | iHOP: CLDN10 | |
| ligand binding site mutation search in PubMed: CLDN10 | ||
| UCL Cancer Institute: CLDN10 | ||
| Assigned class in TissGDB* | C | |
| Included tissue-specific gene expression resources | ||
| Specific-tissues in normal samples (assigned by TissGDB using HPA, TiGER, and GTEx) | KidneyPancreas | |
| Cancer types related to the specific-tissues in cancer samples (assigned by TissGDB using TCGA) | KIRC,KIRP,KICHPAAD | |
| Reference showing the relevant tissue of CLDN10 | ||
| Description by TissGene annotations | ||
| * Class A consists of genes with literature evidence and is part of the cTissGenes. Class B consists of only cTissGenes without additional evidence. The remaining genes belong to Class C. |
| Gene ontology having evidence of Inferred from Direct Assay (IDA) from Entrez |
| GO ID | GO term | PubMed ID |
| Top |
| TissGeneExp for CLDN10 |
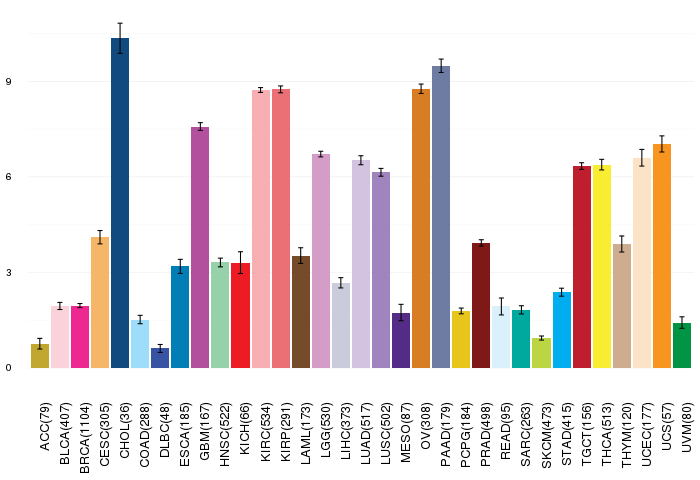
| Gene expressions across 28 cancer types (X-axis: cancer type and Y-axis: log2(norm_counts+1)) (TCGA IlluminaHiSeq_RNASeqV2, pan-cancer normalized log2(norm_counts+1) data, version 2016-08-16) |
 |
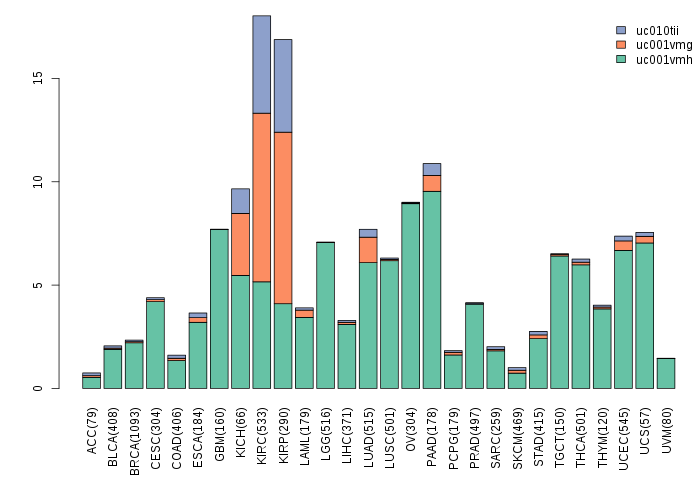
| Gene isoform expressions across 28 cancer types (X-axis: cancer type and Y-axis: log2(norm_counts+1)) (TCGA pan-cancer tcga_rsem_isoform_tpm, version 2016-09-01) |
 |
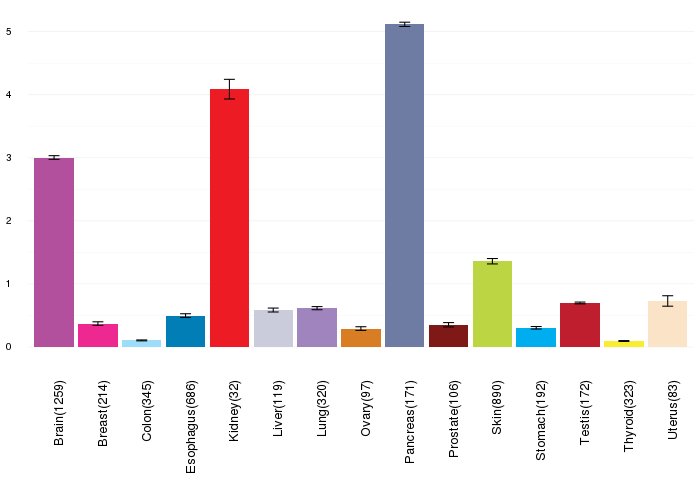
| Gene expressions across normal tissues of GTEx data (GTEx GTEx_Analysis_v6_RNA-seq_RNA-SeQCv1.1.8_gene_rpkm.gct) - Here, we shows the matched tissue types only among our 28 cancer types. |
 |
| Different expressions across 14 cancer types with more than 10 samples between matched tumors and normals (X-axis: cancer type and Y-axis: log2(norm_counts+1)) (TCGA IlluminaHiSeq_RNASeqV2, pan-cancer normalized log2(norm_counts+1) data, version 2016-08-16) |
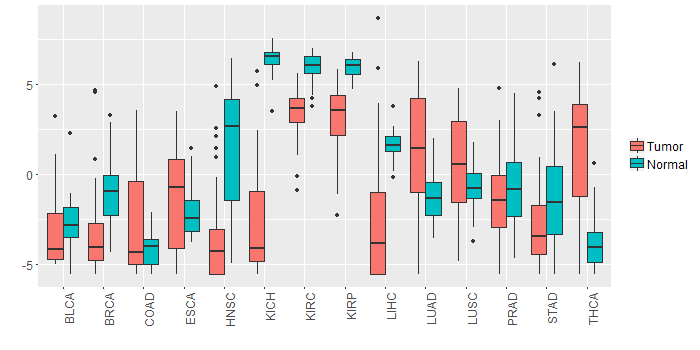 |
| - Significantly differentially expressed cancer types and information. (|Fold change|>1 and FDR<0.05) |
| Cancer type | Mean(exp) in tumor | Mean(exp) in matched normal | Log2FC | P-val. | FDR |
| LUAD | 1.308623494 | -1.323788575 | 2.632412069 | 2.11E-07 | 7.84E-07 |
| KIRP | 3.109815089 | 5.952036964 | -2.842221875 | 6.85E-10 | 6.59E-09 |
| KICH | -2.622592161 | 6.352887839 | -8.97548 | 1.60E-13 | 2.23E-12 |
| KIRC | 3.426613006 | 5.971551895 | -2.544938889 | 8.97E-31 | 1.83E-29 |
| LIHC | -2.578992161 | 1.657873839 | -4.236866 | 1.14E-11 | 1.77E-10 |
| HNSC | -3.569602207 | 1.684386165 | -5.253988372 | 5.34E-12 | 1.52E-10 |
| THCA | 1.067012653 | -3.885200907 | 4.952213559 | 9.22E-15 | 1.13E-13 |
| BRCA | -3.579378441 | -1.032364406 | -2.547014035 | 1.39E-21 | 1.11E-20 |
| COAD | -2.551639238 | -4.177139238 | 1.6255 | 0.0207 | 0.041343391 |
| LUSC | 0.324493643 | -0.760369102 | 1.084862745 | 0.0149 | 0.022998492 |
| Top |
| TissGene-miRNA for CLDN10 |
| Significantly anti-correlated miRNAs of TissGene across 28 cancer types (Gene-miRNA relations from TargetScanHuman Relsease 7.1, Conserved_Site_Context_Scores.txt.zip, 06.01.2016) (TCGA IlluminaHiSeq_miRNASeq, log2(RPM+1) data, version 2016-11-21) (TCGA IlluminaHiSeq_RNASeqV2, log2(normalized_count+1) data, version 2016-08-16) (Spearman’s Rank Correlation (p-value<0.05 and coefficient<-0.25)) |
| Cancer type | miRNA id | miRNA accession | P-val. | Coeff. | # samples |
| Top |
| TissGeneMut for CLDN10 |
| TissGeneSNV for CLDN10 |
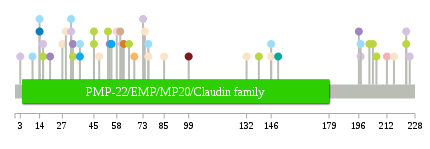
| nsSNV counts per each loci. Different colors of circles represent different cancer types. Circle size denotes number of samples. (TCGA somatic mutation (SNPs and small INDELs) data, version 2016-04-25) * Click on the image to enlarge it in a new window. |
 |
 |
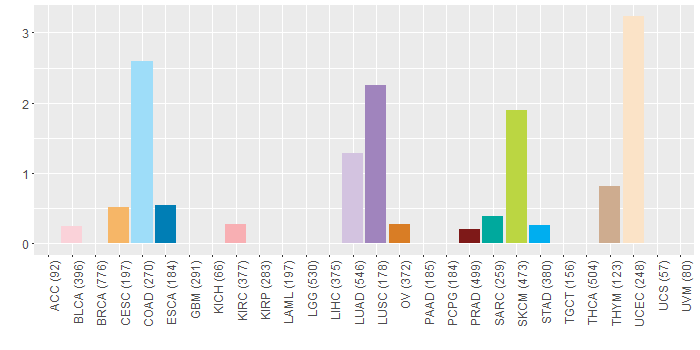
| Somatic nucleotide variants of TissGene across 28 cancer types (X-axis: cancer type and Y-axis: % of mutated samples) The numbers in parentheses are numbers of samples with mutation (nsSNVs). (TCGA somatic mutation (SNPs and small INDELs) data, version 2016-04-25) |
 |
| - nsSNVs sorted by frequency. |
| AAchange | Cancer type | # samples |
| p.S16L | SKCM | 1 |
| p.V20I | LUSC | 1 |
| p.R204Q | SKCM | 1 |
| p.N54K | LUSC | 1 |
| p.G74_splice | UCEC | 1 |
| p.R33Q | LUSC | 1 |
| p.Y29C | UCEC | 1 |
| p.S58Y | BLCA | 1 |
| p.G37S | STAD | 1 |
| p.S58Y | READ | 1 |
| p.I82M | HNSC | 1 |
| p.Q45X | SKCM | 1 |
| p.T27A | UCEC | 1 |
| p.G196E | LUSC | 1 |
| p.N223K | LUAD | 1 |
| p.V32L | COAD | 1 |
| p.G14X | ESCA | 1 |
| p.N225K | LUAD | 1 |
| p.F146L | COAD | 1 |
| p.A10T | COAD | 1 |
| p.M99I | PRAD | 1 |
| p.I84M | HNSC | 1 |
| p.D65N | SKCM | 1 |
| p.T32M | LUAD | 1 |
| p.K139I | SKCM | 1 |
| p.D212H | KIRC | 1 |
| p.F68C | CESC | 1 |
| p.F146L | UCEC | 1 |
| p.G14R | COAD | 1 |
| p.A10V | HNSC | 1 |
| p.D73Y | LUAD | 1 |
| p.S197Y | LUAD | 1 |
| p.C61* | LUAD | 1 |
| p.N223T | SKCM | 1 |
| p.A55V | STAD | 1 |
| p.R33Q | SKCM | 1 |
| p.W48R | UCEC | 1 |
| p.R202W | HNSC | 1 |
| p.S16L | LUAD | 1 |
| p.F146L | READ | 1 |
| p.M132V | UCEC | 1 |
| p.C53G | SKCM | 1 |
| p.R3M | LUAD | 1 |
| p.H206Y | SKCM | 1 |
| p.A197V | COAD | 1 |
| p.I76M | UCEC | 1 |
| p.V60I | THYM | 1 |
| p.F89S | HNSC | 1 |
| p.Q45* | SKCM | 1 |
| p.T216A | UCEC | 1 |
| p.I76M | COAD | 1 |
| p.R62L | OV | 1 |
| p.V150I | SARC | 1 |
| p.A85T | UCEC | 1 |
| p.G37D | COAD | 1 |
| p.R202Q | SKCM | 1 |
| Top |
| TissGeneCNV for CLDN10 |
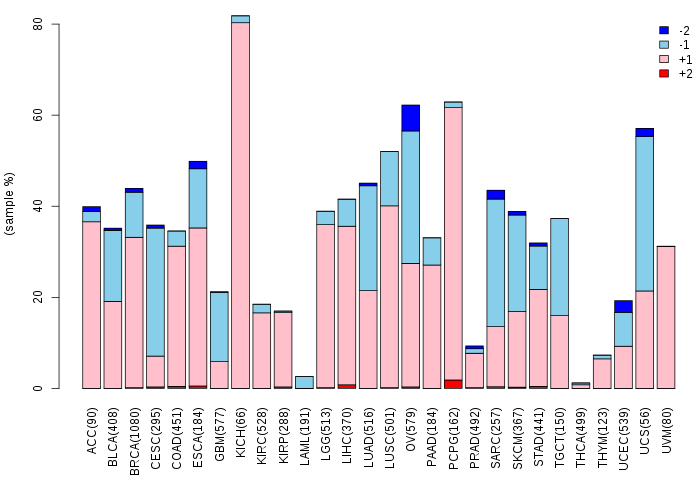
| Copy number variations of TissGene across 28 cancer types (X-axis: cancer type and Y-axis: % of CNV samples) (TCGA Gistic2_CopyNumber_Gistic2_all_data_by_genes, Gistic2 copy number data, version 2016-08-16) |
 |
| Top |
| TissGeneFusions for CLDN10 |
| Fusion genes including TissGene (ChimerDB 3.0, 2016-12-01 and TCGA fusion Portal 2015-12-01) |
| Database | Src | Cancer type | Sample | Fusion gene | ORF | 5'-gene BP | 3'-gene BP |
| Chimerdb3.0 | ChiTaRs | NA | BP333889 | STATH-CLDN10 | chr4:70868094 | chr13:96103484 | |
| TCGAfusionPortal | PRADA | HNSC | TCGA-CR-6467-01A | CLDN10-TTC12 | In-frame | Chr13:96212717 | Chr11:113220795 |
| Top |
| TissGeneNet for CLDN10 |
| Co-expressed gene networks based on protein-protein interaction data (CePIN) (TCGA IlluminaHiSeq_RNASeqV2, pan-cancer normalized log2(norm_counts+1) data, version 2016-08-16) (PINA2 ppi data) |
| Top |
| TissGeneProg for CLDN10 |
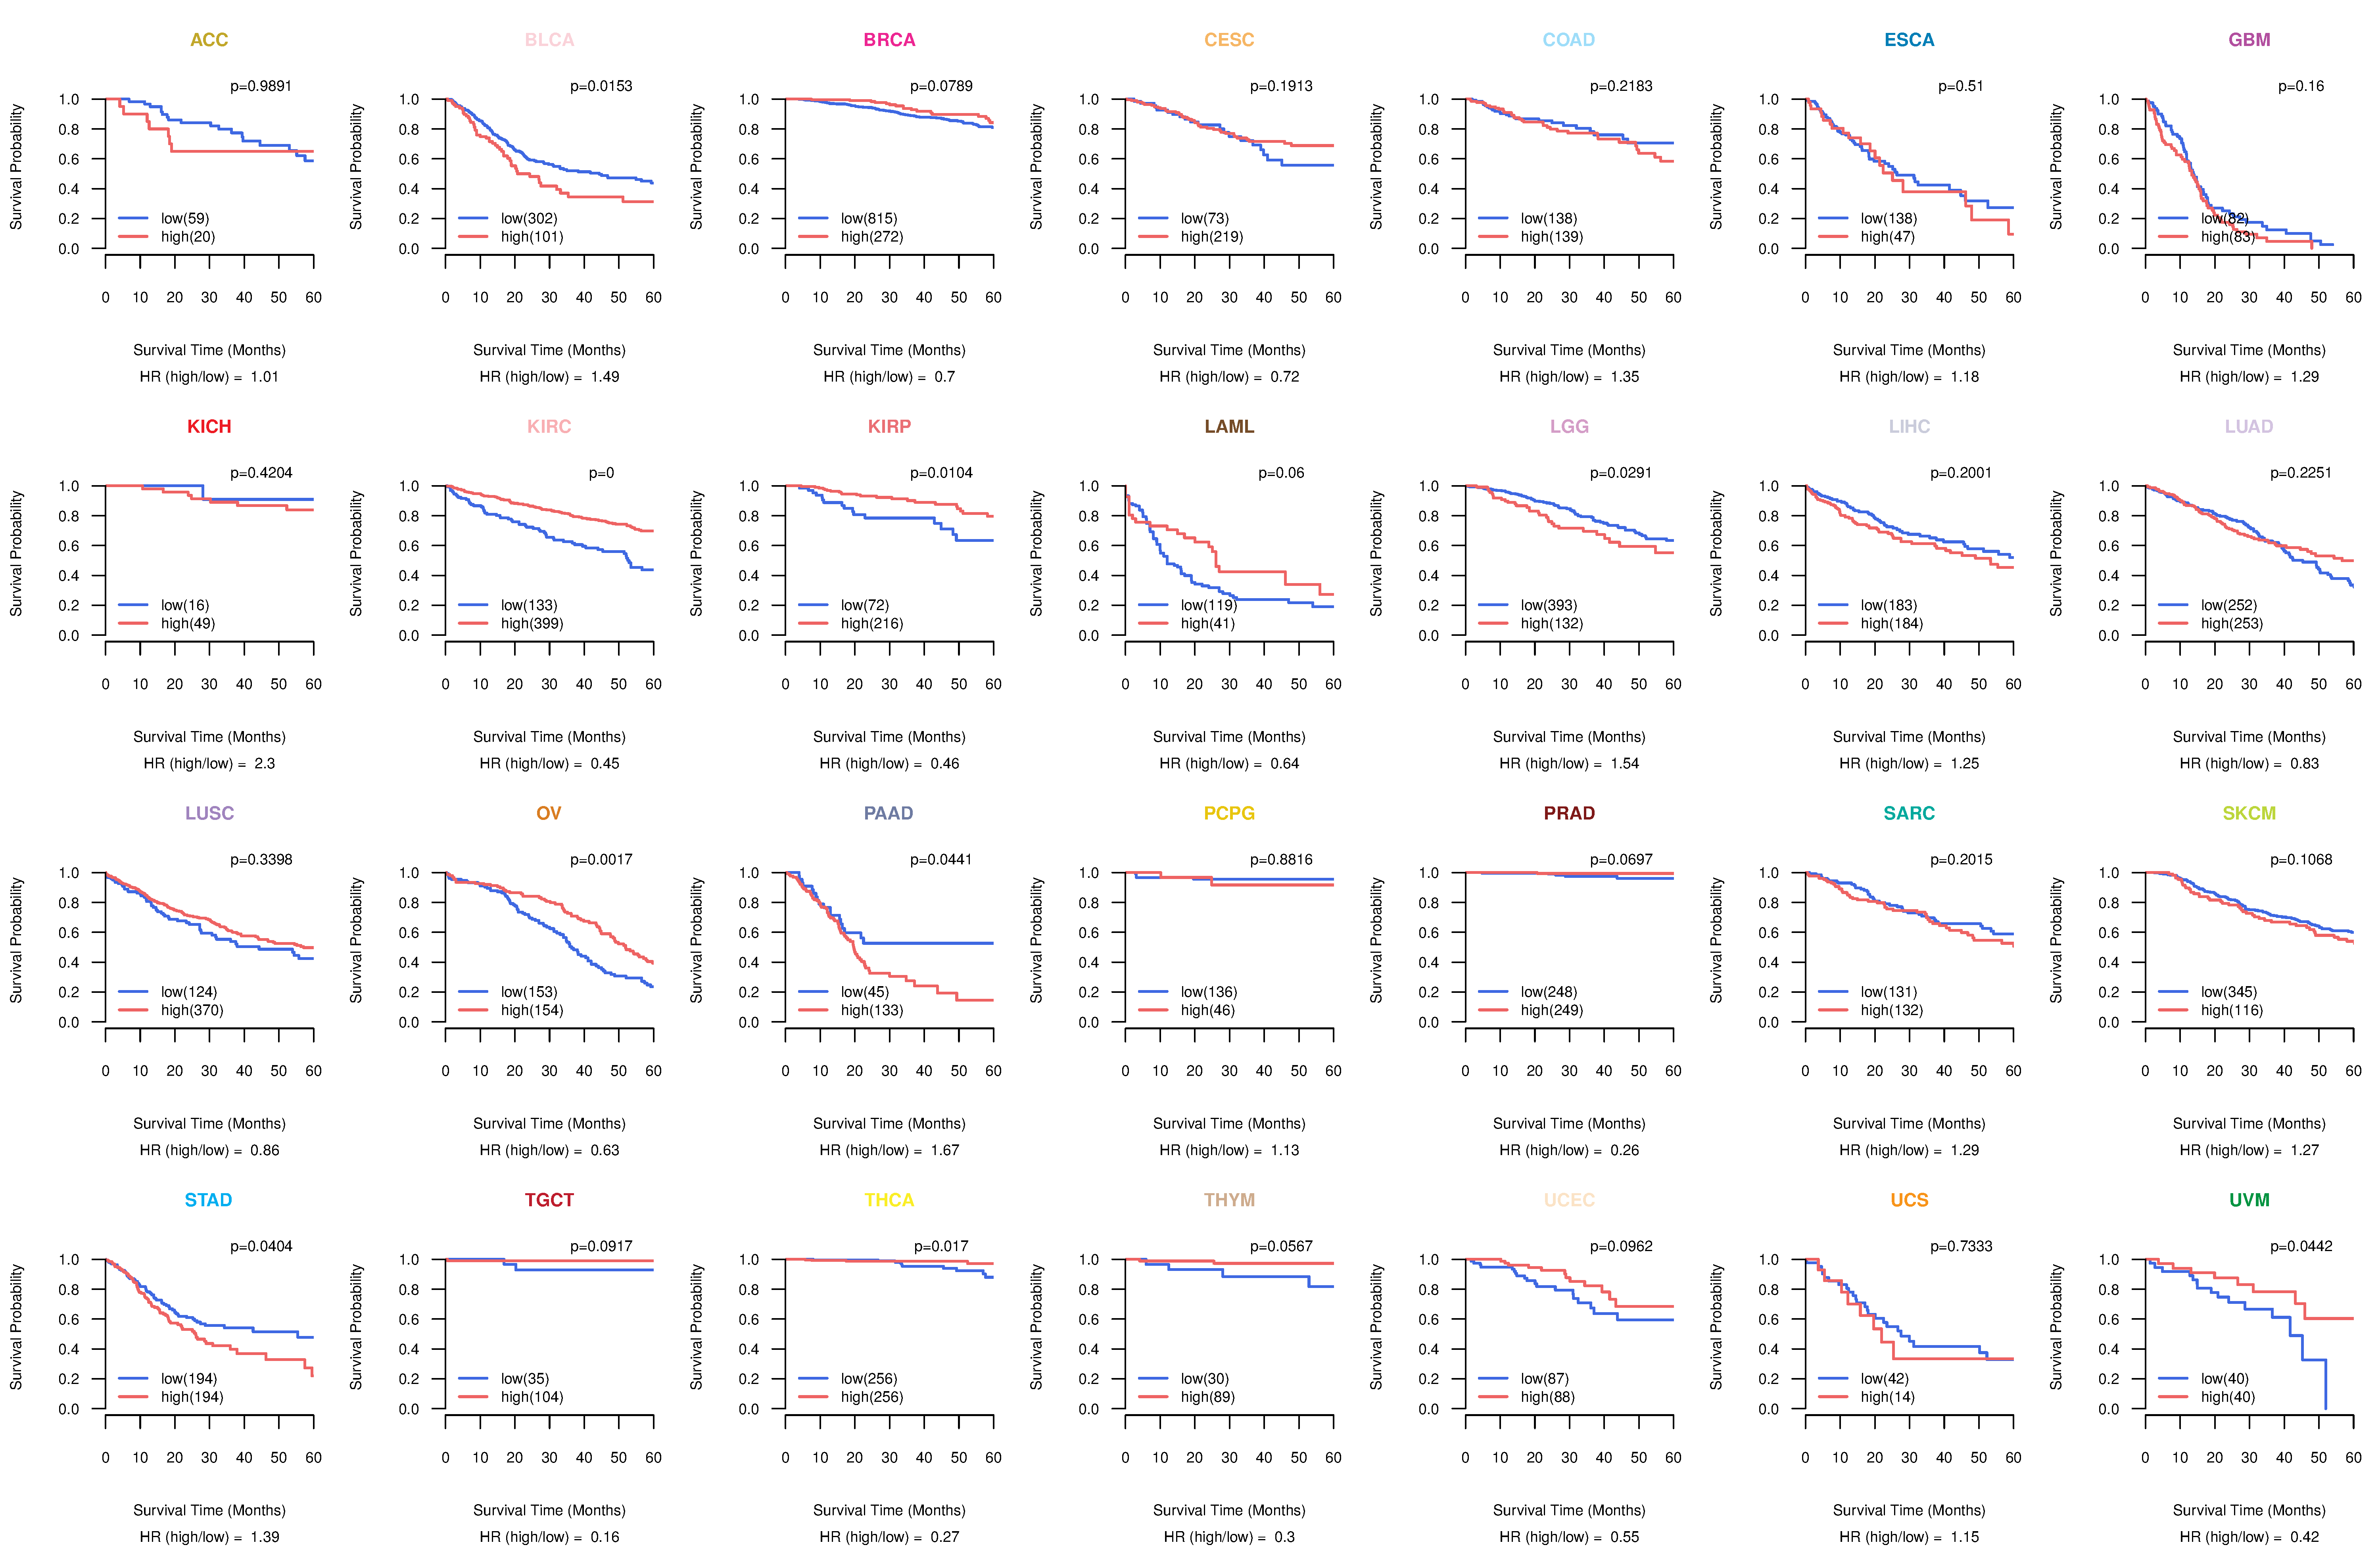
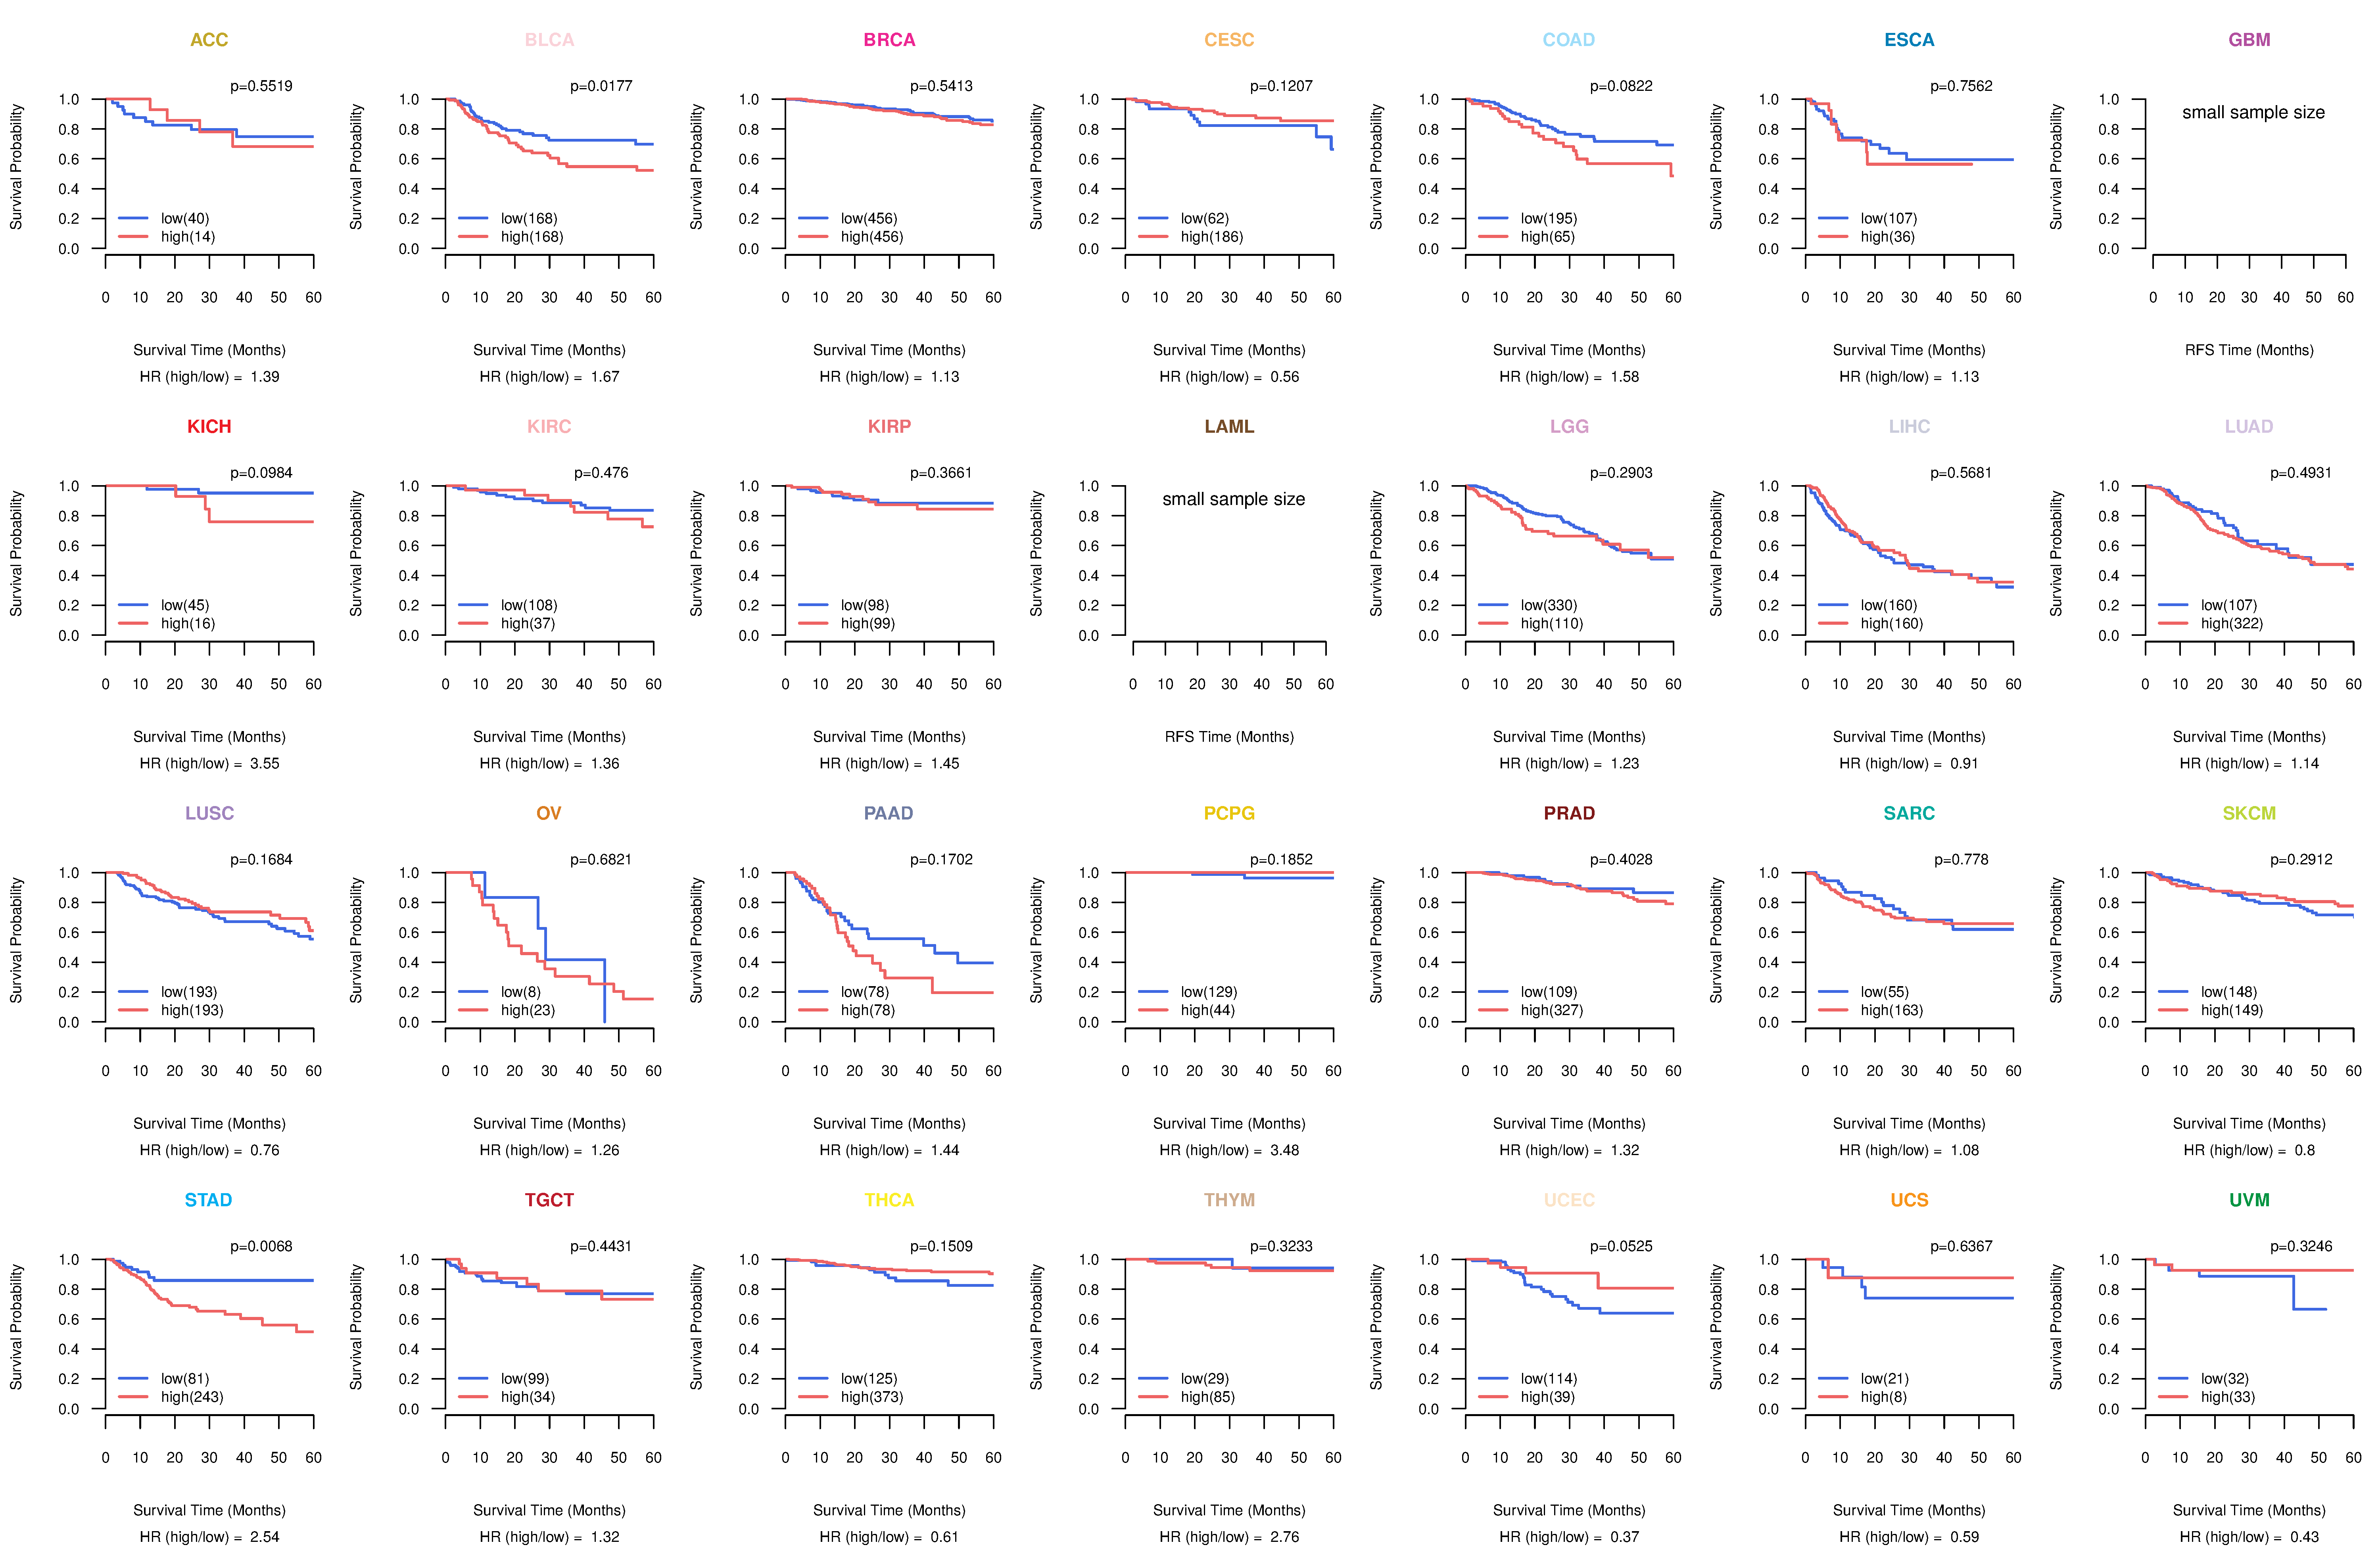
| Kaplan-Meier plots with logrank tests of overall survival (OS) using 28 cancer types (TCGA IlluminaHiSeq_RNASeqV2, pan-cancer normalized log2(norm_counts+1) data, version 2016-08-16) (TCGA clinicalMatrix, phenotype data, version 2016-04-27) * Click on the image to enlarge it in a new window. |
 |
| Kaplan-Meier plots with logrank test of relapse free survival (RFS) using 28 cancer types (TCGA IlluminaHiSeq_RNASeqV2, pan-cancer normalized log2(norm_counts+1) data, version 2016-08-16) (TCGA clinicalMatrix, phenotype data, version 2016-04-27) * Click on the image enlarge it in a new window. |
 |
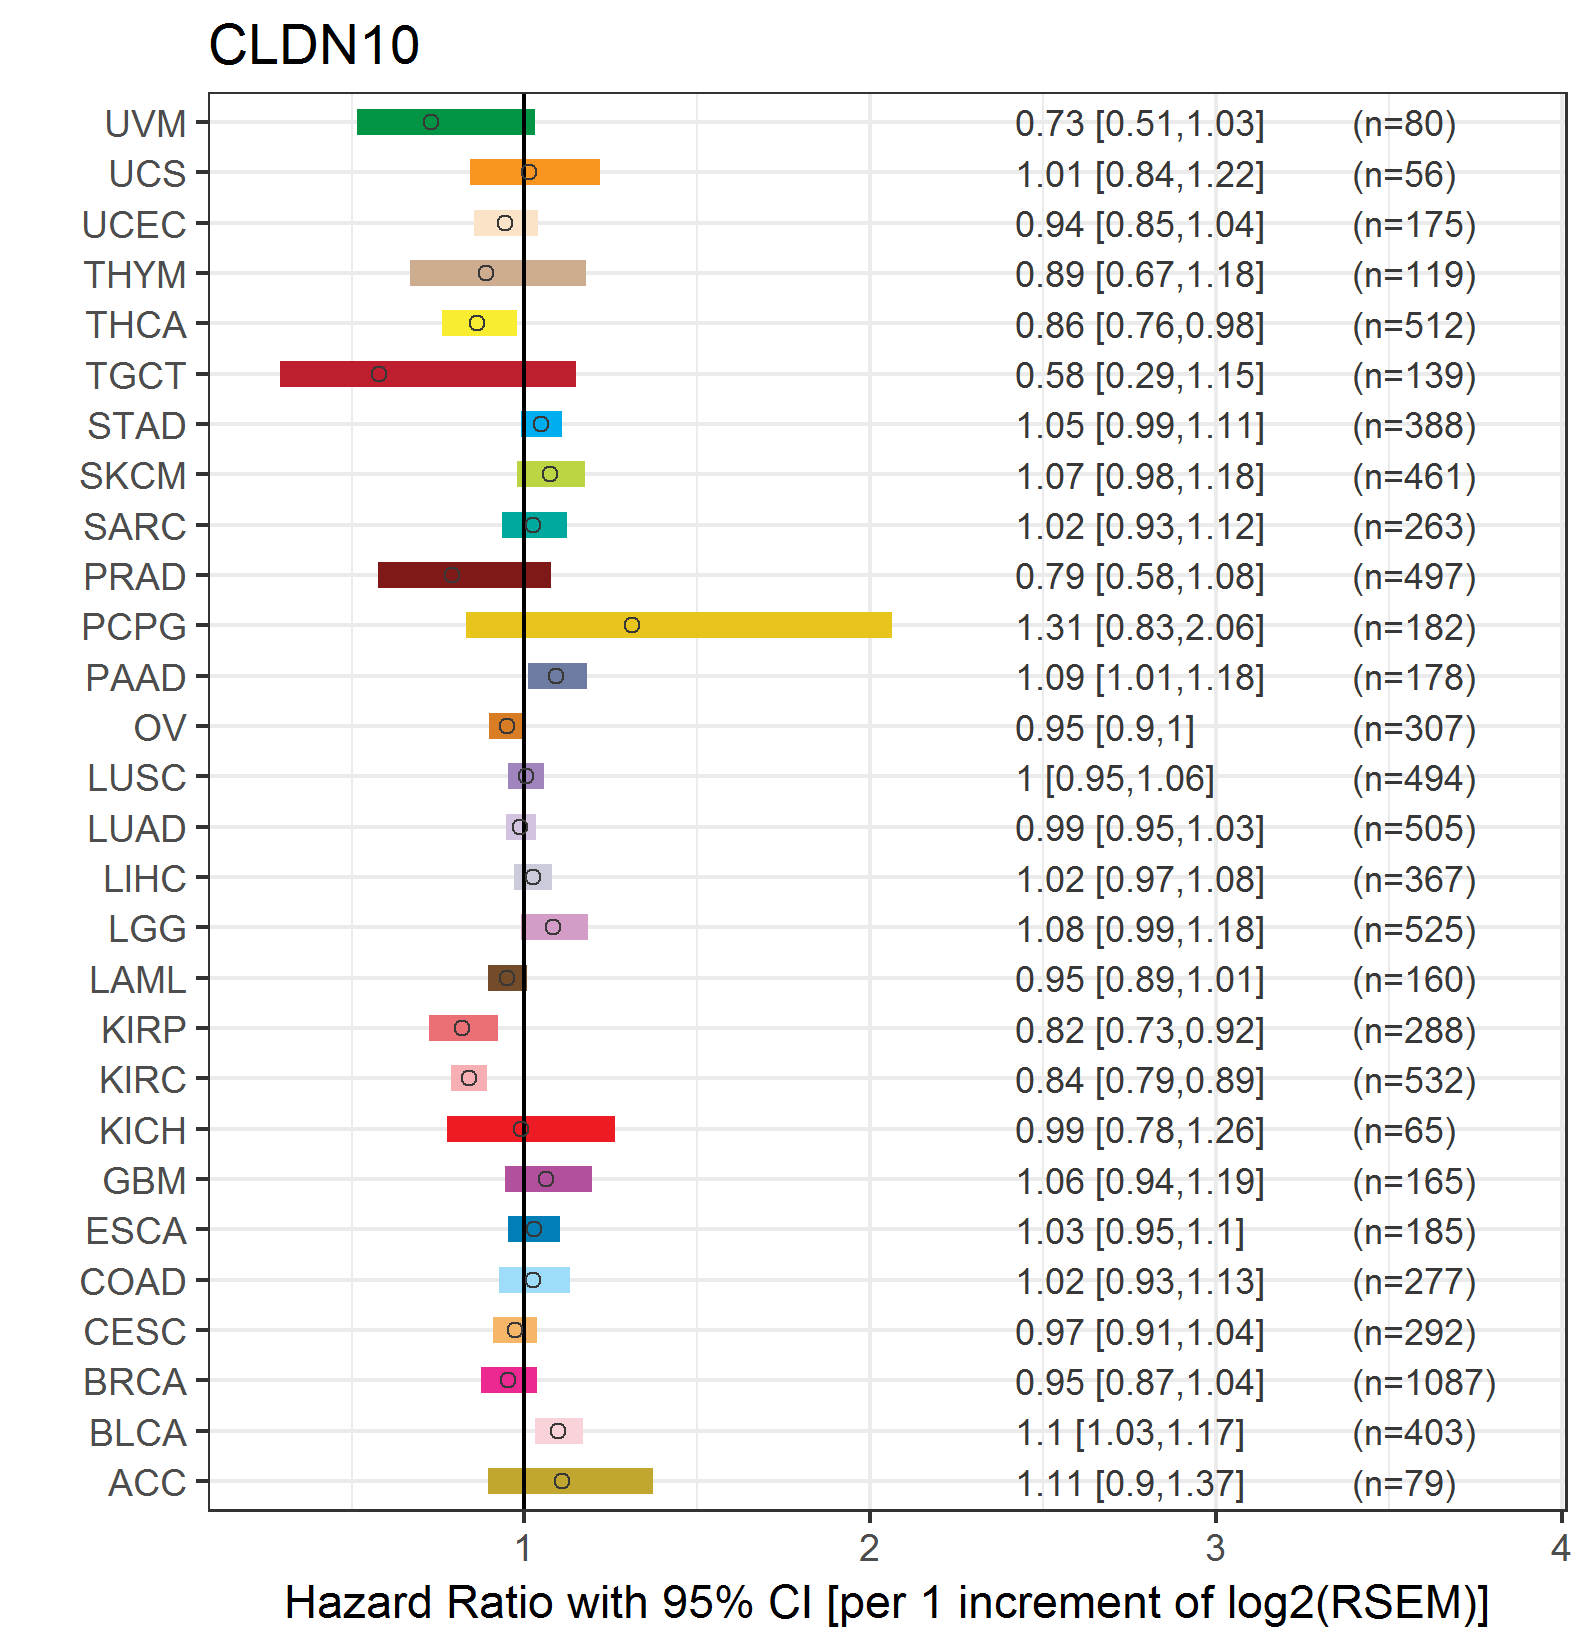
| Forest plot of Cox proportional hazard ratio (HR) and 95% CI of overall survival (OS) using 28 cancer types (TCGA IlluminaHiSeq_RNASeqV2, pan-cancer normalized log2(norm_counts+1) data, version 2016-08-16) (TCGA clinicalMatrix, phenotype data, version 2016-04-27) * Click on the image enlarge it in a new window. |
 |
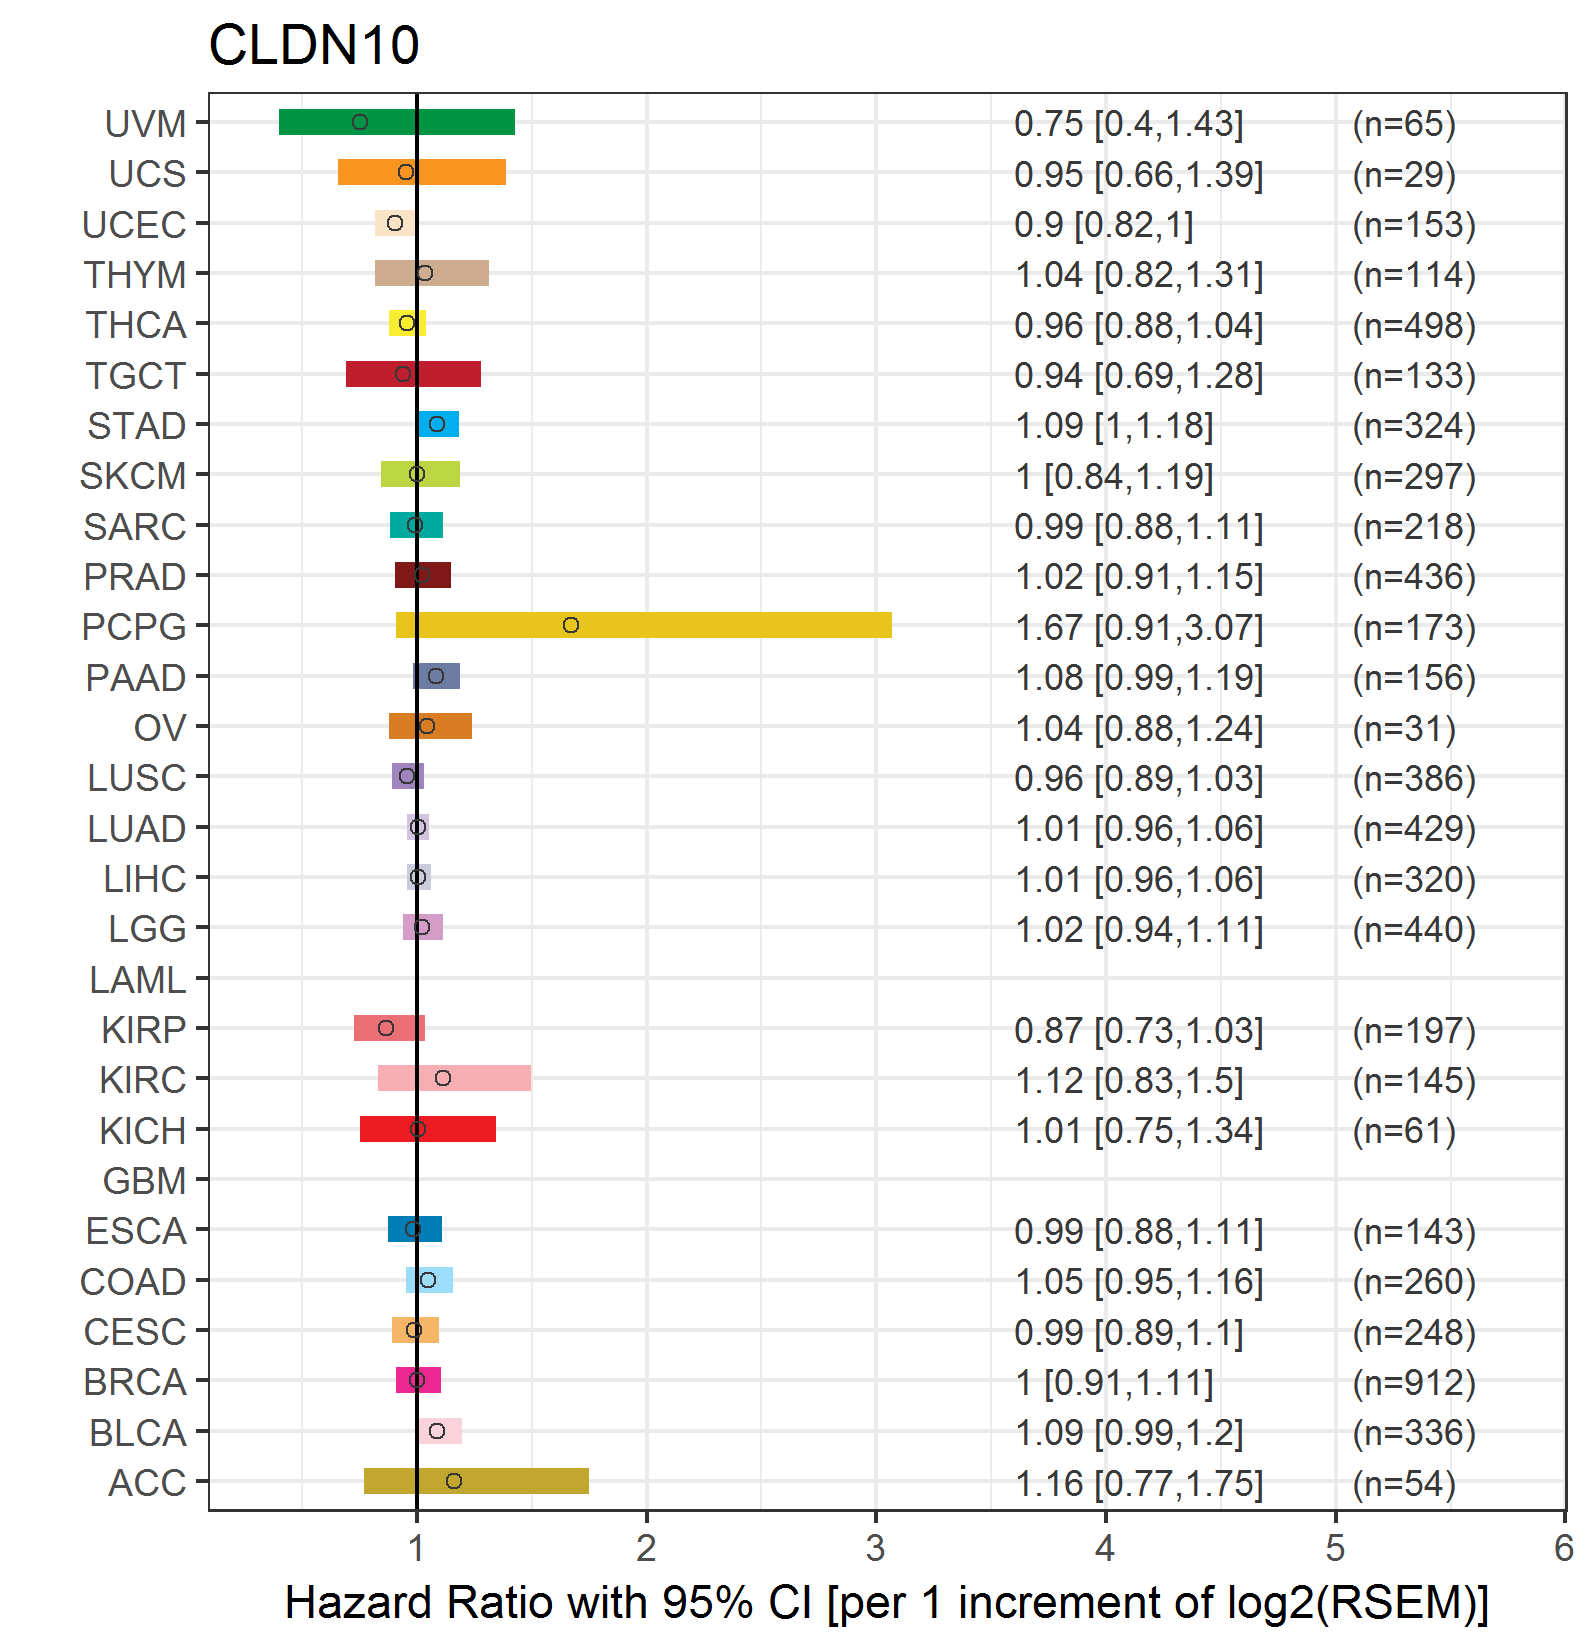
| Forest plot of Cox proportional hazard ratio (HR) and 95% CI of relapse free survival (RFS) using 28 cancer types (TCGA IlluminaHiSeq_RNASeqV2, pan-cancer normalized log2(norm_counts+1) data, version 2016-08-16) (TCGA clinicalMatrix, phenotype data, version 2016-04-27) * Click on the image enlarge it in a new window. |
 |
| Top |
| TissGeneClin for CLDN10 |
| TissGeneDrug for CLDN10 |
| Drug information targeting TissGene (DrugBank Version 5.0.6, 2017-04-01) |
| DrugBank ID | Drug name | Drug activity | Drug type | Drug status |
| Top |
| TissGeneDisease for CLDN10 |
| Disease information associated with TissGene (DisGeNet, 2016-06-01) |
| Disease ID | Disease name | # pubmeds | Source |
| umls:C2239176 | Liver carcinoma | 2 | BeFree,LHGDN |
| umls:C0027627 | Neoplasm Metastasis | 1 | BeFree |
| umls:C0040336 | Tobacco Use Disorder | 1 | GAD |
|
Copyright 2016-Present - The University of Texas Health Science Center at Houston (UTHealth) Web File Viewing | How to Report, Fraud, Waste and Abuse | State of Texas | Statewide Search | Texas Homeland Security | Site Policies |