 |
| |
| |
| |
| |
| |
| |
|

| TissGeneSummary for USP2 |
 Gene summary Gene summary |
| Basic gene information | Gene symbol | USP2 |
| Gene name | ubiquitin specific peptidase 2 | |
| Synonyms | UBP41|USP9 | |
| Cytomap | UCSC genome browser: 11q23.3 | |
| Type of gene | protein-coding | |
| RefGenes | NM_001243759.1, NM_004205.4,NM_171997.2, | |
| Description | 41 kDa ubiquitin-specific proteasedeubiquitinating enzyme 2ubiquitin carboxyl-terminal hydrolase 2ubiquitin specific protease 12ubiquitin specific protease 9ubiquitin thioesterase 2ubiquitin-specific-processing protease 2 | |
| Modification date | 20141222 | |
| dbXrefs | MIM : 604725 | |
| HGNC : HGNC | ||
| Ensembl : ENSG00000036672 | ||
| HPRD : 05287 | ||
| Vega : OTTHUMG00000166200 | ||
| Protein | UniProt: go to UniProt's Cross Reference DB Table | |
| Expression | CleanEX: HS_USP2 | |
| BioGPS: 9099 | ||
| Pathway | NCI Pathway Interaction Database: USP2 | |
| KEGG: USP2 | ||
| REACTOME: USP2 | ||
| Pathway Commons: USP2 | ||
| Context | iHOP: USP2 | |
| ligand binding site mutation search in PubMed: USP2 | ||
| UCL Cancer Institute: USP2 | ||
| Assigned class in TissGDB* | C | |
| Included tissue-specific gene expression resources | TiGER,GTEx | |
| Specific-tissues in normal samples (assigned by TissGDB using HPA, TiGER, and GTEx) | Testis | |
| Cancer types related to the specific-tissues in cancer samples (assigned by TissGDB using TCGA) | TGCT | |
| Reference showing the relevant tissue of USP2 | ||
| Description by TissGene annotations | Cancer gene | |
| * Class A consists of genes with literature evidence and is part of the cTissGenes. Class B consists of only cTissGenes without additional evidence. The remaining genes belong to Class C. |
| Gene ontology having evidence of Inferred from Direct Assay (IDA) from Entrez |
| GO ID | GO term | PubMed ID | GO:0016579 | protein deubiquitination | 17290220 | GO:0050821 | protein stabilization | 17290220 | GO:0016579 | protein deubiquitination | 17290220 | GO:0050821 | protein stabilization | 17290220 |
| Top |
| TissGeneExp for USP2 |
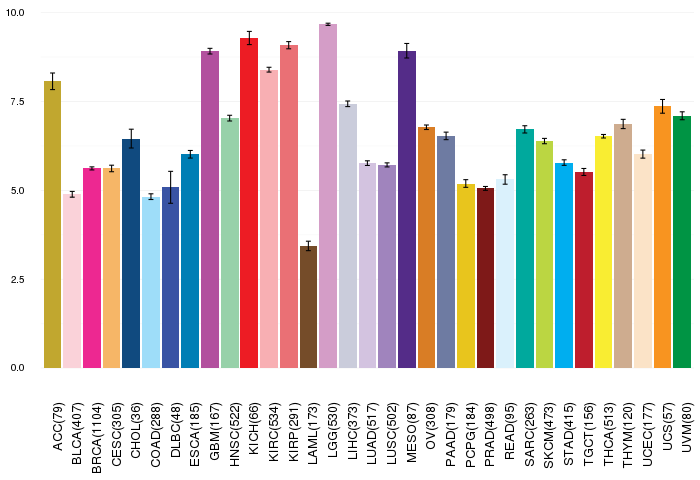
| Gene expressions across 28 cancer types (X-axis: cancer type and Y-axis: log2(norm_counts+1)) (TCGA IlluminaHiSeq_RNASeqV2, pan-cancer normalized log2(norm_counts+1) data, version 2016-08-16) |
 |
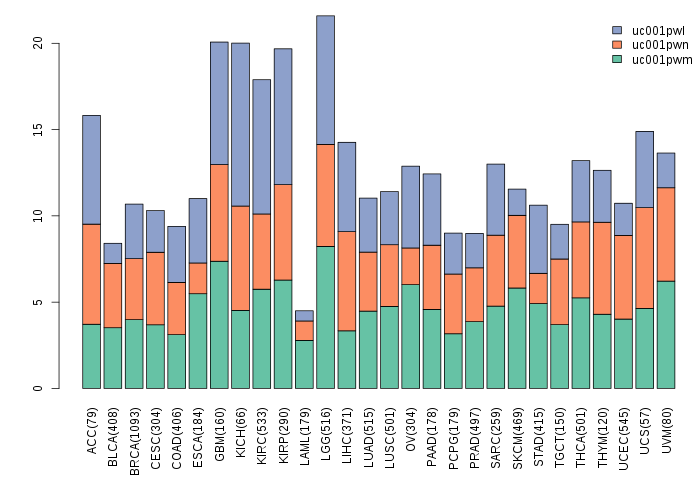
| Gene isoform expressions across 28 cancer types (X-axis: cancer type and Y-axis: log2(norm_counts+1)) (TCGA pan-cancer tcga_rsem_isoform_tpm, version 2016-09-01) |
 |
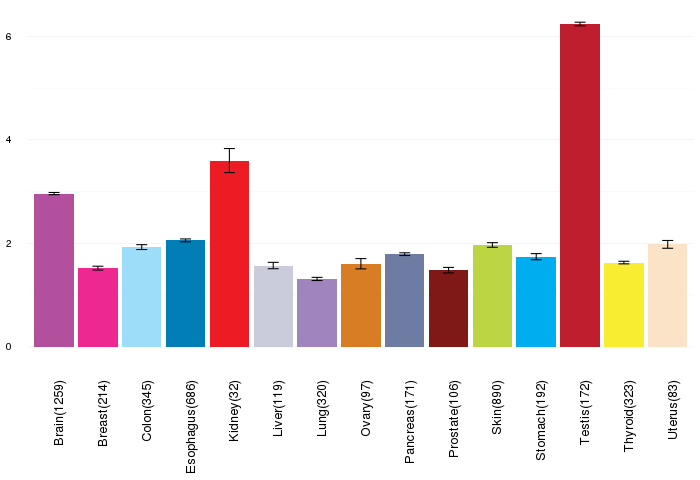
| Gene expressions across normal tissues of GTEx data (GTEx GTEx_Analysis_v6_RNA-seq_RNA-SeQCv1.1.8_gene_rpkm.gct) - Here, we shows the matched tissue types only among our 28 cancer types. |
 |
| Different expressions across 14 cancer types with more than 10 samples between matched tumors and normals (X-axis: cancer type and Y-axis: log2(norm_counts+1)) (TCGA IlluminaHiSeq_RNASeqV2, pan-cancer normalized log2(norm_counts+1) data, version 2016-08-16) |
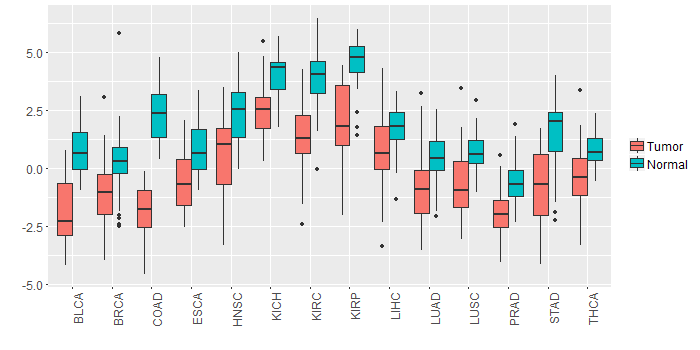 |
| - Significantly differentially expressed cancer types and information. (|Fold change|>1 and FDR<0.05) |
| Cancer type | Mean(exp) in tumor | Mean(exp) in matched normal | Log2FC | P-val. | FDR |
| PRAD | -1.91800155 | -0.550978473 | -1.367023077 | 3.41E-11 | 8.99E-10 |
| LUAD | -0.829055462 | 0.463197986 | -1.292253448 | 1.94E-07 | 7.28E-07 |
| BRCA | -1.149684985 | 0.256929928 | -1.406614912 | 1.07E-15 | 5.84E-15 |
| KIRP | 1.977008546 | 4.503808546 | -2.5268 | 6.49E-09 | 5.12E-08 |
| LUSC | -0.672219763 | 0.664709649 | -1.336929412 | 1.06E-07 | 2.97E-07 |
| BLCA | -1.882025335 | 0.726948349 | -2.608973684 | 6.75E-07 | 2.42E-05 |
| THCA | -0.314726941 | 0.779415432 | -1.094142373 | 4.63E-08 | 2.11E-07 |
| KIRC | 1.381417574 | 3.917693963 | -2.536276389 | 1.79E-24 | 2.05E-23 |
| HNSC | 0.729055203 | 2.362066831 | -1.633011628 | 2.56E-06 | 1.73E-05 |
| COAD | -1.795599627 | 2.244196527 | -4.039796154 | 9.13E-18 | 1.50E-15 |
| STAD | -0.814410204 | 1.450508546 | -2.26491875 | 6.99E-07 | 1.21E-05 |
| LIHC | 0.720307296 | 1.723919296 | -1.003612 | 0.000231 | 0.000731884 |
| KICH | 2.598131296 | 4.047203296 | -1.449072 | 4.89E-05 | 0.000136252 |
| Top |
| TissGene-miRNA for USP2 |
| Significantly anti-correlated miRNAs of TissGene across 28 cancer types (Gene-miRNA relations from TargetScanHuman Relsease 7.1, Conserved_Site_Context_Scores.txt.zip, 06.01.2016) (TCGA IlluminaHiSeq_miRNASeq, log2(RPM+1) data, version 2016-11-21) (TCGA IlluminaHiSeq_RNASeqV2, log2(normalized_count+1) data, version 2016-08-16) (Spearman’s Rank Correlation (p-value<0.05 and coefficient<-0.25)) |
| Cancer type | miRNA id | miRNA accession | P-val. | Coeff. | # samples |
| Top |
| TissGeneMut for USP2 |
| TissGeneSNV for USP2 |
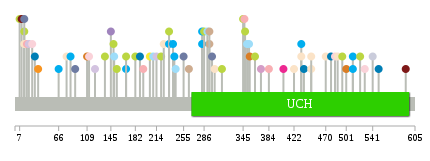
| nsSNV counts per each loci. Different colors of circles represent different cancer types. Circle size denotes number of samples. (TCGA somatic mutation (SNPs and small INDELs) data, version 2016-04-25) * Click on the image to enlarge it in a new window. |
 |
 |
| Somatic nucleotide variants of TissGene across 28 cancer types (X-axis: cancer type and Y-axis: % of mutated samples) The numbers in parentheses are numbers of samples with mutation (nsSNVs). (TCGA somatic mutation (SNPs and small INDELs) data, version 2016-04-25) |
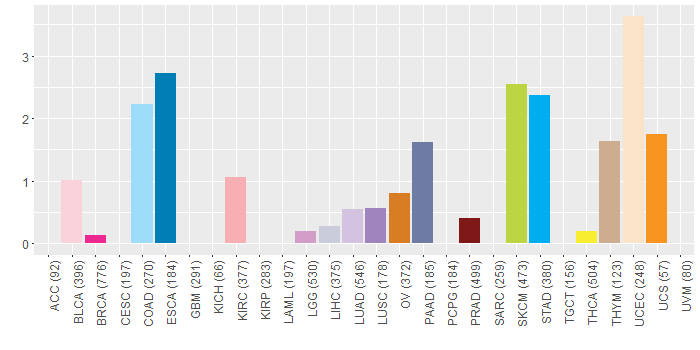 |
| - nsSNVs sorted by frequency. |
| AAchange | Cancer type | # samples |
| p.R302W | UCEC | 1 |
| p.R168C | STAD | 1 |
| p.S14L | SKCM | 1 |
| p.Q214H | LUAD | 1 |
| p.C121Y | LUAD | 1 |
| p.P437H | ESCA | 1 |
| p.R484Q | BLCA | 1 |
| p.L35R | UCS | 1 |
| p.R136K | SKCM | 1 |
| p.R295W | READ | 1 |
| p.Q283* | STAD | 1 |
| p.Y541C | LIHC | 1 |
| p.R298S | PAAD | 1 |
| p.R233C | SKCM | 1 |
| p.R168C | SKCM | 1 |
| p.T239M | STAD | 1 |
| p.R91W | PAAD | 1 |
| p.Y66C | STAD | 1 |
| p.S225G | UCEC | 1 |
| p.A189V | ESCA | 1 |
| p.T18A | KIRC | 1 |
| p.H501R | OV | 1 |
| p.R255I | PAAD | 1 |
| p.R233C | STAD | 1 |
| p.Y194H | KIRC | 1 |
| p.G109R | OV | 1 |
| p.R345K | SKCM | 1 |
| p.D145N | LUSC | 1 |
| p.Y294* | THYM | 1 |
| p.A347V | KIRC | 1 |
| p.R354H | COAD | 1 |
| p.A16P | MESO | 1 |
| p.P348S | SKCM | 1 |
| p.A263V | THYM | 1 |
| p.P30T | ESCA | 1 |
| p.D149N | SKCM | 1 |
| p.E372G | LGG | 1 |
| p.L291F | COAD | 1 |
| p.R511* | STAD | 1 |
| p.R78C | UCEC | 1 |
| p.A351T | COAD | 1 |
| p.Q283X | STAD | 1 |
| p.S422L | UCEC | 1 |
| p.P522L | SKCM | 1 |
| p.G470E | UCEC | 1 |
| p.T433A | UCEC | 1 |
| p.F150L | COAD | 1 |
| p.H21Q | LUAD | 1 |
| p.S209Y | COAD | 1 |
| p.P313L | SKCM | 1 |
| p.T433M | STAD | 1 |
| p.A591T | PRAD | 1 |
| p.R511X | STAD | 1 |
| p.R406W | BRCA | 1 |
| p.S14L | PAAD | 1 |
| p.R529T | BLCA | 1 |
| p.Y10S | PRAD | 1 |
| p.P384H | KIRC | 1 |
| p.R154C | SKCM | 1 |
| p.Q355H | OV | 1 |
| p.G26D | BLCA | 1 |
| p.P221S | SKCM | 1 |
| p.F18L | MESO | 1 |
| p.Y294X | THYM | 1 |
| p.T7I | SKCM | 1 |
| p.P286S | SKCM | 1 |
| p.R448Q | UCEC | 1 |
| p.G112R | BLCA | 1 |
| p.R204H | THCA | 1 |
| p.R478C | ESCA | 1 |
| p.K488T | UCEC | 1 |
| p.Q243R | COAD | 1 |
| p.A20P | MESO | 1 |
| p.P495S | SKCM | 1 |
| p.R363C | SKCM | 1 |
| p.K241N | STAD | 1 |
| p.S550Y | ESCA | 1 |
| p.S14L | UCEC | 1 |
| p.D84N | STAD | 1 |
| p.R448* | UCEC | 1 |
| p.P182S | SKCM | 1 |
| Top |
| TissGeneCNV for USP2 |
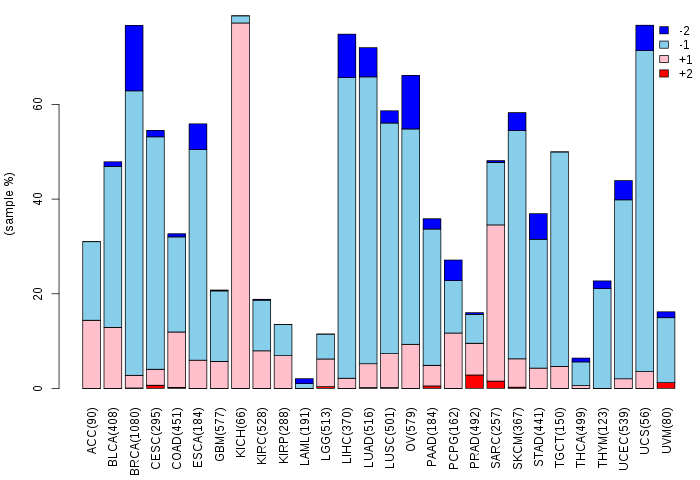
| Copy number variations of TissGene across 28 cancer types (X-axis: cancer type and Y-axis: % of CNV samples) (TCGA Gistic2_CopyNumber_Gistic2_all_data_by_genes, Gistic2 copy number data, version 2016-08-16) |
 |
| Top |
| TissGeneFusions for USP2 |
| Fusion genes including TissGene (ChimerDB 3.0, 2016-12-01 and TCGA fusion Portal 2015-12-01) |
| Database | Src | Cancer type | Sample | Fusion gene | ORF | 5'-gene BP | 3'-gene BP |
| Chimerdb3.0 | ChiTaRs | NA | CD671082 | USP2-CEP63 | chr11:119228954 | chr3:134225977 | |
| Chimerdb3.0 | ChiTaRs | NA | AL162006 | USP2-KCNK9 | chr11:119238203 | chr8:140672040 | |
| TCGAfusionPortal | PRADA | BRCA | TCGA-D8-A1XO-01A | RGS12-USP2 | In-frame | Chr4:3344780 | Chr11:119230944 |
| Top |
| TissGeneNet for USP2 |
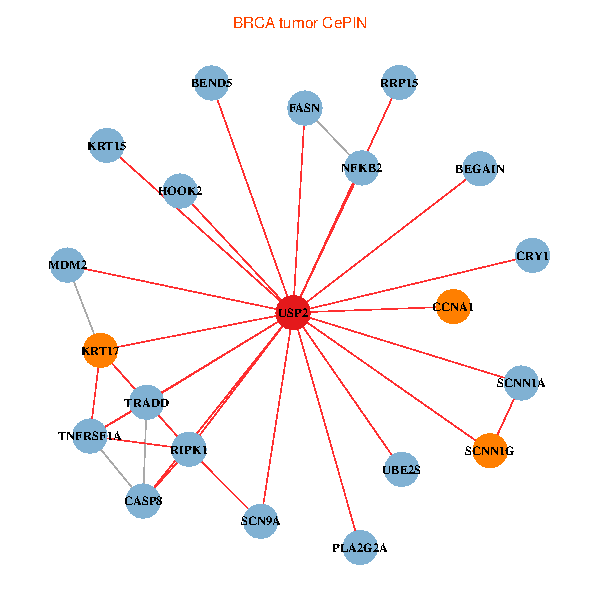
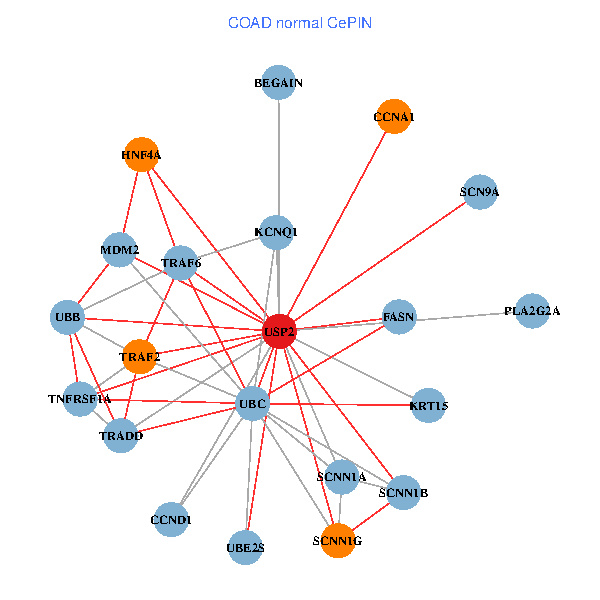
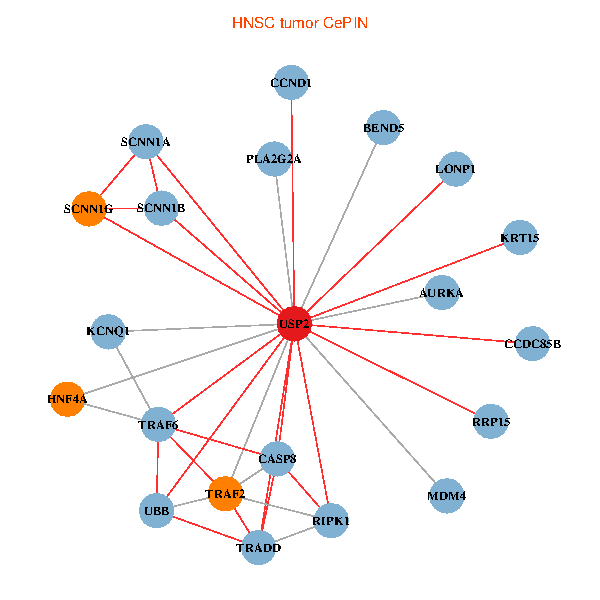
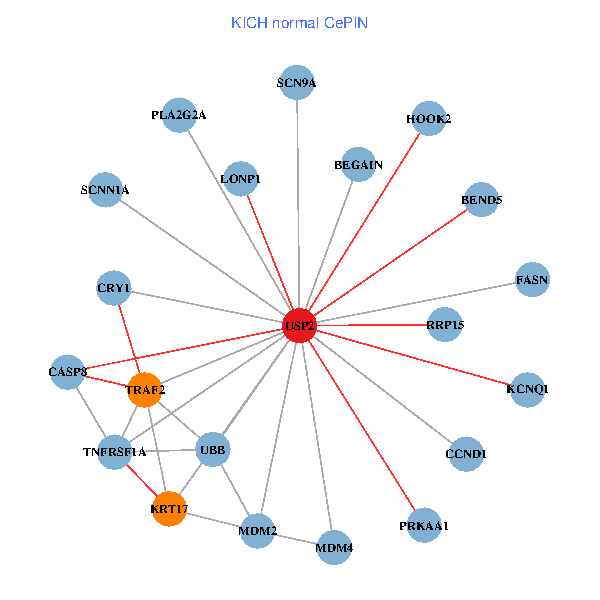
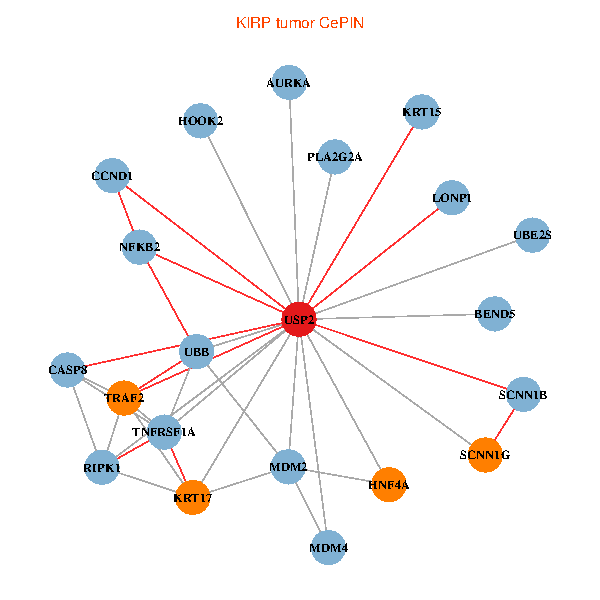
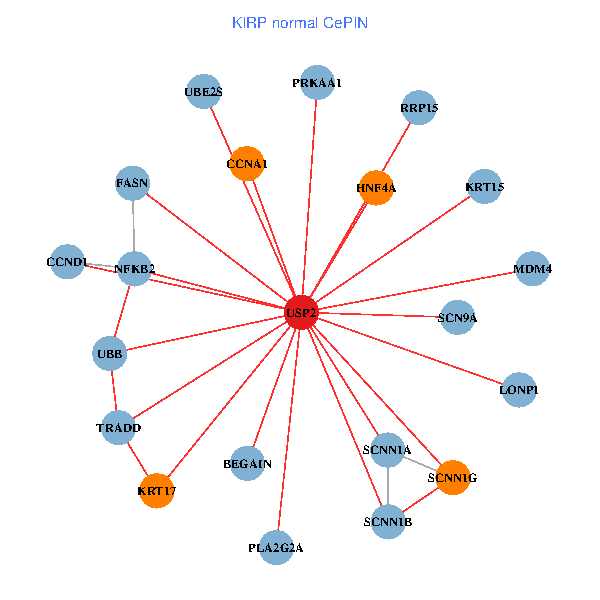
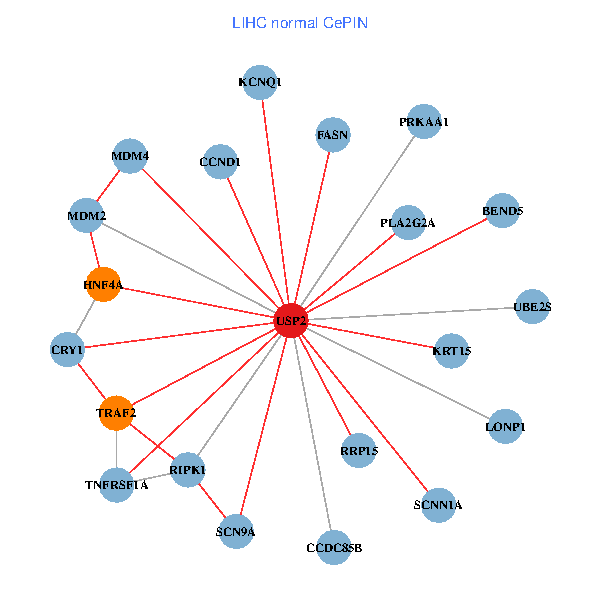
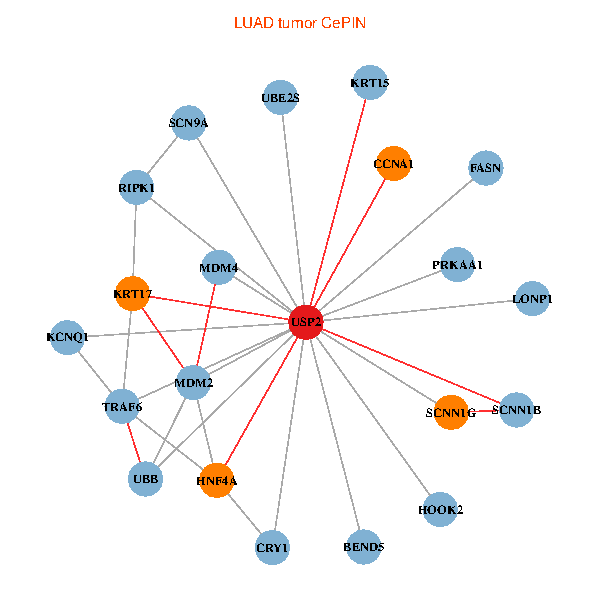
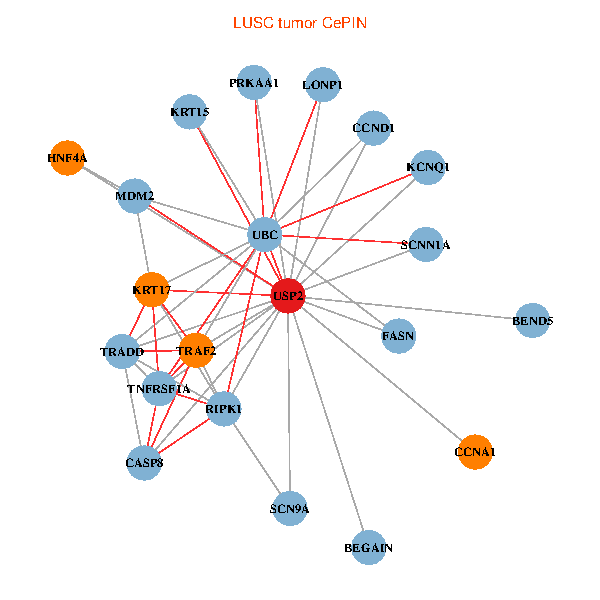
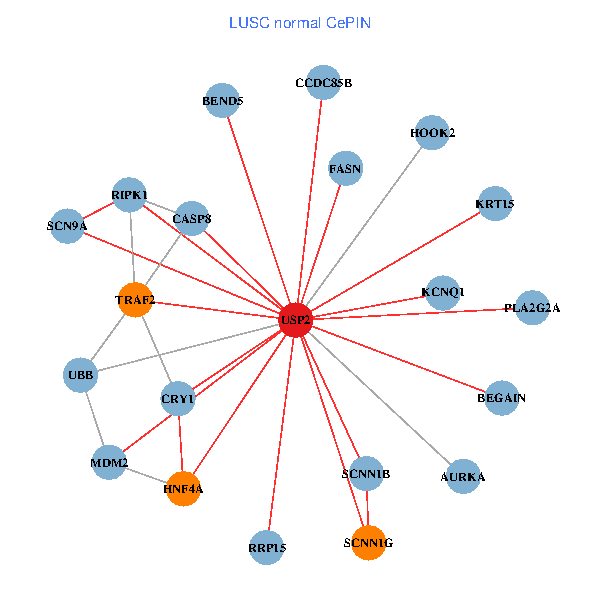
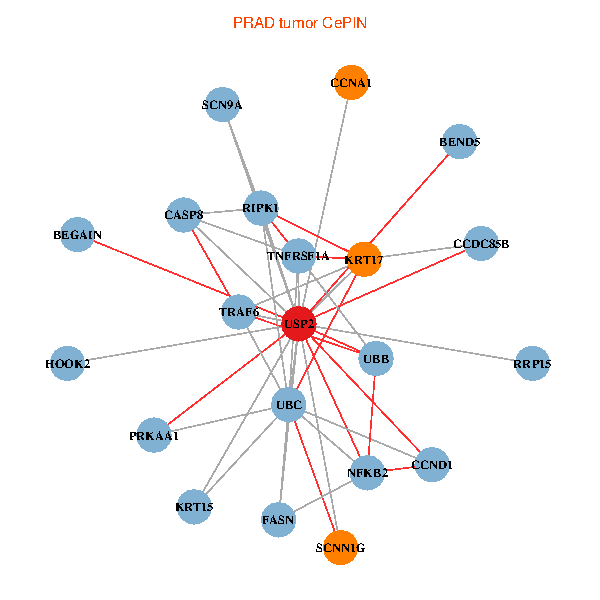
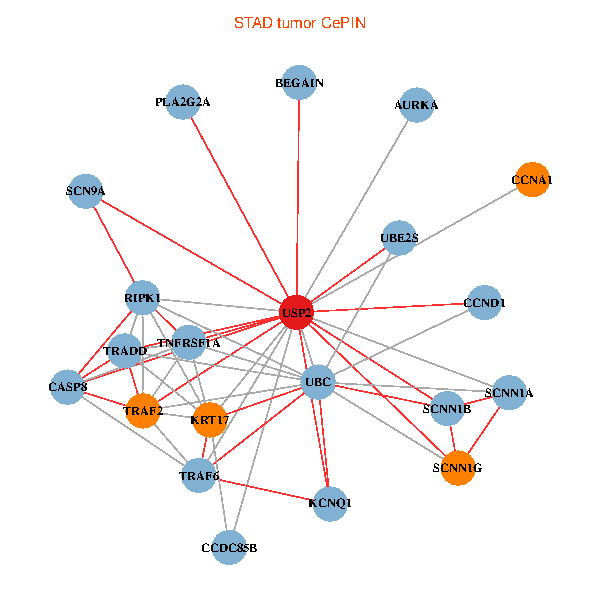
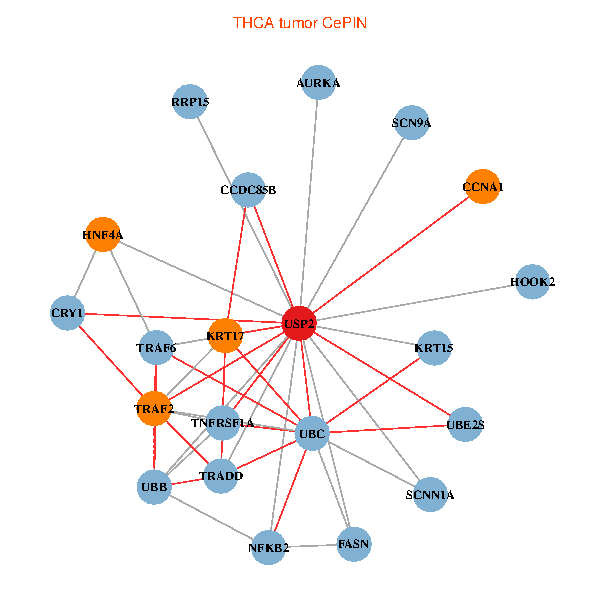
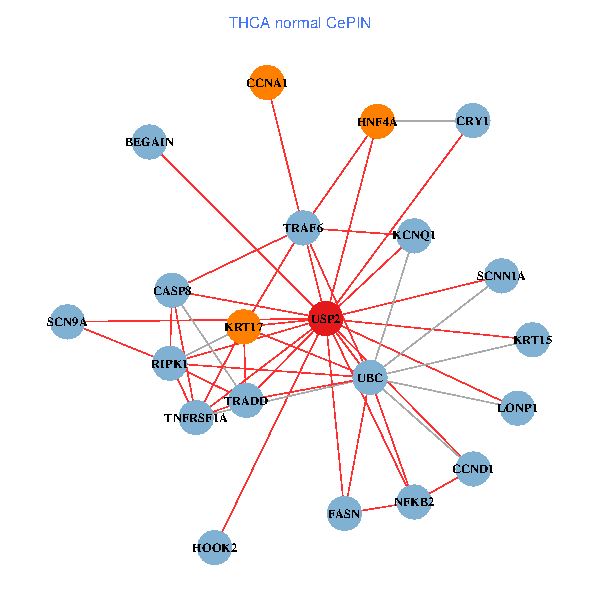
| Co-expressed gene networks based on protein-protein interaction data (CePIN) (TCGA IlluminaHiSeq_RNASeqV2, pan-cancer normalized log2(norm_counts+1) data, version 2016-08-16) (PINA2 ppi data) |
| BRCA (tumor) | BRCA (normal) |
| USP2, CRY1, NFKB2, MDM2, CASP8, TNFRSF1A, SCN9A, RIPK1, BEGAIN, FASN, KRT17, CCNA1, UBE2S, SCNN1A, TRADD, KRT15, HOOK2, RRP15, PLA2G2A, SCNN1G, BEND5 (tumor) | USP2, TRAF6, NFKB2, CASP8, TNFRSF1A, RIPK1, BEGAIN, CCND1, FASN, AURKA, KRT17, CCDC85B, SCNN1B, CCNA1, UBB, UBE2S, SCNN1A, PRKAA1, KRT15, MDM4, SCNN1G (normal) |
 |  |
| COAD (tumor) | COAD (normal) |
| USP2, HNF4A, TRAF6, UBC, CRY1, NFKB2, CASP8, TNFRSF1A, SCN9A, RIPK1, CCND1, CCDC85B, CCNA1, UBB, SCNN1A, TRADD, HOOK2, RRP15, PLA2G2A, SCNN1G, BEND5 (tumor) | USP2, HNF4A, TRAF6, UBC, MDM2, TNFRSF1A, SCN9A, BEGAIN, CCND1, FASN, TRAF2, KCNQ1, SCNN1B, CCNA1, UBB, UBE2S, SCNN1A, TRADD, KRT15, PLA2G2A, SCNN1G (normal) |
 |  |
| HNSC (tumor) | HNSC (normal) |
| USP2, HNF4A, TRAF6, CASP8, RIPK1, CCND1, TRAF2, AURKA, CCDC85B, KCNQ1, SCNN1B, UBB, SCNN1A, TRADD, KRT15, MDM4, RRP15, PLA2G2A, LONP1, SCNN1G, BEND5 (tumor) | USP2, UBC, NFKB2, MDM2, TNFRSF1A, SCN9A, TRAF2, AURKA, KRT17, CCDC85B, KCNQ1, CCNA1, UBE2S, PRKAA1, TRADD, KRT15, MDM4, HOOK2, RRP15, LONP1, BEND5 (normal) |
 |  |
| KICH (tumor) | KICH (normal) |
| USP2, HNF4A, CRY1, NFKB2, TNFRSF1A, RIPK1, BEGAIN, CCND1, TRAF2, CCDC85B, KCNQ1, SCNN1B, CCNA1, UBE2S, SCNN1A, TRADD, KRT15, HOOK2, LONP1, SCNN1G, BEND5 (tumor) | USP2, CRY1, MDM2, CASP8, TNFRSF1A, SCN9A, BEGAIN, CCND1, FASN, TRAF2, KRT17, KCNQ1, UBB, SCNN1A, PRKAA1, MDM4, HOOK2, RRP15, PLA2G2A, LONP1, BEND5 (normal) |
 |  |
| KIRC (tumor) | KIRC (normal) |
| USP2, HNF4A, NFKB2, MDM2, CASP8, TNFRSF1A, RIPK1, AURKA, KRT17, SCNN1B, CCNA1, UBB, SCNN1A, PRKAA1, KRT15, MDM4, HOOK2, PLA2G2A, LONP1, SCNN1G, BEND5 (tumor) | USP2, HNF4A, TRAF6, UBC, CRY1, CASP8, TNFRSF1A, CCND1, FASN, AURKA, KRT17, CCDC85B, KCNQ1, SCNN1B, CCNA1, UBE2S, KRT15, HOOK2, PLA2G2A, LONP1, SCNN1G (normal) |
 |  |
| KIRP (tumor) | KIRP (normal) |
| USP2, HNF4A, NFKB2, MDM2, CASP8, TNFRSF1A, RIPK1, CCND1, TRAF2, AURKA, KRT17, SCNN1B, UBB, UBE2S, KRT15, MDM4, HOOK2, PLA2G2A, LONP1, SCNN1G, BEND5 (tumor) | USP2, HNF4A, NFKB2, SCN9A, BEGAIN, CCND1, FASN, KRT17, SCNN1B, CCNA1, UBB, UBE2S, SCNN1A, PRKAA1, TRADD, KRT15, MDM4, RRP15, PLA2G2A, LONP1, SCNN1G (normal) |
 |  |
| LIHC (tumor) | LIHC (normal) |
| USP2, UBC, NFKB2, TNFRSF1A, RIPK1, BEGAIN, CCND1, FASN, KRT17, CCDC85B, SCNN1B, CCNA1, UBB, UBE2S, SCNN1A, KRT15, MDM4, HOOK2, RRP15, SCNN1G, BEND5 (tumor) | USP2, HNF4A, CRY1, MDM2, TNFRSF1A, SCN9A, RIPK1, CCND1, FASN, TRAF2, CCDC85B, KCNQ1, UBE2S, SCNN1A, PRKAA1, KRT15, MDM4, RRP15, PLA2G2A, LONP1, BEND5 (normal) |
 |  |
| LUAD (tumor) | LUAD (normal) |
| USP2, HNF4A, TRAF6, CRY1, MDM2, SCN9A, RIPK1, FASN, KRT17, KCNQ1, SCNN1B, CCNA1, UBB, UBE2S, PRKAA1, KRT15, MDM4, HOOK2, LONP1, SCNN1G, BEND5 (tumor) | USP2, TRAF6, UBC, NFKB2, TNFRSF1A, RIPK1, CCND1, TRAF2, AURKA, KCNQ1, SCNN1B, CCNA1, UBE2S, SCNN1A, KRT15, MDM4, HOOK2, RRP15, PLA2G2A, SCNN1G, BEND5 (normal) |
 |  |
| LUSC (tumor) | LUSC (normal) |
| USP2, HNF4A, UBC, MDM2, CASP8, TNFRSF1A, SCN9A, RIPK1, BEGAIN, CCND1, FASN, TRAF2, KRT17, KCNQ1, CCNA1, SCNN1A, PRKAA1, TRADD, KRT15, LONP1, BEND5 (tumor) | USP2, HNF4A, CRY1, MDM2, CASP8, SCN9A, RIPK1, BEGAIN, FASN, TRAF2, AURKA, CCDC85B, KCNQ1, SCNN1B, UBB, KRT15, HOOK2, RRP15, PLA2G2A, SCNN1G, BEND5 (normal) |
 |  |
| PRAD (tumor) | PRAD (normal) |
| USP2, TRAF6, UBC, NFKB2, CASP8, TNFRSF1A, SCN9A, RIPK1, BEGAIN, CCND1, FASN, KRT17, CCDC85B, CCNA1, UBB, PRKAA1, KRT15, HOOK2, RRP15, SCNN1G, BEND5 (tumor) | USP2, UBC, CASP8, TNFRSF1A, SCN9A, RIPK1, BEGAIN, FASN, AURKA, KRT17, CCDC85B, KCNQ1, SCNN1B, CCNA1, UBB, SCNN1A, PRKAA1, TRADD, KRT15, SCNN1G, BEND5 (normal) |
 |  |
| STAD (tumor) | STAD (normal) |
| USP2, TRAF6, UBC, CASP8, TNFRSF1A, SCN9A, RIPK1, BEGAIN, CCND1, TRAF2, AURKA, KRT17, CCDC85B, KCNQ1, SCNN1B, CCNA1, UBE2S, SCNN1A, TRADD, PLA2G2A, SCNN1G (tumor) | USP2, UBC, CRY1, NFKB2, MDM2, CASP8, SCN9A, BEGAIN, CCND1, TRAF2, AURKA, KCNQ1, SCNN1B, CCNA1, UBB, UBE2S, TRADD, HOOK2, LONP1, SCNN1G, BEND5 (normal) |
 |  |
| THCA (tumor) | THCA (normal) |
| USP2, HNF4A, TRAF6, UBC, CRY1, NFKB2, TNFRSF1A, SCN9A, FASN, TRAF2, AURKA, KRT17, CCDC85B, CCNA1, UBB, UBE2S, SCNN1A, TRADD, KRT15, HOOK2, RRP15 (tumor) | USP2, HNF4A, TRAF6, UBC, CRY1, NFKB2, CASP8, TNFRSF1A, SCN9A, RIPK1, BEGAIN, CCND1, FASN, KRT17, KCNQ1, CCNA1, SCNN1A, TRADD, KRT15, HOOK2, LONP1 (normal) |
 |  |
| Top |
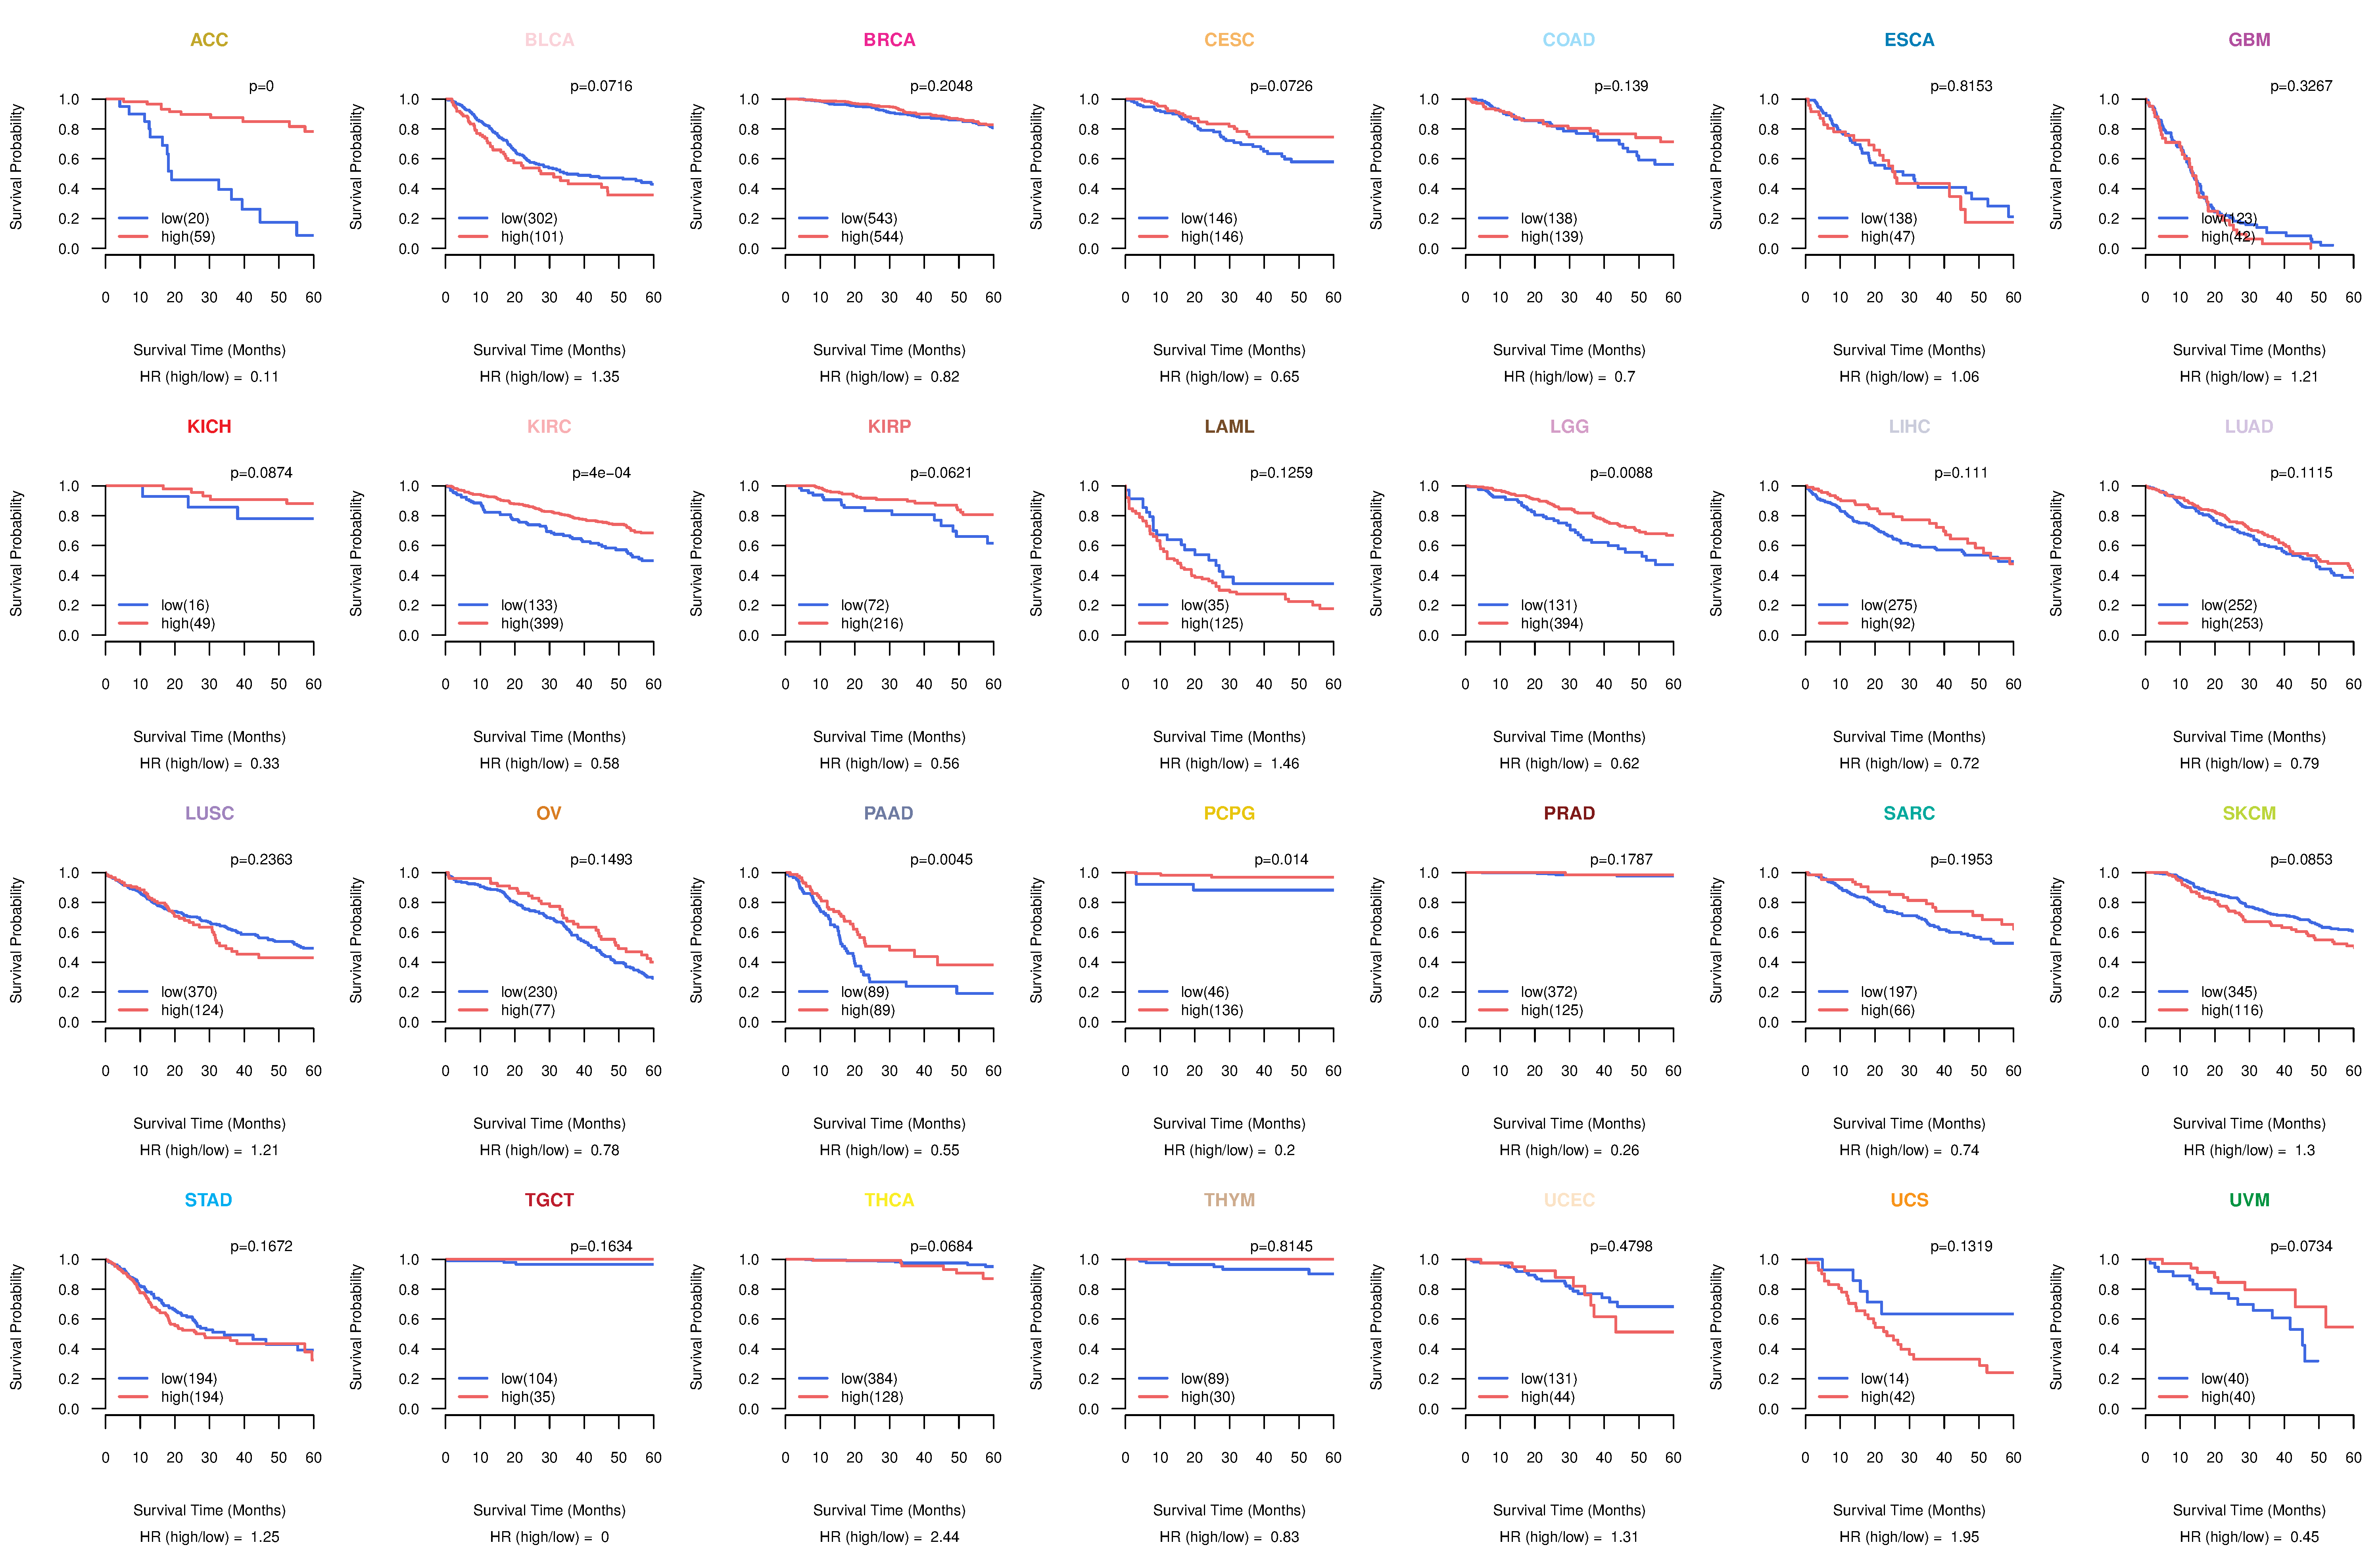
| TissGeneProg for USP2 |
| Kaplan-Meier plots with logrank tests of overall survival (OS) using 28 cancer types (TCGA IlluminaHiSeq_RNASeqV2, pan-cancer normalized log2(norm_counts+1) data, version 2016-08-16) (TCGA clinicalMatrix, phenotype data, version 2016-04-27) * Click on the image to enlarge it in a new window. |
 |
| Kaplan-Meier plots with logrank test of relapse free survival (RFS) using 28 cancer types (TCGA IlluminaHiSeq_RNASeqV2, pan-cancer normalized log2(norm_counts+1) data, version 2016-08-16) (TCGA clinicalMatrix, phenotype data, version 2016-04-27) * Click on the image enlarge it in a new window. |
 |
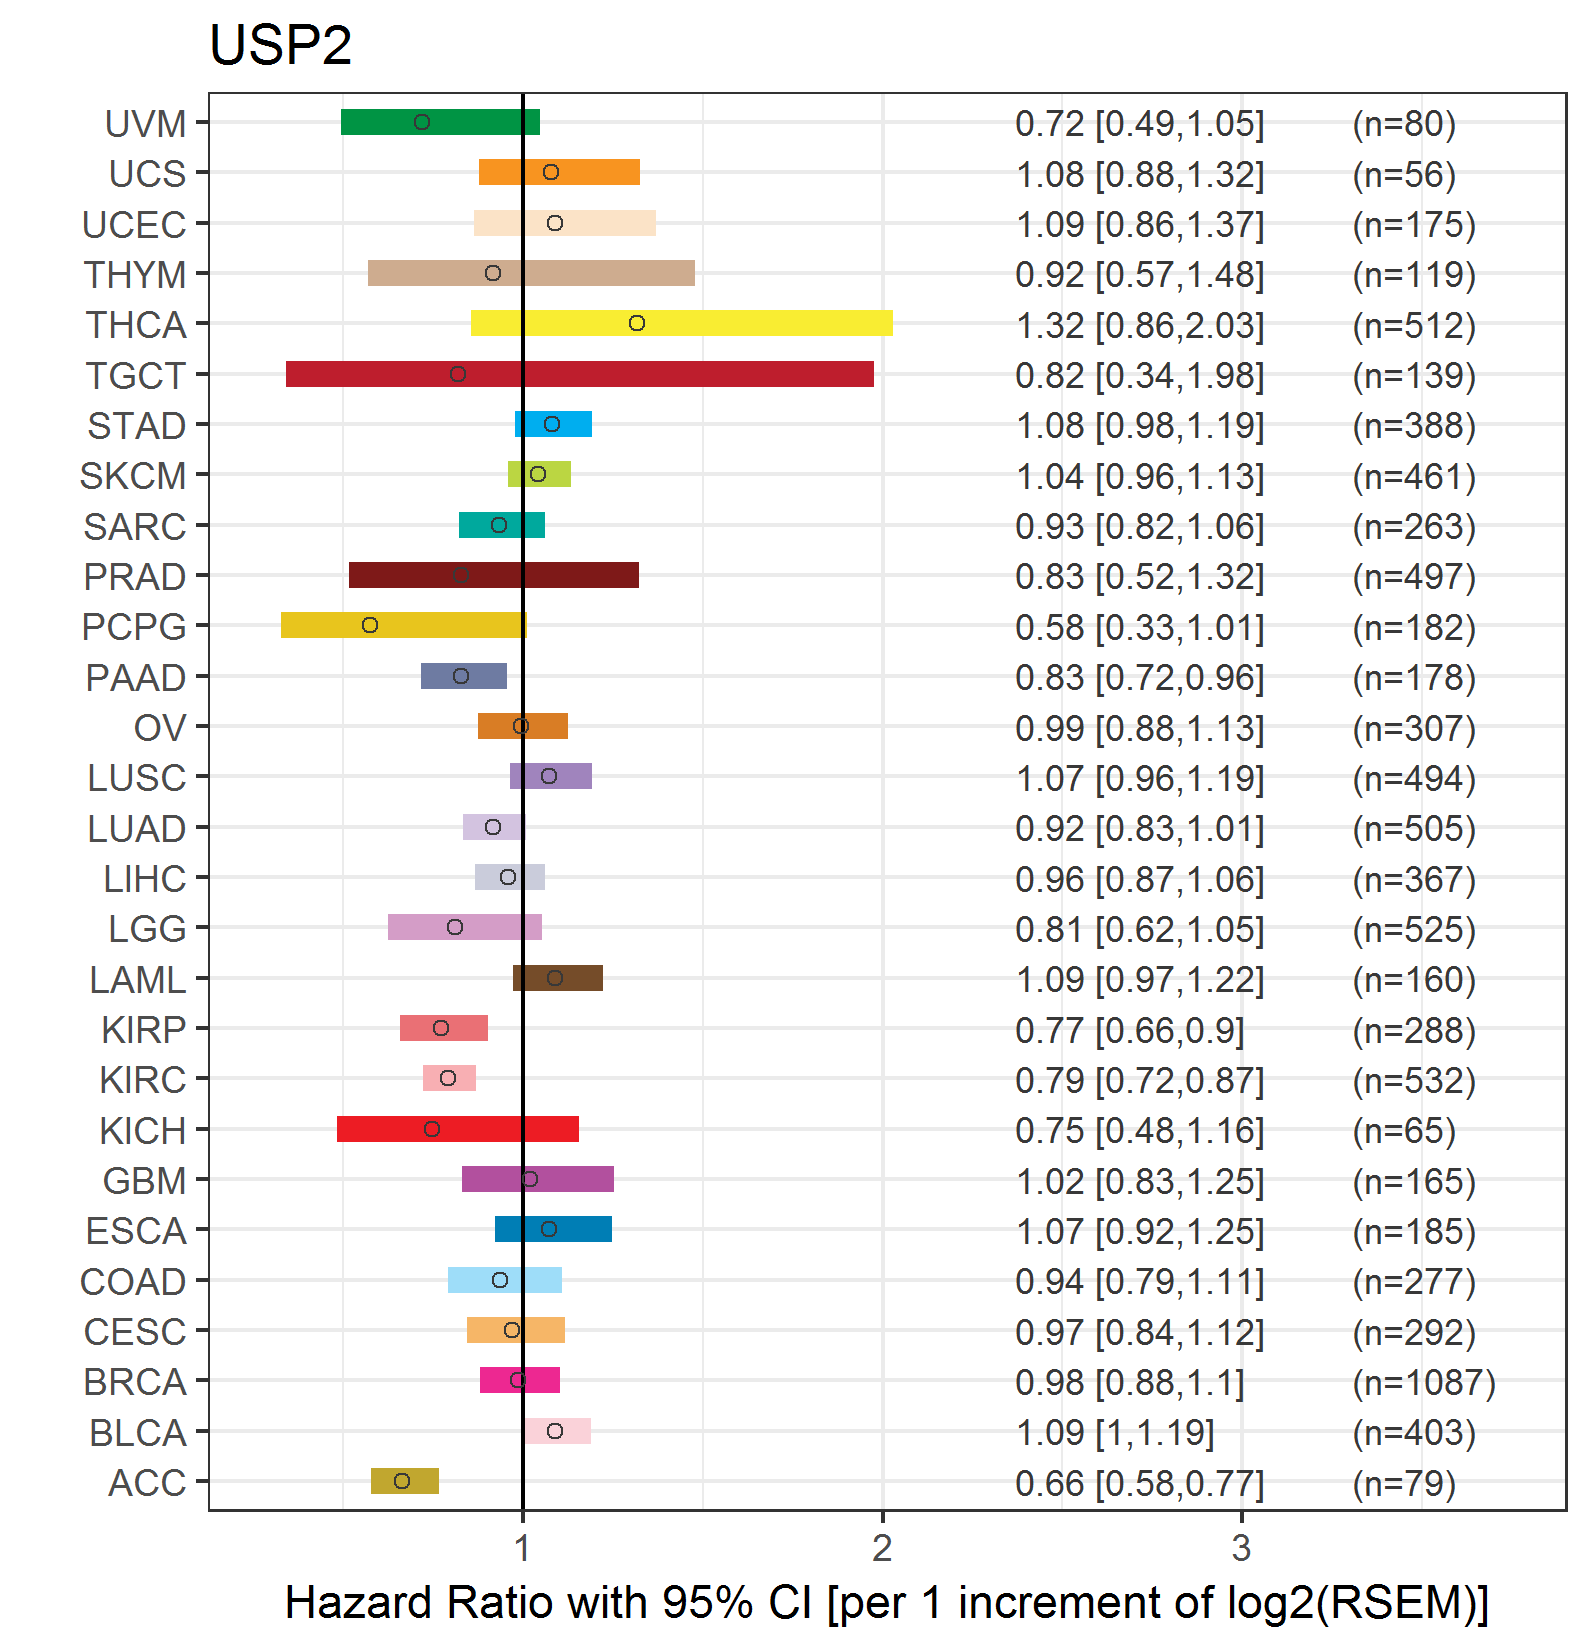
| Forest plot of Cox proportional hazard ratio (HR) and 95% CI of overall survival (OS) using 28 cancer types (TCGA IlluminaHiSeq_RNASeqV2, pan-cancer normalized log2(norm_counts+1) data, version 2016-08-16) (TCGA clinicalMatrix, phenotype data, version 2016-04-27) * Click on the image enlarge it in a new window. |
 |
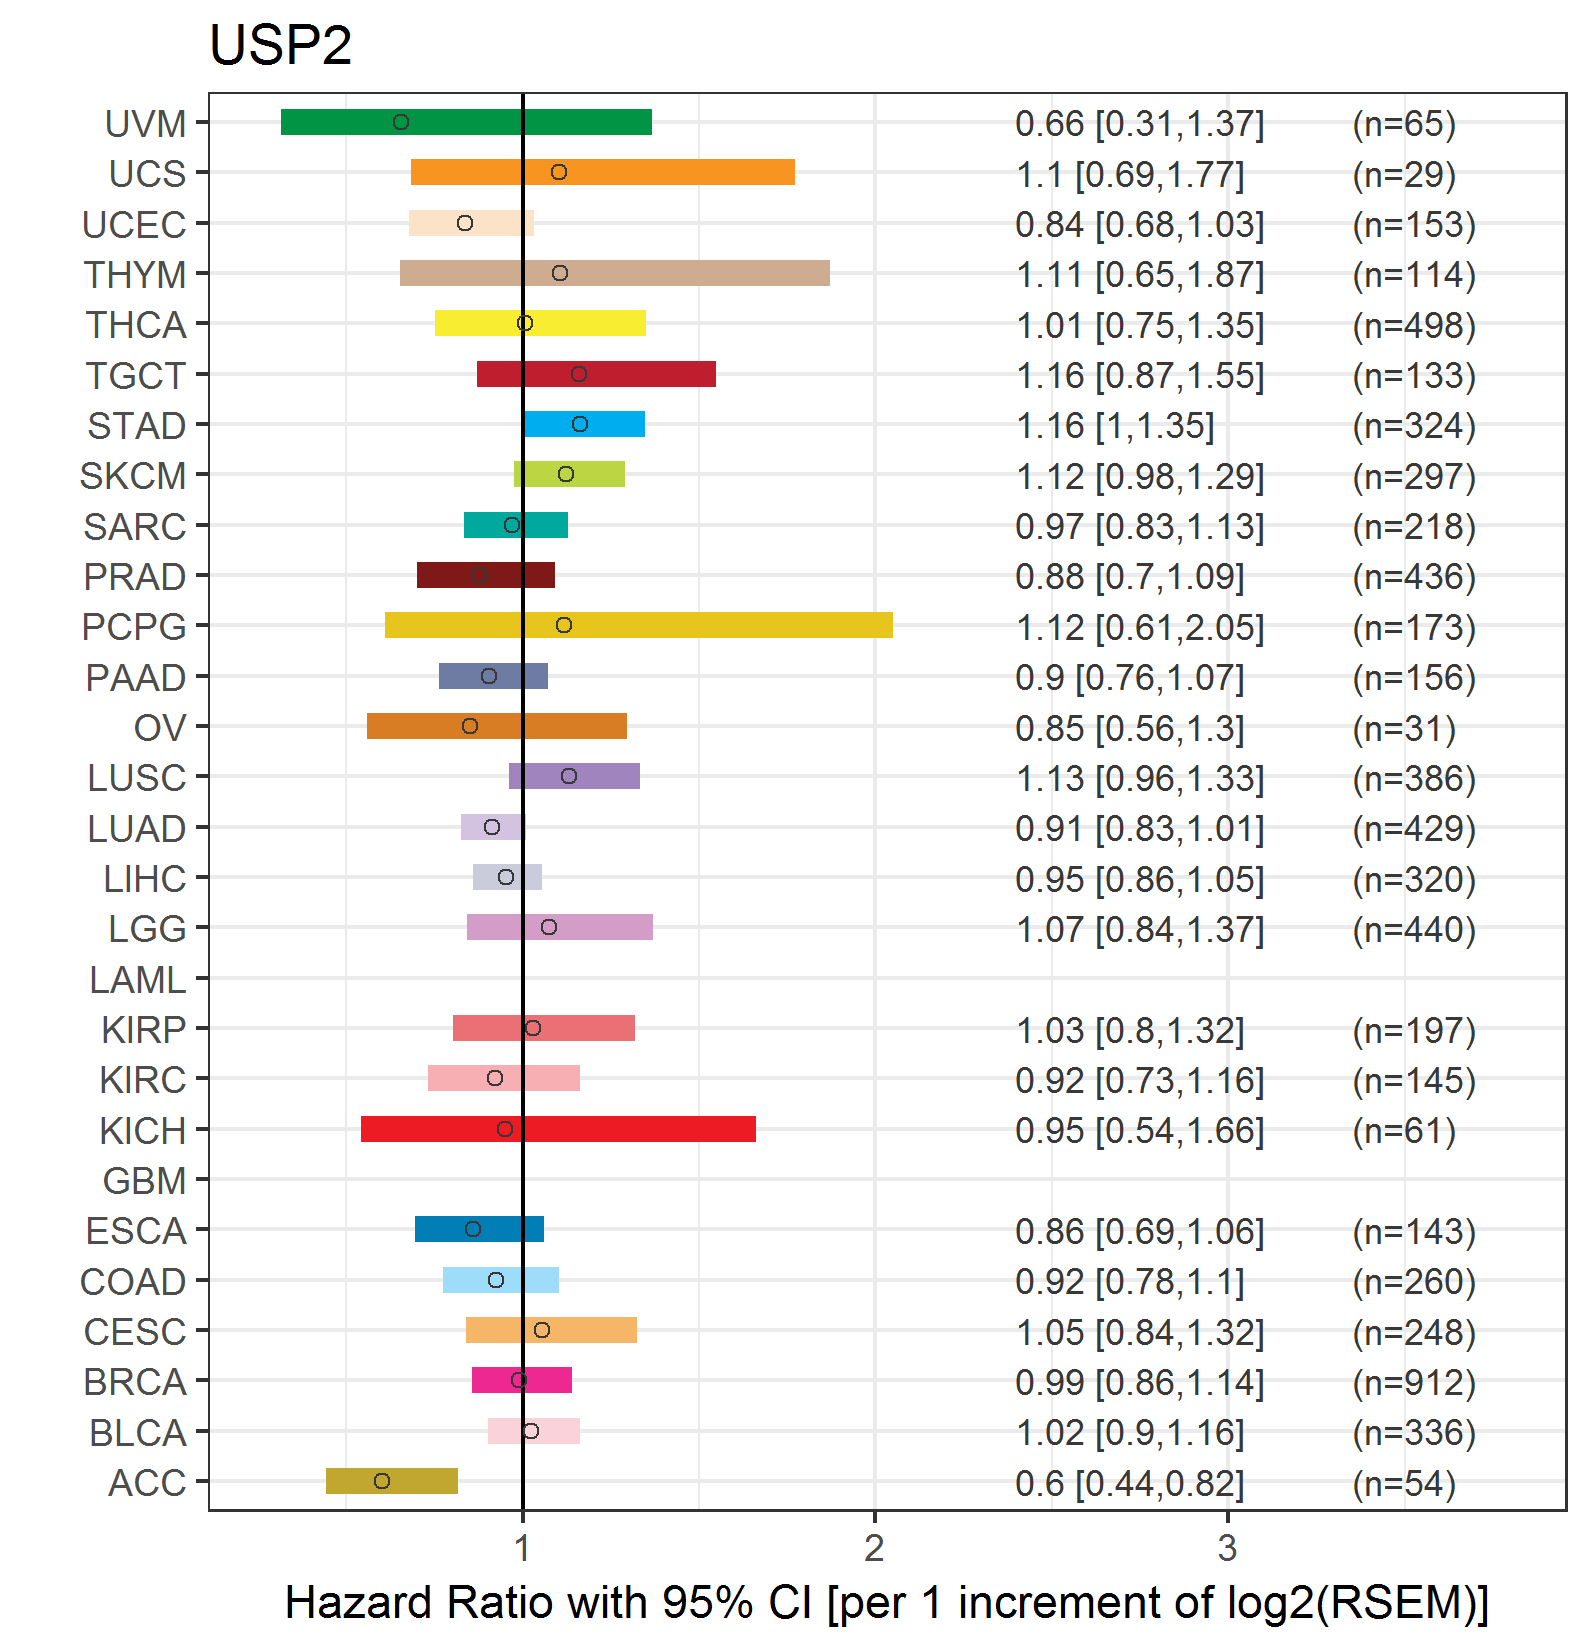
| Forest plot of Cox proportional hazard ratio (HR) and 95% CI of relapse free survival (RFS) using 28 cancer types (TCGA IlluminaHiSeq_RNASeqV2, pan-cancer normalized log2(norm_counts+1) data, version 2016-08-16) (TCGA clinicalMatrix, phenotype data, version 2016-04-27) * Click on the image enlarge it in a new window. |
 |
| Top |
| TissGeneClin for USP2 |
| TissGeneDrug for USP2 |
| Drug information targeting TissGene (DrugBank Version 5.0.6, 2017-04-01) |
| DrugBank ID | Drug name | Drug activity | Drug type | Drug status |
| Top |
| TissGeneDisease for USP2 |
| Disease information associated with TissGene (DisGeNet, 2016-06-01) |
| Disease ID | Disease name | # pubmeds | Source |
| umls:C0678222 | Breast Carcinoma | 2 | BeFree |
| umls:C0004509 | Azoospermia | 1 | BeFree |
| umls:C0006142 | Malignant neoplasm of breast | 1 | BeFree |
| umls:C0011860 | Diabetes Mellitus, Non-Insulin-Dependent | 1 | BeFree |
| umls:C0033578 | Prostatic Neoplasms | 1 | LHGDN |
| umls:C1458155 | Mammary Neoplasms | 1 | BeFree |
| umls:C2239176 | Liver carcinoma | 1 | CTD_human |
| umls:C3539878 | Triple Negative Breast Neoplasms | 1 | BeFree |
|
Copyright 2016-Present - The University of Texas Health Science Center at Houston (UTHealth) Web File Viewing | How to Report, Fraud, Waste and Abuse | State of Texas | Statewide Search | Texas Homeland Security | Site Policies |