 |
| |
| |
| |
| |
| |
| |
|

| TissGeneSummary for ACY3 |
 Gene summary Gene summary |
| Basic gene information | Gene symbol | ACY3 |
| Gene name | aspartoacylase (aminocyclase) 3 | |
| Synonyms | ACY-3|HCBP1 | |
| Cytomap | UCSC genome browser: 11q13.2 | |
| Type of gene | protein-coding | |
| RefGenes | NM_080658.1, | |
| Description | HCV core-binding protein 1N-acyl-aromatic-L-amino acid amidohydrolase (carboxylate-forming)acylase IIIaminoacylase-3aspartoacylase-2hepatitis C virus core-binding protein 1 | |
| Modification date | 20141207 | |
| dbXrefs | MIM : 614413 | |
| HGNC : HGNC | ||
| Ensembl : ENSG00000132744 | ||
| HPRD : 12422 | ||
| Vega : OTTHUMG00000167283 | ||
| Protein | UniProt: go to UniProt's Cross Reference DB Table | |
| Expression | CleanEX: HS_ACY3 | |
| BioGPS: 91703 | ||
| Pathway | NCI Pathway Interaction Database: ACY3 | |
| KEGG: ACY3 | ||
| REACTOME: ACY3 | ||
| Pathway Commons: ACY3 | ||
| Context | iHOP: ACY3 | |
| ligand binding site mutation search in PubMed: ACY3 | ||
| UCL Cancer Institute: ACY3 | ||
| Assigned class in TissGDB* | C | |
| Included tissue-specific gene expression resources | TiGER,GTEx | |
| Specific-tissues in normal samples (assigned by TissGDB using HPA, TiGER, and GTEx) | Kidney | |
| Cancer types related to the specific-tissues in cancer samples (assigned by TissGDB using TCGA) | KIRC,KIRP,KICH | |
| Reference showing the relevant tissue of ACY3 | ||
| Description by TissGene annotations | ||
| * Class A consists of genes with literature evidence and is part of the cTissGenes. Class B consists of only cTissGenes without additional evidence. The remaining genes belong to Class C. |
| Gene ontology having evidence of Inferred from Direct Assay (IDA) from Entrez |
| GO ID | GO term | PubMed ID |
| Top |
| TissGeneExp for ACY3 |
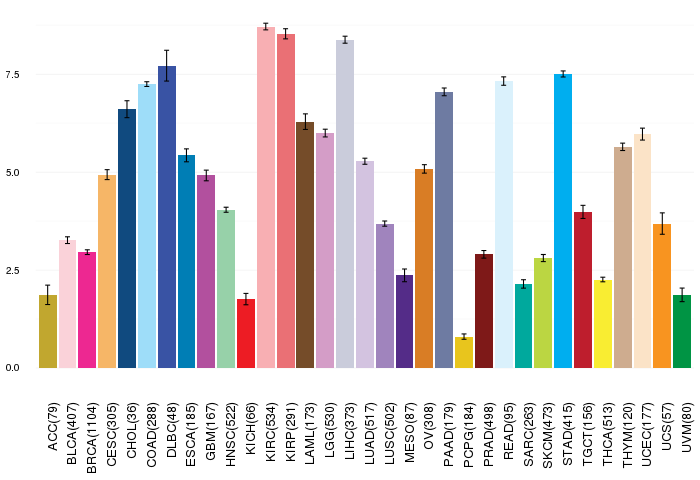
| Gene expressions across 28 cancer types (X-axis: cancer type and Y-axis: log2(norm_counts+1)) (TCGA IlluminaHiSeq_RNASeqV2, pan-cancer normalized log2(norm_counts+1) data, version 2016-08-16) |
 |
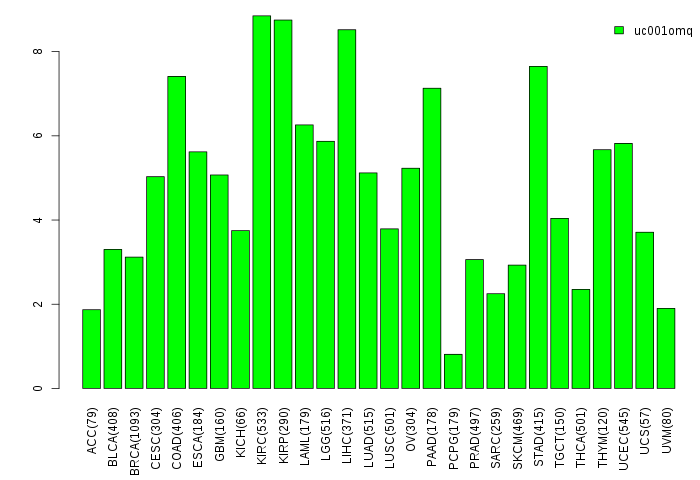
| Gene isoform expressions across 28 cancer types (X-axis: cancer type and Y-axis: log2(norm_counts+1)) (TCGA pan-cancer tcga_rsem_isoform_tpm, version 2016-09-01) |
 |
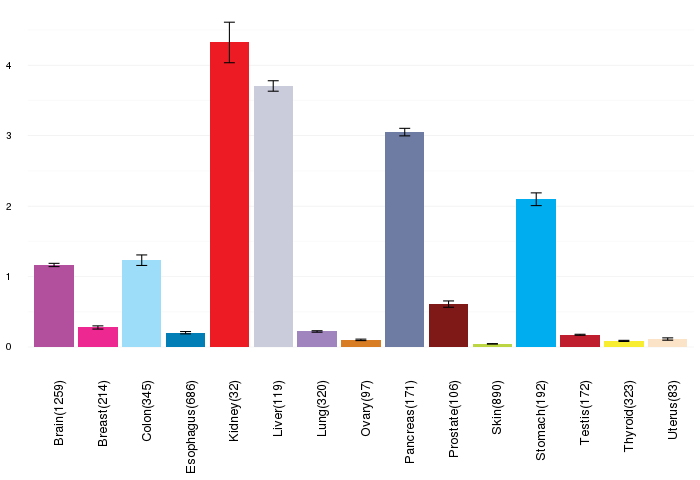
| Gene expressions across normal tissues of GTEx data (GTEx GTEx_Analysis_v6_RNA-seq_RNA-SeQCv1.1.8_gene_rpkm.gct) - Here, we shows the matched tissue types only among our 28 cancer types. |
 |
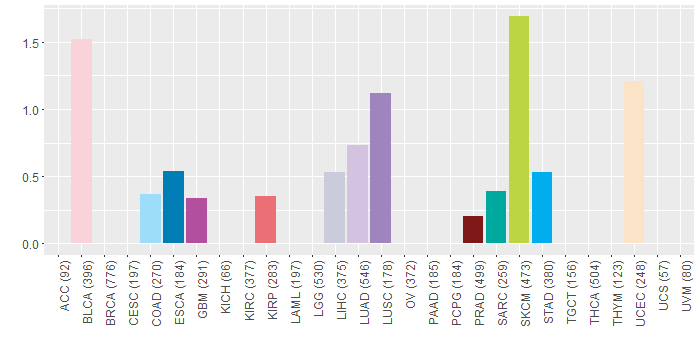
| Different expressions across 14 cancer types with more than 10 samples between matched tumors and normals (X-axis: cancer type and Y-axis: log2(norm_counts+1)) (TCGA IlluminaHiSeq_RNASeqV2, pan-cancer normalized log2(norm_counts+1) data, version 2016-08-16) |
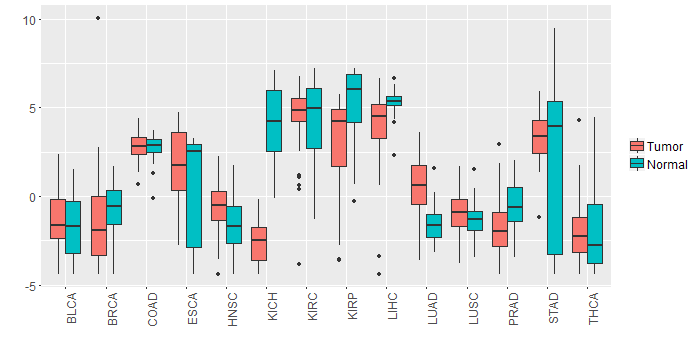 |
| - Significantly differentially expressed cancer types and information. (|Fold change|>1 and FDR<0.05) |
| Cancer type | Mean(exp) in tumor | Mean(exp) in matched normal | Log2FC | P-val. | FDR |
| KICH | -2.668920768 | 4.116243232 | -6.785164 | 1.06E-16 | 3.49E-15 |
| LUAD | 0.550492129 | -1.610085458 | 2.160577586 | 2.47E-14 | 2.34E-13 |
| PRAD | -1.712858999 | -0.692891691 | -1.019967308 | 0.000963 | 0.003118617 |
| KIRP | 2.963563357 | 5.442691482 | -2.479128125 | 0.000113 | 0.000378694 |
| LIHC | 3.940917232 | 5.270791232 | -1.329874 | 8.08E-05 | 0.000285305 |
| Top |
| TissGene-miRNA for ACY3 |
| Significantly anti-correlated miRNAs of TissGene across 28 cancer types (Gene-miRNA relations from TargetScanHuman Relsease 7.1, Conserved_Site_Context_Scores.txt.zip, 06.01.2016) (TCGA IlluminaHiSeq_miRNASeq, log2(RPM+1) data, version 2016-11-21) (TCGA IlluminaHiSeq_RNASeqV2, log2(normalized_count+1) data, version 2016-08-16) (Spearman’s Rank Correlation (p-value<0.05 and coefficient<-0.25)) |
| Cancer type | miRNA id | miRNA accession | P-val. | Coeff. | # samples |
| Top |
| TissGeneMut for ACY3 |
| TissGeneSNV for ACY3 |
| nsSNV counts per each loci. Different colors of circles represent different cancer types. Circle size denotes number of samples. (TCGA somatic mutation (SNPs and small INDELs) data, version 2016-04-25) * Click on the image to enlarge it in a new window. |
 |
 |
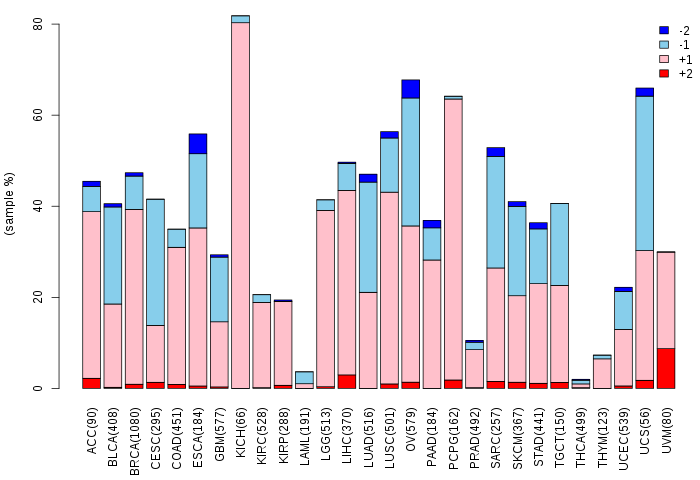
| Somatic nucleotide variants of TissGene across 28 cancer types (X-axis: cancer type and Y-axis: % of mutated samples) The numbers in parentheses are numbers of samples with mutation (nsSNVs). (TCGA somatic mutation (SNPs and small INDELs) data, version 2016-04-25) |
 |
| - nsSNVs sorted by frequency. |
| AAchange | Cancer type | # samples |
| p.A307V | LUAD | 1 |
| p.L115Q | LUAD | 1 |
| p.M220I | LUAD | 1 |
| p.A222D | SARC | 1 |
| p.E285K | SKCM | 1 |
| p.P181L | SKCM | 1 |
| p.V293I | LUSC | 1 |
| p.R13H | UCEC | 1 |
| p.A56P | HNSC | 1 |
| p.S266N | UCEC | 1 |
| p.P82T | BLCA | 1 |
| p.Y279C | STAD | 1 |
| p.D204N | SKCM | 1 |
| p.E207K | SKCM | 1 |
| p.P55R | BLCA | 1 |
| p.Q42H | BLCA | 1 |
| p.Q98K | SKCM | 1 |
| p.A39E | SKCM | 1 |
| p.P280S | LUAD | 1 |
| p.C140Y | LIHC | 1 |
| p.N121S | UCEC | 1 |
| p.E163K | HNSC | 1 |
| p.A39T | SKCM | 1 |
| p.A128V | KIRP | 1 |
| p.D269G | LIHC | 1 |
| p.R233C | PRAD | 1 |
| p.P309T | HNSC | 1 |
| p.C152X | COAD | 1 |
| p.Q184H | BLCA | 1 |
| p.Q98L | LUSC | 1 |
| p.N166S | SKCM | 1 |
| p.P216S | BLCA | 1 |
| p.M195I | BLCA | 1 |
| p.V305M | SKCM | 1 |
| p.V65E | STAD | 1 |
| p.A294T | BLCA | 1 |
| p.F262L | ESCA | 1 |
| p.R141H | GBM | 1 |
| Top |
| TissGeneCNV for ACY3 |
| Copy number variations of TissGene across 28 cancer types (X-axis: cancer type and Y-axis: % of CNV samples) (TCGA Gistic2_CopyNumber_Gistic2_all_data_by_genes, Gistic2 copy number data, version 2016-08-16) |
 |
| Top |
| TissGeneFusions for ACY3 |
| Fusion genes including TissGene (ChimerDB 3.0, 2016-12-01 and TCGA fusion Portal 2015-12-01) |
| Database | Src | Cancer type | Sample | Fusion gene | ORF | 5'-gene BP | 3'-gene BP |
| Top |
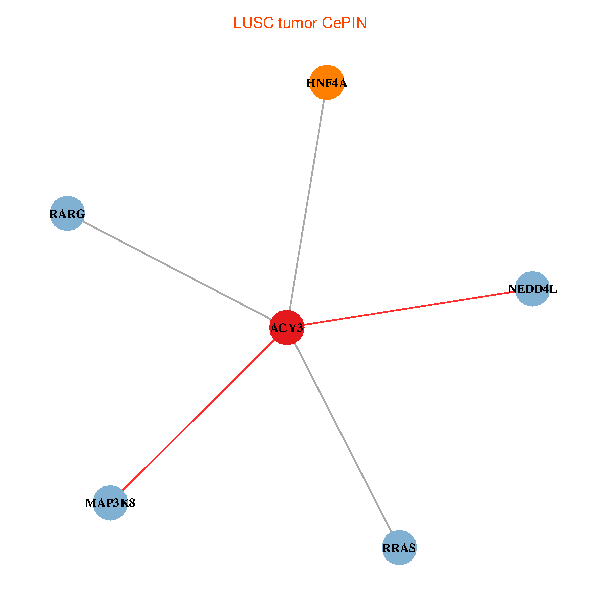
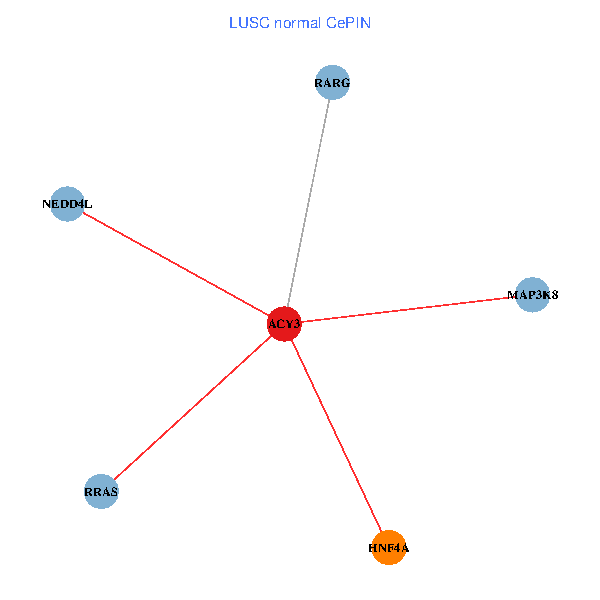
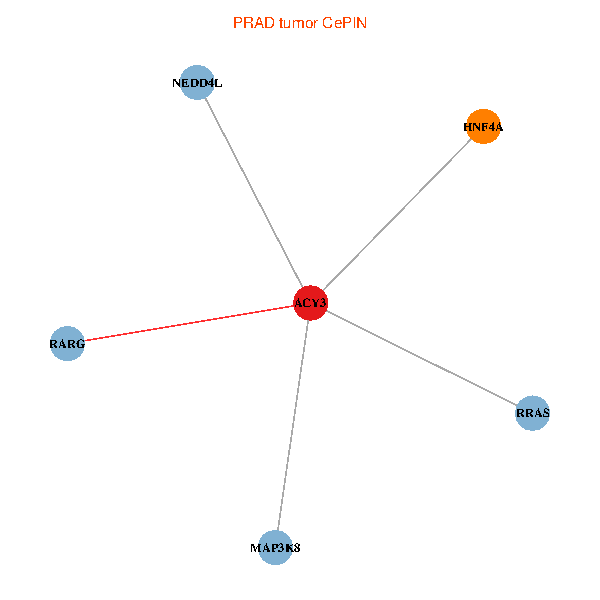
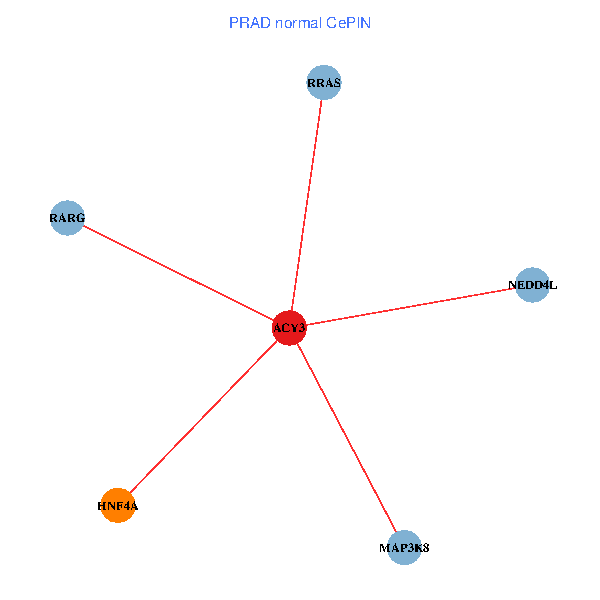
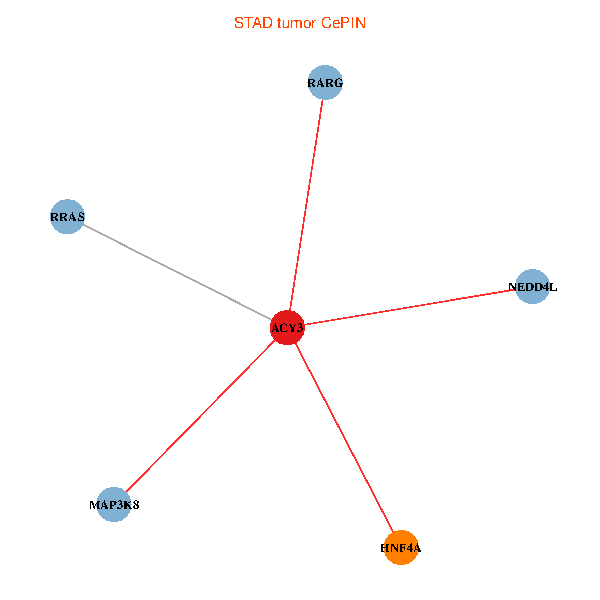
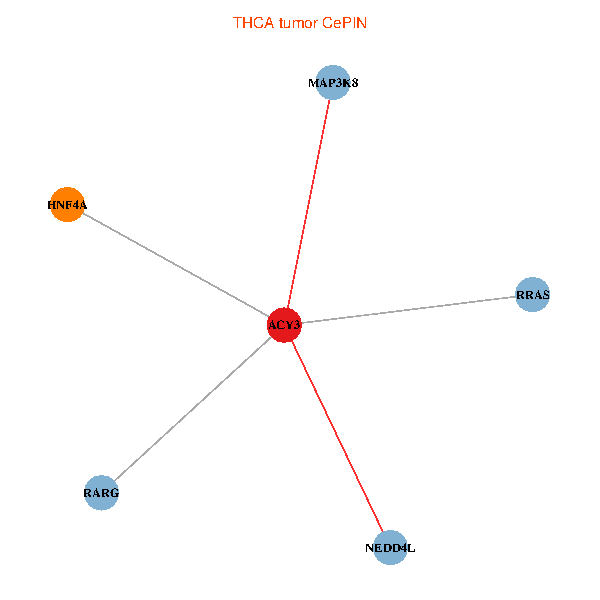
| TissGeneNet for ACY3 |
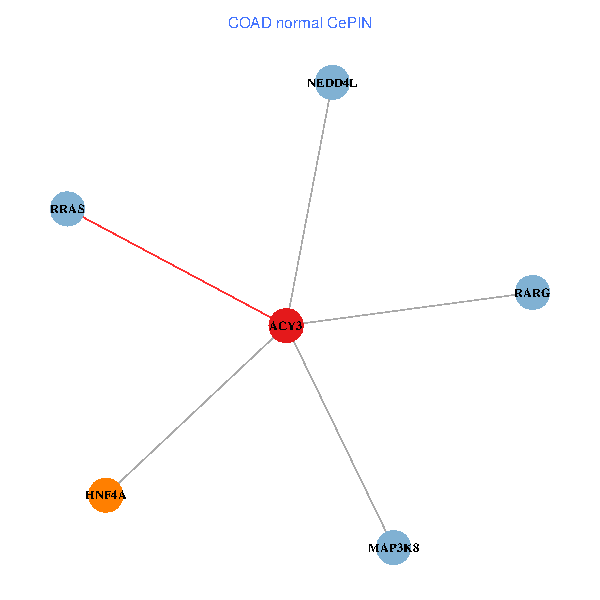
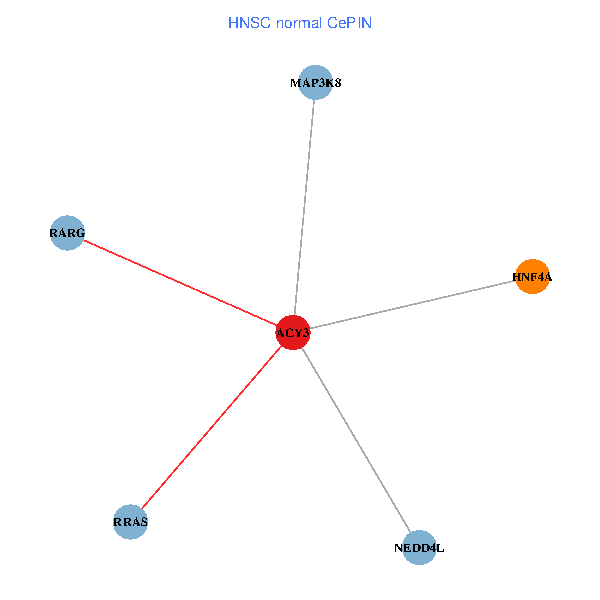
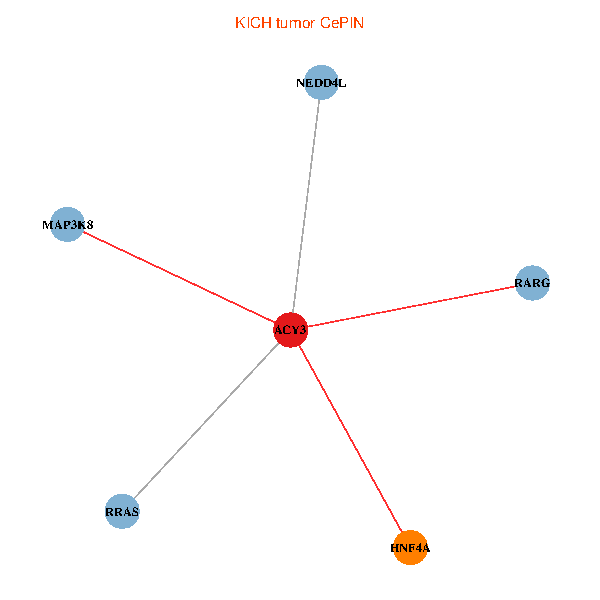
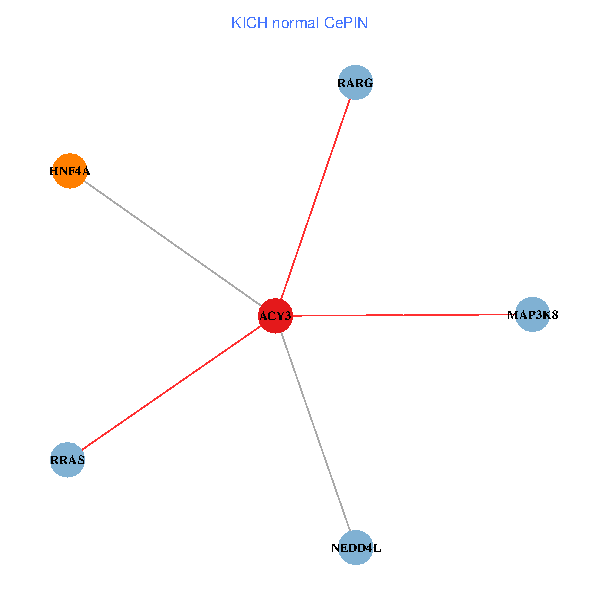
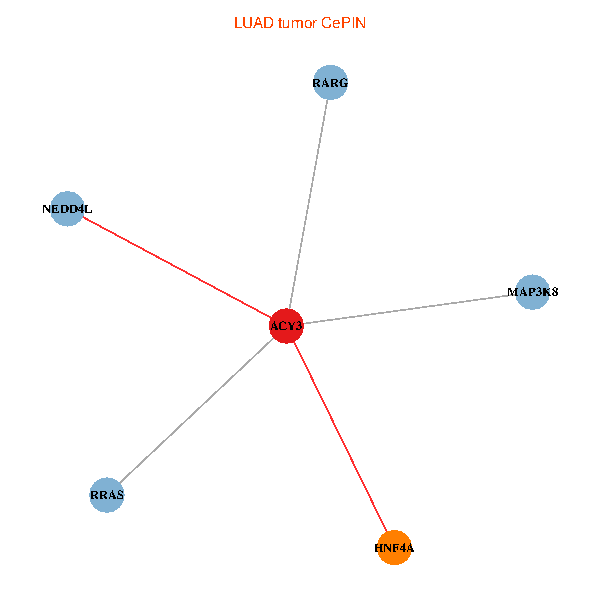
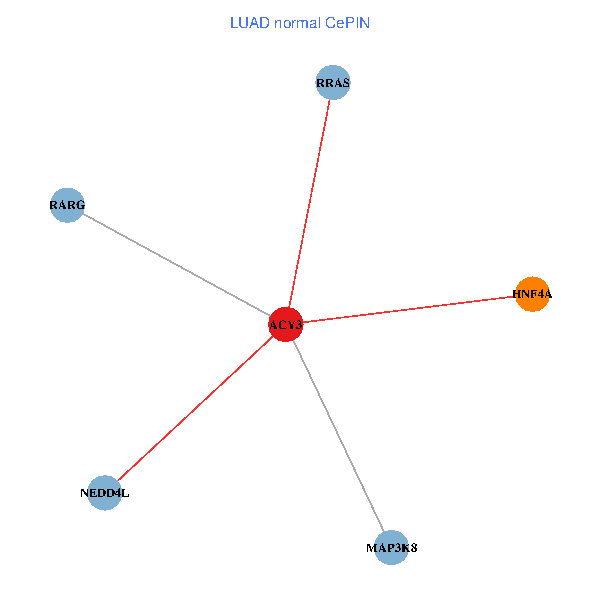
| Co-expressed gene networks based on protein-protein interaction data (CePIN) (TCGA IlluminaHiSeq_RNASeqV2, pan-cancer normalized log2(norm_counts+1) data, version 2016-08-16) (PINA2 ppi data) |
| BRCA (tumor) | BRCA (normal) |
| ACY3, HNF4A, NEDD4L, RARG, RRAS, MAP3K8 (tumor) | ACY3, HNF4A, NEDD4L, RARG, RRAS, MAP3K8 (normal) |
 |  |
| COAD (tumor) | COAD (normal) |
| ACY3, HNF4A, NEDD4L, RARG, RRAS, MAP3K8 (tumor) | ACY3, HNF4A, NEDD4L, RARG, RRAS, MAP3K8 (normal) |
 |  |
| HNSC (tumor) | HNSC (normal) |
| ACY3, HNF4A, NEDD4L, RARG, RRAS, MAP3K8 (tumor) | ACY3, HNF4A, NEDD4L, RARG, RRAS, MAP3K8 (normal) |
 |  |
| KICH (tumor) | KICH (normal) |
| ACY3, HNF4A, NEDD4L, RARG, RRAS, MAP3K8 (tumor) | ACY3, HNF4A, NEDD4L, RARG, RRAS, MAP3K8 (normal) |
 |  |
| KIRC (tumor) | KIRC (normal) |
| ACY3, HNF4A, NEDD4L, RARG, RRAS, MAP3K8 (tumor) | ACY3, HNF4A, NEDD4L, RARG, RRAS, MAP3K8 (normal) |
 |  |
| KIRP (tumor) | KIRP (normal) |
| ACY3, HNF4A, NEDD4L, RARG, RRAS, MAP3K8 (tumor) | ACY3, HNF4A, NEDD4L, RARG, RRAS, MAP3K8 (normal) |
 |  |
| LIHC (tumor) | LIHC (normal) |
| ACY3, HNF4A, NEDD4L, RARG, RRAS, MAP3K8 (tumor) | ACY3, HNF4A, NEDD4L, RARG, RRAS, MAP3K8 (normal) |
 |  |
| LUAD (tumor) | LUAD (normal) |
| ACY3, HNF4A, NEDD4L, RARG, RRAS, MAP3K8 (tumor) | ACY3, HNF4A, NEDD4L, RARG, RRAS, MAP3K8 (normal) |
 |  |
| LUSC (tumor) | LUSC (normal) |
| ACY3, HNF4A, NEDD4L, RARG, RRAS, MAP3K8 (tumor) | ACY3, HNF4A, NEDD4L, RARG, RRAS, MAP3K8 (normal) |
 |  |
| PRAD (tumor) | PRAD (normal) |
| ACY3, HNF4A, NEDD4L, RARG, RRAS, MAP3K8 (tumor) | ACY3, HNF4A, NEDD4L, RARG, RRAS, MAP3K8 (normal) |
 |  |
| STAD (tumor) | STAD (normal) |
| ACY3, HNF4A, NEDD4L, RARG, RRAS, MAP3K8 (tumor) | ACY3, HNF4A, NEDD4L, RARG, RRAS, MAP3K8 (normal) |
 |  |
| THCA (tumor) | THCA (normal) |
| ACY3, HNF4A, NEDD4L, RARG, RRAS, MAP3K8 (tumor) | ACY3, HNF4A, NEDD4L, RARG, RRAS, MAP3K8 (normal) |
 |  |
| Top |
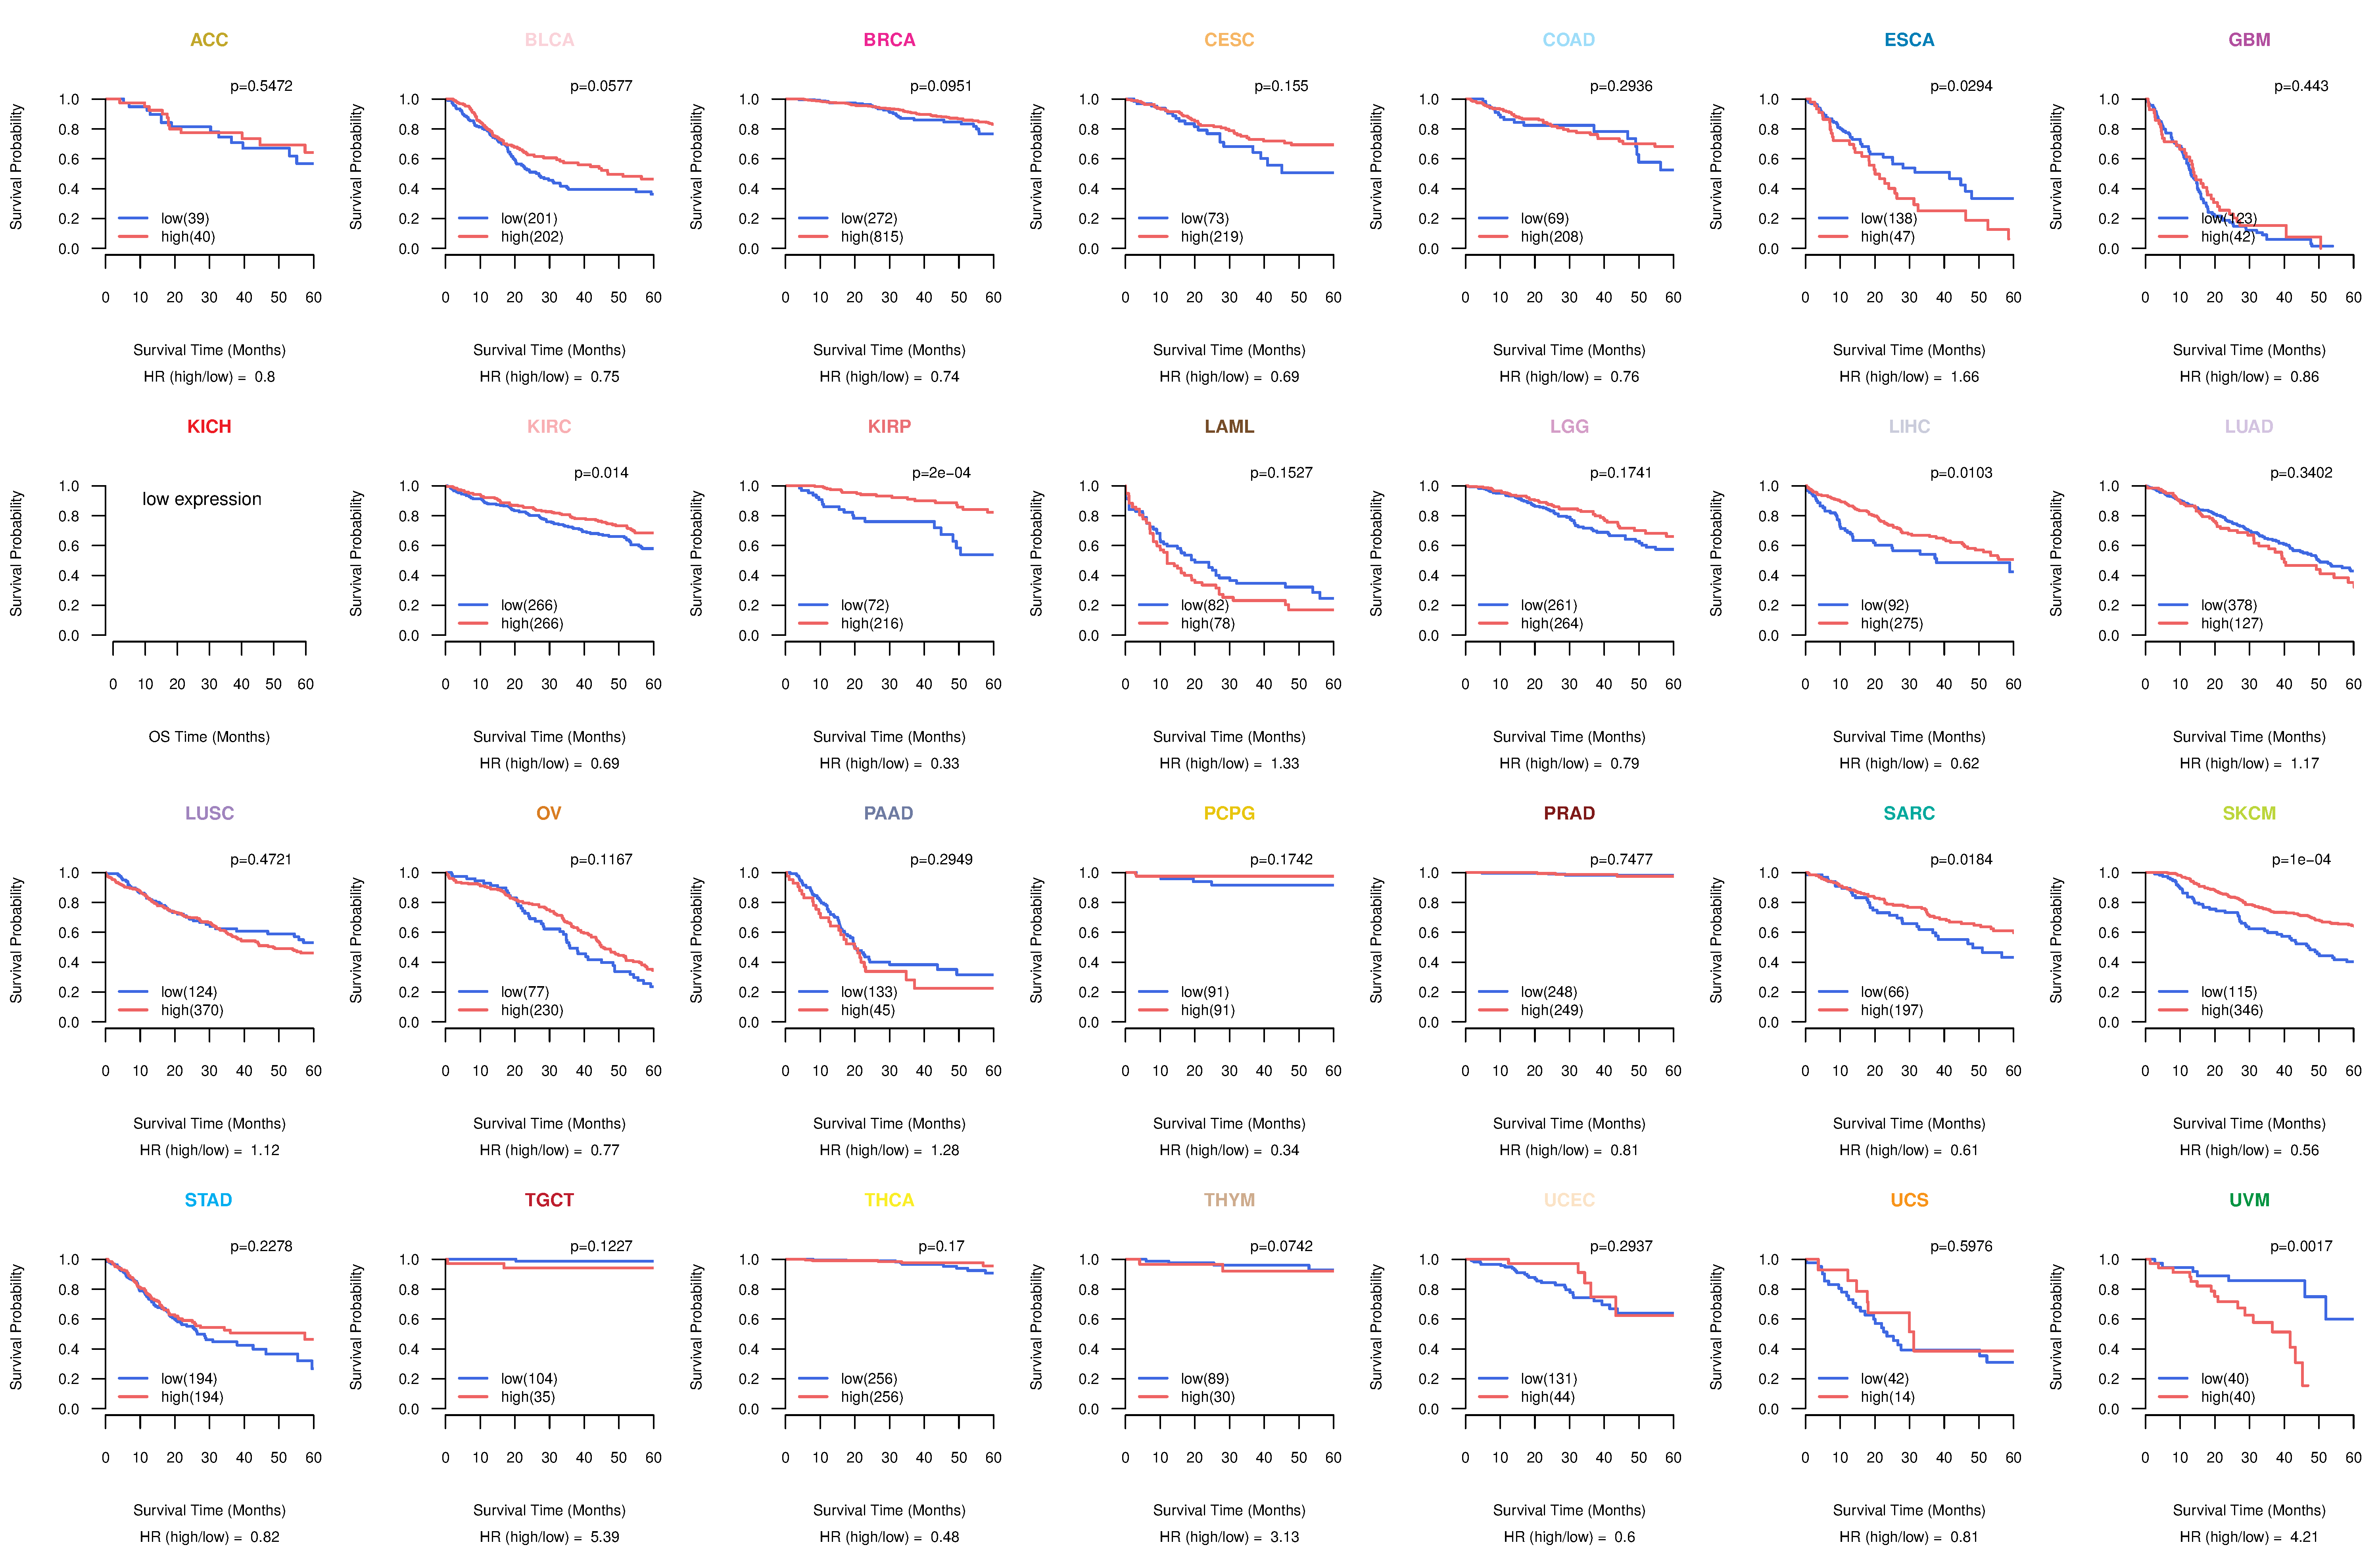
| TissGeneProg for ACY3 |
| Kaplan-Meier plots with logrank tests of overall survival (OS) using 28 cancer types (TCGA IlluminaHiSeq_RNASeqV2, pan-cancer normalized log2(norm_counts+1) data, version 2016-08-16) (TCGA clinicalMatrix, phenotype data, version 2016-04-27) * Click on the image to enlarge it in a new window. |
 |
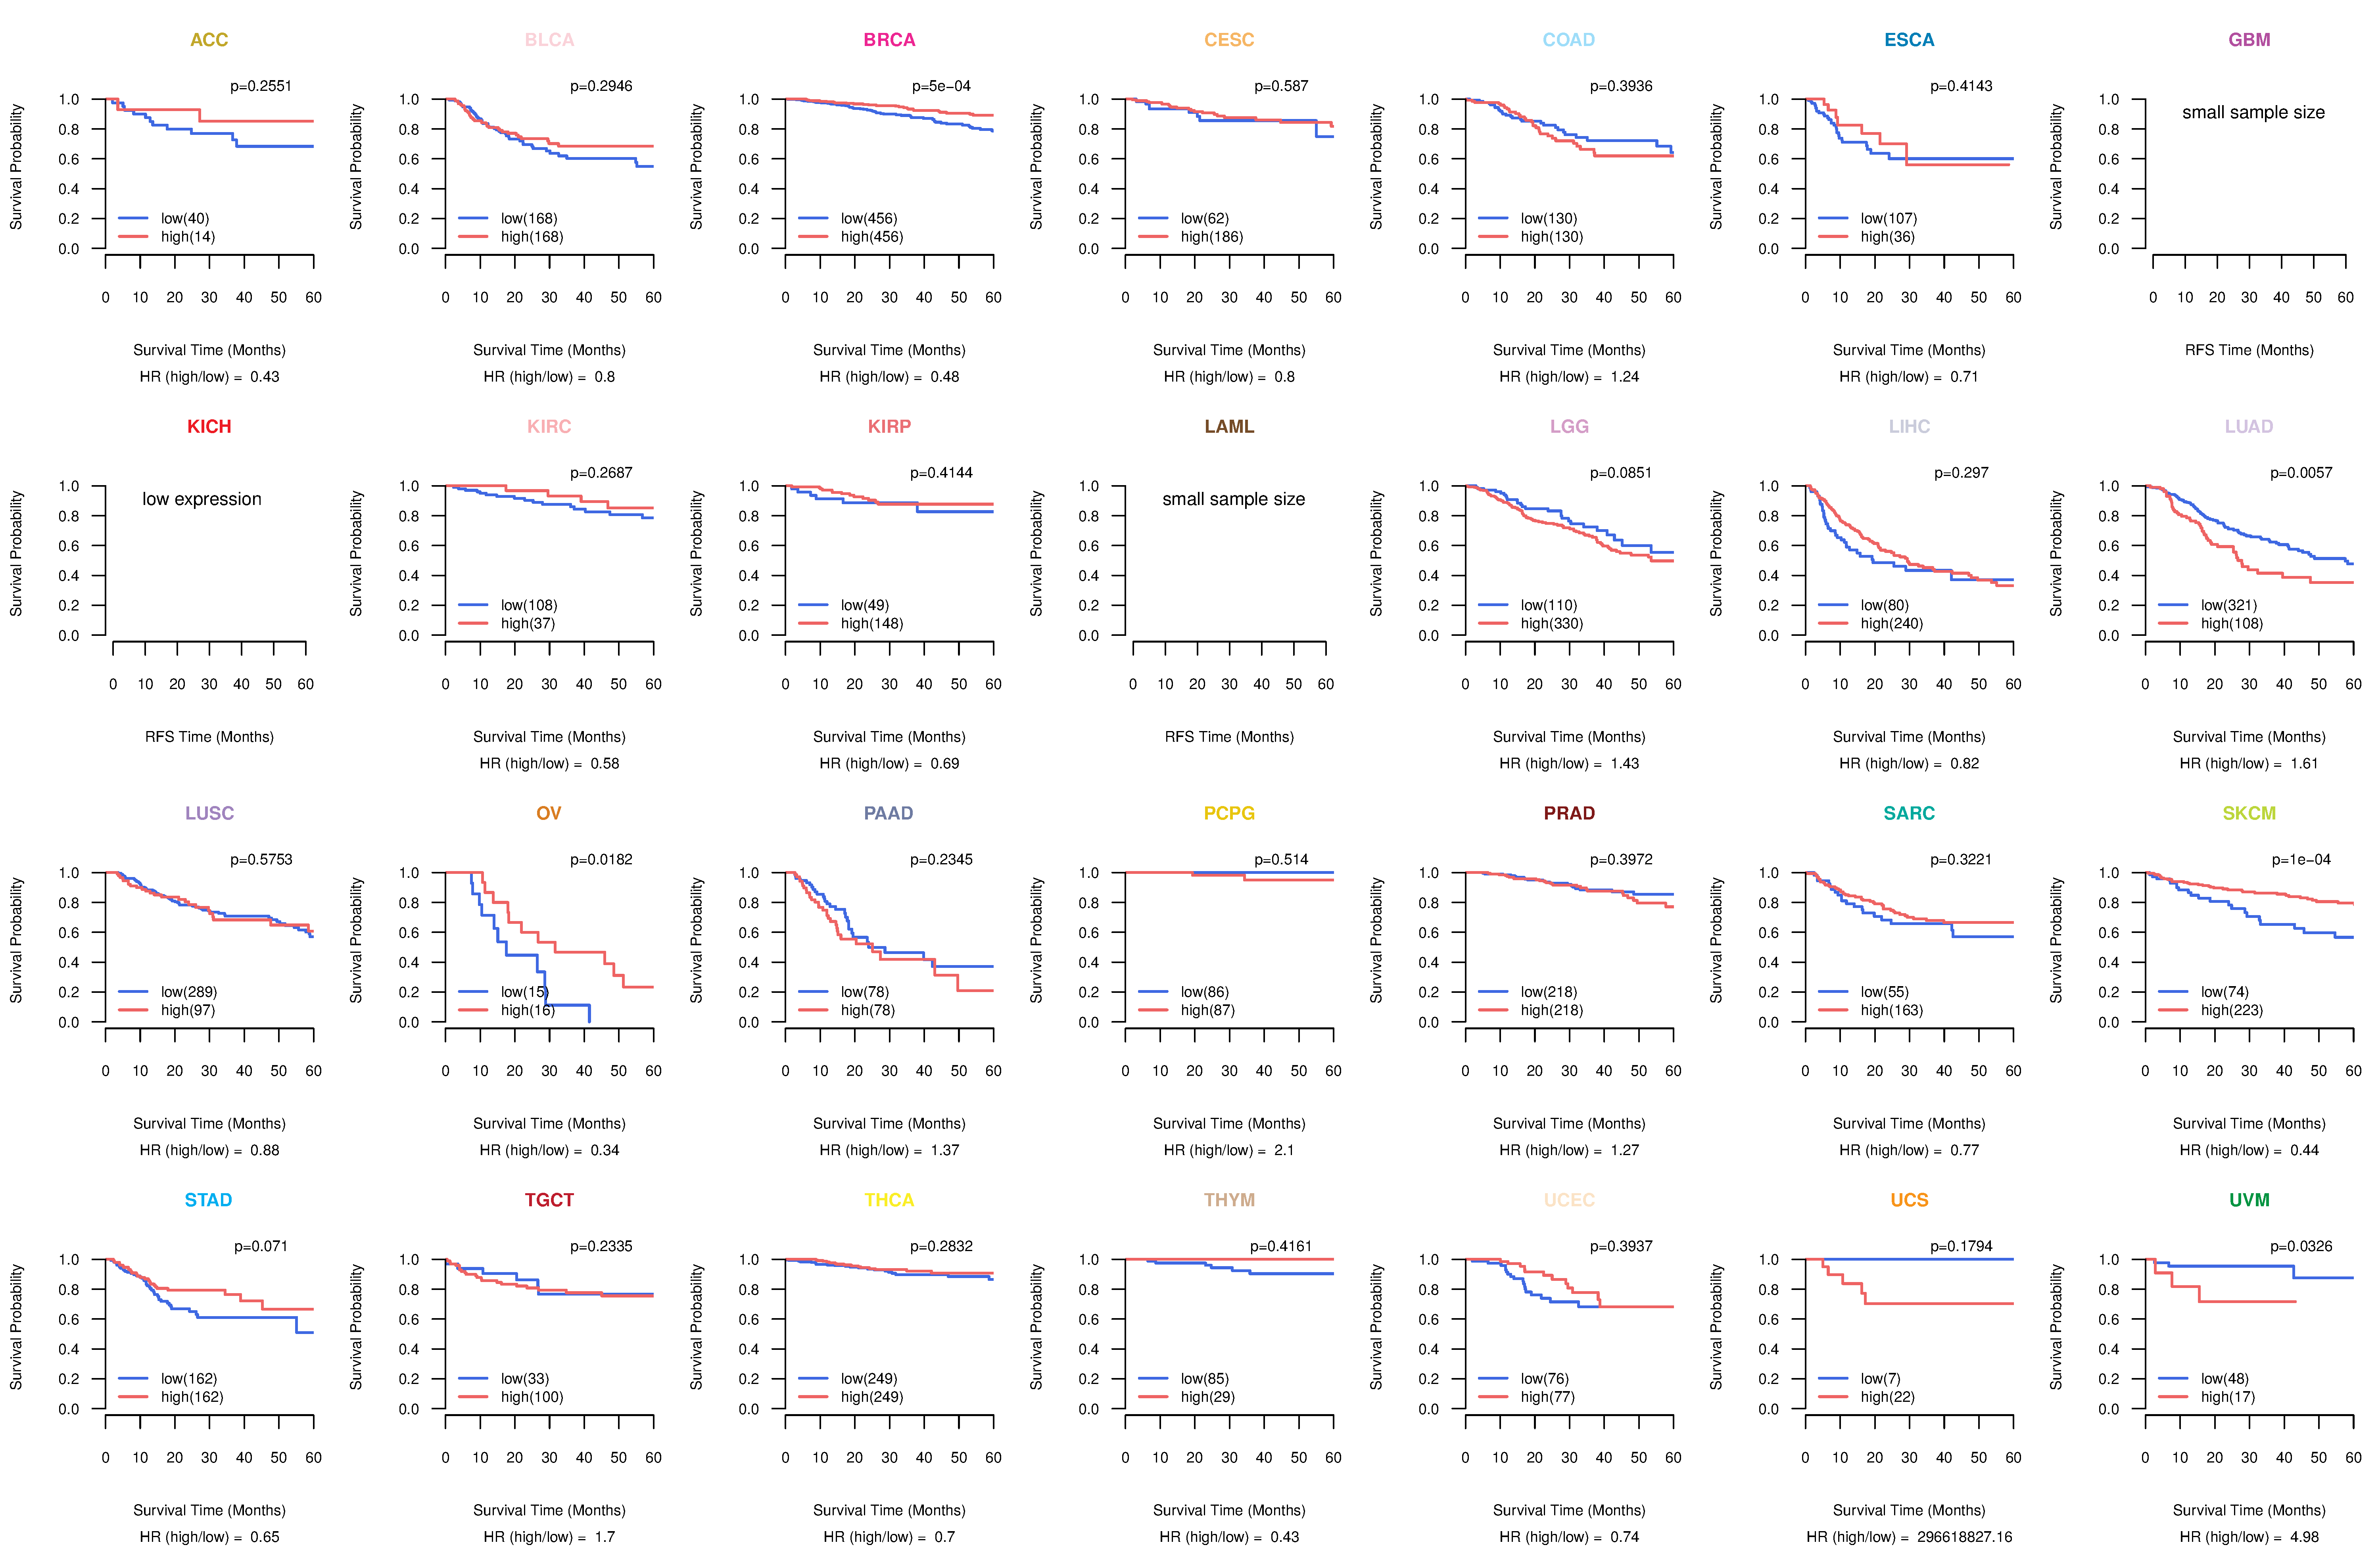
| Kaplan-Meier plots with logrank test of relapse free survival (RFS) using 28 cancer types (TCGA IlluminaHiSeq_RNASeqV2, pan-cancer normalized log2(norm_counts+1) data, version 2016-08-16) (TCGA clinicalMatrix, phenotype data, version 2016-04-27) * Click on the image enlarge it in a new window. |
 |
| Forest plot of Cox proportional hazard ratio (HR) and 95% CI of overall survival (OS) using 28 cancer types (TCGA IlluminaHiSeq_RNASeqV2, pan-cancer normalized log2(norm_counts+1) data, version 2016-08-16) (TCGA clinicalMatrix, phenotype data, version 2016-04-27) * Click on the image enlarge it in a new window. |
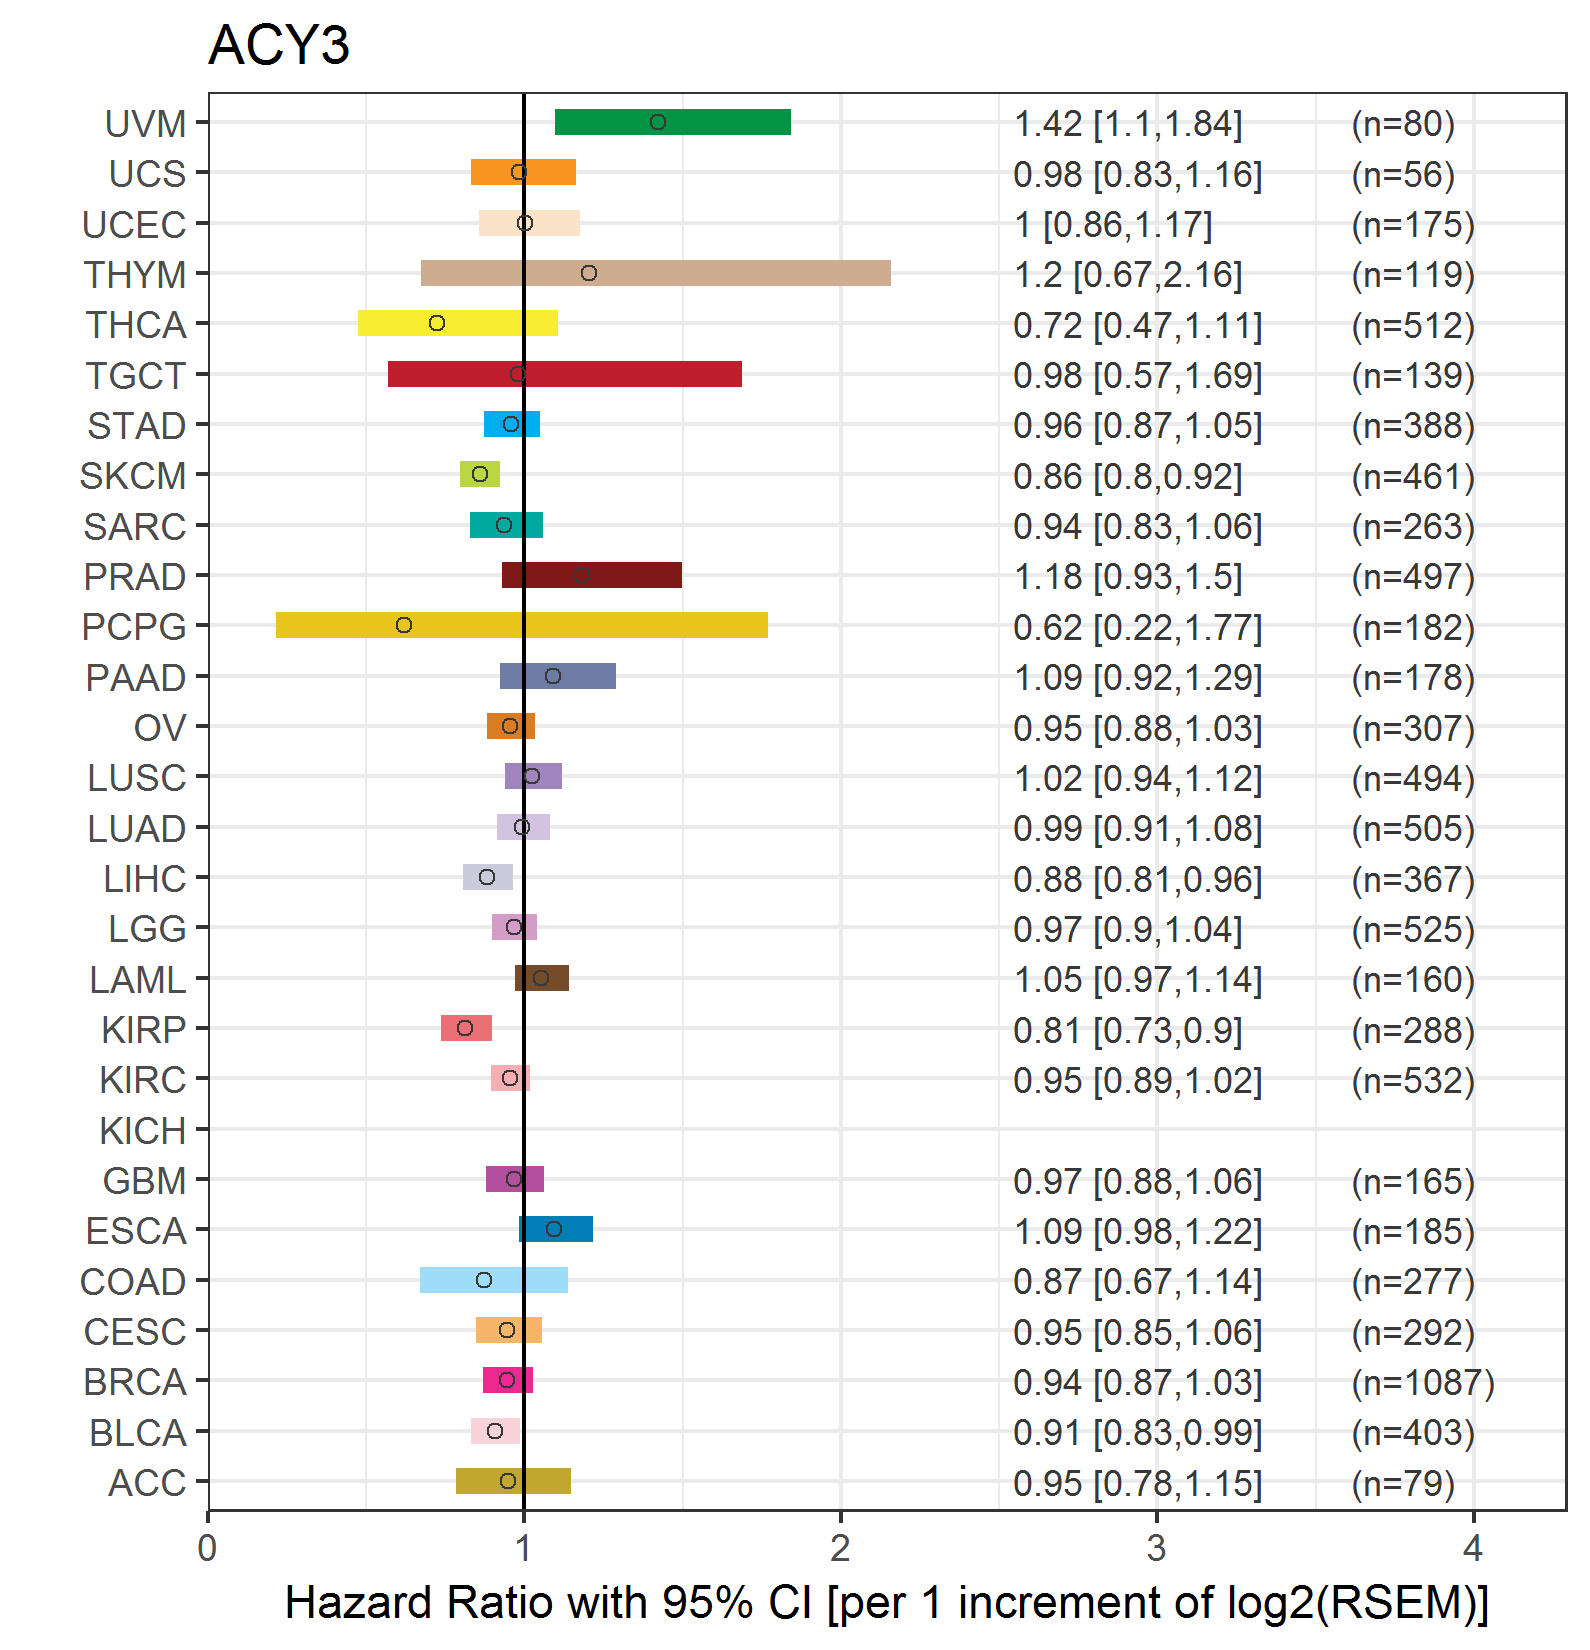 |
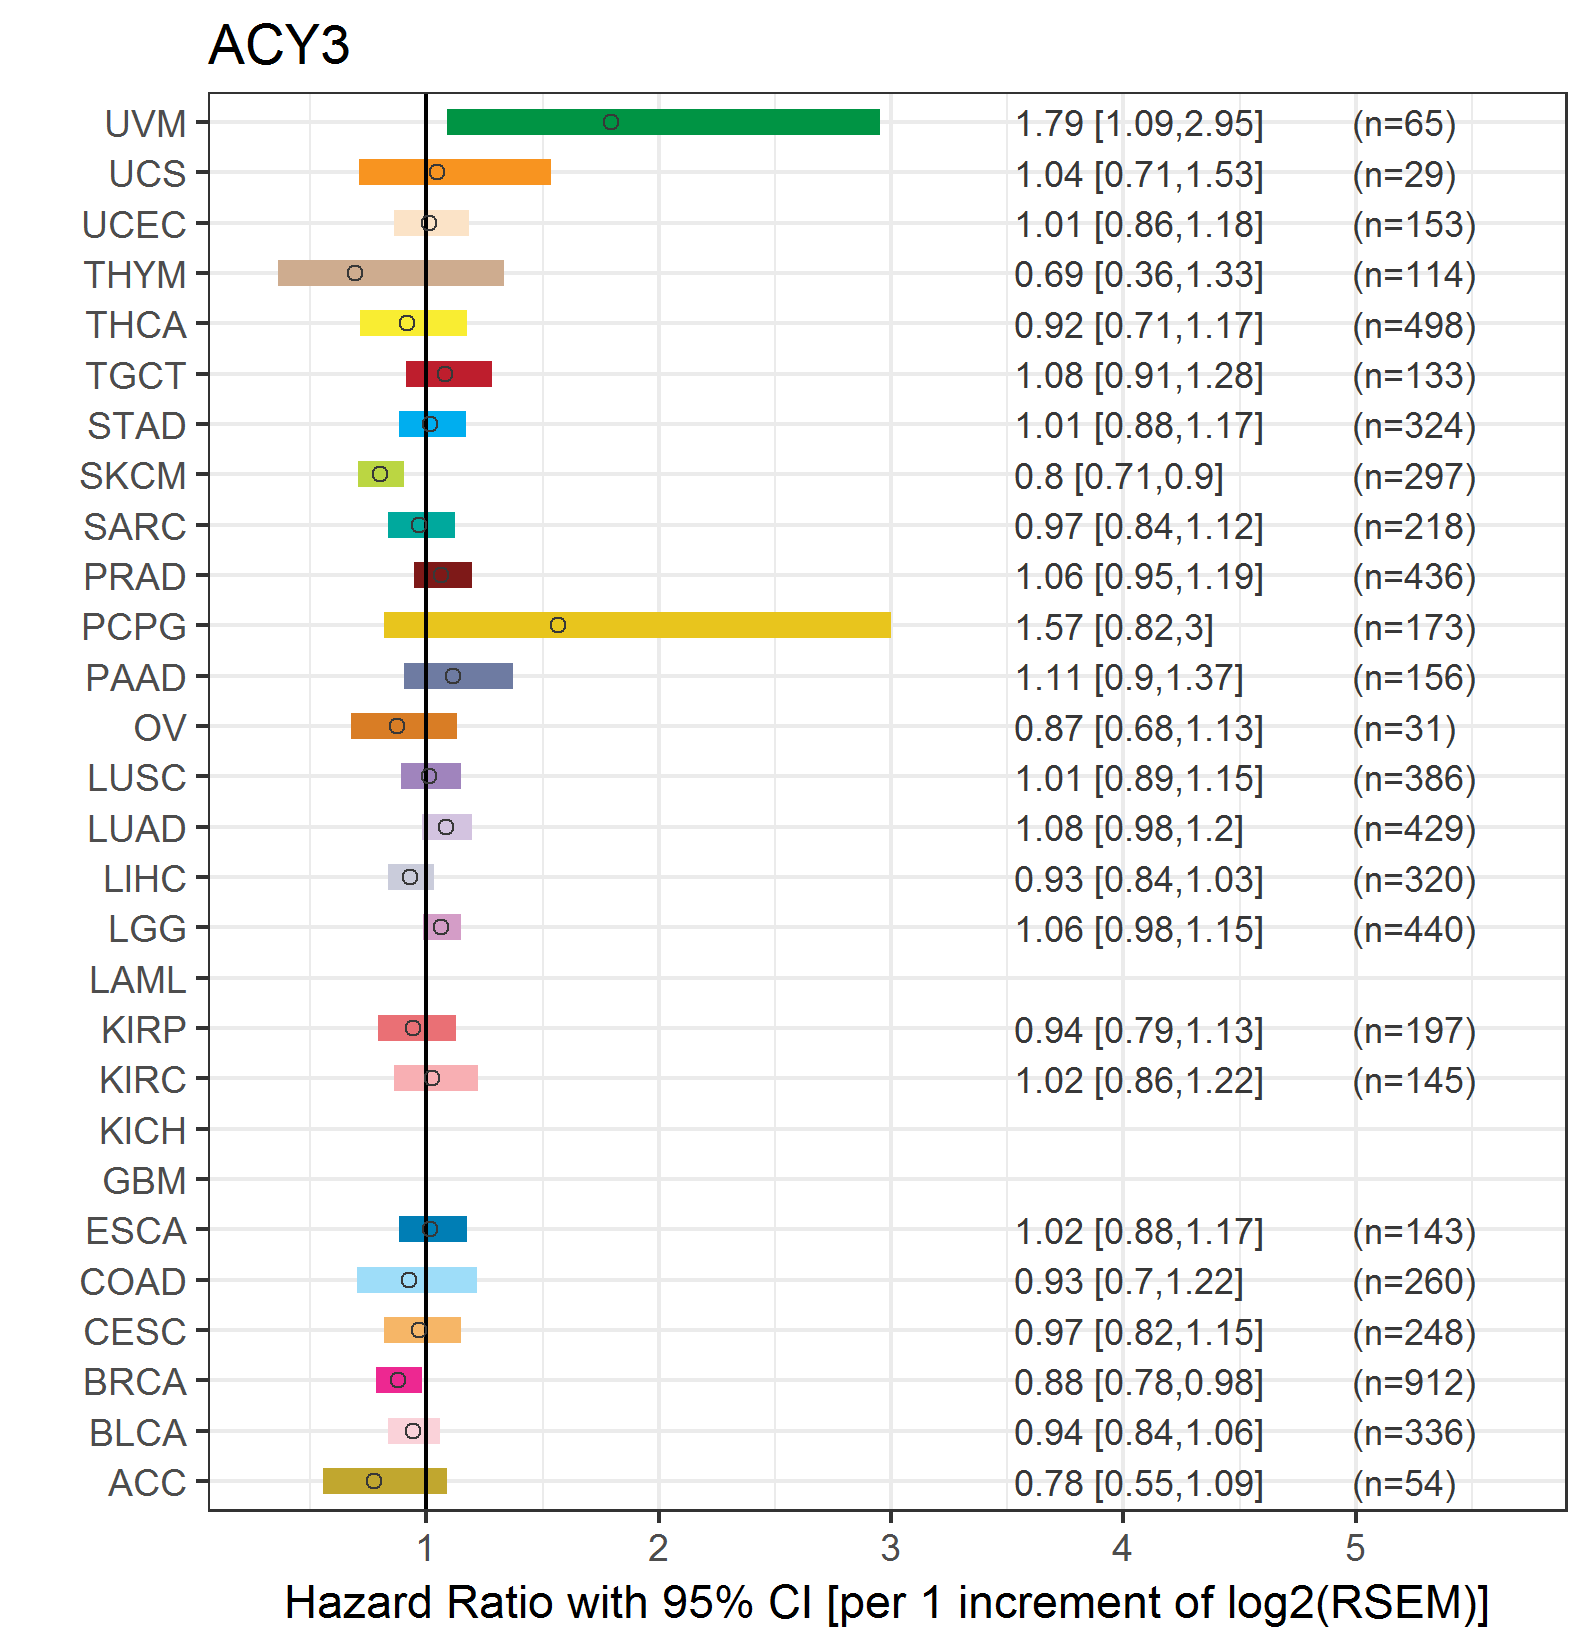
| Forest plot of Cox proportional hazard ratio (HR) and 95% CI of relapse free survival (RFS) using 28 cancer types (TCGA IlluminaHiSeq_RNASeqV2, pan-cancer normalized log2(norm_counts+1) data, version 2016-08-16) (TCGA clinicalMatrix, phenotype data, version 2016-04-27) * Click on the image enlarge it in a new window. |
 |
| Top |
| TissGeneClin for ACY3 |
| TissGeneDrug for ACY3 |
| Drug information targeting TissGene (DrugBank Version 5.0.6, 2017-04-01) |
| DrugBank ID | Drug name | Drug activity | Drug type | Drug status |
| DB00128 | L-Aspartic Acid | Small molecule | Approved|Nutraceutical |
| Top |
| TissGeneDisease for ACY3 |
| Disease information associated with TissGene (DisGeNet, 2016-06-01) |
| Disease ID | Disease name | # pubmeds | Source |
| umls:C0007134 | Renal Cell Carcinoma | 1 | BeFree |
| umls:C0023903 | Liver neoplasms | 1 | BeFree |
| umls:C0027819 | Neuroblastoma | 1 | BeFree |
| umls:C0700095 | Central neuroblastoma | 1 | BeFree |
| umls:C2239176 | Liver carcinoma | 1 | BeFree |
|
Copyright 2016-Present - The University of Texas Health Science Center at Houston (UTHealth) Web File Viewing | How to Report, Fraud, Waste and Abuse | State of Texas | Statewide Search | Texas Homeland Security | Site Policies |