 |
| |
| |
| |
| |
| |
| |
|

| TissGeneSummary for GLYATL1 |
 Gene summary Gene summary |
| Basic gene information | Gene symbol | GLYATL1 |
| Gene name | glycine-N-acyltransferase-like 1 | |
| Synonyms | GATF-C|GNAT | |
| Cytomap | UCSC genome browser: 11q12.1 | |
| Type of gene | protein-coding | |
| RefGenes | NM_001220494.2, NM_001220496.2,NM_080661.4, | |
| Description | acyl-CoA:glycine N-acyltransferase-like protein 1glutamine N-acyltransferaseglycine N-acyltransferase-like protein 1 | |
| Modification date | 20141207 | |
| dbXrefs | MIM : 614761 | |
| HGNC : HGNC | ||
| Ensembl : ENSG00000166840 | ||
| HPRD : 14447 | ||
| Vega : OTTHUMG00000167221 | ||
| Protein | UniProt: go to UniProt's Cross Reference DB Table | |
| Expression | CleanEX: HS_GLYATL1 | |
| BioGPS: 92292 | ||
| Pathway | NCI Pathway Interaction Database: GLYATL1 | |
| KEGG: GLYATL1 | ||
| REACTOME: GLYATL1 | ||
| Pathway Commons: GLYATL1 | ||
| Context | iHOP: GLYATL1 | |
| ligand binding site mutation search in PubMed: GLYATL1 | ||
| UCL Cancer Institute: GLYATL1 | ||
| Assigned class in TissGDB* | C | |
| Included tissue-specific gene expression resources | TiGER,GTEx | |
| Specific-tissues in normal samples (assigned by TissGDB using HPA, TiGER, and GTEx) | KidneyLiver | |
| Cancer types related to the specific-tissues in cancer samples (assigned by TissGDB using TCGA) | KIRC,KIRP,KICHLIHC | |
| Reference showing the relevant tissue of GLYATL1 | ||
| Description by TissGene annotations | ||
| * Class A consists of genes with literature evidence and is part of the cTissGenes. Class B consists of only cTissGenes without additional evidence. The remaining genes belong to Class C. |
| Gene ontology having evidence of Inferred from Direct Assay (IDA) from Entrez |
| GO ID | GO term | PubMed ID |
| Top |
| TissGeneExp for GLYATL1 |
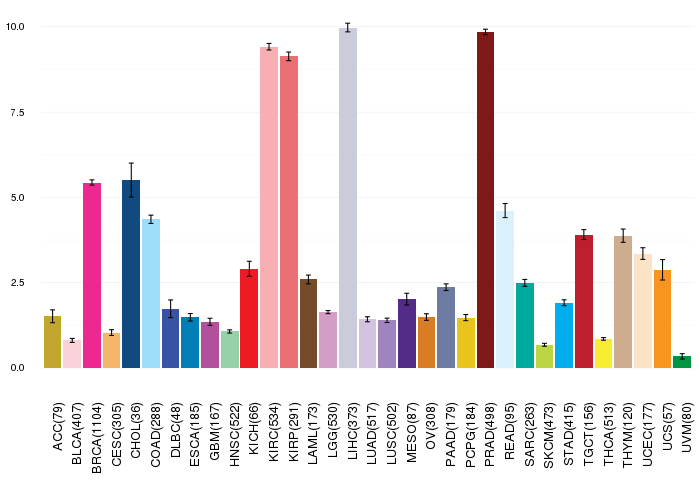
| Gene expressions across 28 cancer types (X-axis: cancer type and Y-axis: log2(norm_counts+1)) (TCGA IlluminaHiSeq_RNASeqV2, pan-cancer normalized log2(norm_counts+1) data, version 2016-08-16) |
 |
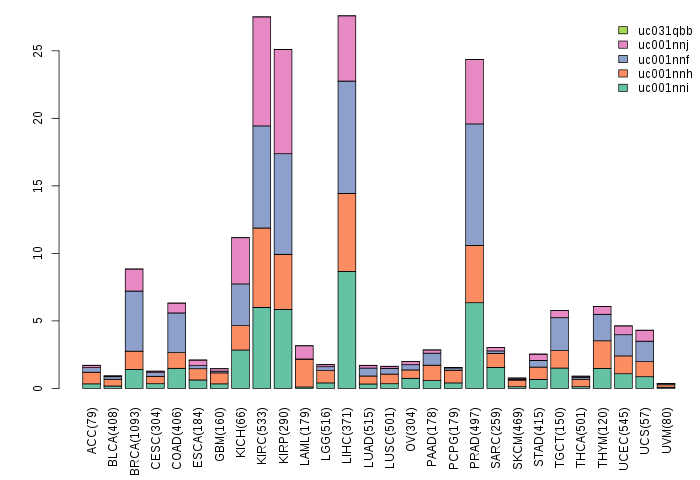
| Gene isoform expressions across 28 cancer types (X-axis: cancer type and Y-axis: log2(norm_counts+1)) (TCGA pan-cancer tcga_rsem_isoform_tpm, version 2016-09-01) |
 |
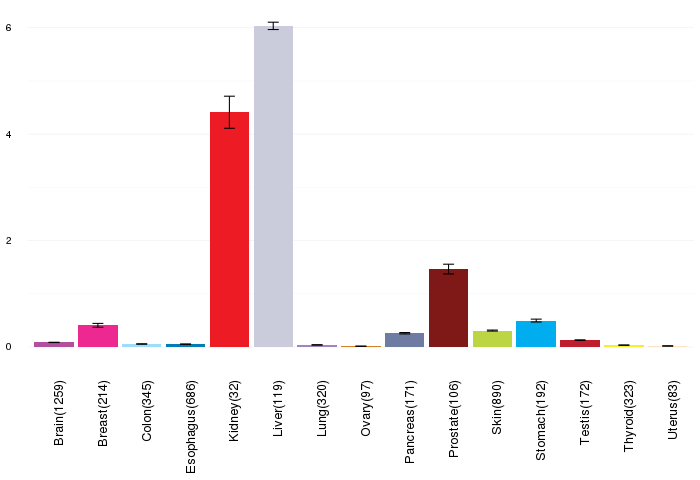
| Gene expressions across normal tissues of GTEx data (GTEx GTEx_Analysis_v6_RNA-seq_RNA-SeQCv1.1.8_gene_rpkm.gct) - Here, we shows the matched tissue types only among our 28 cancer types. |
 |
| Different expressions across 14 cancer types with more than 10 samples between matched tumors and normals (X-axis: cancer type and Y-axis: log2(norm_counts+1)) (TCGA IlluminaHiSeq_RNASeqV2, pan-cancer normalized log2(norm_counts+1) data, version 2016-08-16) |
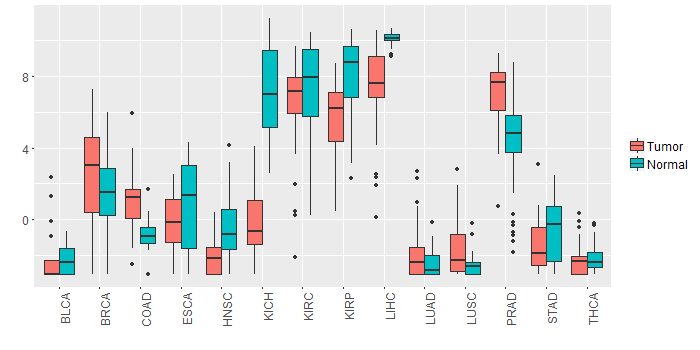 |
| - Significantly differentially expressed cancer types and information. (|Fold change|>1 and FDR<0.05) |
| Cancer type | Mean(exp) in tumor | Mean(exp) in matched normal | Log2FC | P-val. | FDR |
| PRAD | 7.019633313 | 4.315846775 | 2.703786538 | 3.85E-09 | 5.23E-08 |
| HNSC | -2.124787125 | -0.426738288 | -1.698048837 | 5.24E-07 | 4.29E-06 |
| LIHC | 7.388979852 | 10.06848585 | -2.679506 | 2.23E-11 | 3.32E-10 |
| KICH | -0.268912148 | 7.064087852 | -7.333 | 5.60E-16 | 1.44E-14 |
| KIRP | 5.567904227 | 8.200132352 | -2.632228125 | 2.56E-06 | 1.18E-05 |
| BRCA | 2.518098799 | 1.376947045 | 1.141151754 | 0.000351 | 0.000727164 |
| COAD | 0.920289083 | -0.846137841 | 1.766426923 | 0.00018 | 0.000614299 |
| Top |
| TissGene-miRNA for GLYATL1 |
| Significantly anti-correlated miRNAs of TissGene across 28 cancer types (Gene-miRNA relations from TargetScanHuman Relsease 7.1, Conserved_Site_Context_Scores.txt.zip, 06.01.2016) (TCGA IlluminaHiSeq_miRNASeq, log2(RPM+1) data, version 2016-11-21) (TCGA IlluminaHiSeq_RNASeqV2, log2(normalized_count+1) data, version 2016-08-16) (Spearman’s Rank Correlation (p-value<0.05 and coefficient<-0.25)) |
| Cancer type | miRNA id | miRNA accession | P-val. | Coeff. | # samples |
| Top |
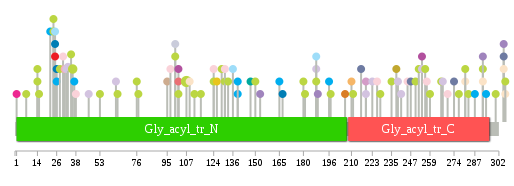
| TissGeneMut for GLYATL1 |
| TissGeneSNV for GLYATL1 |
| nsSNV counts per each loci. Different colors of circles represent different cancer types. Circle size denotes number of samples. (TCGA somatic mutation (SNPs and small INDELs) data, version 2016-04-25) * Click on the image to enlarge it in a new window. |
 |
 |
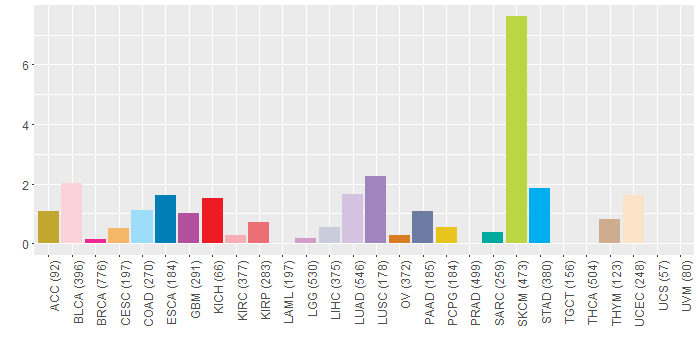
| Somatic nucleotide variants of TissGene across 28 cancer types (X-axis: cancer type and Y-axis: % of mutated samples) The numbers in parentheses are numbers of samples with mutation (nsSNVs). (TCGA somatic mutation (SNPs and small INDELs) data, version 2016-04-25) |
 |
| - nsSNVs sorted by frequency. |
| AAchange | Cancer type | # samples |
| p.R107C | SKCM | 5 |
| p.P36S | SKCM | 2 |
| p.V126I | PCPG | 1 |
| p.P22H | STAD | 1 |
| p.M266I | SKCM | 1 |
| p.V147L | SARC | 1 |
| p.L46M | LUAD | 1 |
| p.M283I | SKCM | 1 |
| p.S24F | SKCM | 1 |
| p.G24E | SKCM | 1 |
| p.M254I | GBM | 1 |
| p.R31S | KIRC | 1 |
| p.R281Q | SKCM | 1 |
| p.C294Y | STAD | 1 |
| p.M241I | LUAD | 1 |
| p.R219Q | LGG | 1 |
| p.P189T | LUSC | 1 |
| p.R76C | SKCM | 1 |
| p.M95I | THYM | 1 |
| p.E112K | SKCM | 1 |
| p.T197I | SKCM | 1 |
| p.G180R | SKCM | 1 |
| p.M252I | SKCM | 1 |
| p.P292Q | UCEC | 1 |
| p.E259K | SKCM | 1 |
| p.D35N | SKCM | 1 |
| p.E228K | SKCM | 1 |
| p.V38M | BLCA | 1 |
| p.G273C | HNSC | 1 |
| p.R305C | UCEC | 1 |
| p.P332S | GBM | 1 |
| p.V77M | SKCM | 1 |
| p.V216D | PAAD | 1 |
| p.G14E | SKCM | 1 |
| p.G181E | SKCM | 1 |
| p.Y102H | KIRP | 1 |
| p.L53F | SKCM | 1 |
| p.D97Y | BLCA | 1 |
| p.R270L | BLCA | 1 |
| p.A25V | KICH | 1 |
| p.C318Y | STAD | 1 |
| p.A238V | ACC | 1 |
| p.E28K | SKCM | 1 |
| p.M254I | LUAD | 1 |
| p.E124D | BLCA | 1 |
| p.I37V | STAD | 1 |
| p.M223I | LUAD | 1 |
| p.P256L | SKCM | 1 |
| p.Y102* | GBM | 1 |
| p.L11M | HNSC | 1 |
| p.N91D | READ | 1 |
| p.P292Q | CHOL | 1 |
| p.E165K | STAD | 1 |
| p.Q102X | SKCM | 1 |
| p.R250Q | SKCM | 1 |
| p.R277Q | SKCM | 1 |
| p.S257F | BLCA | 1 |
| p.R274H | PAAD | 1 |
| p.R131K | SKCM | 1 |
| p.R26X | STAD | 1 |
| p.P81T | HNSC | 1 |
| p.A239S | LUAD | 1 |
| p.R188Q | COAD | 1 |
| p.E136K | COAD | 1 |
| p.E245K | BLCA | 1 |
| p.P301A | HNSC | 1 |
| p.R188Q | LUAD | 1 |
| p.C325Y | STAD | 1 |
| p.F333L | LIHC | 1 |
| p.R281Q | UCEC | 1 |
| p.C287Y | STAD | 1 |
| p.F109L | UCEC | 1 |
| p.P50T | HNSC | 1 |
| p.H321Y | LUAD | 1 |
| p.R306K | SKCM | 1 |
| p.M1I | BRCA | 1 |
| p.Q322* | SKCM | 1 |
| p.Y32H | LUAD | 1 |
| p.A25T | COAD | 1 |
| p.S7F | SKCM | 1 |
| p.P292S | LUSC | 1 |
| p.R305S | LUSC | 1 |
| p.M235I | SKCM | 1 |
| p.R306I | UCEC | 1 |
| p.R26X | ESCA | 1 |
| p.R100K | SKCM | 1 |
| p.G30E | BLCA | 1 |
| p.S153* | LUSC | 1 |
| p.V247D | PAAD | 1 |
| p.P332L | SKCM | 1 |
| p.G14R | SKCM | 1 |
| p.H188Y | SKCM | 1 |
| p.E267* | LUAD | 1 |
| p.S226F | BLCA | 1 |
| p.L33M | LUAD | 1 |
| p.Y63H | LUAD | 1 |
| p.E139X | STAD | 1 |
| p.G211R | SKCM | 1 |
| p.P292S | SKCM | 1 |
| p.E139* | STAD | 1 |
| p.R305H | PAAD | 1 |
| p.K129E | SKCM | 1 |
| p.R219Q | LUAD | 1 |
| p.S116L | SKCM | 1 |
| p.D100N | LIHC | 1 |
| p.L25P | ESCA | 1 |
| p.D206Y | OV | 1 |
| p.S15F | SKCM | 1 |
| p.E319G | KIRP | 1 |
| p.R270* | HNSC | 1 |
| p.S210F | CESC | 1 |
| p.G150E | SKCM | 1 |
| p.Q133* | SKCM | 1 |
| p.R131I | BLCA | 1 |
| p.E167X | ESCA | 1 |
| p.E300D | SKCM | 1 |
| p.E319K | SKCM | 1 |
| p.E196K | STAD | 1 |
| p.H64D | SKCM | 1 |
| p.E124K | SKCM | 1 |
| Top |
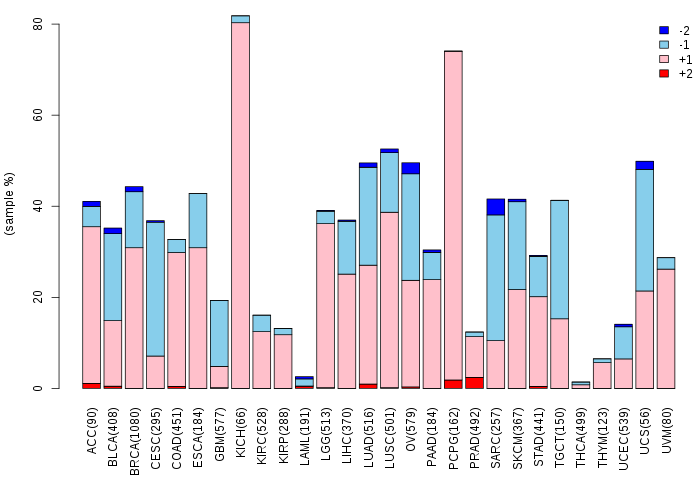
| TissGeneCNV for GLYATL1 |
| Copy number variations of TissGene across 28 cancer types (X-axis: cancer type and Y-axis: % of CNV samples) (TCGA Gistic2_CopyNumber_Gistic2_all_data_by_genes, Gistic2 copy number data, version 2016-08-16) |
 |
| Top |
| TissGeneFusions for GLYATL1 |
| Fusion genes including TissGene (ChimerDB 3.0, 2016-12-01 and TCGA fusion Portal 2015-12-01) |
| Database | Src | Cancer type | Sample | Fusion gene | ORF | 5'-gene BP | 3'-gene BP |
| Chimerdb3.0 | FusionScan | BRCA | TCGA-A8-A08F-01A | TAF6L-GLYATL1 | 5'UTR-CDS | chr11:62538962 | chr11:58722242 |
| TCGAfusionPortal | PRADA | BRCA | TCGA-A8-A08F-01A | TAF6L-GLYATL1 | 5UTR-CDS | Chr11:62538962 | Chr11:58722243 |
| TCGAfusionPortal | PRADA | BRCA | TCGA-OL-A66P-01A | FAM111B-GLYATL1 | Out-of-frame | Chr11:58877179 | Chr11:58714519 |
| Top |
| TissGeneNet for GLYATL1 |
| Co-expressed gene networks based on protein-protein interaction data (CePIN) (TCGA IlluminaHiSeq_RNASeqV2, pan-cancer normalized log2(norm_counts+1) data, version 2016-08-16) (PINA2 ppi data) |
| Top |
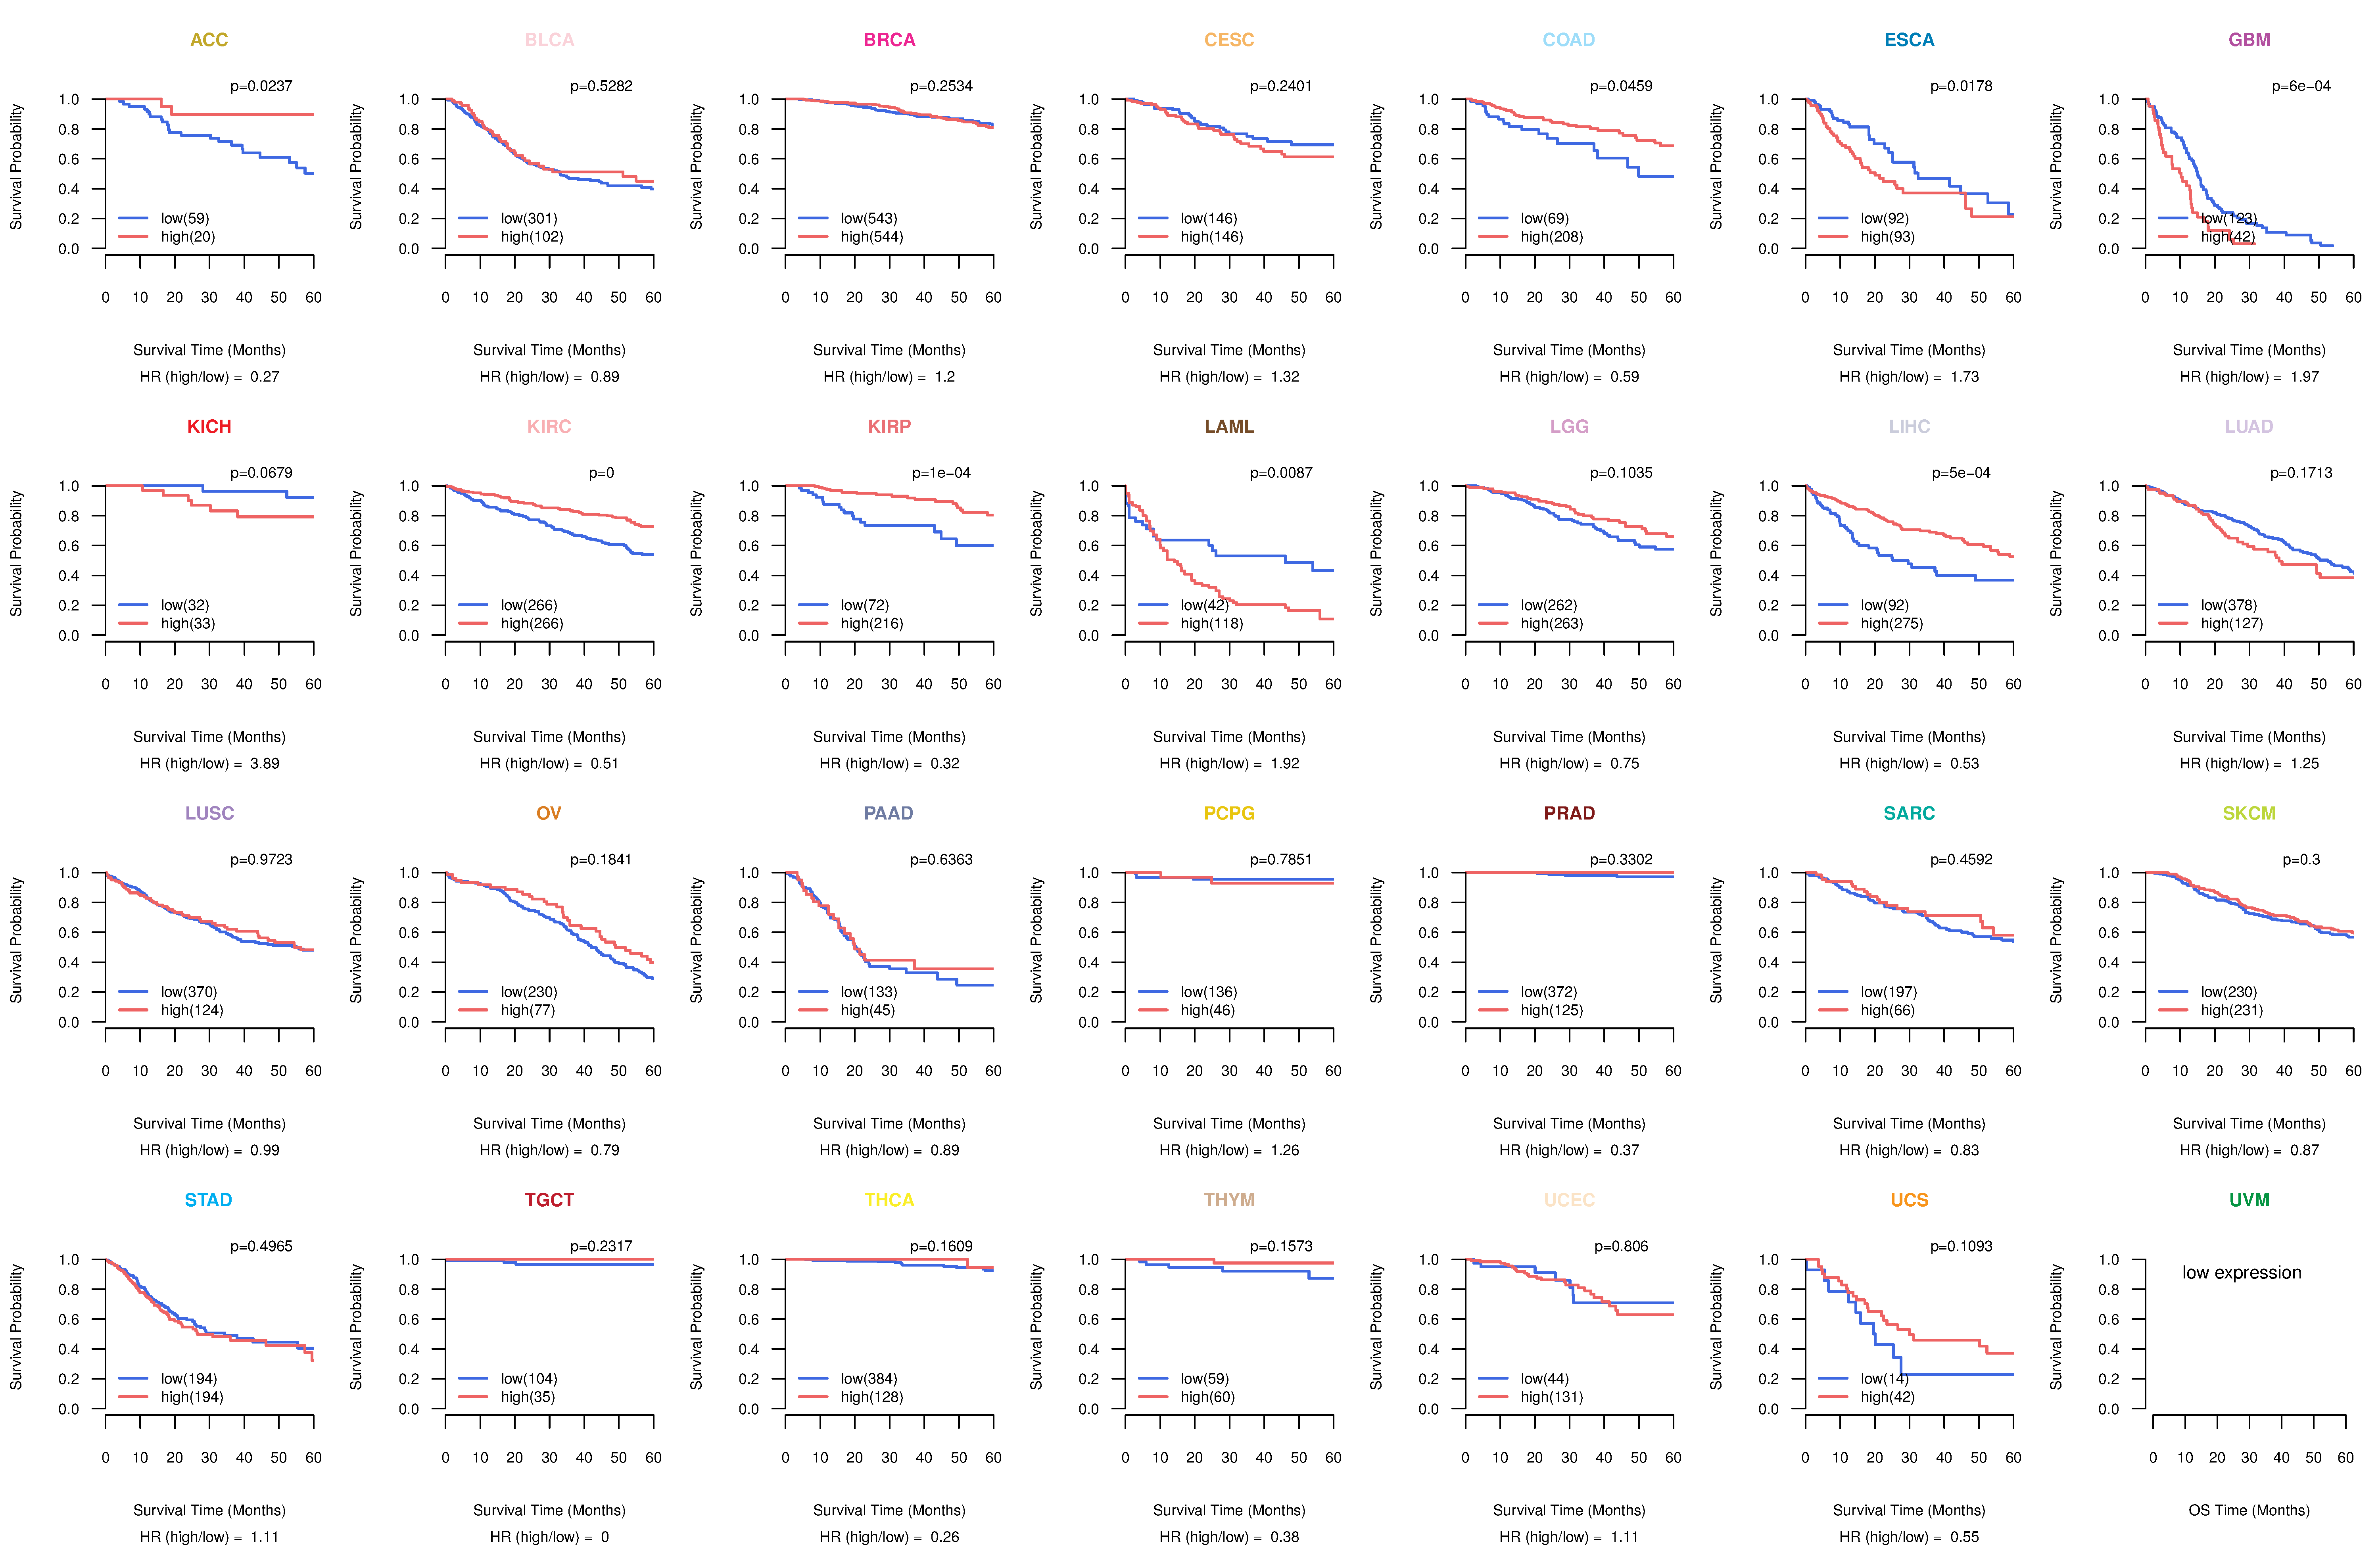
| TissGeneProg for GLYATL1 |
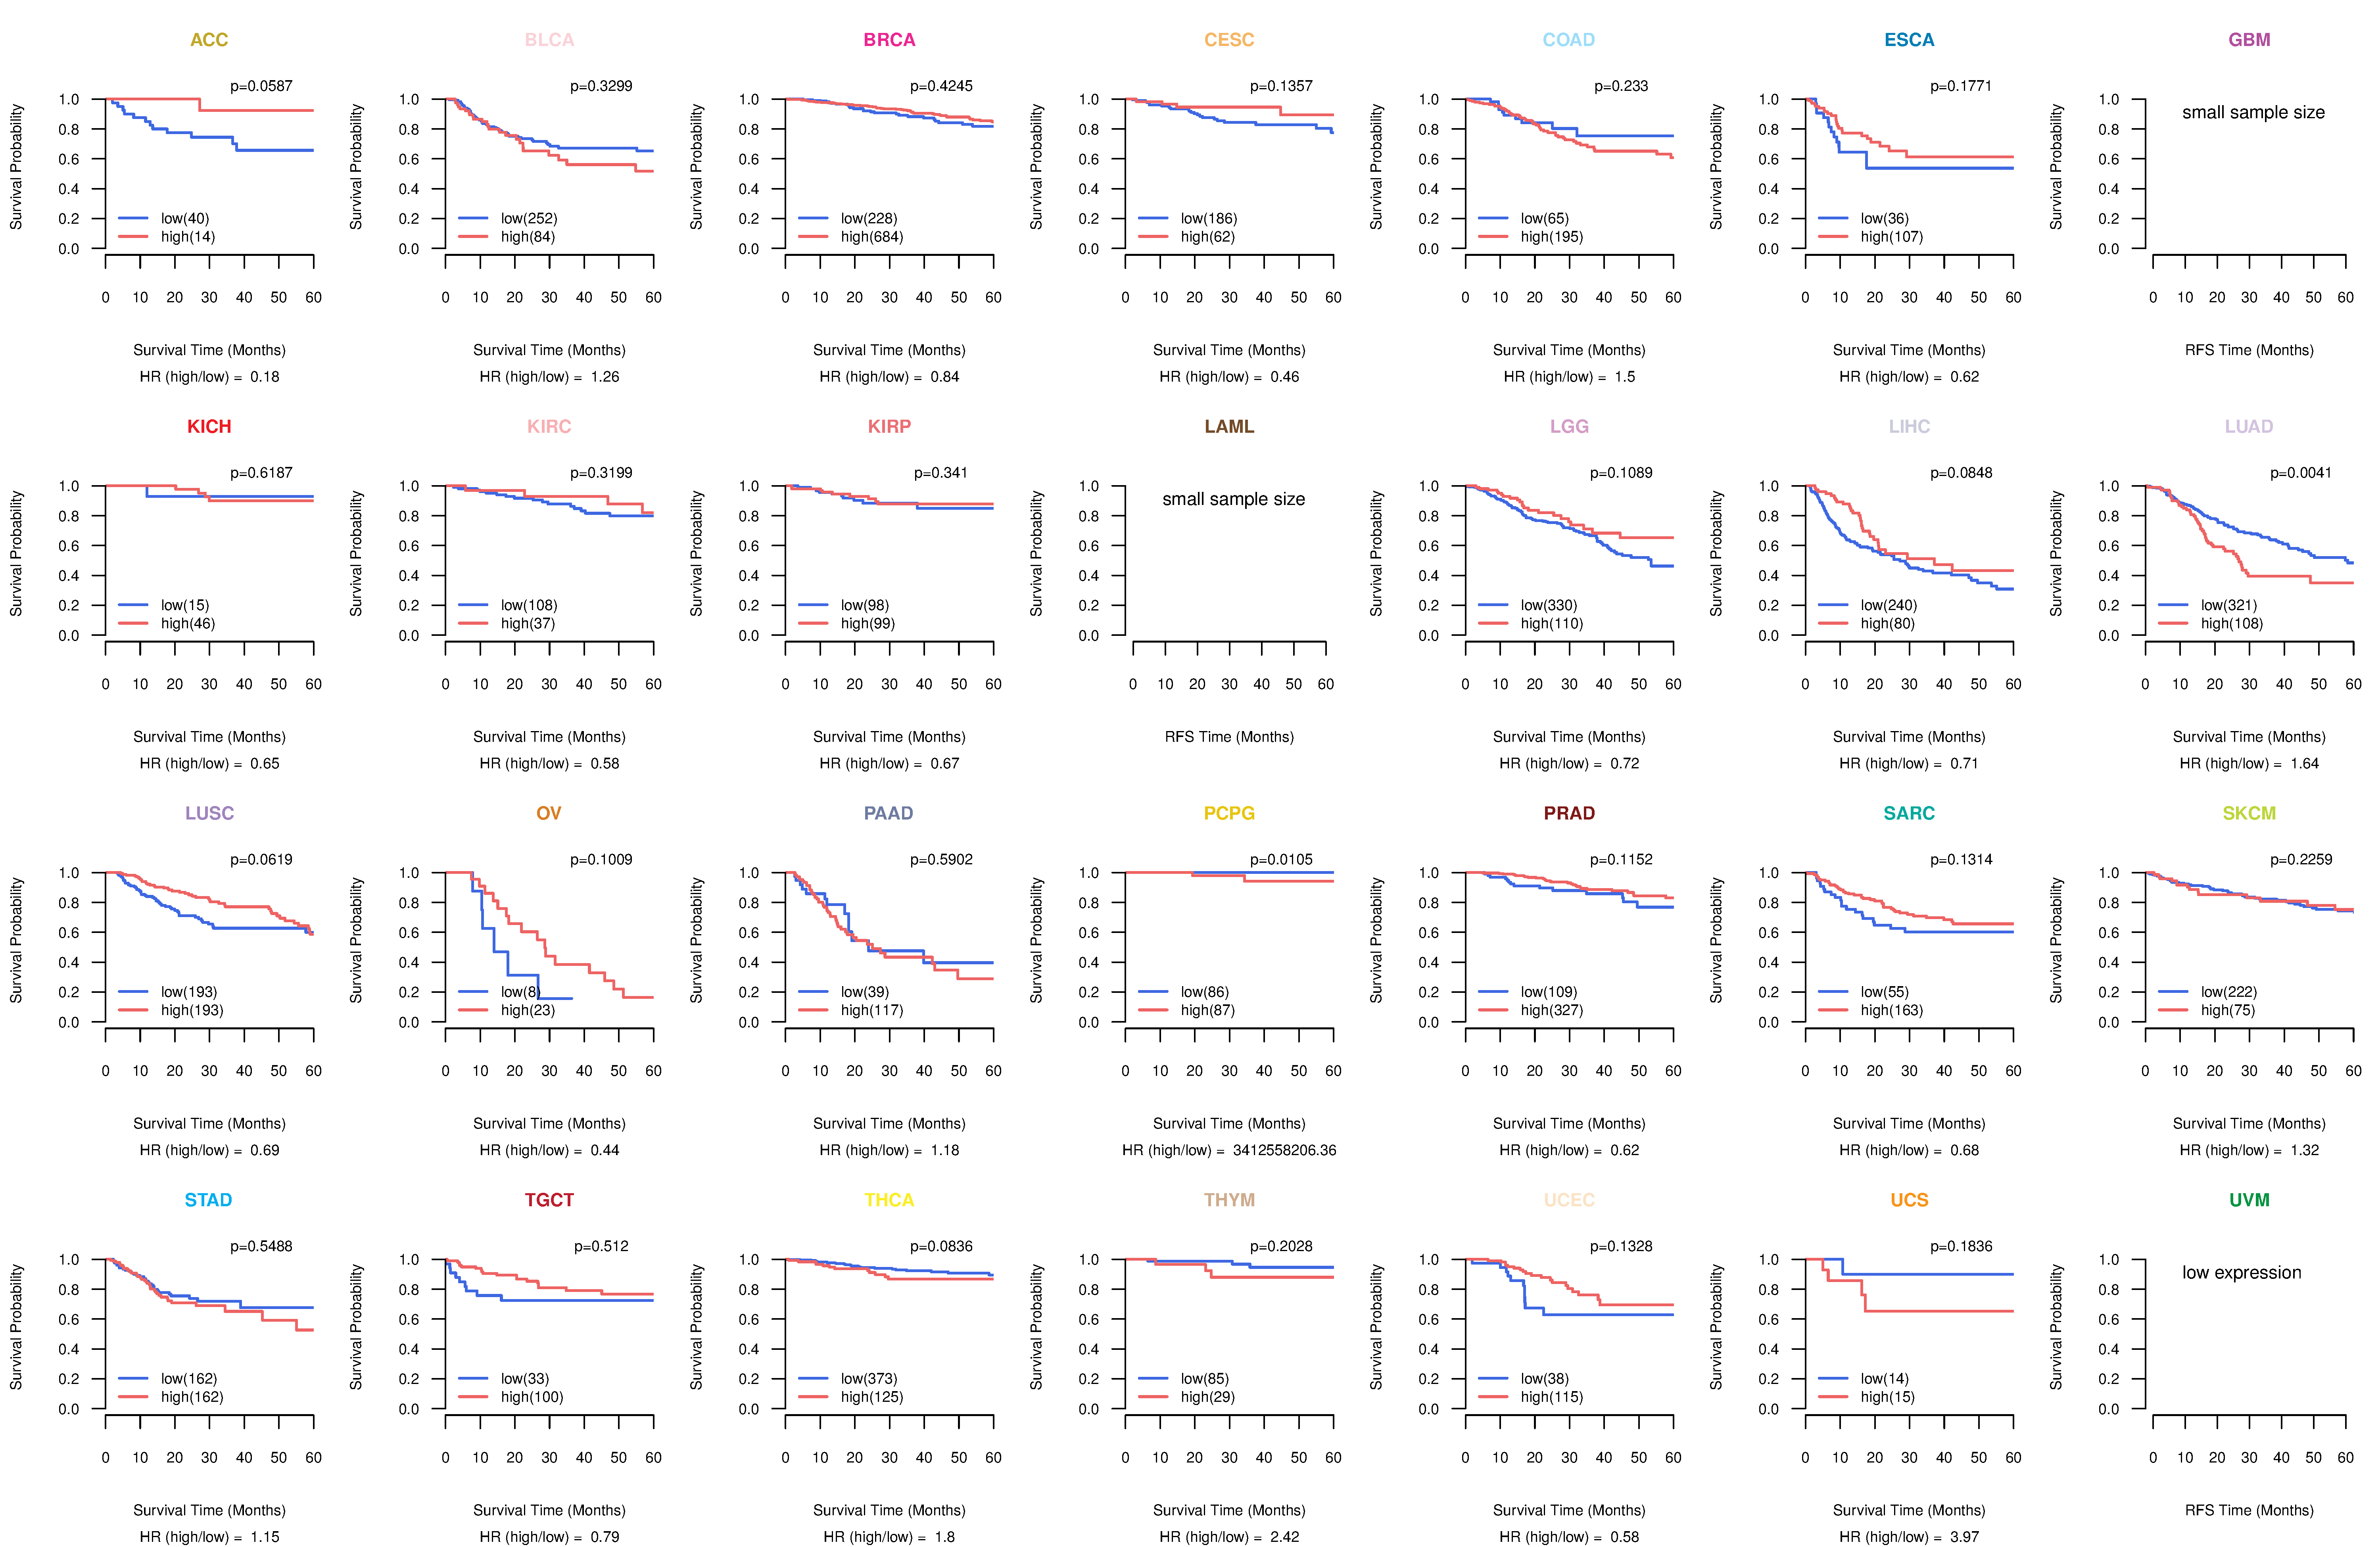
| Kaplan-Meier plots with logrank tests of overall survival (OS) using 28 cancer types (TCGA IlluminaHiSeq_RNASeqV2, pan-cancer normalized log2(norm_counts+1) data, version 2016-08-16) (TCGA clinicalMatrix, phenotype data, version 2016-04-27) * Click on the image to enlarge it in a new window. |
 |
| Kaplan-Meier plots with logrank test of relapse free survival (RFS) using 28 cancer types (TCGA IlluminaHiSeq_RNASeqV2, pan-cancer normalized log2(norm_counts+1) data, version 2016-08-16) (TCGA clinicalMatrix, phenotype data, version 2016-04-27) * Click on the image enlarge it in a new window. |
 |
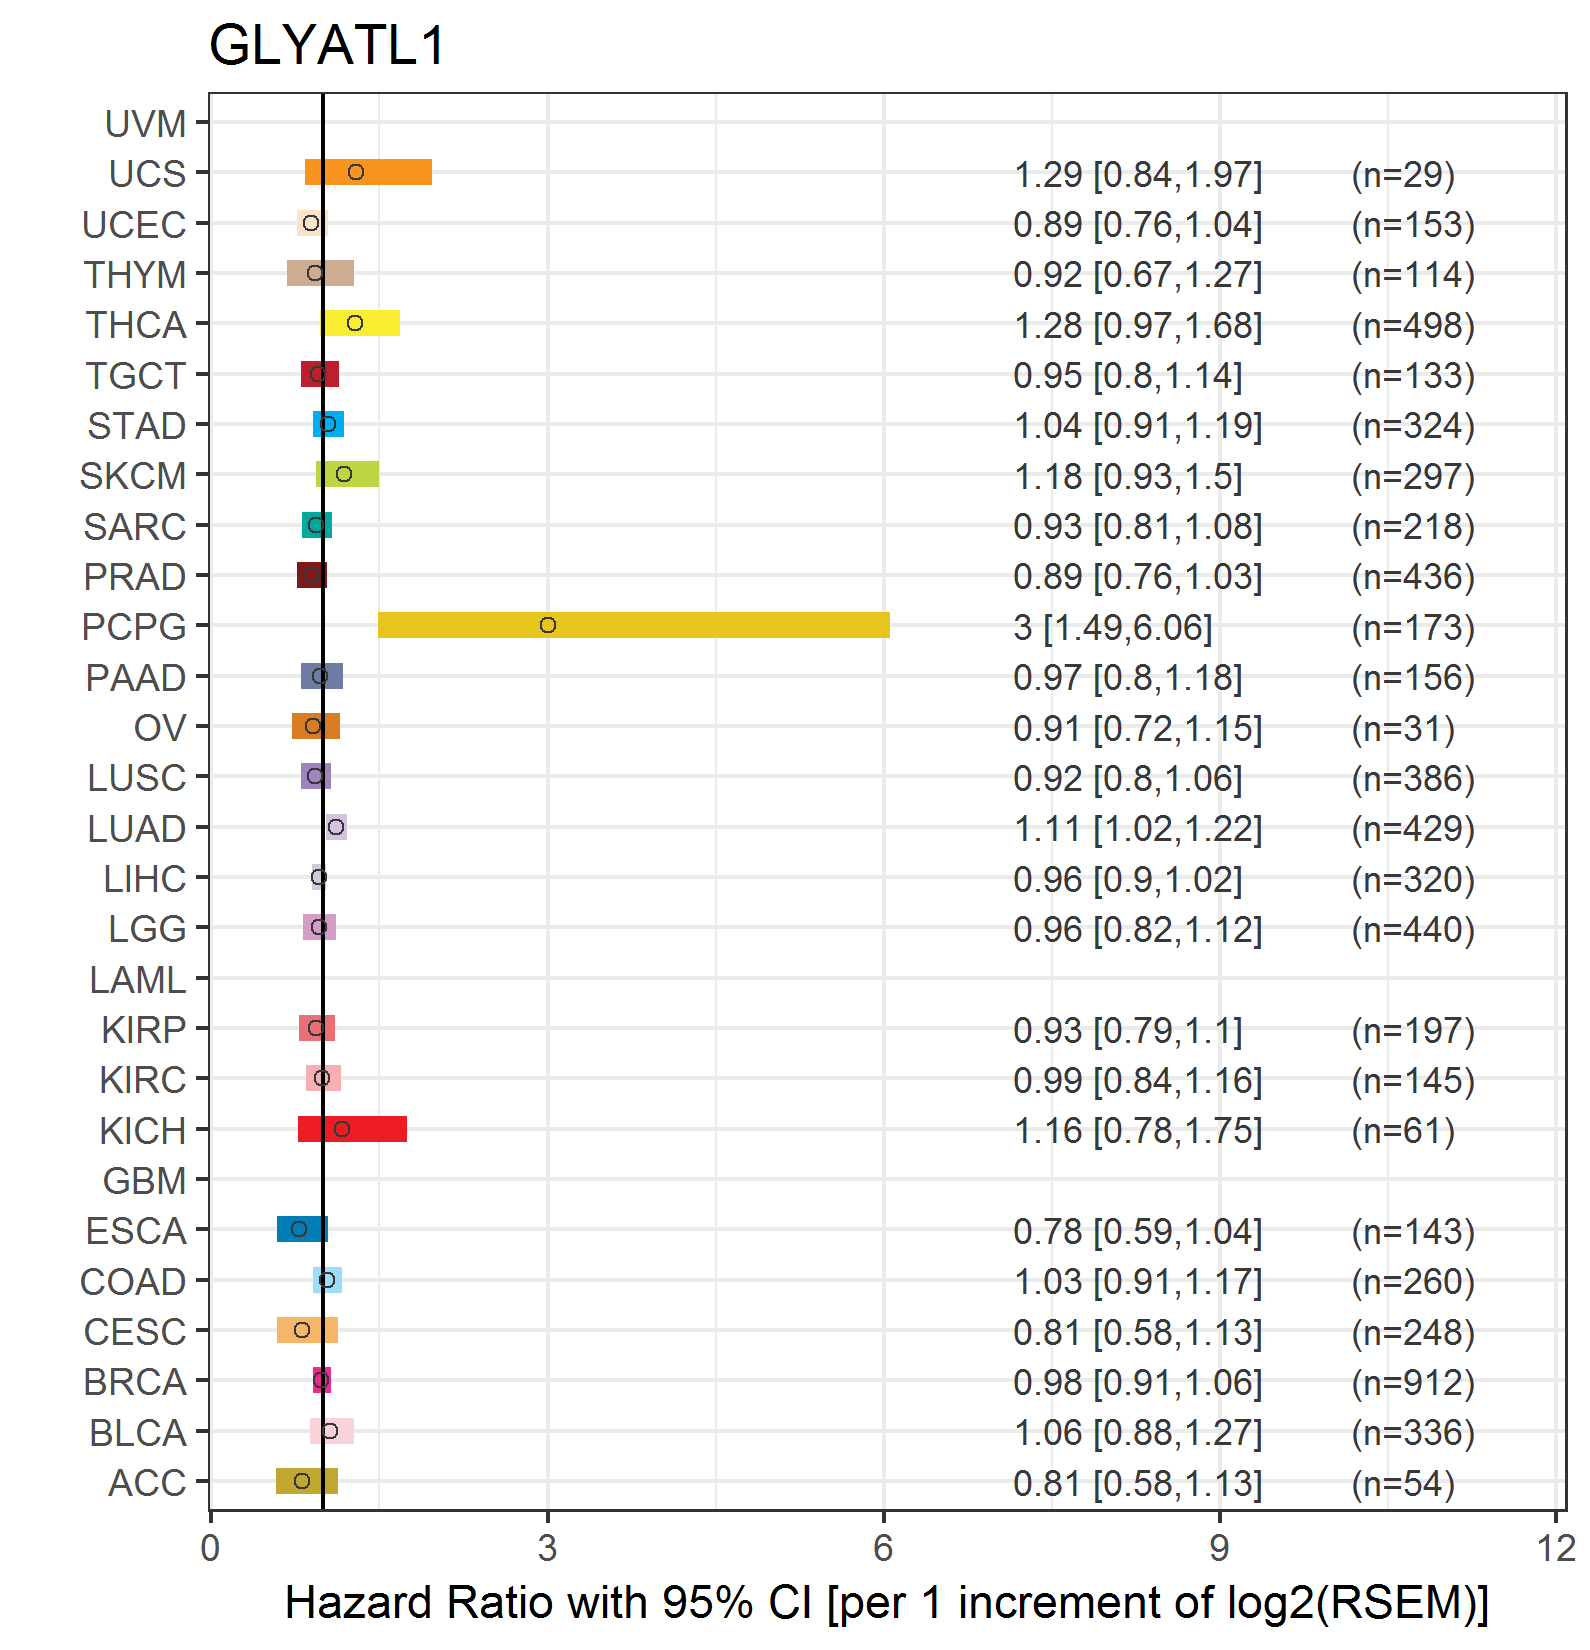
| Forest plot of Cox proportional hazard ratio (HR) and 95% CI of overall survival (OS) using 28 cancer types (TCGA IlluminaHiSeq_RNASeqV2, pan-cancer normalized log2(norm_counts+1) data, version 2016-08-16) (TCGA clinicalMatrix, phenotype data, version 2016-04-27) * Click on the image enlarge it in a new window. |
 |
| Forest plot of Cox proportional hazard ratio (HR) and 95% CI of relapse free survival (RFS) using 28 cancer types (TCGA IlluminaHiSeq_RNASeqV2, pan-cancer normalized log2(norm_counts+1) data, version 2016-08-16) (TCGA clinicalMatrix, phenotype data, version 2016-04-27) * Click on the image enlarge it in a new window. |
 |
| Top |
| TissGeneClin for GLYATL1 |
| TissGeneDrug for GLYATL1 |
| Drug information targeting TissGene (DrugBank Version 5.0.6, 2017-04-01) |
| DrugBank ID | Drug name | Drug activity | Drug type | Drug status |
| Top |
| TissGeneDisease for GLYATL1 |
| Disease information associated with TissGene (DisGeNet, 2016-06-01) |
| Disease ID | Disease name | # pubmeds | Source |
| umls:C0008073 | Developmental Disabilities | 1 | BeFree |
| umls:C0178874 | Tumor Progression | 1 | BeFree |
|
Copyright 2016-Present - The University of Texas Health Science Center at Houston (UTHealth) Web File Viewing | How to Report, Fraud, Waste and Abuse | State of Texas | Statewide Search | Texas Homeland Security | Site Policies |