 |
| |
| |
| |
| |
| |
| |
|

| TissGeneSummary for HAUS8 |
 Gene summary Gene summary |
| Basic gene information | Gene symbol | HAUS8 |
| Gene name | HAUS augmin-like complex, subunit 8 | |
| Synonyms | DGT4|HICE1|NY-SAR-48 | |
| Cytomap | UCSC genome browser: 19p13.11 | |
| Type of gene | protein-coding | |
| RefGenes | NM_001011699.1, NM_033417.1, | |
| Description | HAUS augmin-like complex subunit 8HEC1/NDC80 interacting, centrosome associated 1HEC1/NDC80-interacting centrosome-associated protein 1Hec1-interacting and centrosome-associated 1sarcoma antigen NY-SAR-48 | |
| Modification date | 20141207 | |
| dbXrefs | MIM : 613434 | |
| HGNC : HGNC | ||
| Ensembl : ENSG00000131351 | ||
| HPRD : 11318 | ||
| Vega : OTTHUMG00000182672 | ||
| Protein | UniProt: go to UniProt's Cross Reference DB Table | |
| Expression | CleanEX: HS_HAUS8 | |
| BioGPS: 93323 | ||
| Pathway | NCI Pathway Interaction Database: HAUS8 | |
| KEGG: HAUS8 | ||
| REACTOME: HAUS8 | ||
| Pathway Commons: HAUS8 | ||
| Context | iHOP: HAUS8 | |
| ligand binding site mutation search in PubMed: HAUS8 | ||
| UCL Cancer Institute: HAUS8 | ||
| Assigned class in TissGDB* | C | |
| Included tissue-specific gene expression resources | TiGER,GTEx | |
| Specific-tissues in normal samples (assigned by TissGDB using HPA, TiGER, and GTEx) | CervixTestis | |
| Cancer types related to the specific-tissues in cancer samples (assigned by TissGDB using TCGA) | CESCTGCT | |
| Reference showing the relevant tissue of HAUS8 | ||
| Description by TissGene annotations | Cancer gene Have significant anti-correlated miRNA TissgsLTS | |
| * Class A consists of genes with literature evidence and is part of the cTissGenes. Class B consists of only cTissGenes without additional evidence. The remaining genes belong to Class C. |
| Gene ontology having evidence of Inferred from Direct Assay (IDA) from Entrez |
| GO ID | GO term | PubMed ID |
| Top |
| TissGeneExp for HAUS8 |
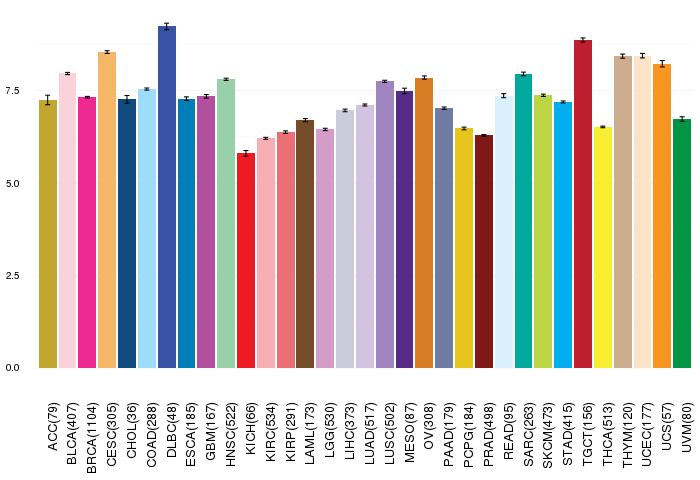
| Gene expressions across 28 cancer types (X-axis: cancer type and Y-axis: log2(norm_counts+1)) (TCGA IlluminaHiSeq_RNASeqV2, pan-cancer normalized log2(norm_counts+1) data, version 2016-08-16) |
 |
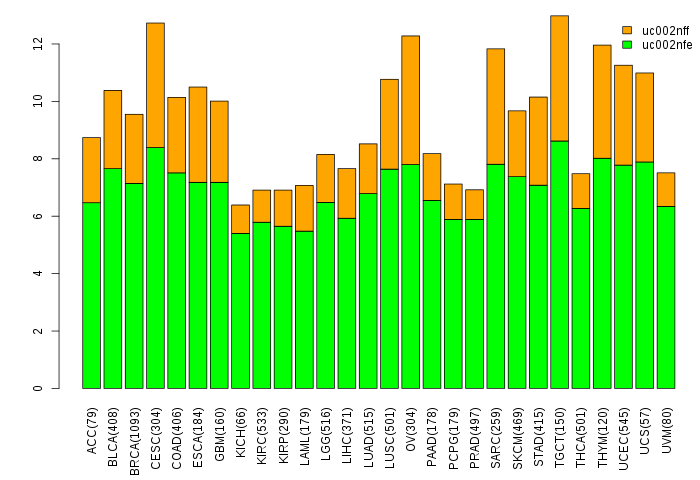
| Gene isoform expressions across 28 cancer types (X-axis: cancer type and Y-axis: log2(norm_counts+1)) (TCGA pan-cancer tcga_rsem_isoform_tpm, version 2016-09-01) |
 |
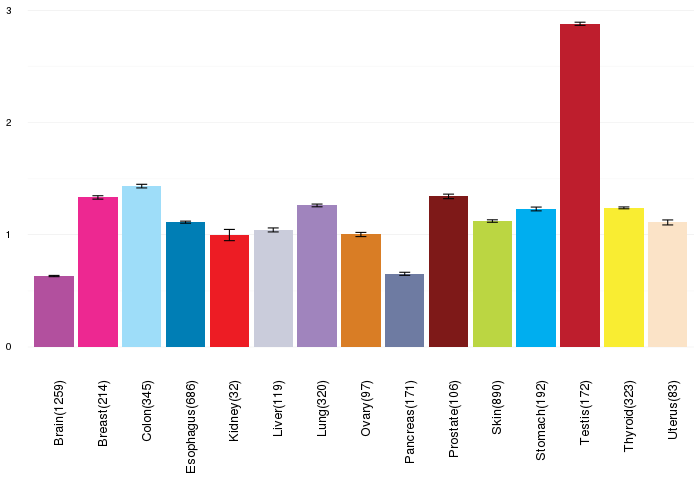
| Gene expressions across normal tissues of GTEx data (GTEx GTEx_Analysis_v6_RNA-seq_RNA-SeQCv1.1.8_gene_rpkm.gct) - Here, we shows the matched tissue types only among our 28 cancer types. |
 |
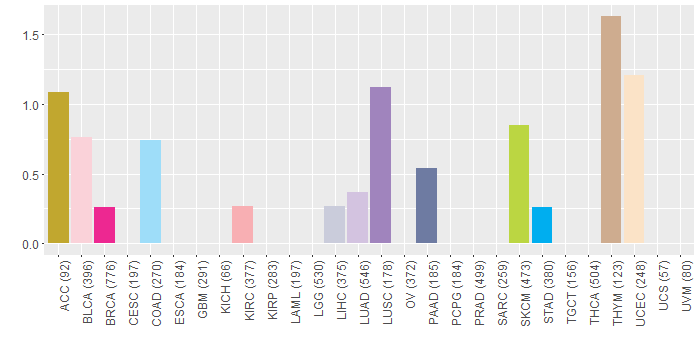
| Different expressions across 14 cancer types with more than 10 samples between matched tumors and normals (X-axis: cancer type and Y-axis: log2(norm_counts+1)) (TCGA IlluminaHiSeq_RNASeqV2, pan-cancer normalized log2(norm_counts+1) data, version 2016-08-16) |
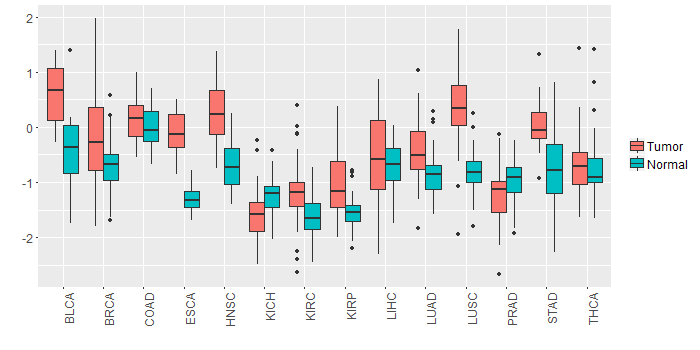 |
| - Significantly differentially expressed cancer types and information. (|Fold change|>1 and FDR<0.05) |
| Cancer type | Mean(exp) in tumor | Mean(exp) in matched normal | Log2FC | P-val. | FDR |
| LUSC | 0.343867902 | -0.813169353 | 1.157037255 | 1.23E-17 | 1.05E-16 |
| ESCA | -0.105455271 | -1.292200726 | 1.186745455 | 1.22E-06 | 0.000542656 |
| BLCA | 0.623636116 | -0.391084936 | 1.014721053 | 2.98E-05 | 0.000438909 |
| Top |
| TissGene-miRNA for HAUS8 |
| Significantly anti-correlated miRNAs of TissGene across 28 cancer types (Gene-miRNA relations from TargetScanHuman Relsease 7.1, Conserved_Site_Context_Scores.txt.zip, 06.01.2016) (TCGA IlluminaHiSeq_miRNASeq, log2(RPM+1) data, version 2016-11-21) (TCGA IlluminaHiSeq_RNASeqV2, log2(normalized_count+1) data, version 2016-08-16) (Spearman’s Rank Correlation (p-value<0.05 and coefficient<-0.25)) |
| Cancer type | miRNA id | miRNA accession | P-val. | Coeff. | # samples |
| ACC | hsa-miR-520c-3p | MIMAT0002846 | 0.0083 | -0.3 | 78 |
| ACC | hsa-miR-20b-5p | MIMAT0001413 | 0.0078 | -0.3 | 78 |
| ACC | hsa-miR-520c-3p | MIMAT0002846 | 0.0083 | -0.3 | 78 |
| ACC | hsa-miR-20b-5p | MIMAT0001413 | 0.0078 | -0.3 | 78 |
| UCS | hsa-miR-106b-5p | MIMAT0000680 | 0.013 | -0.33 | 56 |
| UCS | hsa-miR-93-5p | MIMAT0000093 | 0.012 | -0.34 | 56 |
| Top |
| TissGeneMut for HAUS8 |
| TissGeneSNV for HAUS8 |
| nsSNV counts per each loci. Different colors of circles represent different cancer types. Circle size denotes number of samples. (TCGA somatic mutation (SNPs and small INDELs) data, version 2016-04-25) * Click on the image to enlarge it in a new window. |
 |
| Somatic nucleotide variants of TissGene across 28 cancer types (X-axis: cancer type and Y-axis: % of mutated samples) The numbers in parentheses are numbers of samples with mutation (nsSNVs). (TCGA somatic mutation (SNPs and small INDELs) data, version 2016-04-25) |
 |
| - nsSNVs sorted by frequency. |
| AAchange | Cancer type | # samples |
| p.M62L | PAAD | 1 |
| p.L72P | UCEC | 1 |
| p.S63L | HNSC | 1 |
| p.S124L | HNSC | 1 |
| p.R309Q | HNSC | 1 |
| p.E278* | UCEC | 1 |
| p.S306F | SKCM | 1 |
| p.A131V | SKCM | 1 |
| p.P371L | COAD | 1 |
| p.A113S | BLCA | 1 |
| p.P160H | THYM | 1 |
| p.K187T | KIRC | 1 |
| p.K126T | KIRC | 1 |
| p.E184D | BRCA | 1 |
| p.P221H | THYM | 1 |
| p.R248Q | HNSC | 1 |
| p.P56Q | LUAD | 1 |
| p.S63* | BLCA | 1 |
| p.P51S | HNSC | 1 |
| p.Q331E | LIHC | 1 |
| p.R38Q | STAD | 1 |
| p.K49N | ACC | 1 |
| p.L104I | UCEC | 1 |
| p.S5L | SKCM | 1 |
| p.S111R | THYM | 1 |
| p.K110N | ACC | 1 |
| p.P117Q | LUAD | 1 |
| p.E295K | READ | 1 |
| p.E295K | BLCA | 1 |
| p.Q270E | LIHC | 1 |
| p.L159V | BRCA | 1 |
| p.T61A | LUAD | 1 |
| p.G82R | COAD | 1 |
| p.Q215* | LUSC | 1 |
| p.R248L | SKCM | 1 |
| p.K109N | ACC | 1 |
| p.Q289H | LUSC | 1 |
| Top |
| TissGeneCNV for HAUS8 |
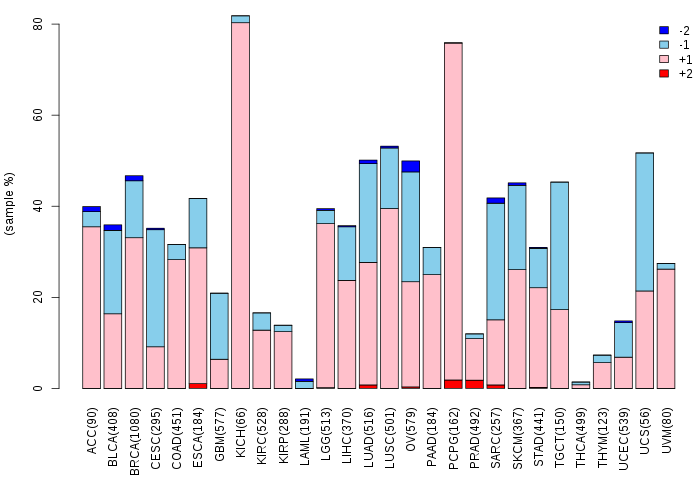
| Copy number variations of TissGene across 28 cancer types (X-axis: cancer type and Y-axis: % of CNV samples) (TCGA Gistic2_CopyNumber_Gistic2_all_data_by_genes, Gistic2 copy number data, version 2016-08-16) |
 |
| Top |
| TissGeneFusions for HAUS8 |
| Fusion genes including TissGene (ChimerDB 3.0, 2016-12-01 and TCGA fusion Portal 2015-12-01) |
| Database | Src | Cancer type | Sample | Fusion gene | ORF | 5'-gene BP | 3'-gene BP |
| Chimerdb3.0 | ChiTaRs | NA | BQ318601 | HAUS8-FAF1 | chr19:17170420 | chr1:51406327 | |
| TCGAfusionPortal | PRADA | BRCA | TCGA-EW-A2FR-01A | HAUS8-C19orf57 | In-frame | Chr19:17170367 | Chr19:14001275 |
| TCGAfusionPortal | PRADA | PRAD | TCGA-YL-A8HL-01A | HAUS8-SGTA | Out-of-frame | Chr19:17184084 | Chr19:2759292 |
| Top |
| TissGeneNet for HAUS8 |
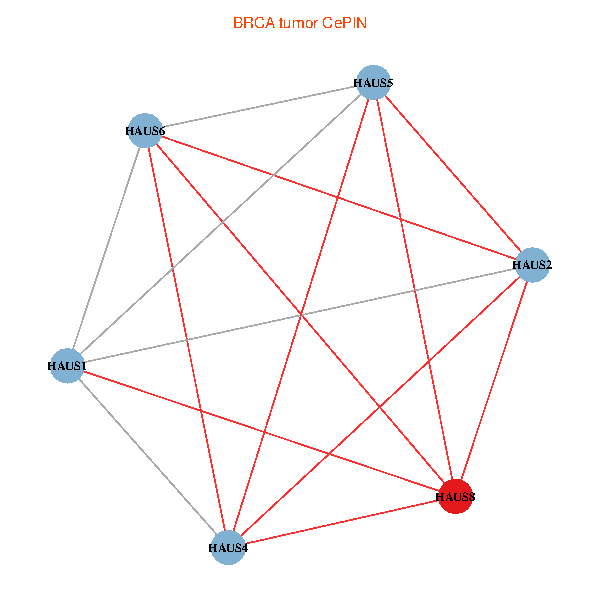
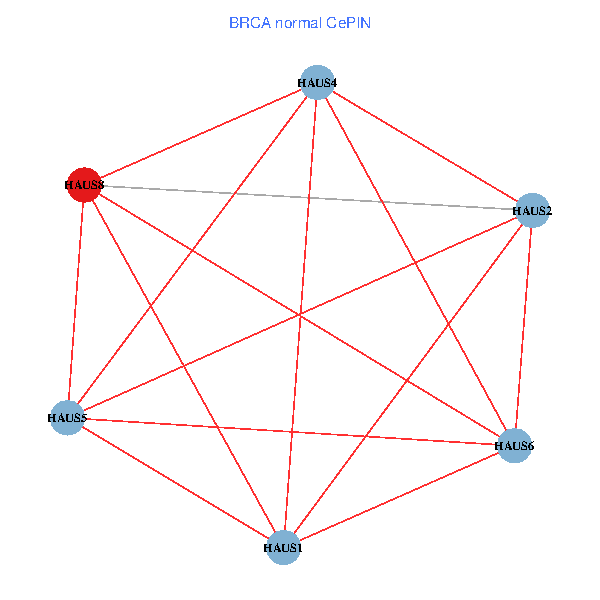
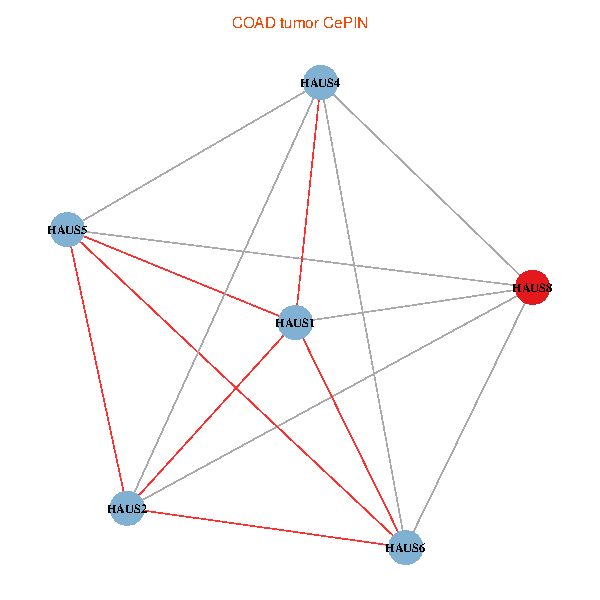
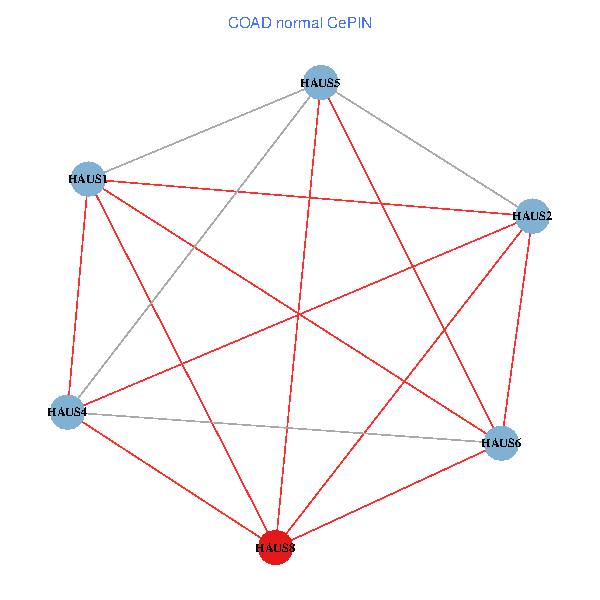
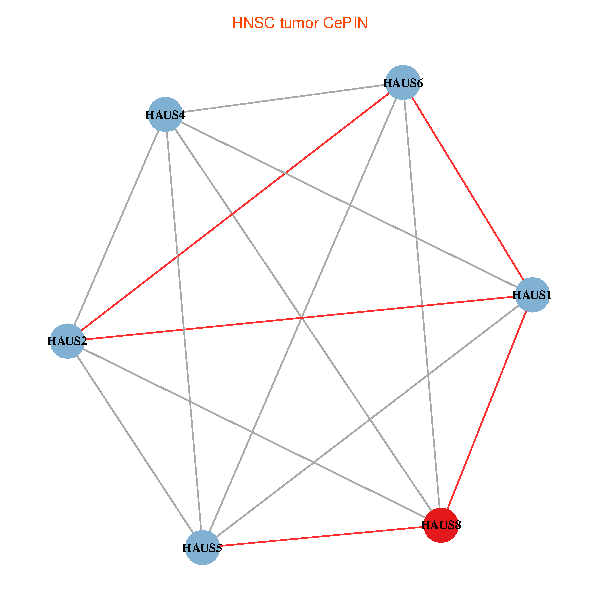
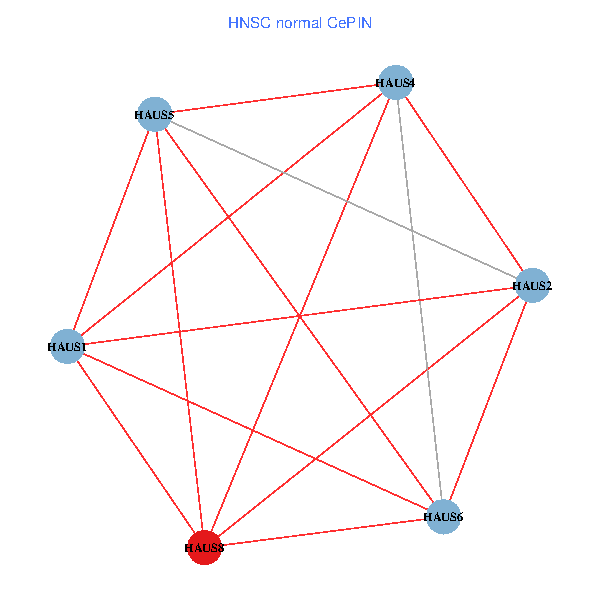
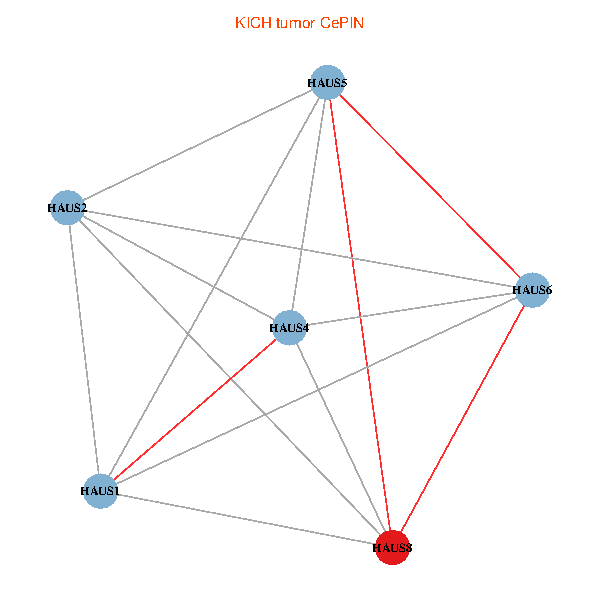
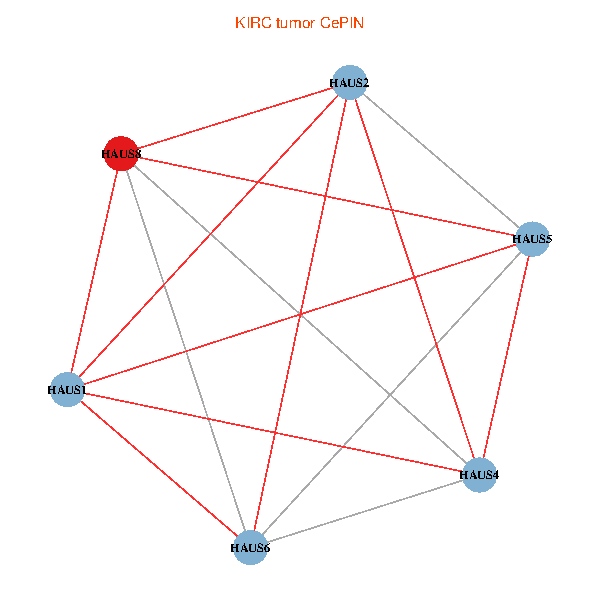
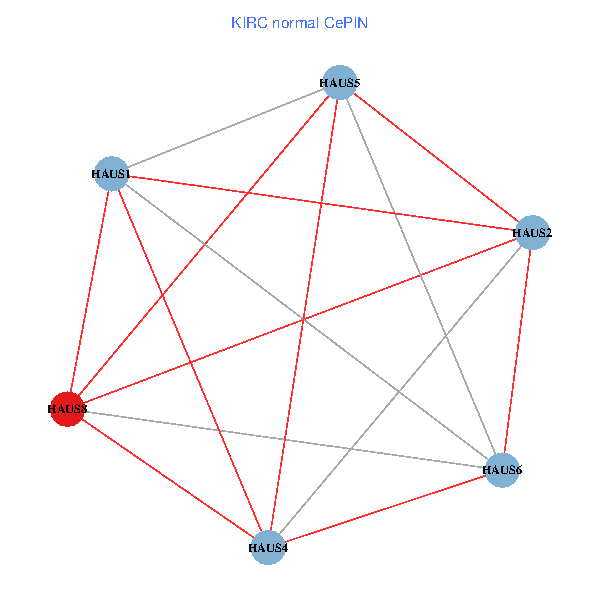
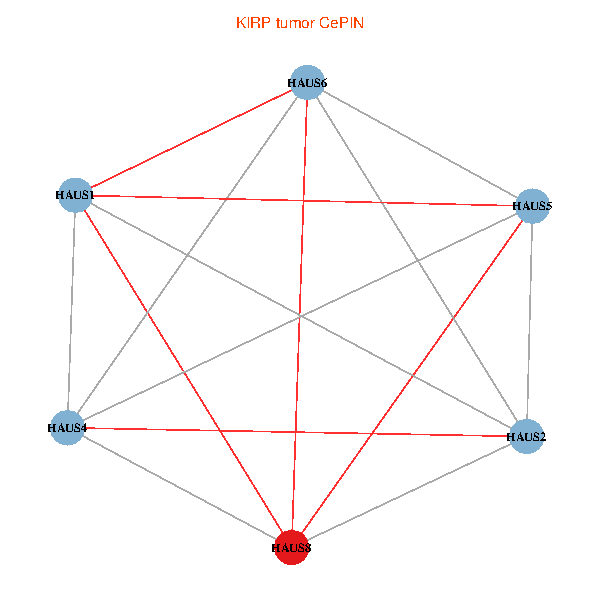
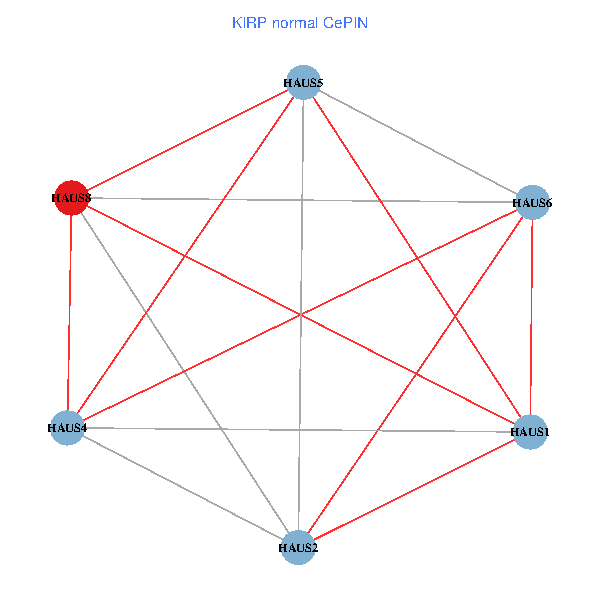
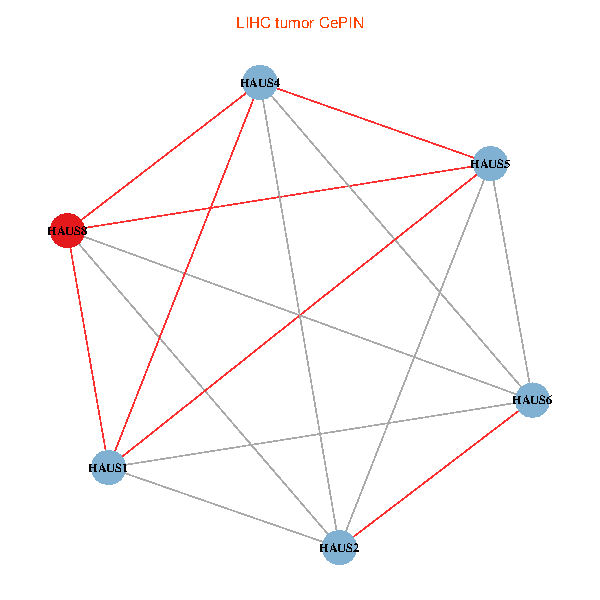
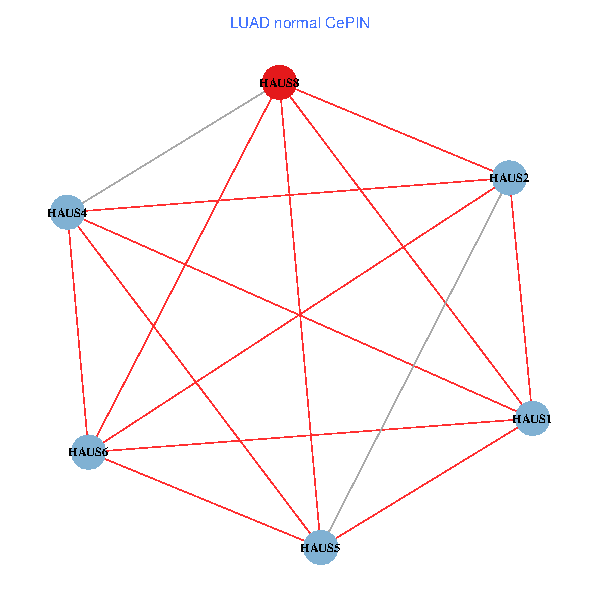
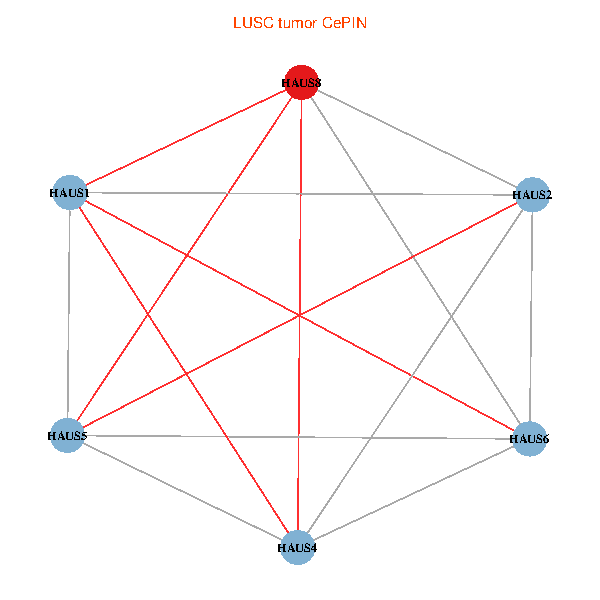
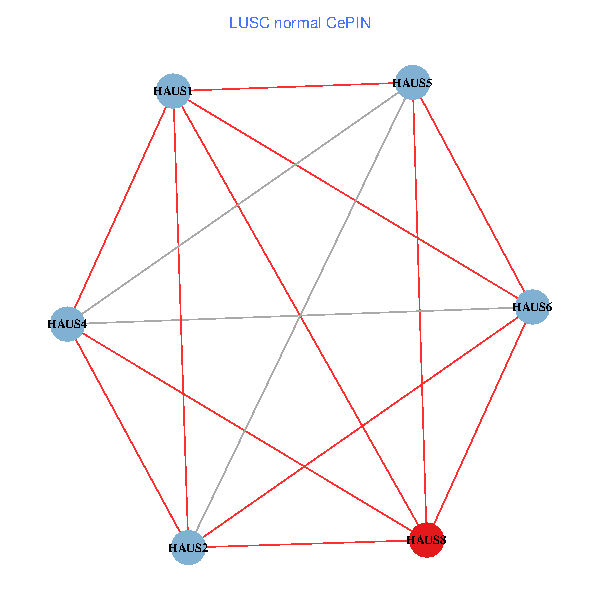
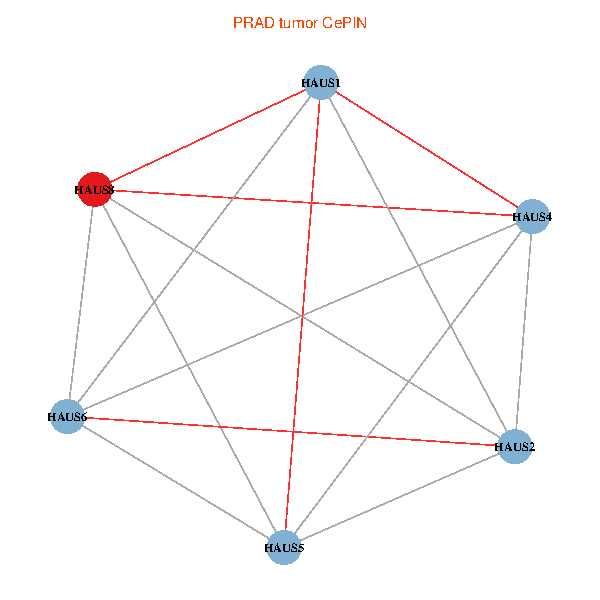
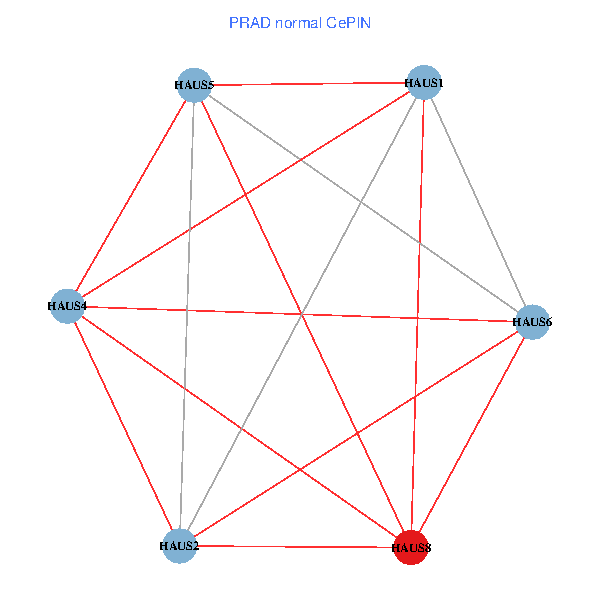
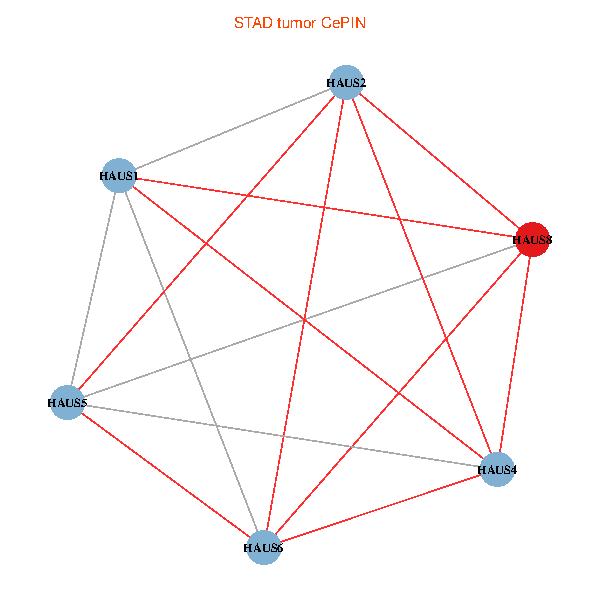
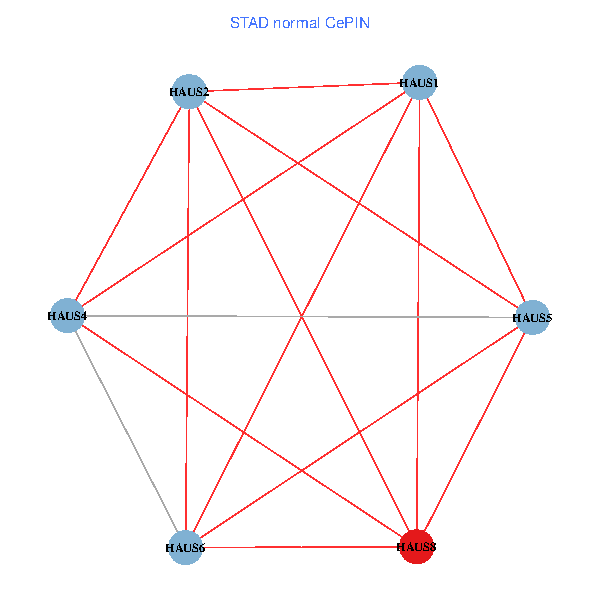
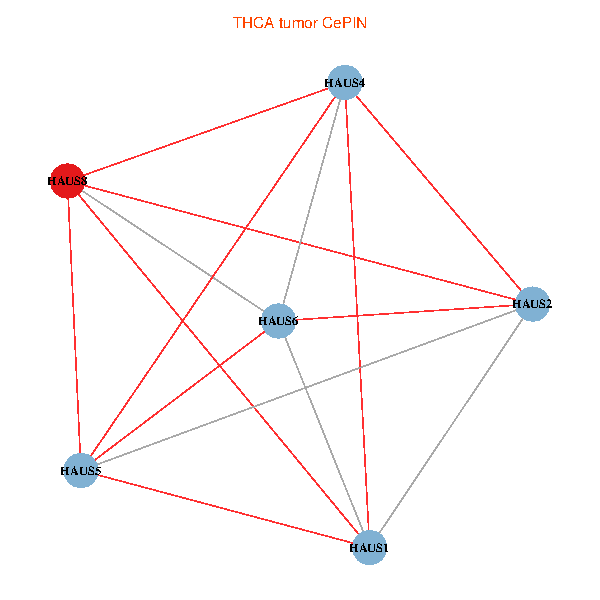
| Co-expressed gene networks based on protein-protein interaction data (CePIN) (TCGA IlluminaHiSeq_RNASeqV2, pan-cancer normalized log2(norm_counts+1) data, version 2016-08-16) (PINA2 ppi data) |
| BRCA (tumor) | BRCA (normal) |
| HAUS8, HAUS6, HAUS1, HAUS2, HAUS4, HAUS5 (tumor) | HAUS8, HAUS6, HAUS1, HAUS2, HAUS4, HAUS5 (normal) |
 |  |
| COAD (tumor) | COAD (normal) |
| HAUS8, HAUS6, HAUS1, HAUS2, HAUS4, HAUS5 (tumor) | HAUS8, HAUS6, HAUS1, HAUS2, HAUS4, HAUS5 (normal) |
 |  |
| HNSC (tumor) | HNSC (normal) |
| HAUS8, HAUS6, HAUS1, HAUS2, HAUS4, HAUS5 (tumor) | HAUS8, HAUS6, HAUS1, HAUS2, HAUS4, HAUS5 (normal) |
 |  |
| KICH (tumor) | KICH (normal) |
| HAUS8, HAUS6, HAUS1, HAUS2, HAUS4, HAUS5 (tumor) | HAUS8, HAUS6, HAUS1, HAUS2, HAUS4, HAUS5 (normal) |
 |  |
| KIRC (tumor) | KIRC (normal) |
| HAUS8, HAUS6, HAUS1, HAUS2, HAUS4, HAUS5 (tumor) | HAUS8, HAUS6, HAUS1, HAUS2, HAUS4, HAUS5 (normal) |
 |  |
| KIRP (tumor) | KIRP (normal) |
| HAUS8, HAUS6, HAUS1, HAUS2, HAUS4, HAUS5 (tumor) | HAUS8, HAUS6, HAUS1, HAUS2, HAUS4, HAUS5 (normal) |
 |  |
| LIHC (tumor) | LIHC (normal) |
| HAUS8, HAUS6, HAUS1, HAUS2, HAUS4, HAUS5 (tumor) | HAUS8, HAUS6, HAUS1, HAUS2, HAUS4, HAUS5 (normal) |
 |  |
| LUAD (tumor) | LUAD (normal) |
| HAUS8, HAUS6, HAUS1, HAUS2, HAUS4, HAUS5 (tumor) | HAUS8, HAUS6, HAUS1, HAUS2, HAUS4, HAUS5 (normal) |
 |  |
| LUSC (tumor) | LUSC (normal) |
| HAUS8, HAUS6, HAUS1, HAUS2, HAUS4, HAUS5 (tumor) | HAUS8, HAUS6, HAUS1, HAUS2, HAUS4, HAUS5 (normal) |
 |  |
| PRAD (tumor) | PRAD (normal) |
| HAUS8, HAUS6, HAUS1, HAUS2, HAUS4, HAUS5 (tumor) | HAUS8, HAUS6, HAUS1, HAUS2, HAUS4, HAUS5 (normal) |
 |  |
| STAD (tumor) | STAD (normal) |
| HAUS8, HAUS6, HAUS1, HAUS2, HAUS4, HAUS5 (tumor) | HAUS8, HAUS6, HAUS1, HAUS2, HAUS4, HAUS5 (normal) |
 |  |
| THCA (tumor) | THCA (normal) |
| HAUS8, HAUS6, HAUS1, HAUS2, HAUS4, HAUS5 (tumor) | HAUS8, HAUS6, HAUS1, HAUS2, HAUS4, HAUS5 (normal) |
 |  |
| Top |
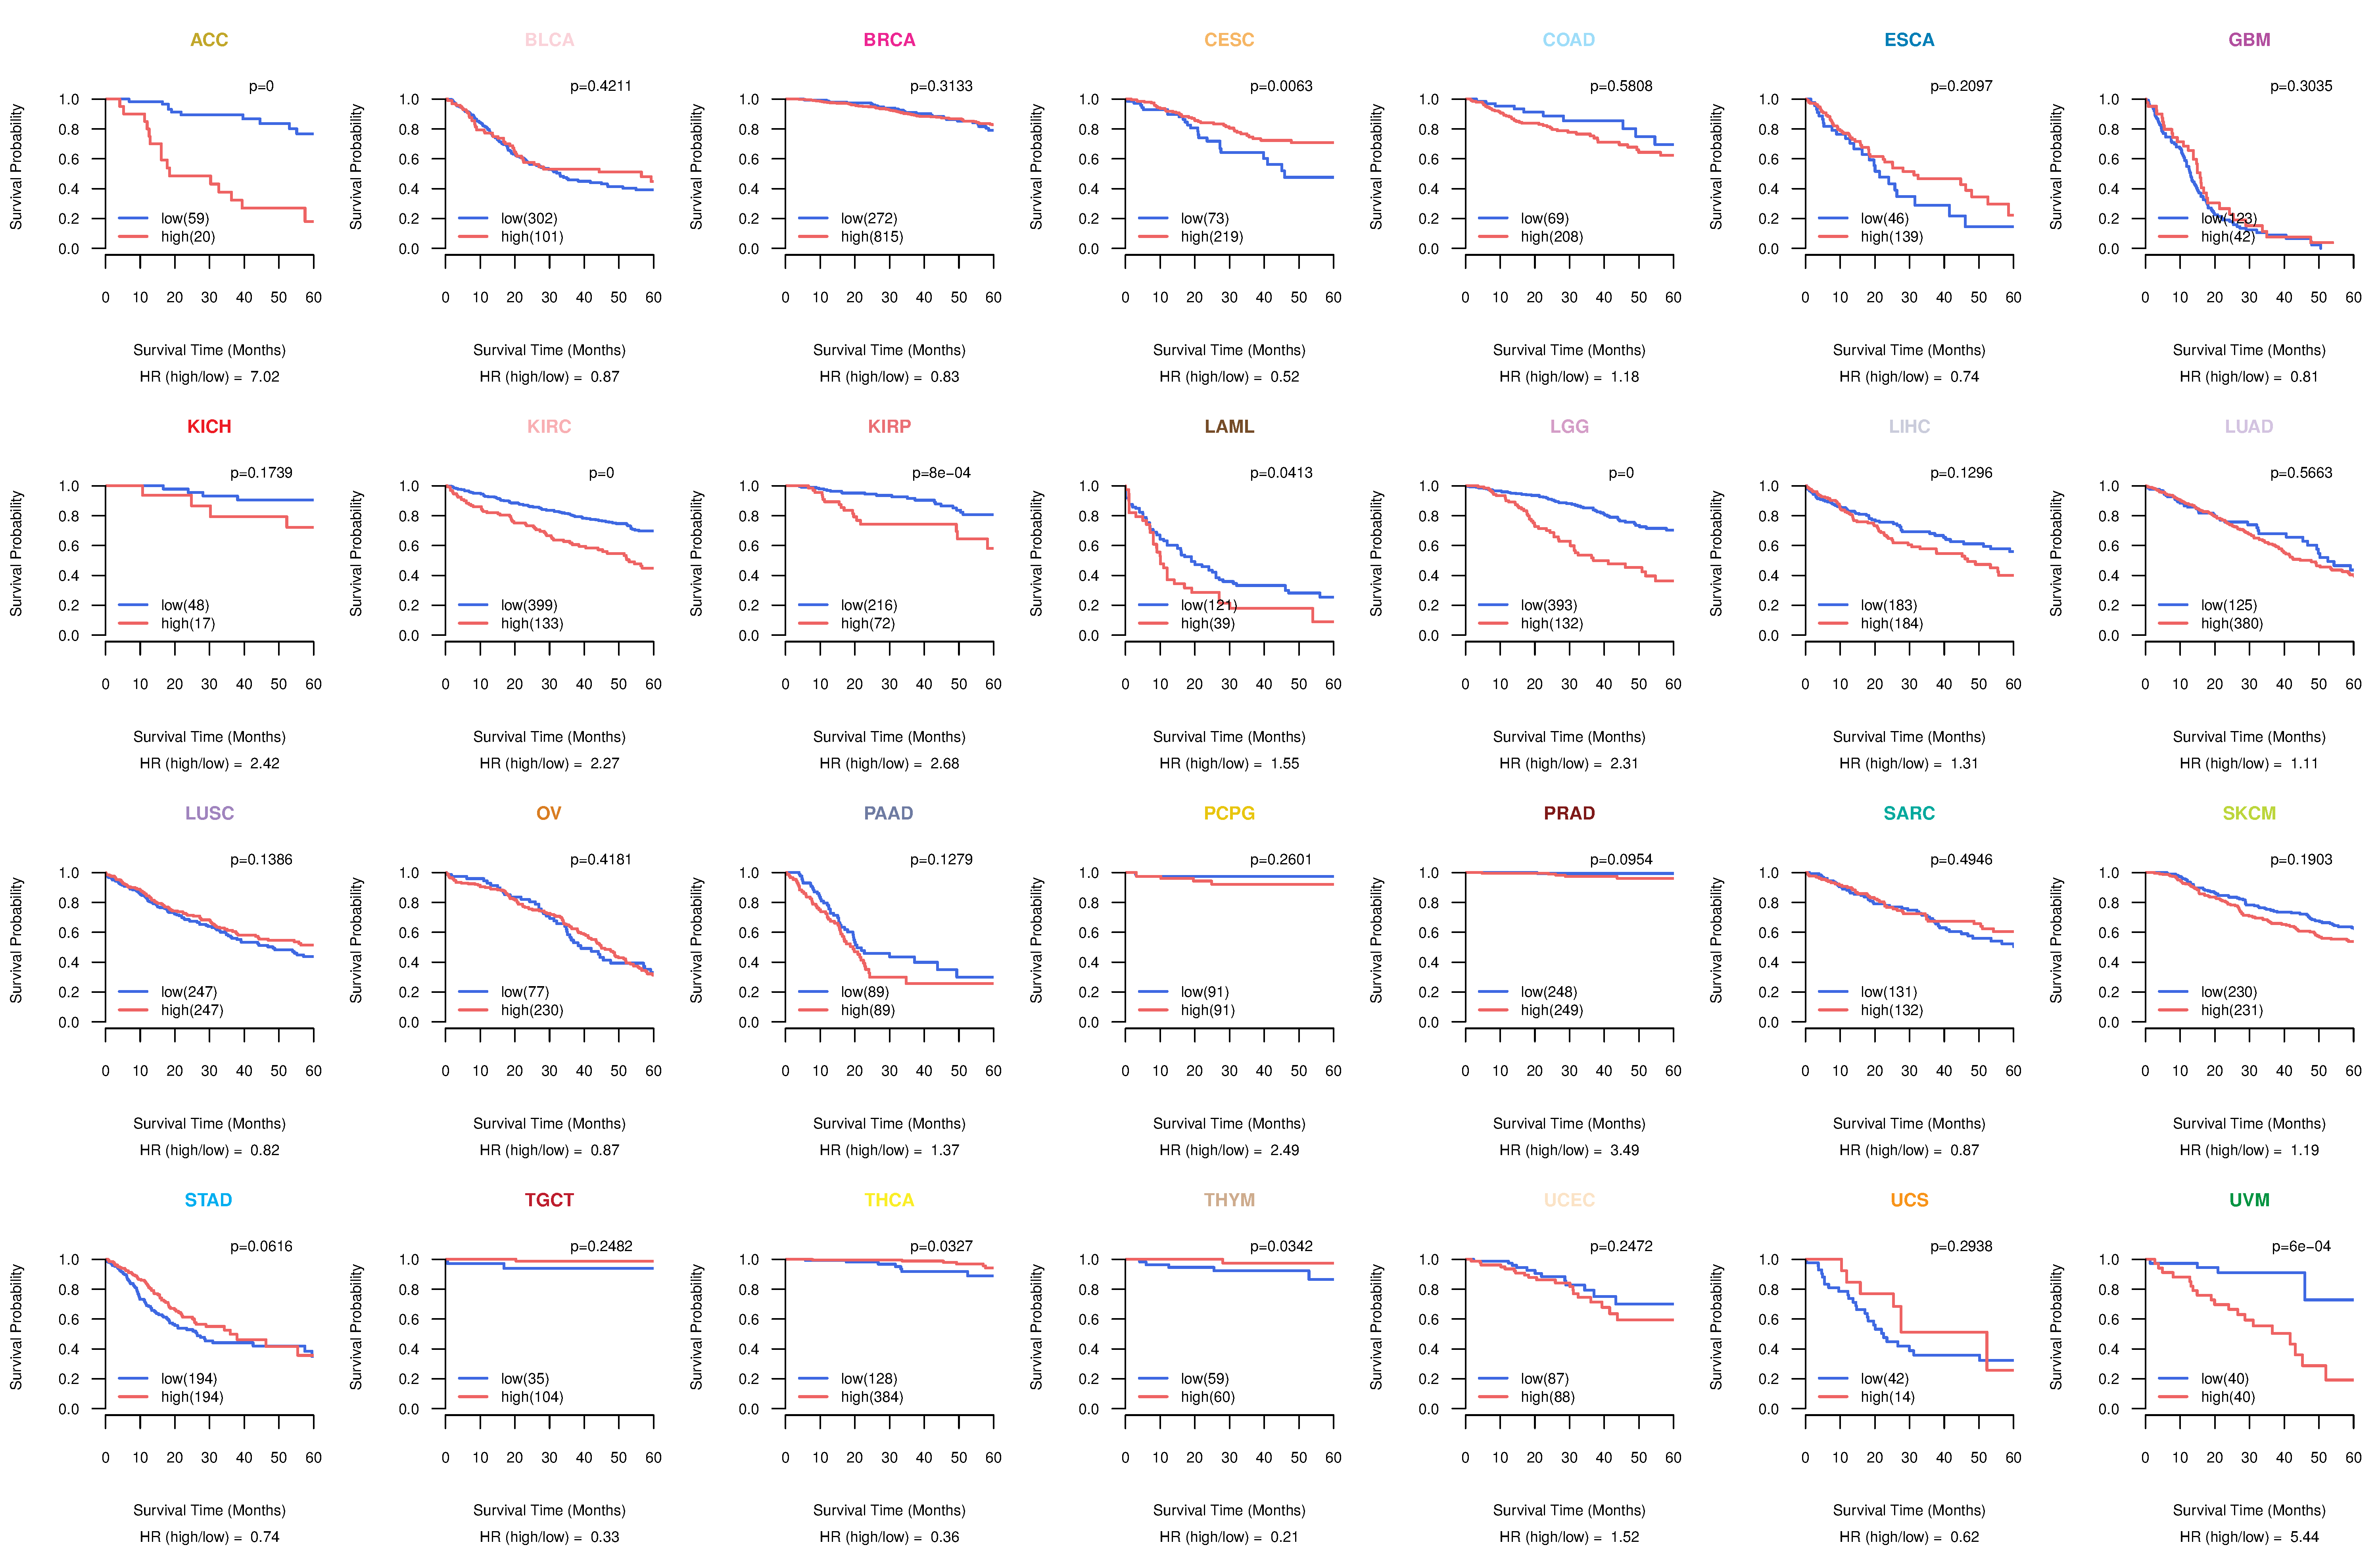
| TissGeneProg for HAUS8 |
| Kaplan-Meier plots with logrank tests of overall survival (OS) using 28 cancer types (TCGA IlluminaHiSeq_RNASeqV2, pan-cancer normalized log2(norm_counts+1) data, version 2016-08-16) (TCGA clinicalMatrix, phenotype data, version 2016-04-27) * Click on the image to enlarge it in a new window. |
 |
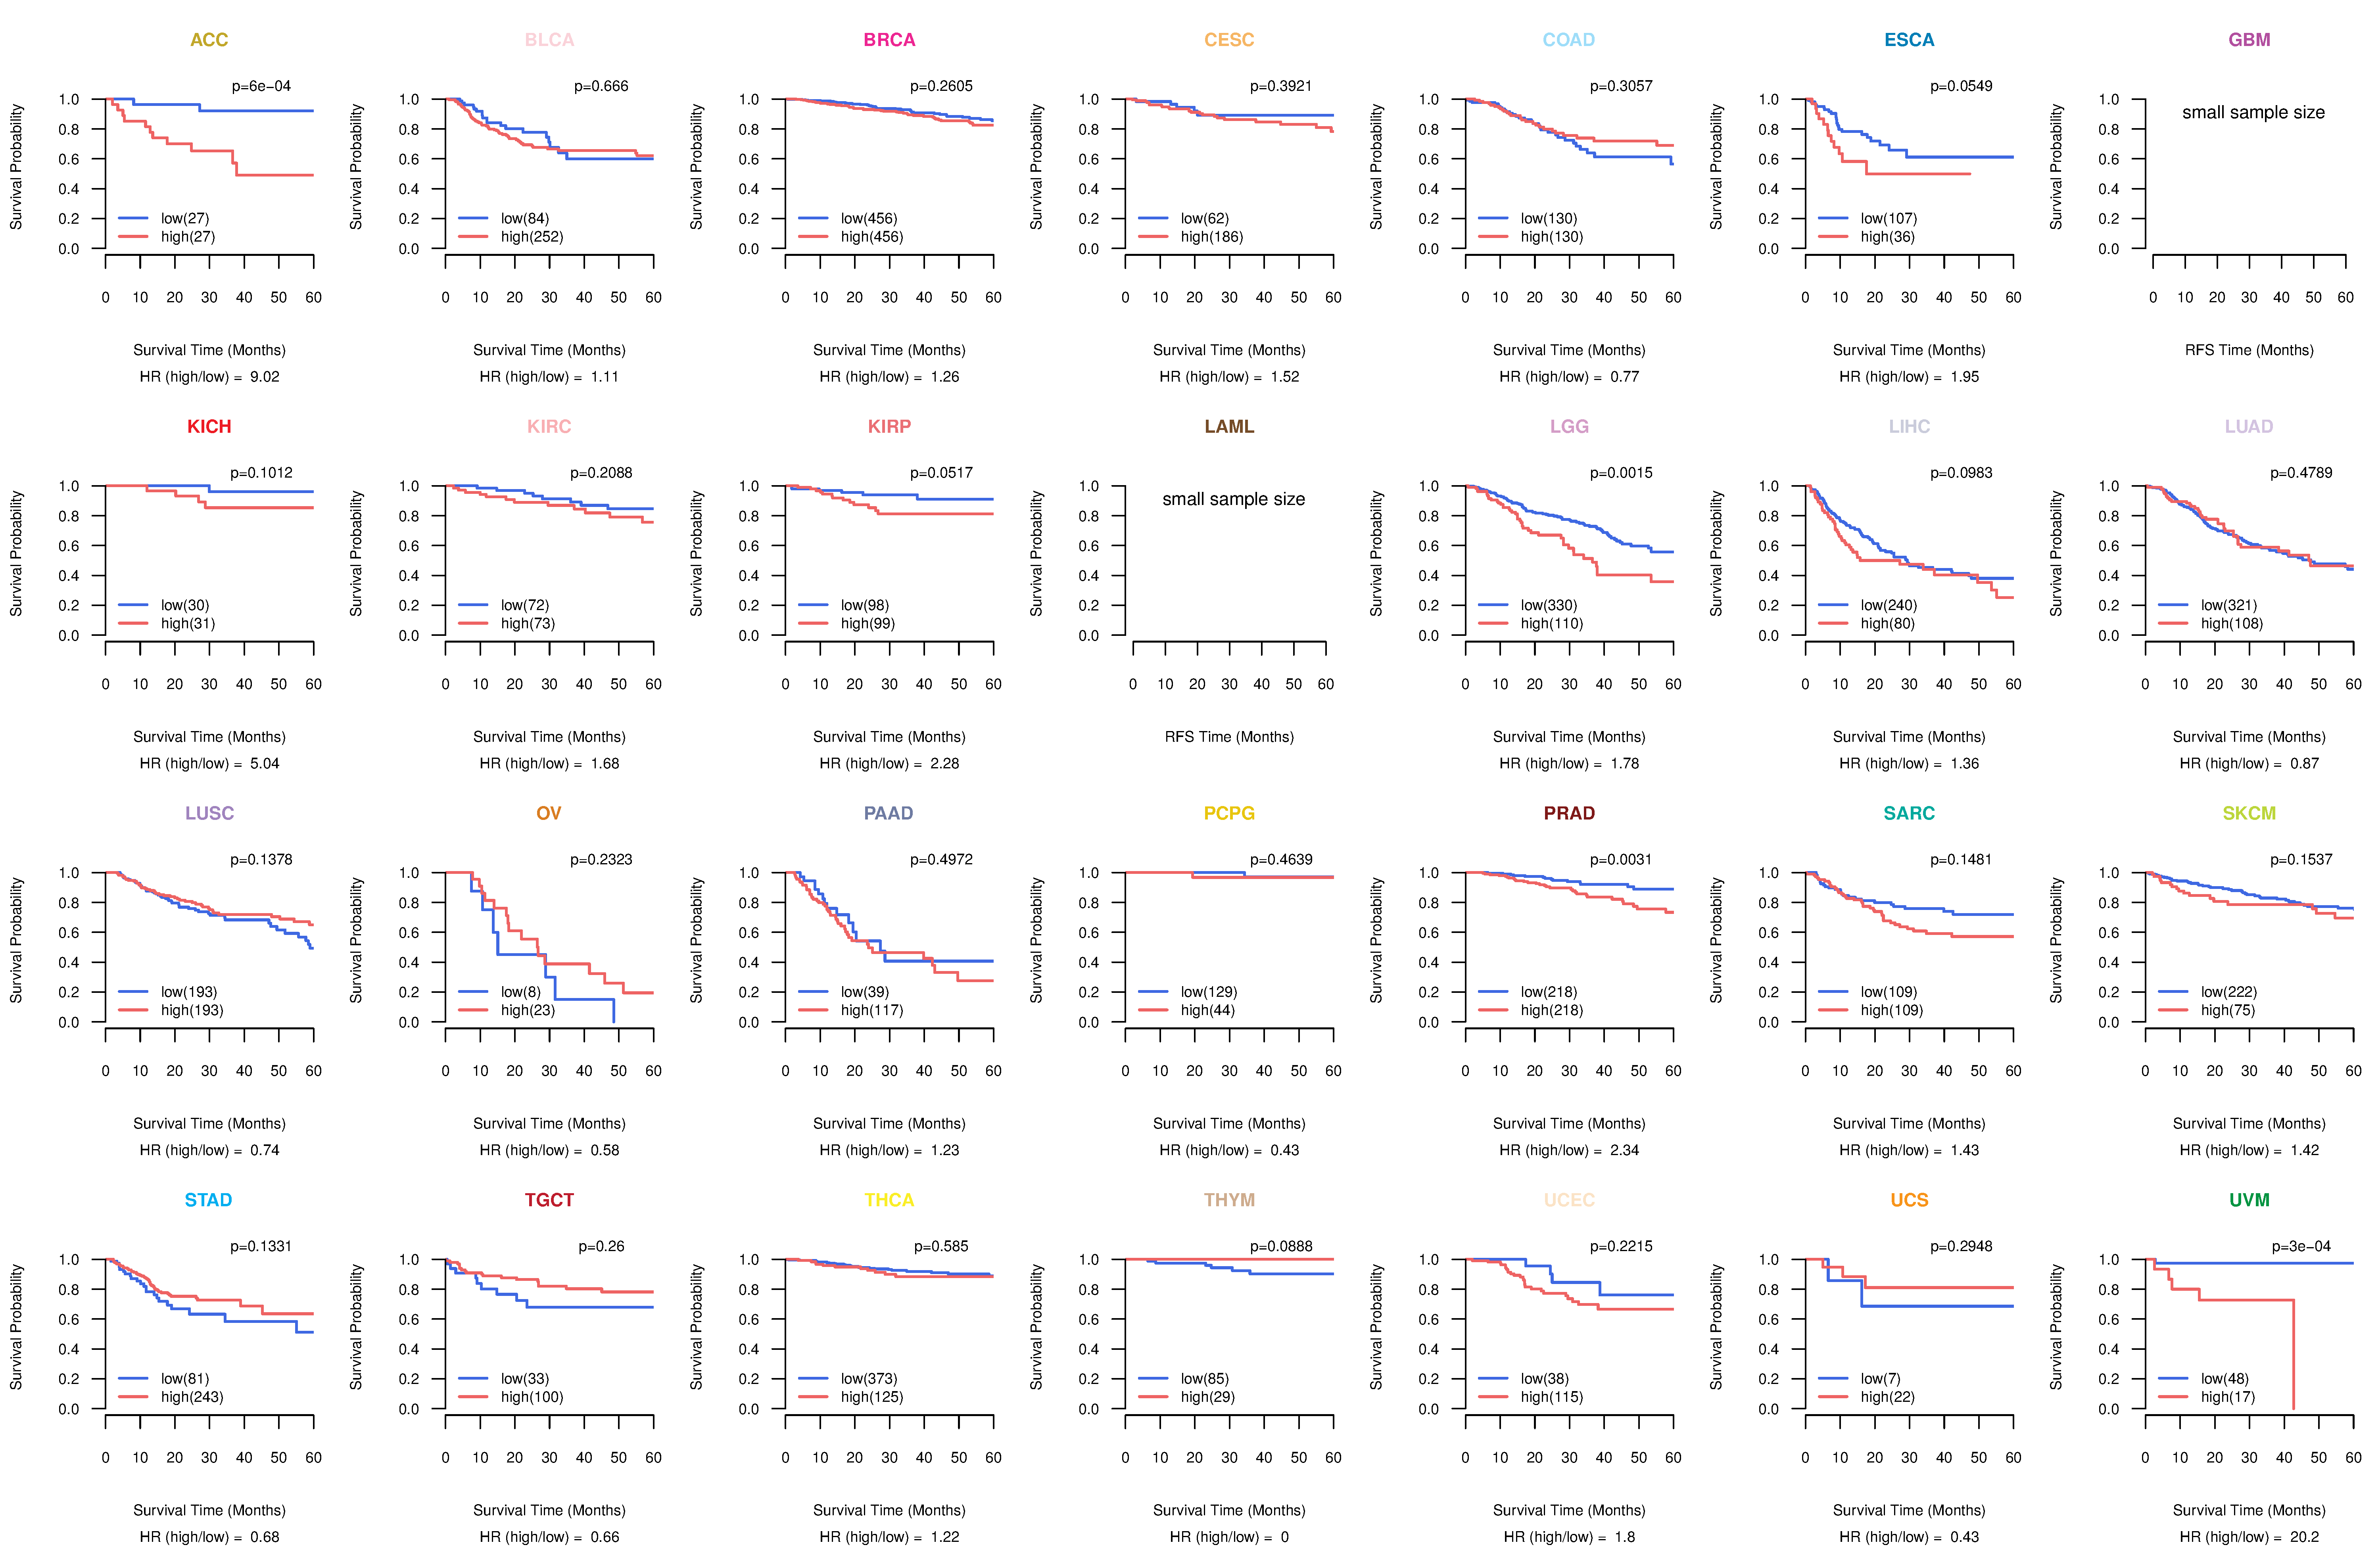
| Kaplan-Meier plots with logrank test of relapse free survival (RFS) using 28 cancer types (TCGA IlluminaHiSeq_RNASeqV2, pan-cancer normalized log2(norm_counts+1) data, version 2016-08-16) (TCGA clinicalMatrix, phenotype data, version 2016-04-27) * Click on the image enlarge it in a new window. |
 |
| Forest plot of Cox proportional hazard ratio (HR) and 95% CI of overall survival (OS) using 28 cancer types (TCGA IlluminaHiSeq_RNASeqV2, pan-cancer normalized log2(norm_counts+1) data, version 2016-08-16) (TCGA clinicalMatrix, phenotype data, version 2016-04-27) * Click on the image enlarge it in a new window. |
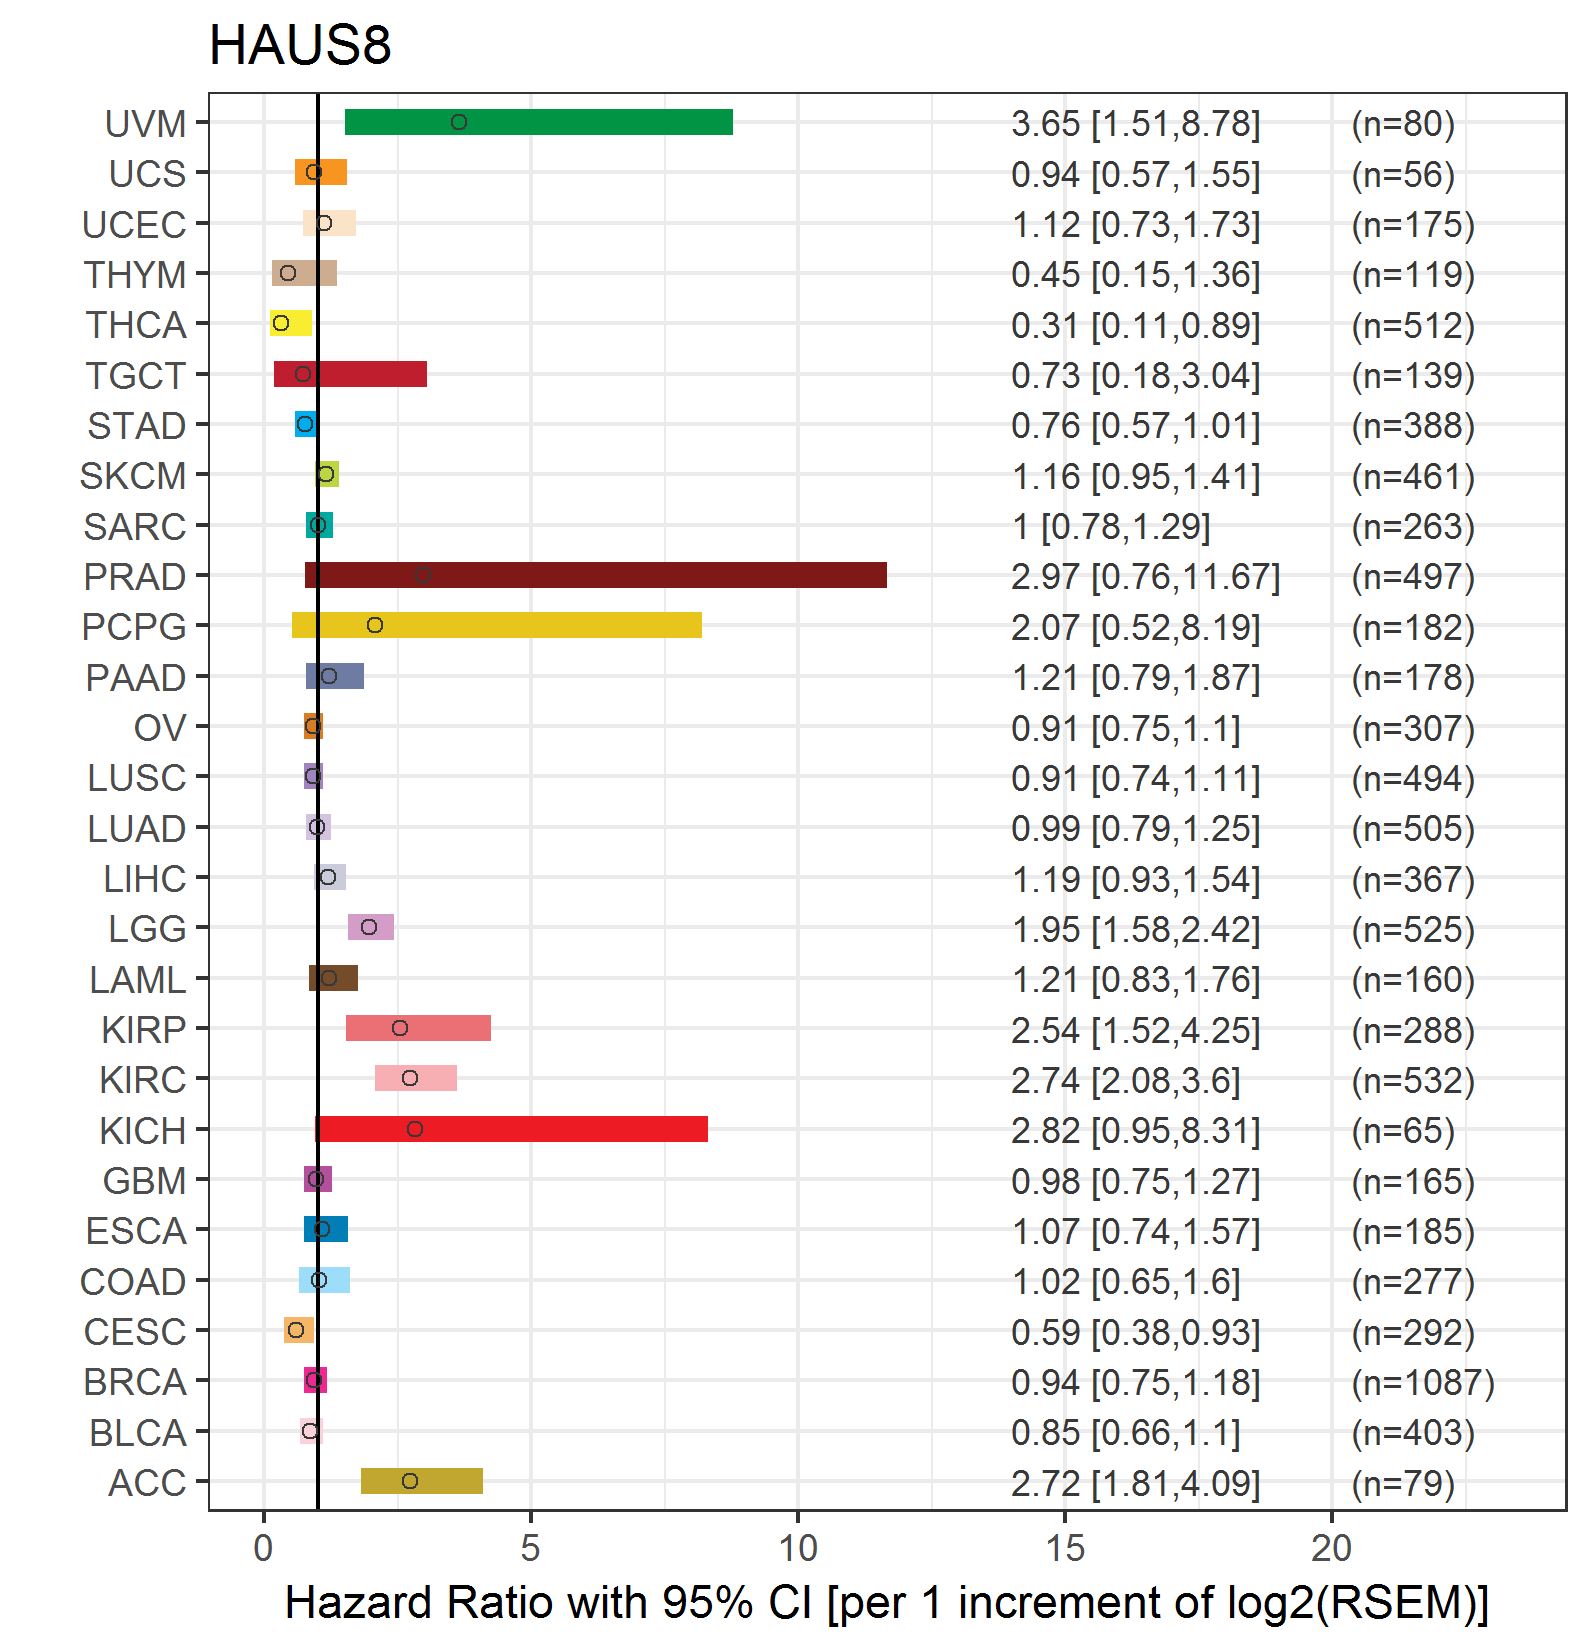 |
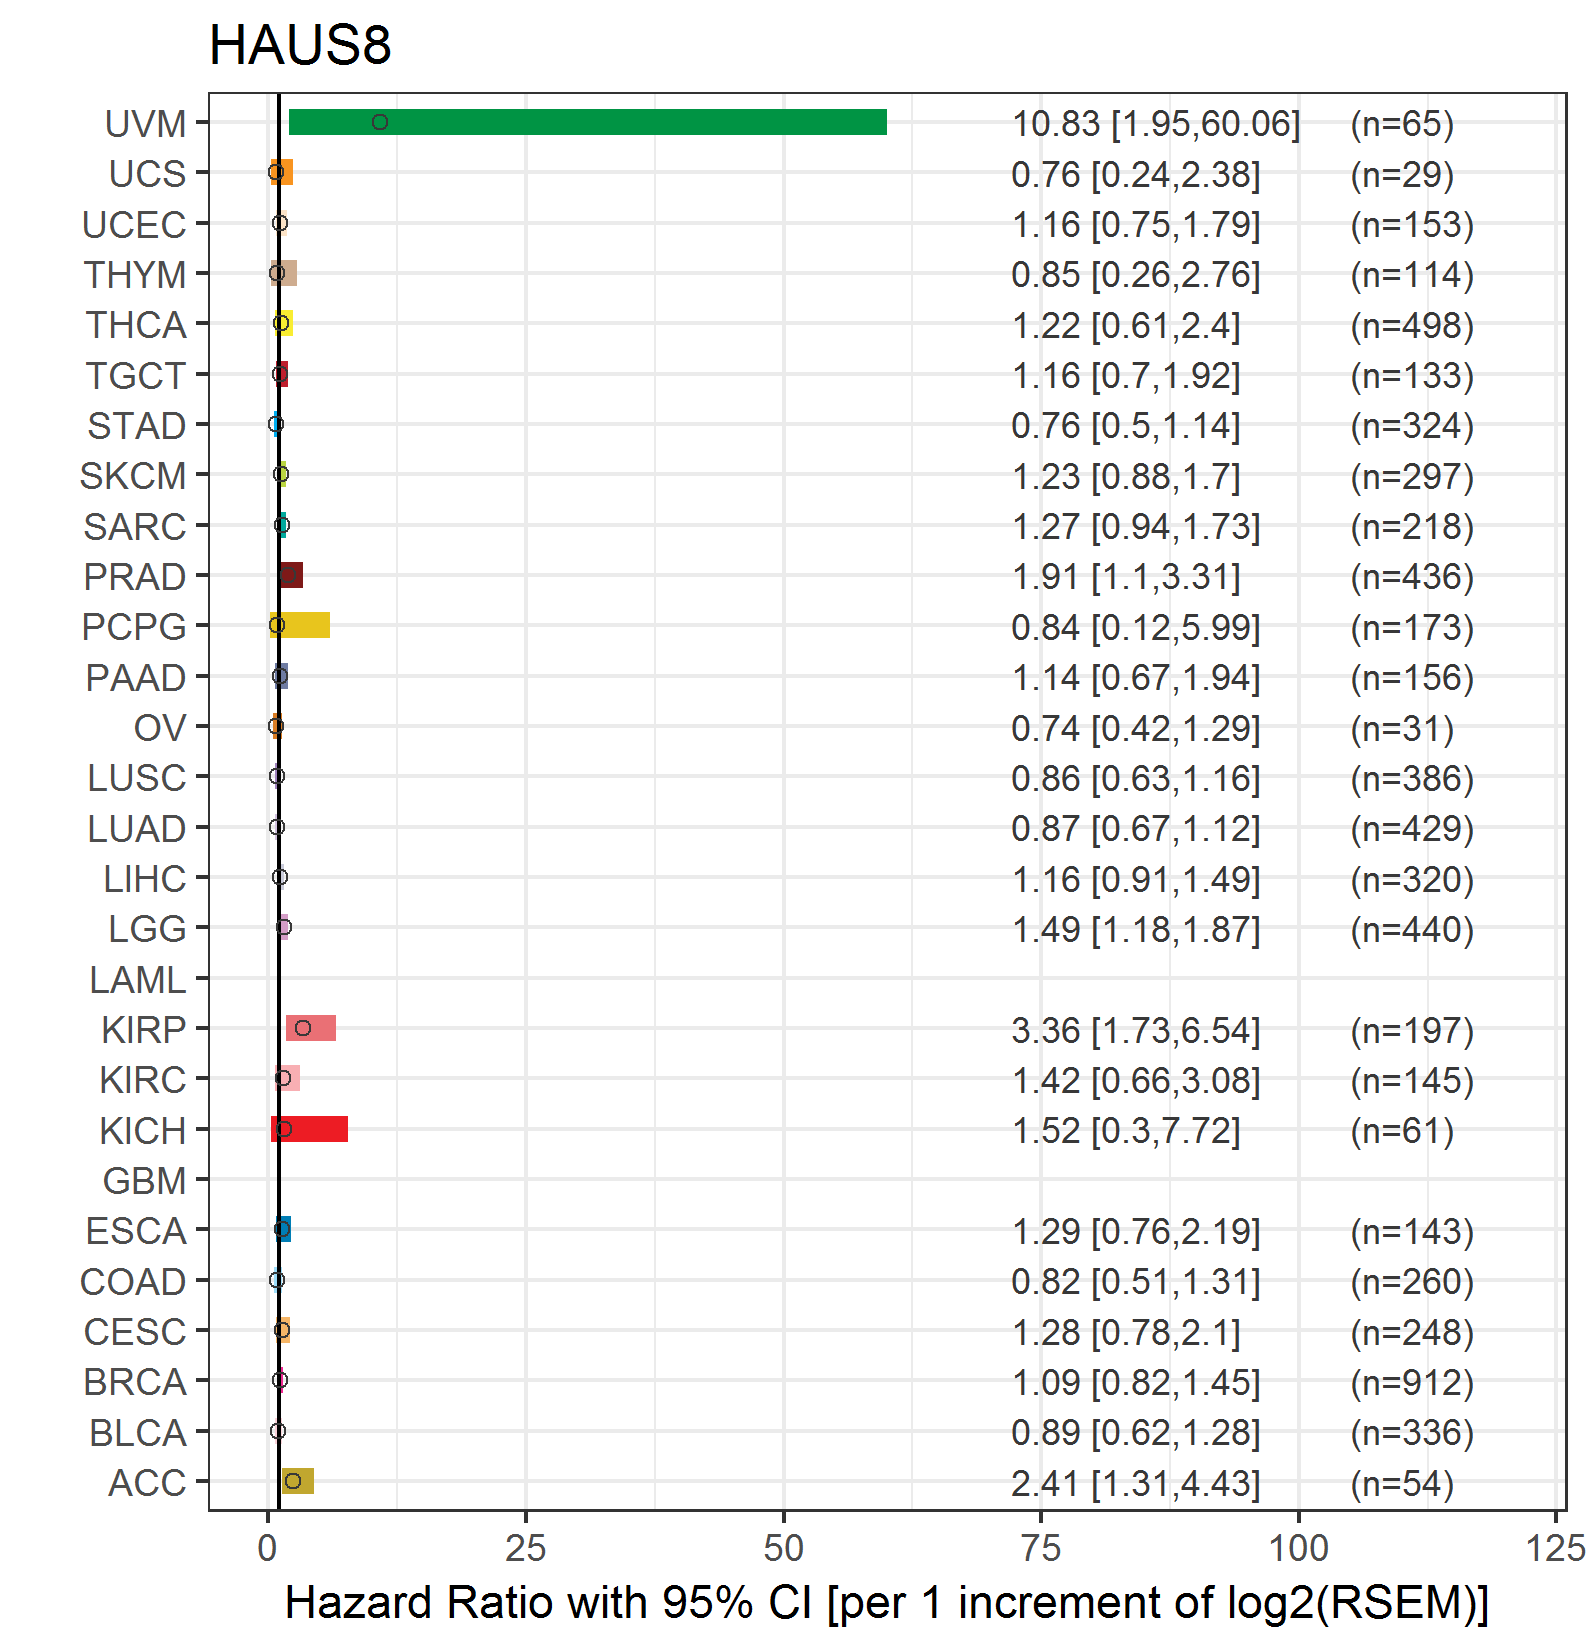
| Forest plot of Cox proportional hazard ratio (HR) and 95% CI of relapse free survival (RFS) using 28 cancer types (TCGA IlluminaHiSeq_RNASeqV2, pan-cancer normalized log2(norm_counts+1) data, version 2016-08-16) (TCGA clinicalMatrix, phenotype data, version 2016-04-27) * Click on the image enlarge it in a new window. |
 |
| Top |
| TissGeneClin for HAUS8 |
| TissGeneDrug for HAUS8 |
| Drug information targeting TissGene (DrugBank Version 5.0.6, 2017-04-01) |
| DrugBank ID | Drug name | Drug activity | Drug type | Drug status |
| Top |
| TissGeneDisease for HAUS8 |
| Disease information associated with TissGene (DisGeNet, 2016-06-01) |
| Disease ID | Disease name | # pubmeds | Source |
| umls:C1261473 | Sarcoma | 1 | BeFree |
|
Copyright 2016-Present - The University of Texas Health Science Center at Houston (UTHealth) Web File Viewing | How to Report, Fraud, Waste and Abuse | State of Texas | Statewide Search | Texas Homeland Security | Site Policies |