 |
| |
| |
| |
| |
| |
| |
|

| TissGeneSummary for CAPZA3 |
 Gene summary Gene summary |
| Basic gene information | Gene symbol | CAPZA3 |
| Gene name | capping protein (actin filament) muscle Z-line, alpha 3 | |
| Synonyms | CAPPA3|Gsg3 | |
| Cytomap | UCSC genome browser: 12p12.3 | |
| Type of gene | protein-coding | |
| RefGenes | NM_033328.2, | |
| Description | CP-alpha-3CapZ alpha-3F-actin capping protein alpha-3 subunitF-actin-capping protein subunit alpha-3germ cell-specific protein 3 | |
| Modification date | 20141207 | |
| dbXrefs | MIM : 608722 | |
| HGNC : HGNC | ||
| Ensembl : ENSG00000177938 | ||
| HPRD : 12282 | ||
| Vega : OTTHUMG00000169001 | ||
| Protein | UniProt: go to UniProt's Cross Reference DB Table | |
| Expression | CleanEX: HS_CAPZA3 | |
| BioGPS: 93661 | ||
| Pathway | NCI Pathway Interaction Database: CAPZA3 | |
| KEGG: CAPZA3 | ||
| REACTOME: CAPZA3 | ||
| Pathway Commons: CAPZA3 | ||
| Context | iHOP: CAPZA3 | |
| ligand binding site mutation search in PubMed: CAPZA3 | ||
| UCL Cancer Institute: CAPZA3 | ||
| Assigned class in TissGDB* | B | |
| Included tissue-specific gene expression resources | HPA,TiGER,GTEx | |
| Specific-tissues in normal samples (assigned by TissGDB using HPA, TiGER, and GTEx) | Testis | |
| Cancer types related to the specific-tissues in cancer samples (assigned by TissGDB using TCGA) | TGCT | |
| Reference showing the relevant tissue of CAPZA3 | ||
| Description by TissGene annotations | ||
| * Class A consists of genes with literature evidence and is part of the cTissGenes. Class B consists of only cTissGenes without additional evidence. The remaining genes belong to Class C. |
| Gene ontology having evidence of Inferred from Direct Assay (IDA) from Entrez |
| GO ID | GO term | PubMed ID |
| Top |
| TissGeneExp for CAPZA3 |
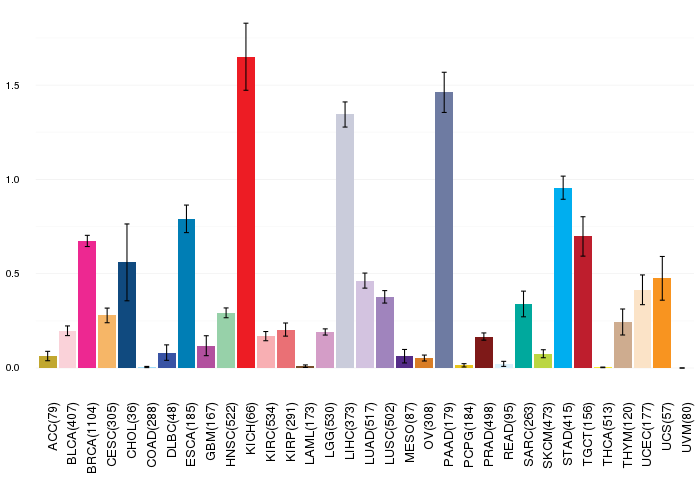
| Gene expressions across 28 cancer types (X-axis: cancer type and Y-axis: log2(norm_counts+1)) (TCGA IlluminaHiSeq_RNASeqV2, pan-cancer normalized log2(norm_counts+1) data, version 2016-08-16) |
 |
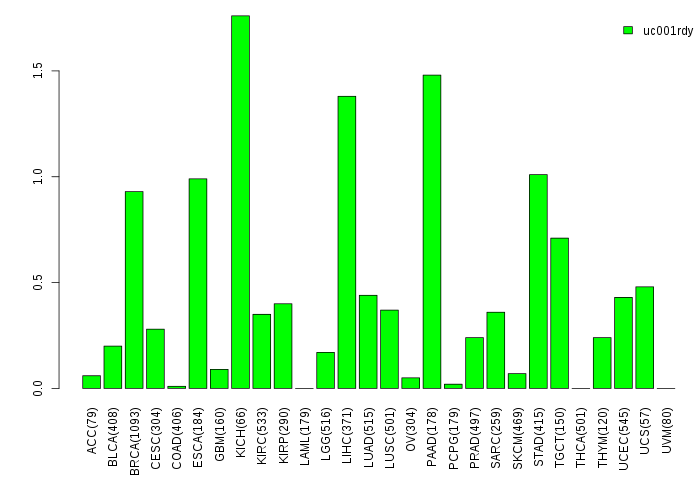
| Gene isoform expressions across 28 cancer types (X-axis: cancer type and Y-axis: log2(norm_counts+1)) (TCGA pan-cancer tcga_rsem_isoform_tpm, version 2016-09-01) |
 |
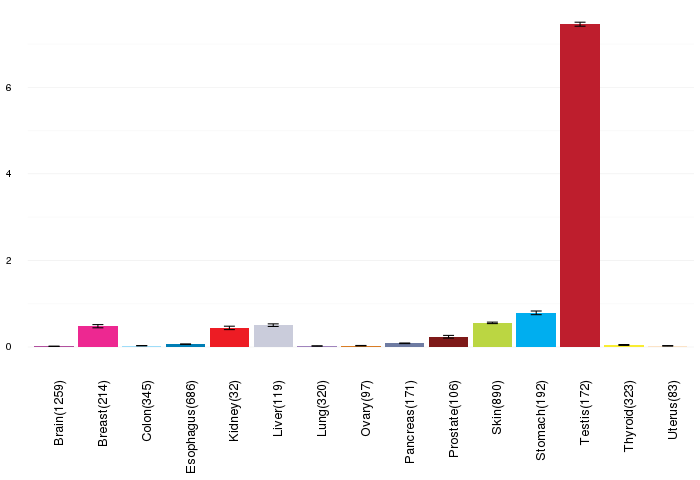
| Gene expressions across normal tissues of GTEx data (GTEx GTEx_Analysis_v6_RNA-seq_RNA-SeQCv1.1.8_gene_rpkm.gct) - Here, we shows the matched tissue types only among our 28 cancer types. |
 |
| Different expressions across 14 cancer types with more than 10 samples between matched tumors and normals (X-axis: cancer type and Y-axis: log2(norm_counts+1)) (TCGA IlluminaHiSeq_RNASeqV2, pan-cancer normalized log2(norm_counts+1) data, version 2016-08-16) |
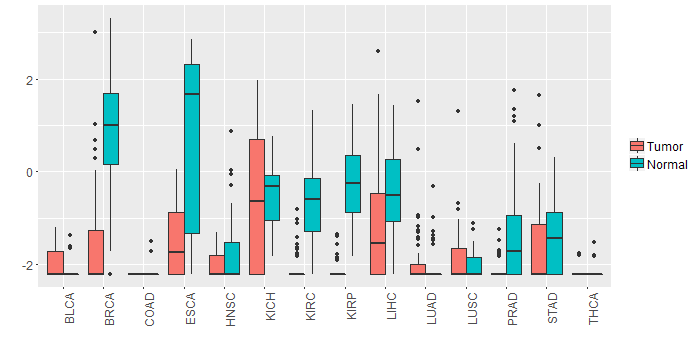 |
| - Significantly differentially expressed cancer types and information. (|Fold change|>1 and FDR<0.05) |
| Cancer type | Mean(exp) in tumor | Mean(exp) in matched normal | Log2FC | P-val. | FDR |
| BRCA | -1.604103826 | 0.705938279 | -2.310042105 | 4.97E-34 | 8.49E-33 |
| KIRC | -2.079235332 | -0.695358943 | -1.383876389 | 2.37E-24 | 2.68E-23 |
| KIRP | -2.095339846 | -0.238886721 | -1.856453125 | 9.99E-14 | 1.96E-12 |
| ESCA | -1.400575357 | 0.735679188 | -2.136254545 | 0.00567 | 0.042891429 |
| Top |
| TissGene-miRNA for CAPZA3 |
| Significantly anti-correlated miRNAs of TissGene across 28 cancer types (Gene-miRNA relations from TargetScanHuman Relsease 7.1, Conserved_Site_Context_Scores.txt.zip, 06.01.2016) (TCGA IlluminaHiSeq_miRNASeq, log2(RPM+1) data, version 2016-11-21) (TCGA IlluminaHiSeq_RNASeqV2, log2(normalized_count+1) data, version 2016-08-16) (Spearman’s Rank Correlation (p-value<0.05 and coefficient<-0.25)) |
| Cancer type | miRNA id | miRNA accession | P-val. | Coeff. | # samples |
| Top |
| TissGeneMut for CAPZA3 |
| TissGeneSNV for CAPZA3 |
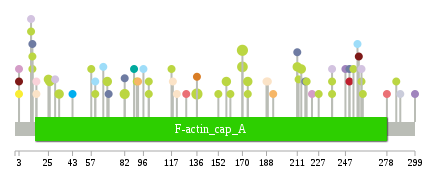
| nsSNV counts per each loci. Different colors of circles represent different cancer types. Circle size denotes number of samples. (TCGA somatic mutation (SNPs and small INDELs) data, version 2016-04-25) * Click on the image to enlarge it in a new window. |
 |
 |
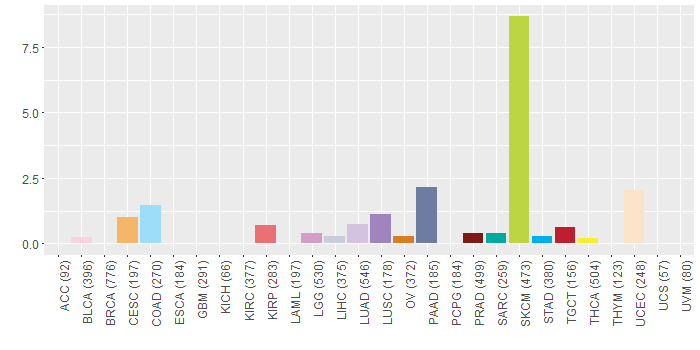
| Somatic nucleotide variants of TissGene across 28 cancer types (X-axis: cancer type and Y-axis: % of mutated samples) The numbers in parentheses are numbers of samples with mutation (nsSNVs). (TCGA somatic mutation (SNPs and small INDELs) data, version 2016-04-25) |
 |
| - nsSNVs sorted by frequency. |
| AAchange | Cancer type | # samples |
| p.W170* | SKCM | 5 |
| p.G136E | SKCM | 5 |
| p.W170X | SKCM | 4 |
| p.R82Q | SKCM | 3 |
| p.E26K | SKCM | 2 |
| p.H158Y | SKCM | 2 |
| p.D33N | SKCM | 2 |
| p.E211K | SKCM | 2 |
| p.W174* | SKCM | 2 |
| p.P69S | SKCM | 2 |
| p.G25E | SKCM | 2 |
| p.E214K | SKCM | 2 |
| p.R16H | HNSC | 1 |
| p.L96M | COAD | 1 |
| p.E161K | SKCM | 1 |
| p.L117Q | SKCM | 1 |
| p.I189L | UCEC | 1 |
| p.A193S | CESC | 1 |
| p.A222V | LGG | 1 |
| p.Q100* | SKCM | 1 |
| p.R227K | SKCM | 1 |
| p.E12K | SKCM | 1 |
| p.L121I | UCEC | 1 |
| p.R188G | UCEC | 1 |
| p.Q218* | SKCM | 1 |
| p.Q237* | SKCM | 1 |
| p.E250K | TGCT | 1 |
| p.Q100X | SKCM | 1 |
| p.L3V | PRAD | 1 |
| p.D259Y | LUAD | 1 |
| p.S60Y | COAD | 1 |
| p.G136A | OV | 1 |
| p.R16C | UCEC | 1 |
| p.L247* | LUSC | 1 |
| p.Q237L | LUAD | 1 |
| p.D66N | COAD | 1 |
| p.K210R | HNSC | 1 |
| p.I288V | LIHC | 1 |
| p.G285E | SKCM | 1 |
| p.L3I | THCA | 1 |
| p.R39H | DLBC | 1 |
| p.R13I | PAAD | 1 |
| p.R16C | BLCA | 1 |
| p.R257* | PRAD | 1 |
| p.S212N | SKCM | 1 |
| p.I255T | DLBC | 1 |
| p.D259N | SKCM | 1 |
| p.E211K | PAAD | 1 |
| p.L260I | READ | 1 |
| p.S60F | SKCM | 1 |
| p.L34I | READ | 1 |
| p.F92L | CESC | 1 |
| p.I152L | SKCM | 1 |
| p.L256I | COAD | 1 |
| p.R13X | SKCM | 1 |
| p.R253K | SKCM | 1 |
| p.Q237X | SKCM | 1 |
| p.L278Q | KIRP | 1 |
| p.M78I | HNSC | 1 |
| p.S91A | SKCM | 1 |
| p.R82L | PAAD | 1 |
| p.L260F | SKCM | 1 |
| p.E12* | LUAD | 1 |
| p.Q57R | SKCM | 1 |
| p.V77I | READ | 1 |
| p.R118T | UCEC | 1 |
| p.Y128S | KIRP | 1 |
| p.L3F | LGG | 1 |
| p.L43R | STAD | 1 |
| p.R13* | SKCM | 1 |
| p.V70L | PAAD | 1 |
| p.E250K | PAAD | 1 |
| p.N217S | PAAD | 1 |
| p.I299M | LUSC | 1 |
| p.A30S | LUAD | 1 |
| p.W174X | SKCM | 1 |
| p.K89N | SARC | 1 |
| Top |
| TissGeneCNV for CAPZA3 |
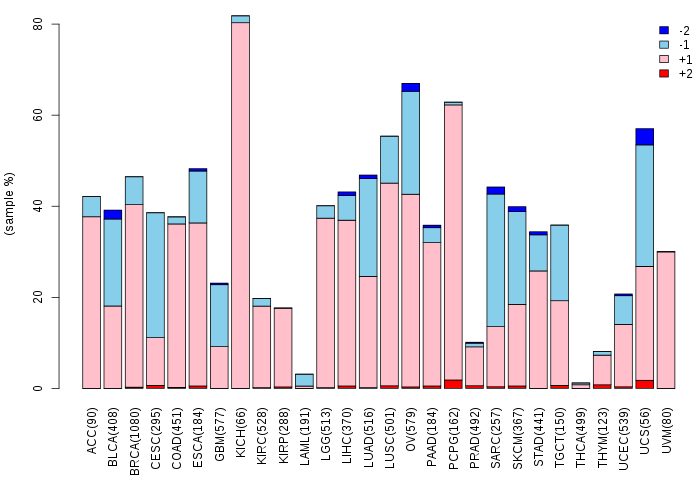
| Copy number variations of TissGene across 28 cancer types (X-axis: cancer type and Y-axis: % of CNV samples) (TCGA Gistic2_CopyNumber_Gistic2_all_data_by_genes, Gistic2 copy number data, version 2016-08-16) |
 |
| Top |
| TissGeneFusions for CAPZA3 |
| Fusion genes including TissGene (ChimerDB 3.0, 2016-12-01 and TCGA fusion Portal 2015-12-01) |
| Database | Src | Cancer type | Sample | Fusion gene | ORF | 5'-gene BP | 3'-gene BP |
| Top |
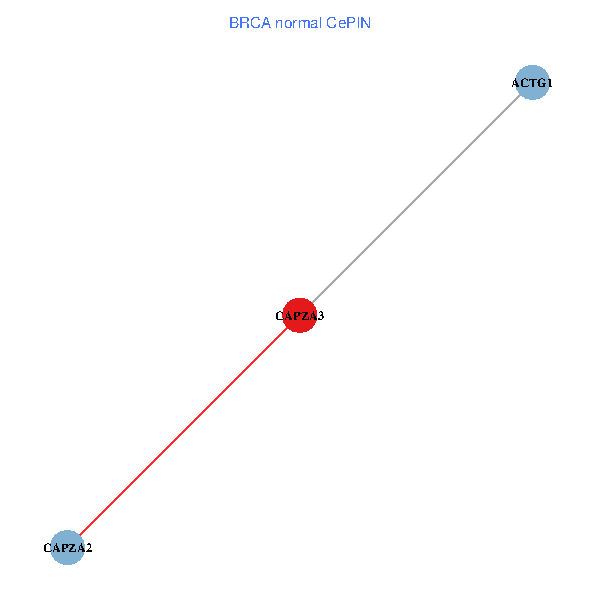
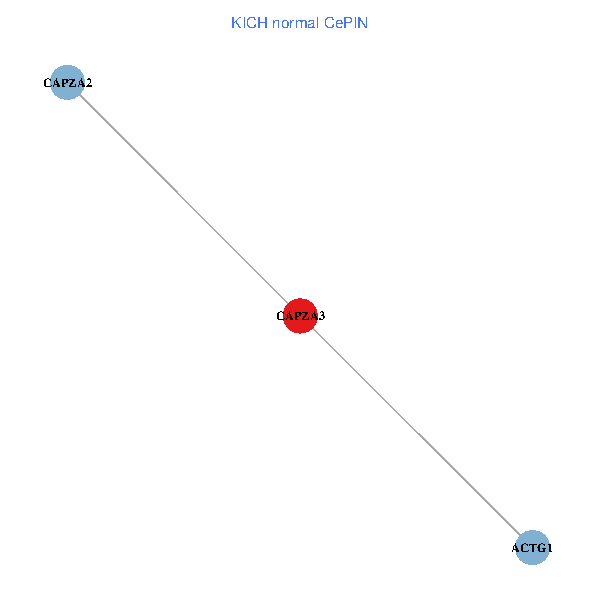
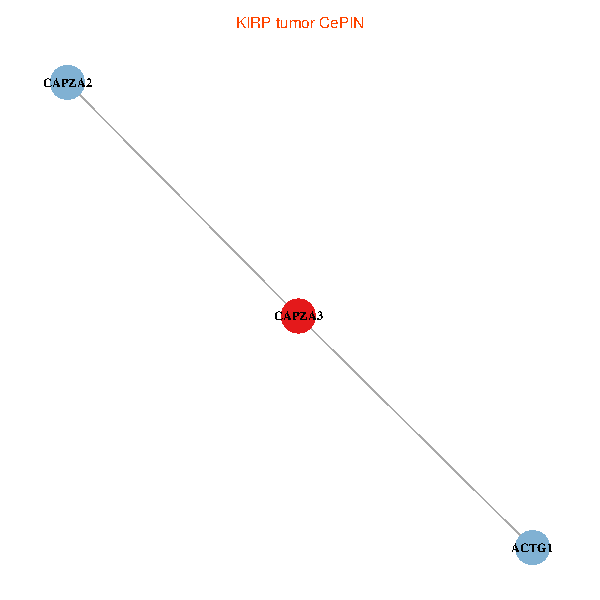
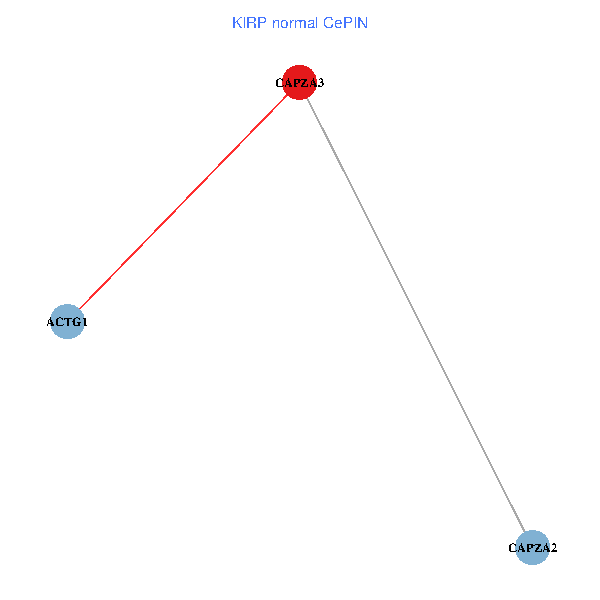
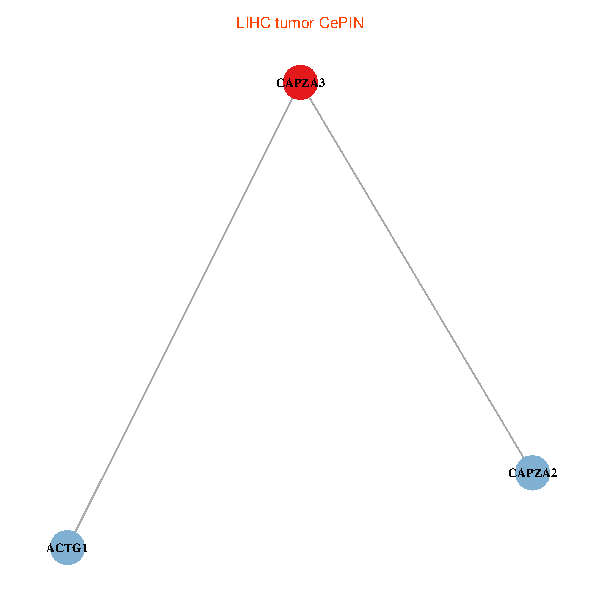
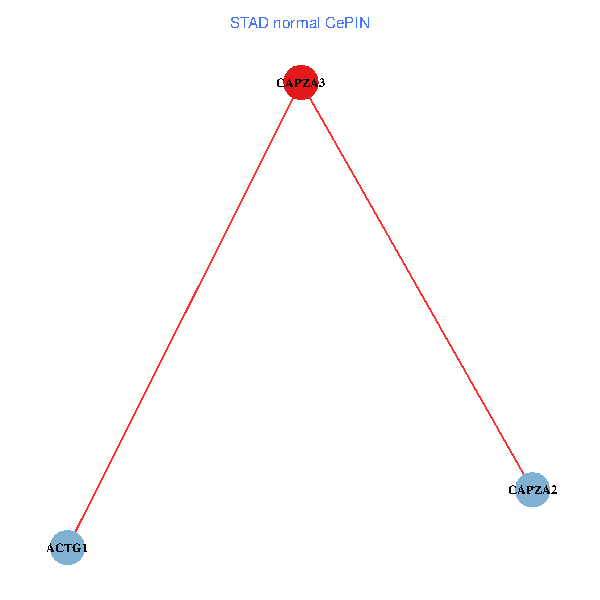
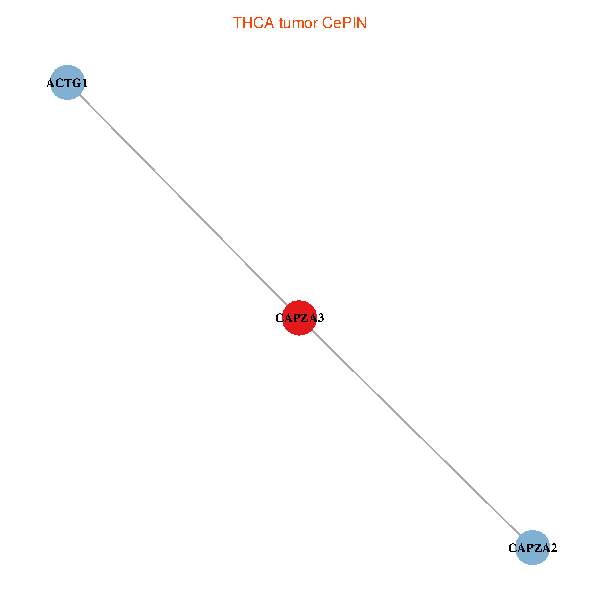
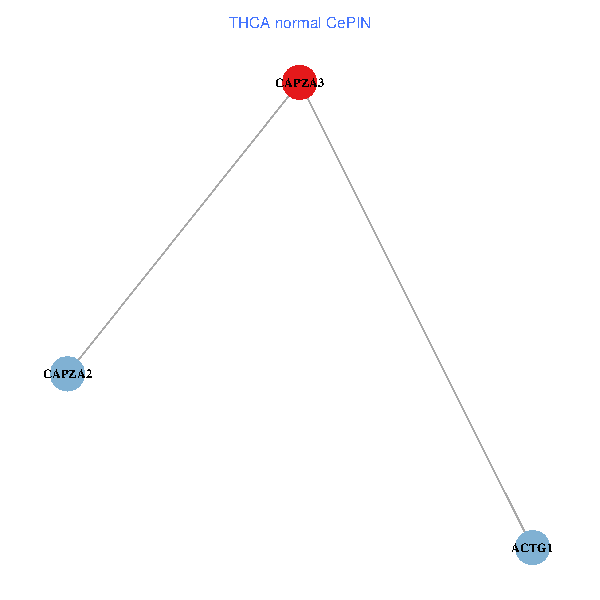
| TissGeneNet for CAPZA3 |
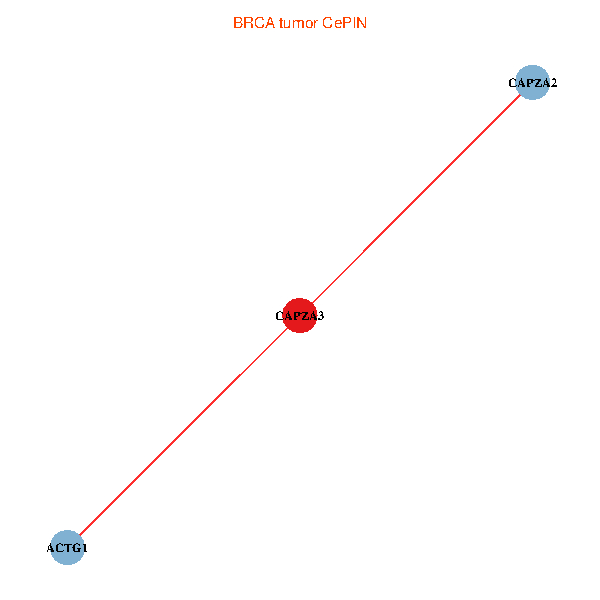
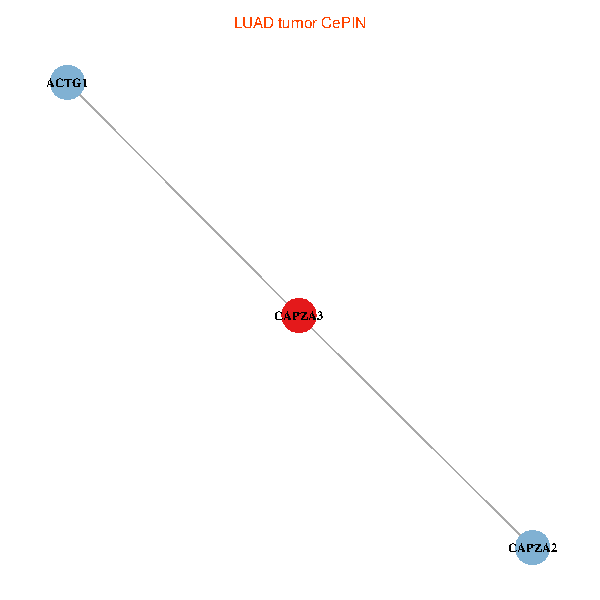
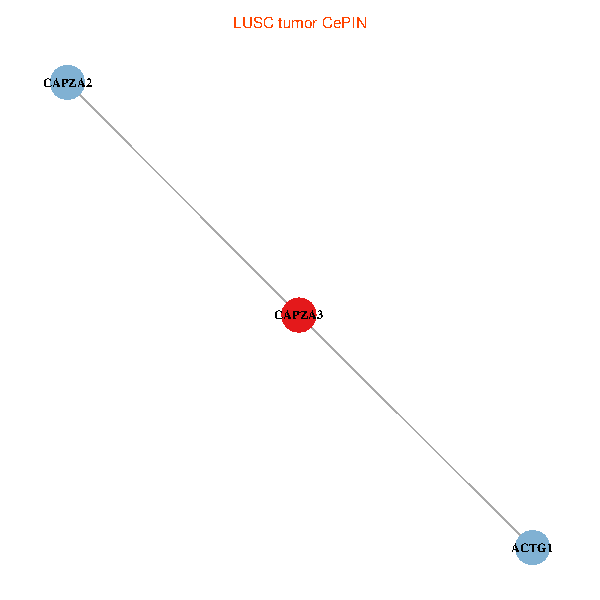
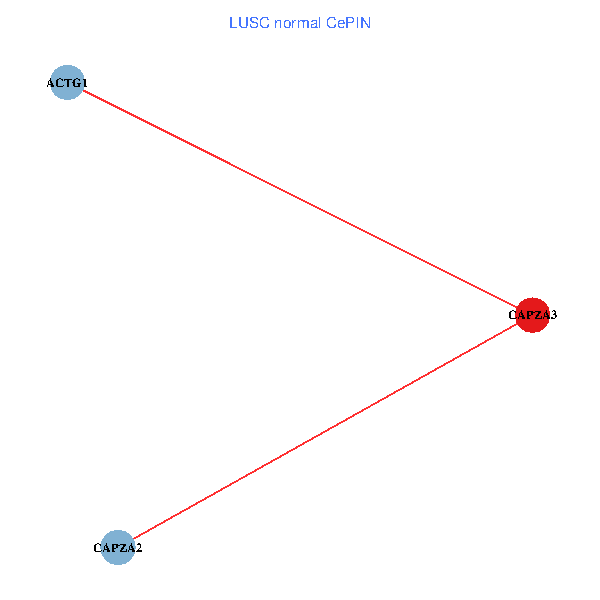
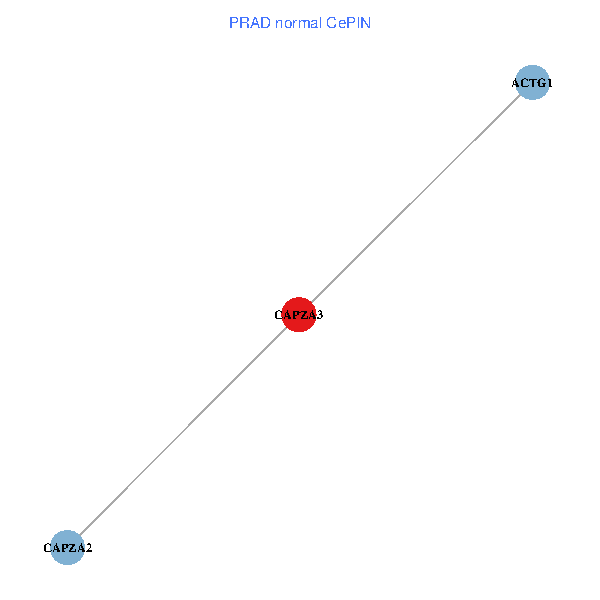
| Co-expressed gene networks based on protein-protein interaction data (CePIN) (TCGA IlluminaHiSeq_RNASeqV2, pan-cancer normalized log2(norm_counts+1) data, version 2016-08-16) (PINA2 ppi data) |
| BRCA (tumor) | BRCA (normal) |
| CAPZA3, CAPZA2, ACTG1 (tumor) | CAPZA3, CAPZA2, ACTG1 (normal) |
 |  |
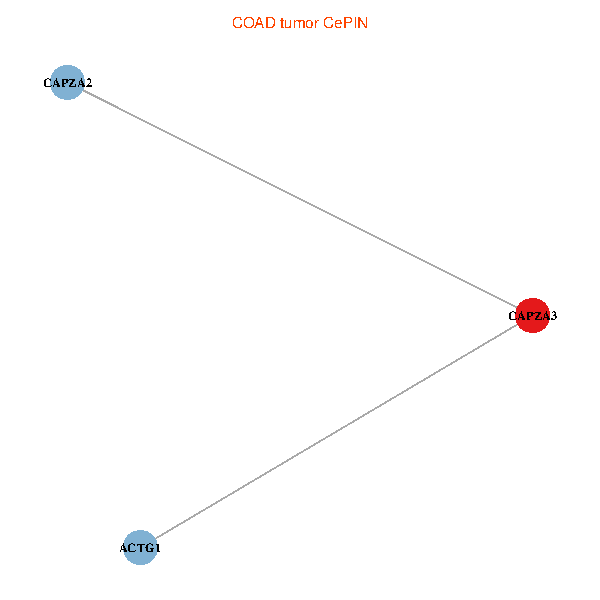
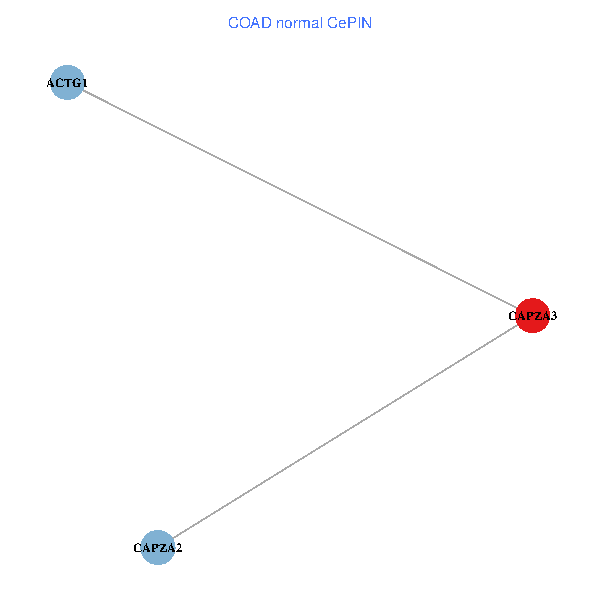
| COAD (tumor) | COAD (normal) |
| CAPZA3, CAPZA2, ACTG1 (tumor) | CAPZA3, CAPZA2, ACTG1 (normal) |
 |  |
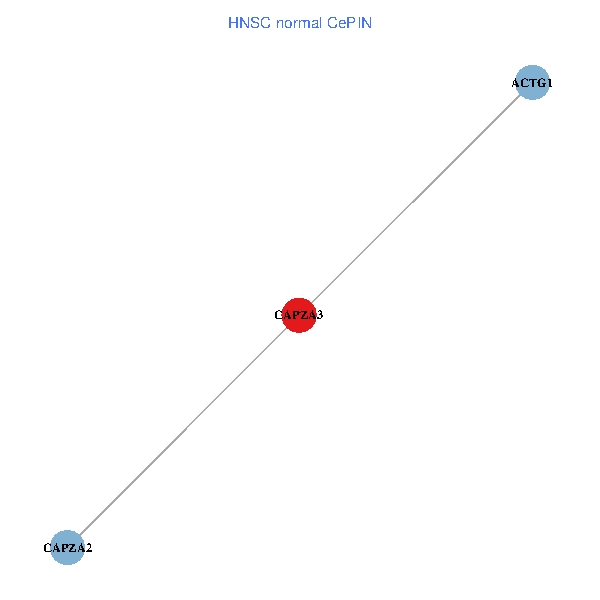
| HNSC (tumor) | HNSC (normal) |
| CAPZA3, CAPZA2, ACTG1 (tumor) | CAPZA3, CAPZA2, ACTG1 (normal) |
 |  |
| KICH (tumor) | KICH (normal) |
| CAPZA3, CAPZA2, ACTG1 (tumor) | CAPZA3, CAPZA2, ACTG1 (normal) |
 |  |
| KIRC (tumor) | KIRC (normal) |
| CAPZA3, CAPZA2, ACTG1 (tumor) | CAPZA3, CAPZA2, ACTG1 (normal) |
 |  |
| KIRP (tumor) | KIRP (normal) |
| CAPZA3, CAPZA2, ACTG1 (tumor) | CAPZA3, CAPZA2, ACTG1 (normal) |
 |  |
| LIHC (tumor) | LIHC (normal) |
| CAPZA3, CAPZA2, ACTG1 (tumor) | CAPZA3, CAPZA2, ACTG1 (normal) |
 |  |
| LUAD (tumor) | LUAD (normal) |
| CAPZA3, CAPZA2, ACTG1 (tumor) | CAPZA3, CAPZA2, ACTG1 (normal) |
 |  |
| LUSC (tumor) | LUSC (normal) |
| CAPZA3, CAPZA2, ACTG1 (tumor) | CAPZA3, CAPZA2, ACTG1 (normal) |
 |  |
| PRAD (tumor) | PRAD (normal) |
| CAPZA3, CAPZA2, ACTG1 (tumor) | CAPZA3, CAPZA2, ACTG1 (normal) |
 |  |
| STAD (tumor) | STAD (normal) |
| CAPZA3, CAPZA2, ACTG1 (tumor) | CAPZA3, CAPZA2, ACTG1 (normal) |
 |  |
| THCA (tumor) | THCA (normal) |
| CAPZA3, CAPZA2, ACTG1 (tumor) | CAPZA3, CAPZA2, ACTG1 (normal) |
 |  |
| Top |
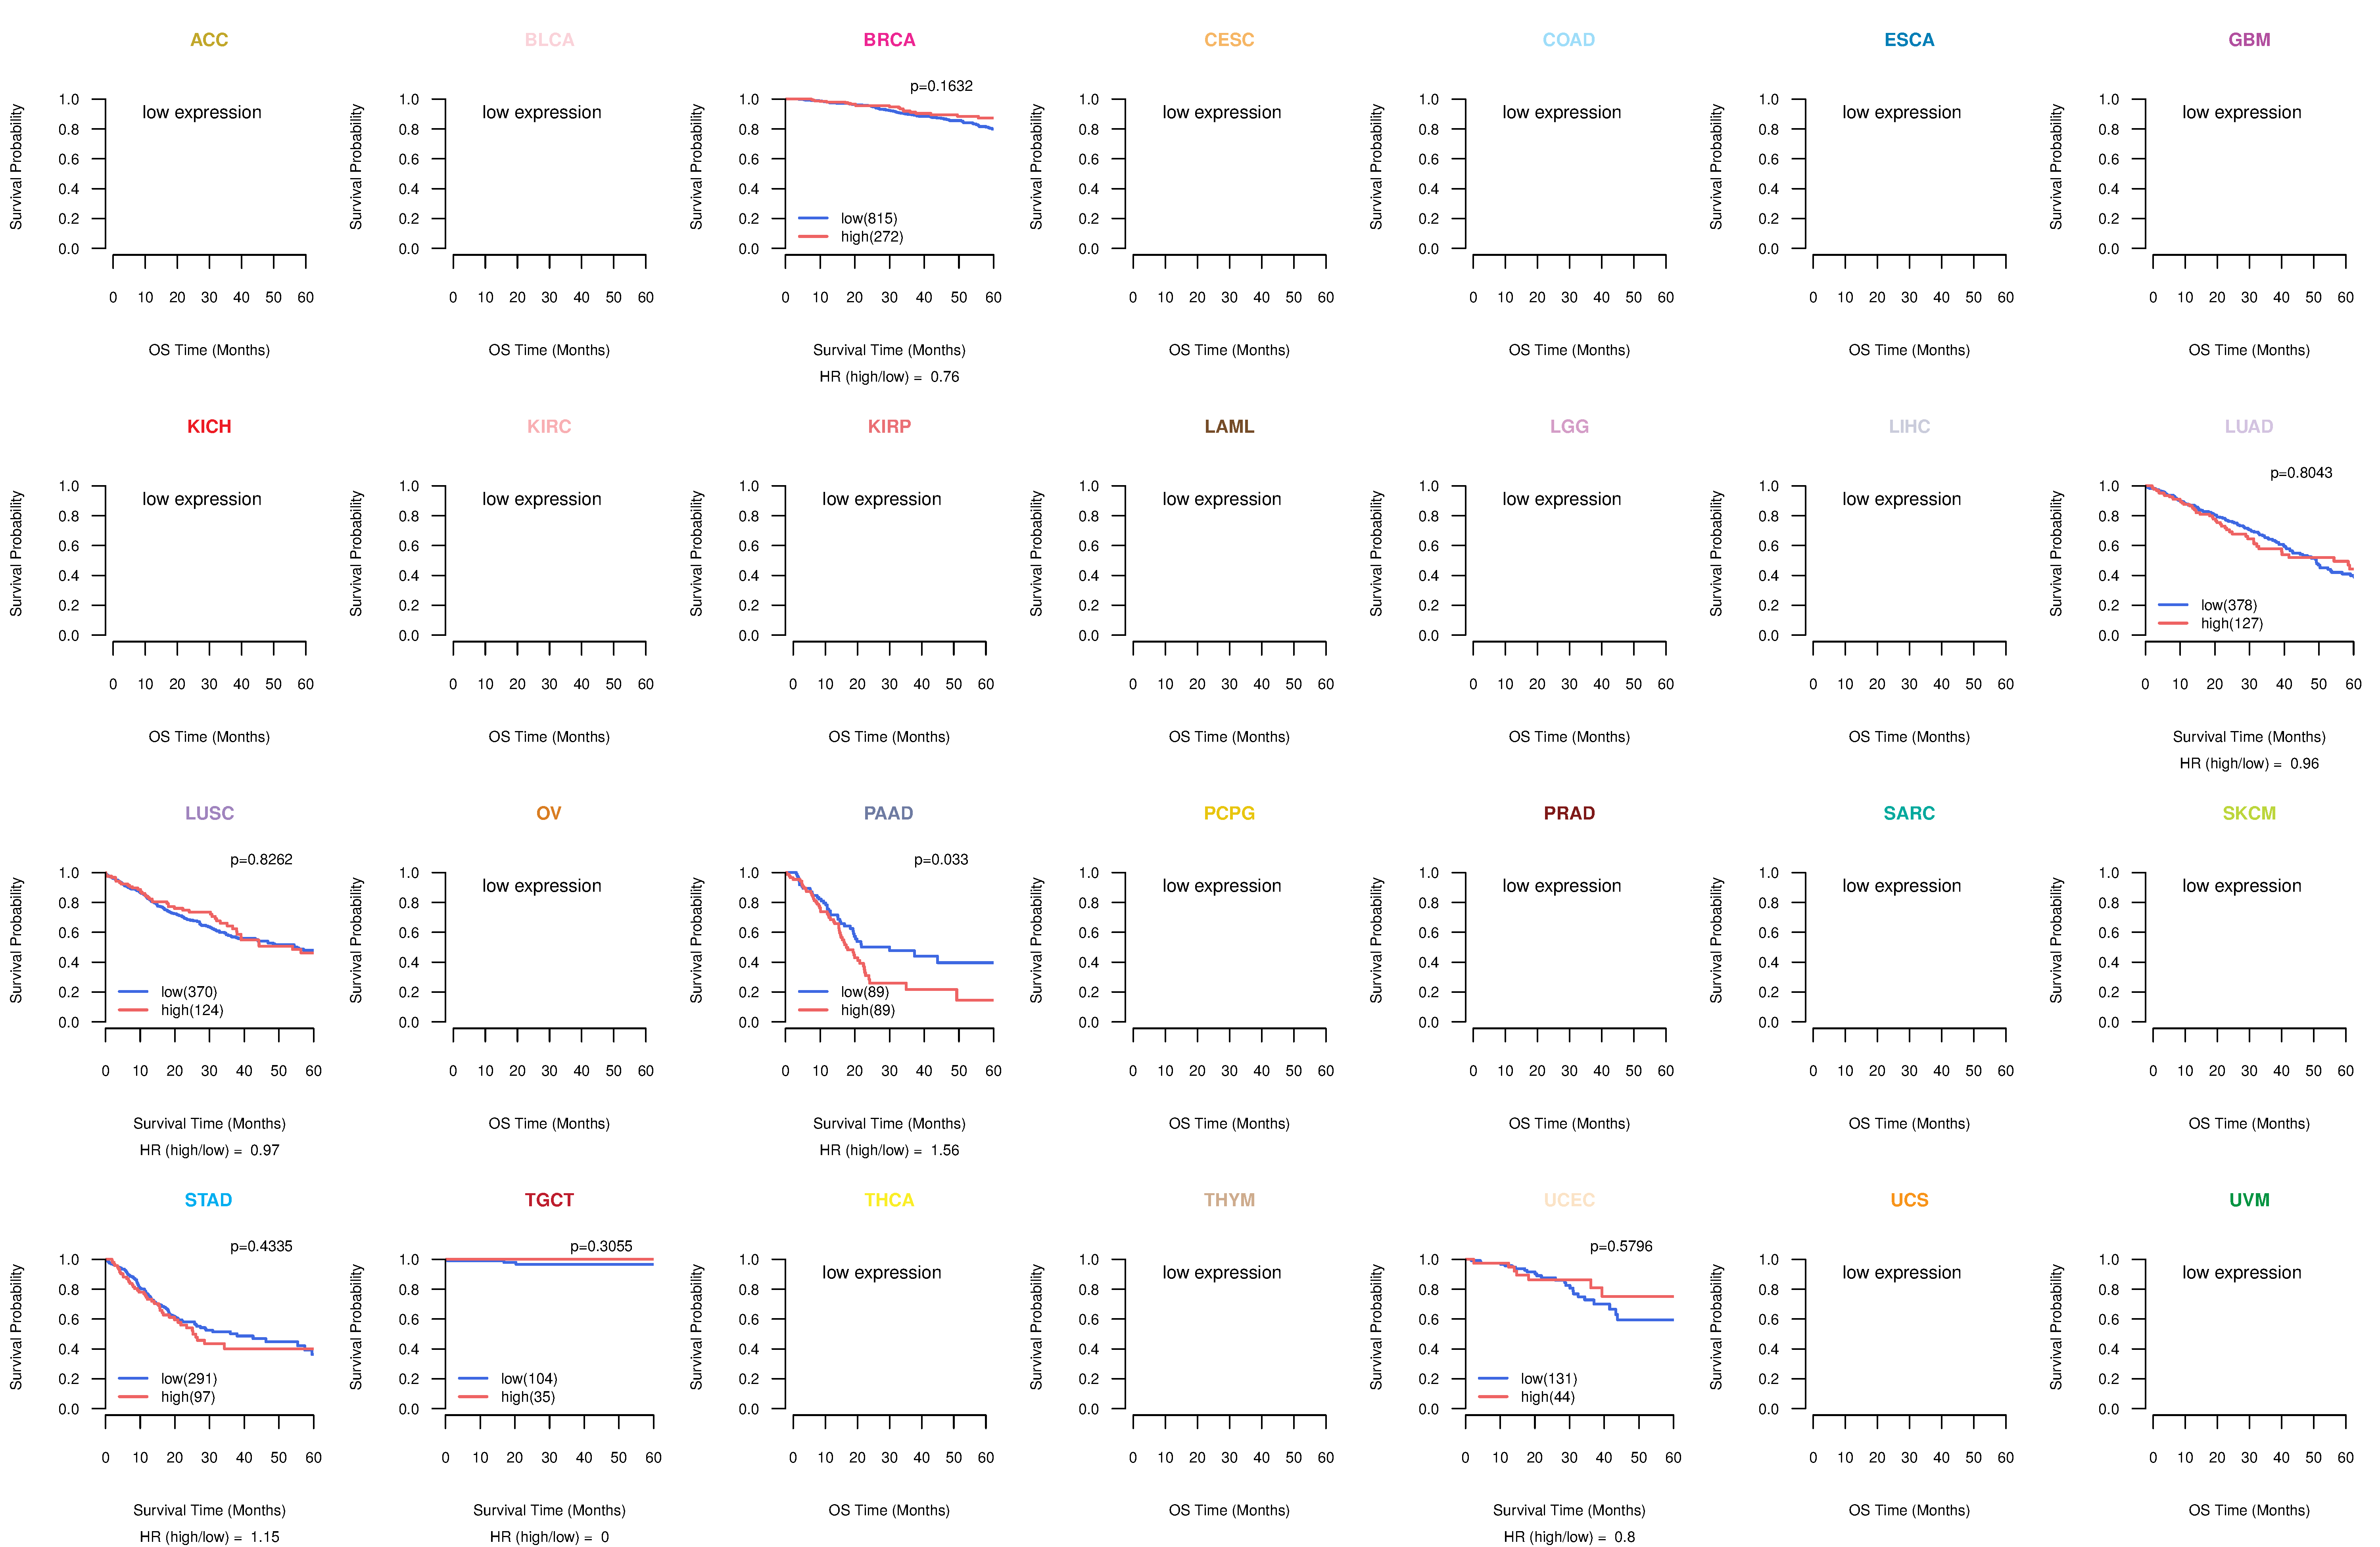
| TissGeneProg for CAPZA3 |
| Kaplan-Meier plots with logrank tests of overall survival (OS) using 28 cancer types (TCGA IlluminaHiSeq_RNASeqV2, pan-cancer normalized log2(norm_counts+1) data, version 2016-08-16) (TCGA clinicalMatrix, phenotype data, version 2016-04-27) * Click on the image to enlarge it in a new window. |
 |
| Kaplan-Meier plots with logrank test of relapse free survival (RFS) using 28 cancer types (TCGA IlluminaHiSeq_RNASeqV2, pan-cancer normalized log2(norm_counts+1) data, version 2016-08-16) (TCGA clinicalMatrix, phenotype data, version 2016-04-27) * Click on the image enlarge it in a new window. |
 |
| Forest plot of Cox proportional hazard ratio (HR) and 95% CI of overall survival (OS) using 28 cancer types (TCGA IlluminaHiSeq_RNASeqV2, pan-cancer normalized log2(norm_counts+1) data, version 2016-08-16) (TCGA clinicalMatrix, phenotype data, version 2016-04-27) * Click on the image enlarge it in a new window. |
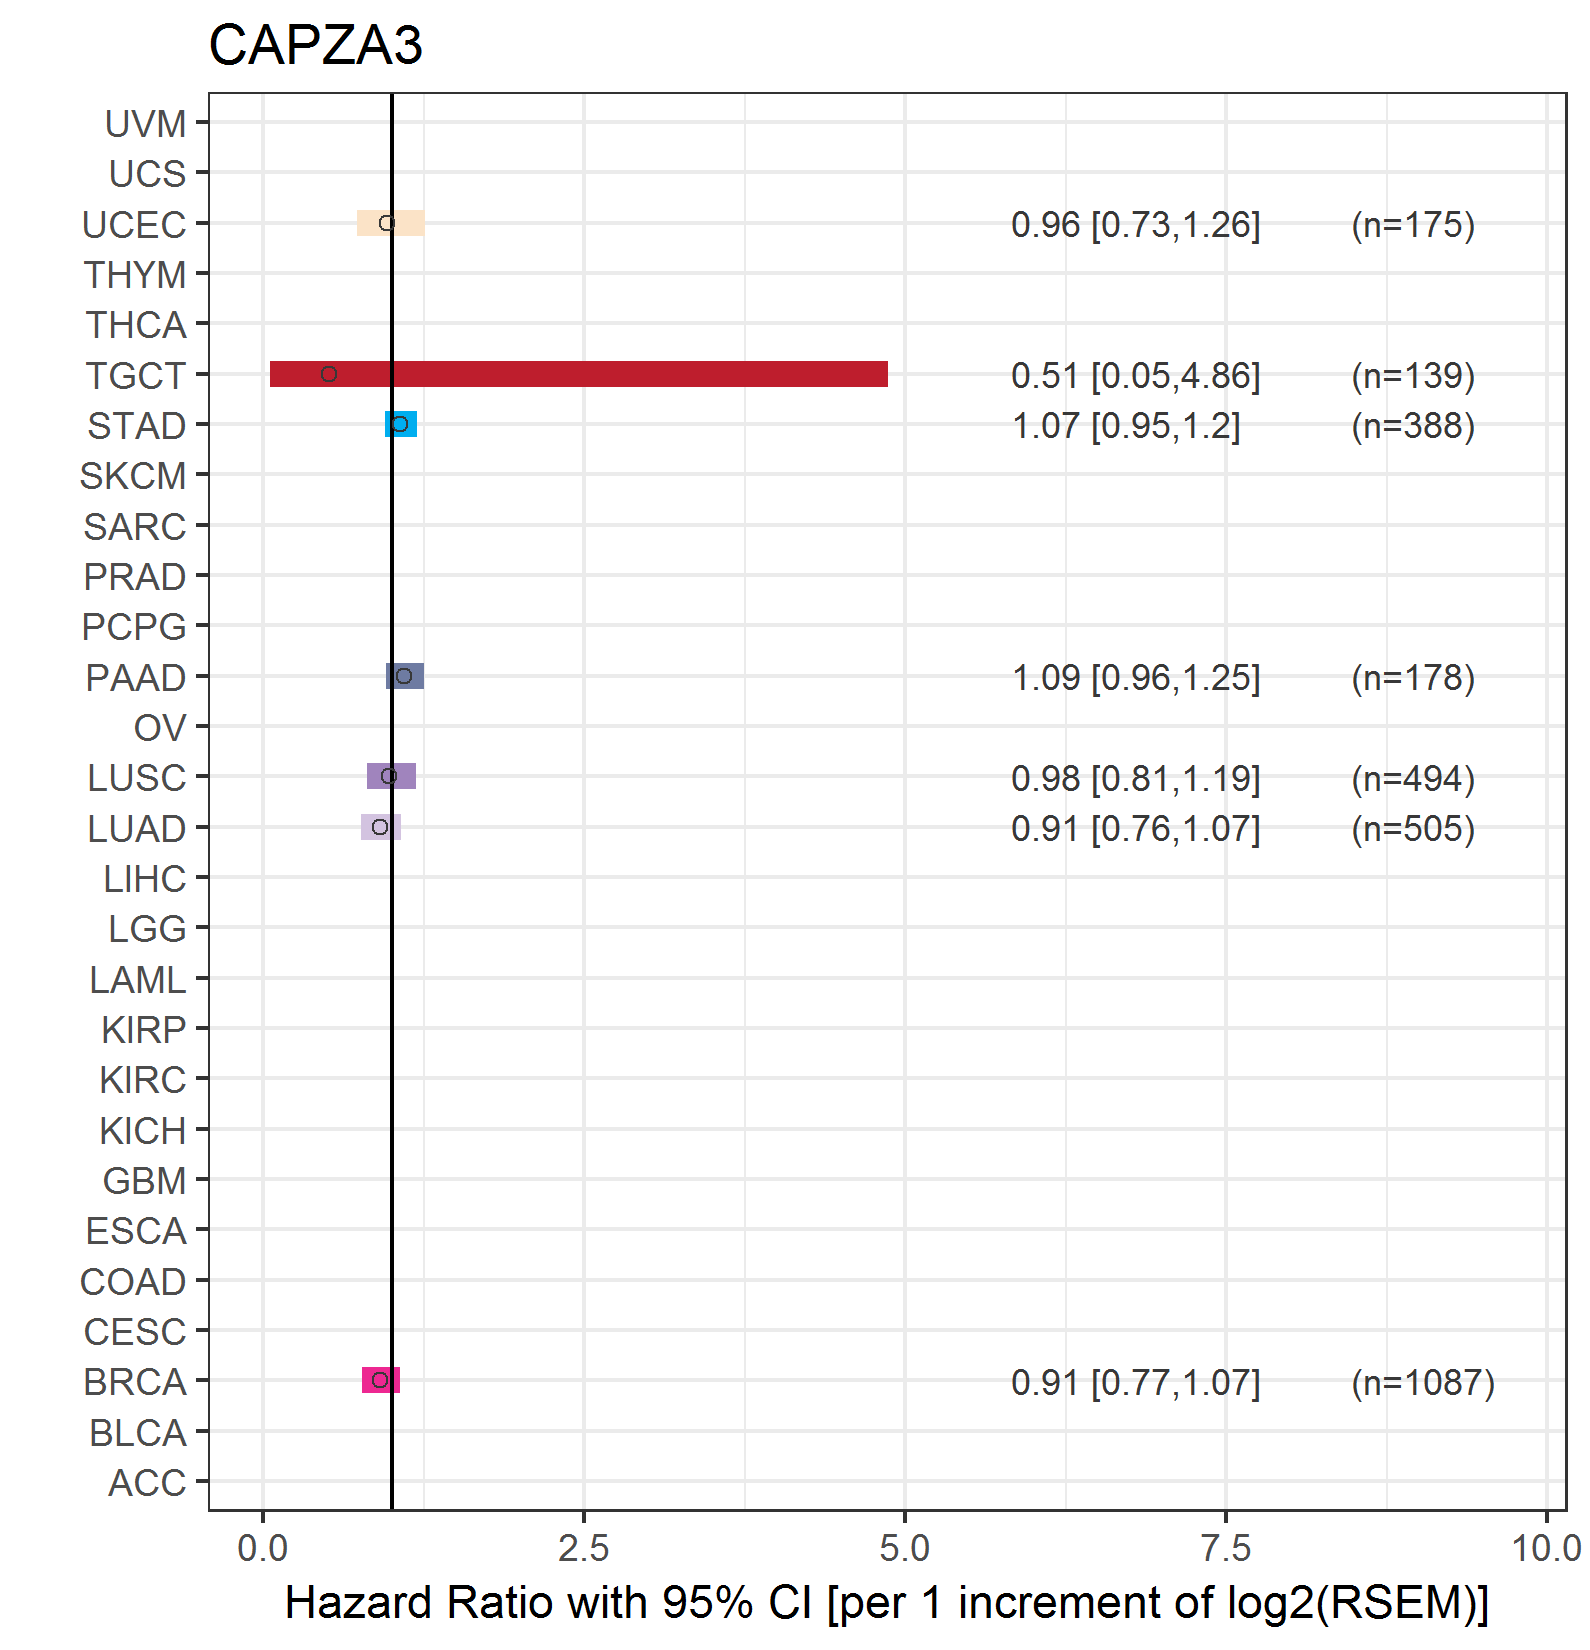 |
| Forest plot of Cox proportional hazard ratio (HR) and 95% CI of relapse free survival (RFS) using 28 cancer types (TCGA IlluminaHiSeq_RNASeqV2, pan-cancer normalized log2(norm_counts+1) data, version 2016-08-16) (TCGA clinicalMatrix, phenotype data, version 2016-04-27) * Click on the image enlarge it in a new window. |
 |
| Top |
| TissGeneClin for CAPZA3 |
| TissGeneDrug for CAPZA3 |
| Drug information targeting TissGene (DrugBank Version 5.0.6, 2017-04-01) |
| DrugBank ID | Drug name | Drug activity | Drug type | Drug status |
| Top |
| TissGeneDisease for CAPZA3 |
| Disease information associated with TissGene (DisGeNet, 2016-06-01) |
| Disease ID | Disease name | # pubmeds | Source |
|
Copyright 2016-Present - The University of Texas Health Science Center at Houston (UTHealth) Web File Viewing | How to Report, Fraud, Waste and Abuse | State of Texas | Statewide Search | Texas Homeland Security | Site Policies |