 |
| |
| |
| |
| |
| |
| |
|

| TissGeneSummary for FTMT |
 Gene summary Gene summary |
| Basic gene information | Gene symbol | FTMT |
| Gene name | ferritin mitochondrial | |
| Synonyms | MTF | |
| Cytomap | UCSC genome browser: 5q21.3 | |
| Type of gene | protein-coding | |
| RefGenes | NM_177478.1, | |
| Description | ferritin H subunitferritin, mitochondrialmitochondrial ferritin | |
| Modification date | 20141207 | |
| dbXrefs | MIM : 608847 | |
| HGNC : HGNC | ||
| Ensembl : ENSG00000181867 | ||
| HPRD : 12316 | ||
| Vega : OTTHUMG00000128912 | ||
| Protein | UniProt: go to UniProt's Cross Reference DB Table | |
| Expression | CleanEX: HS_FTMT | |
| BioGPS: 94033 | ||
| Pathway | NCI Pathway Interaction Database: FTMT | |
| KEGG: FTMT | ||
| REACTOME: FTMT | ||
| Pathway Commons: FTMT | ||
| Context | iHOP: FTMT | |
| ligand binding site mutation search in PubMed: FTMT | ||
| UCL Cancer Institute: FTMT | ||
| Assigned class in TissGDB* | C | |
| Included tissue-specific gene expression resources | HPA,GTEx | |
| Specific-tissues in normal samples (assigned by TissGDB using HPA, TiGER, and GTEx) | Testis | |
| Cancer types related to the specific-tissues in cancer samples (assigned by TissGDB using TCGA) | TGCT | |
| Reference showing the relevant tissue of FTMT | ||
| Description by TissGene annotations | TissgsKTS | |
| * Class A consists of genes with literature evidence and is part of the cTissGenes. Class B consists of only cTissGenes without additional evidence. The remaining genes belong to Class C. |
| Gene ontology having evidence of Inferred from Direct Assay (IDA) from Entrez |
| GO ID | GO term | PubMed ID | GO:0006879 | cellular iron ion homeostasis | 18160053 | GO:0008284 | positive regulation of cell proliferation | 18160053 | GO:0051347 | positive regulation of transferase activity | 18160053 | GO:0051349 | positive regulation of lyase activity | 18160053 | GO:0051353 | positive regulation of oxidoreductase activity | 18160053 | GO:0006879 | cellular iron ion homeostasis | 18160053 | GO:0008284 | positive regulation of cell proliferation | 18160053 | GO:0051347 | positive regulation of transferase activity | 18160053 | GO:0051349 | positive regulation of lyase activity | 18160053 | GO:0051353 | positive regulation of oxidoreductase activity | 18160053 |
| Top |
| TissGeneExp for FTMT |
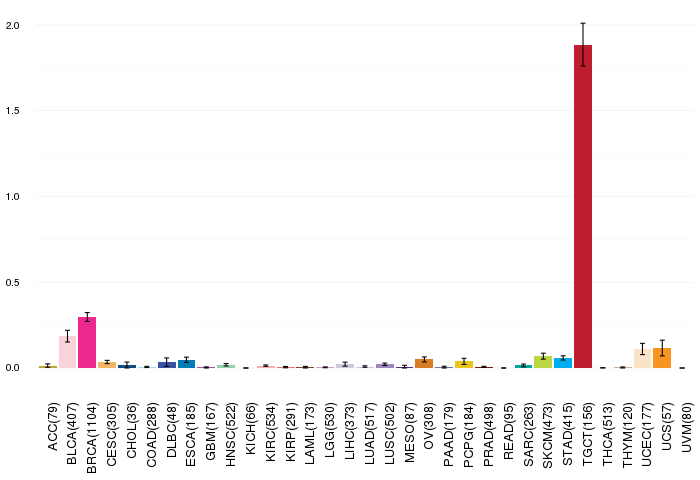
| Gene expressions across 28 cancer types (X-axis: cancer type and Y-axis: log2(norm_counts+1)) (TCGA IlluminaHiSeq_RNASeqV2, pan-cancer normalized log2(norm_counts+1) data, version 2016-08-16) |
 |
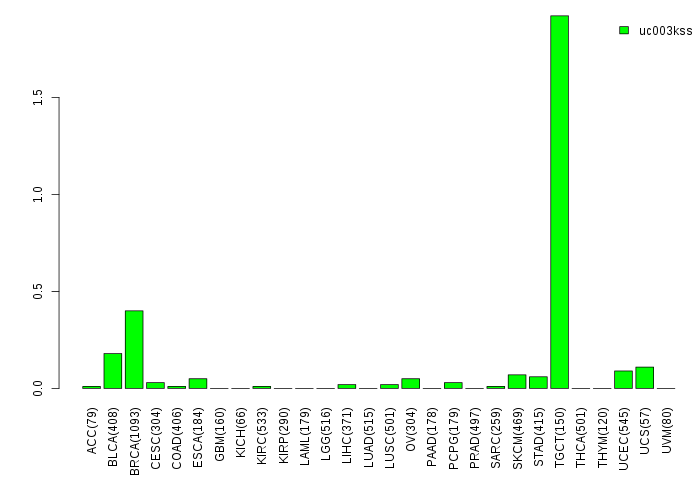
| Gene isoform expressions across 28 cancer types (X-axis: cancer type and Y-axis: log2(norm_counts+1)) (TCGA pan-cancer tcga_rsem_isoform_tpm, version 2016-09-01) |
 |
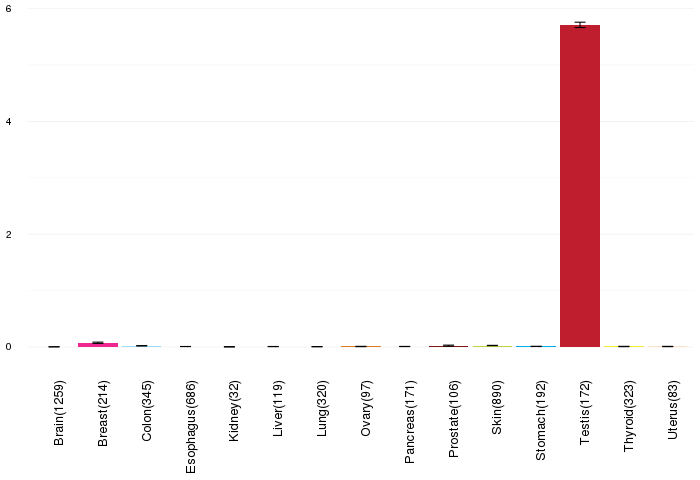
| Gene expressions across normal tissues of GTEx data (GTEx GTEx_Analysis_v6_RNA-seq_RNA-SeQCv1.1.8_gene_rpkm.gct) - Here, we shows the matched tissue types only among our 28 cancer types. |
 |
| Different expressions across 14 cancer types with more than 10 samples between matched tumors and normals (X-axis: cancer type and Y-axis: log2(norm_counts+1)) (TCGA IlluminaHiSeq_RNASeqV2, pan-cancer normalized log2(norm_counts+1) data, version 2016-08-16) |
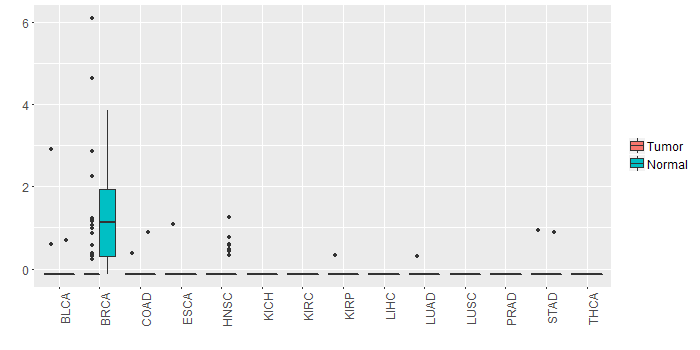 |
| - Significantly differentially expressed cancer types and information. (|Fold change|>1 and FDR<0.05) |
| Cancer type | Mean(exp) in tumor | Mean(exp) in matched normal | Log2FC | P-val. | FDR |
| BRCA | 0.109133715 | 1.149722311 | -1.040588596 | 5.56E-15 | 2.87E-14 |
| Top |
| TissGene-miRNA for FTMT |
| Significantly anti-correlated miRNAs of TissGene across 28 cancer types (Gene-miRNA relations from TargetScanHuman Relsease 7.1, Conserved_Site_Context_Scores.txt.zip, 06.01.2016) (TCGA IlluminaHiSeq_miRNASeq, log2(RPM+1) data, version 2016-11-21) (TCGA IlluminaHiSeq_RNASeqV2, log2(normalized_count+1) data, version 2016-08-16) (Spearman’s Rank Correlation (p-value<0.05 and coefficient<-0.25)) |
| Cancer type | miRNA id | miRNA accession | P-val. | Coeff. | # samples |
| Top |
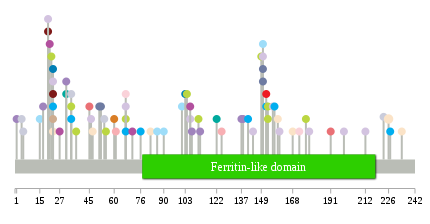
| TissGeneMut for FTMT |
| TissGeneSNV for FTMT |
| nsSNV counts per each loci. Different colors of circles represent different cancer types. Circle size denotes number of samples. (TCGA somatic mutation (SNPs and small INDELs) data, version 2016-04-25) * Click on the image to enlarge it in a new window. |
 |
 |
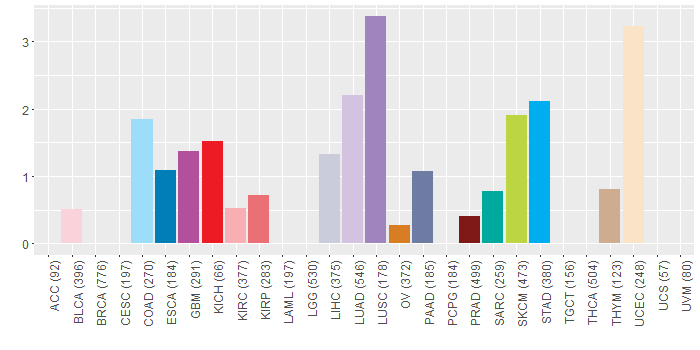
| Somatic nucleotide variants of TissGene across 28 cancer types (X-axis: cancer type and Y-axis: % of mutated samples) The numbers in parentheses are numbers of samples with mutation (nsSNVs). (TCGA somatic mutation (SNPs and small INDELs) data, version 2016-04-25) |
 |
| - nsSNVs sorted by frequency. |
| AAchange | Cancer type | # samples |
| p.A226V | UCEC | 2 |
| p.W153X | SKCM | 1 |
| p.R67Q | BLCA | 1 |
| p.N71D | GBM | 1 |
| p.Q172L | BLCA | 1 |
| p.G137E | LUSC | 1 |
| p.E149K | SKCM | 1 |
| p.D144E | LUAD | 1 |
| p.C4Y | LIHC | 1 |
| p.A223T | LIHC | 1 |
| p.D191N | KIRP | 1 |
| p.R67W | SKCM | 1 |
| p.R23C | LUAD | 1 |
| p.S54Y | LIHC | 1 |
| p.E176K | SKCM | 1 |
| p.R23H | UCEC | 1 |
| p.T234I | UCEC | 1 |
| p.A159V | UCEC | 1 |
| p.R67W | LUAD | 1 |
| p.M1I | LUSC | 1 |
| p.D222Y | HNSC | 1 |
| p.V22M | SKCM | 1 |
| p.R20S | LUAD | 1 |
| p.R67Q | HNSC | 1 |
| p.W153* | SKCM | 1 |
| p.Q150K | COAD | 1 |
| p.R103Q | ESCA | 1 |
| p.D152N | KICH | 1 |
| p.A90V | COAD | 1 |
| p.A107S | LUSC | 1 |
| p.V106M | GBM | 1 |
| p.N199S | LUAD | 1 |
| p.H178Q | LUAD | 1 |
| p.D152N | STAD | 1 |
| p.G156W | LUAD | 1 |
| p.P34Q | LIHC | 1 |
| p.R20H | PRAD | 1 |
| p.F101L | COAD | 1 |
| p.R47C | UCEC | 1 |
| p.Q150H | LUAD | 1 |
| p.R69C | READ | 1 |
| p.Q150* | PAAD | 1 |
| p.P45H | KIRP | 1 |
| p.L157R | STAD | 1 |
| p.P34L | SKCM | 1 |
| p.R141H | STAD | 1 |
| p.S55F | SKCM | 1 |
| p.V106L | LUAD | 1 |
| p.V212L | LUAD | 1 |
| p.G138A | LUSC | 1 |
| p.F111V | SKCM | 1 |
| p.R31C | LUSC | 1 |
| p.R82S | UCEC | 1 |
| p.D75Y | HNSC | 1 |
| p.S112F | LUSC | 1 |
| p.P21L | GBM | 1 |
| p.L86I | COAD | 1 |
| p.R23C | STAD | 1 |
| p.R67Q | STAD | 1 |
| p.E227K | STAD | 1 |
| p.M160I | LUAD | 1 |
| p.K168N | HNSC | 1 |
| p.P61S | KIRC | 1 |
| p.A27V | GBM | 1 |
| p.R23C | ESCA | 1 |
| p.A52T | PAAD | 1 |
| p.R23C | PRAD | 1 |
| p.P37L | SKCM | 1 |
| p.G60W | OV | 1 |
| p.Q150X | PAAD | 1 |
| p.A51T | PAAD | 1 |
| p.P34L | STAD | 1 |
| p.R31H | SARC | 1 |
| p.R23H | THYM | 1 |
| p.S15L | COAD | 1 |
| p.K168N | UCEC | 1 |
| p.F5L | LIHC | 1 |
| p.A17V | LUSC | 1 |
| p.A62T | HNSC | 1 |
| p.E122V | SARC | 1 |
| p.S76P | STAD | 1 |
| p.R46C | LUAD | 1 |
| p.H125L | KIRC | 1 |
| p.D104N | SKCM | 1 |
| Top |
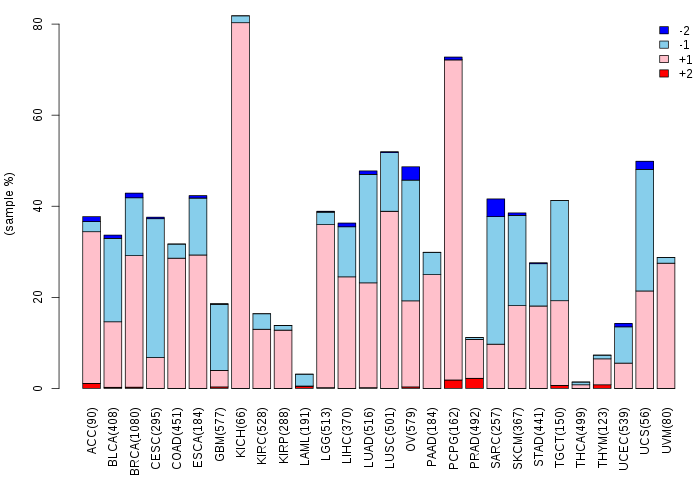
| TissGeneCNV for FTMT |
| Copy number variations of TissGene across 28 cancer types (X-axis: cancer type and Y-axis: % of CNV samples) (TCGA Gistic2_CopyNumber_Gistic2_all_data_by_genes, Gistic2 copy number data, version 2016-08-16) |
 |
| Top |
| TissGeneFusions for FTMT |
| Fusion genes including TissGene (ChimerDB 3.0, 2016-12-01 and TCGA fusion Portal 2015-12-01) |
| Database | Src | Cancer type | Sample | Fusion gene | ORF | 5'-gene BP | 3'-gene BP |
| Top |
| TissGeneNet for FTMT |
| Co-expressed gene networks based on protein-protein interaction data (CePIN) (TCGA IlluminaHiSeq_RNASeqV2, pan-cancer normalized log2(norm_counts+1) data, version 2016-08-16) (PINA2 ppi data) |
| Top |
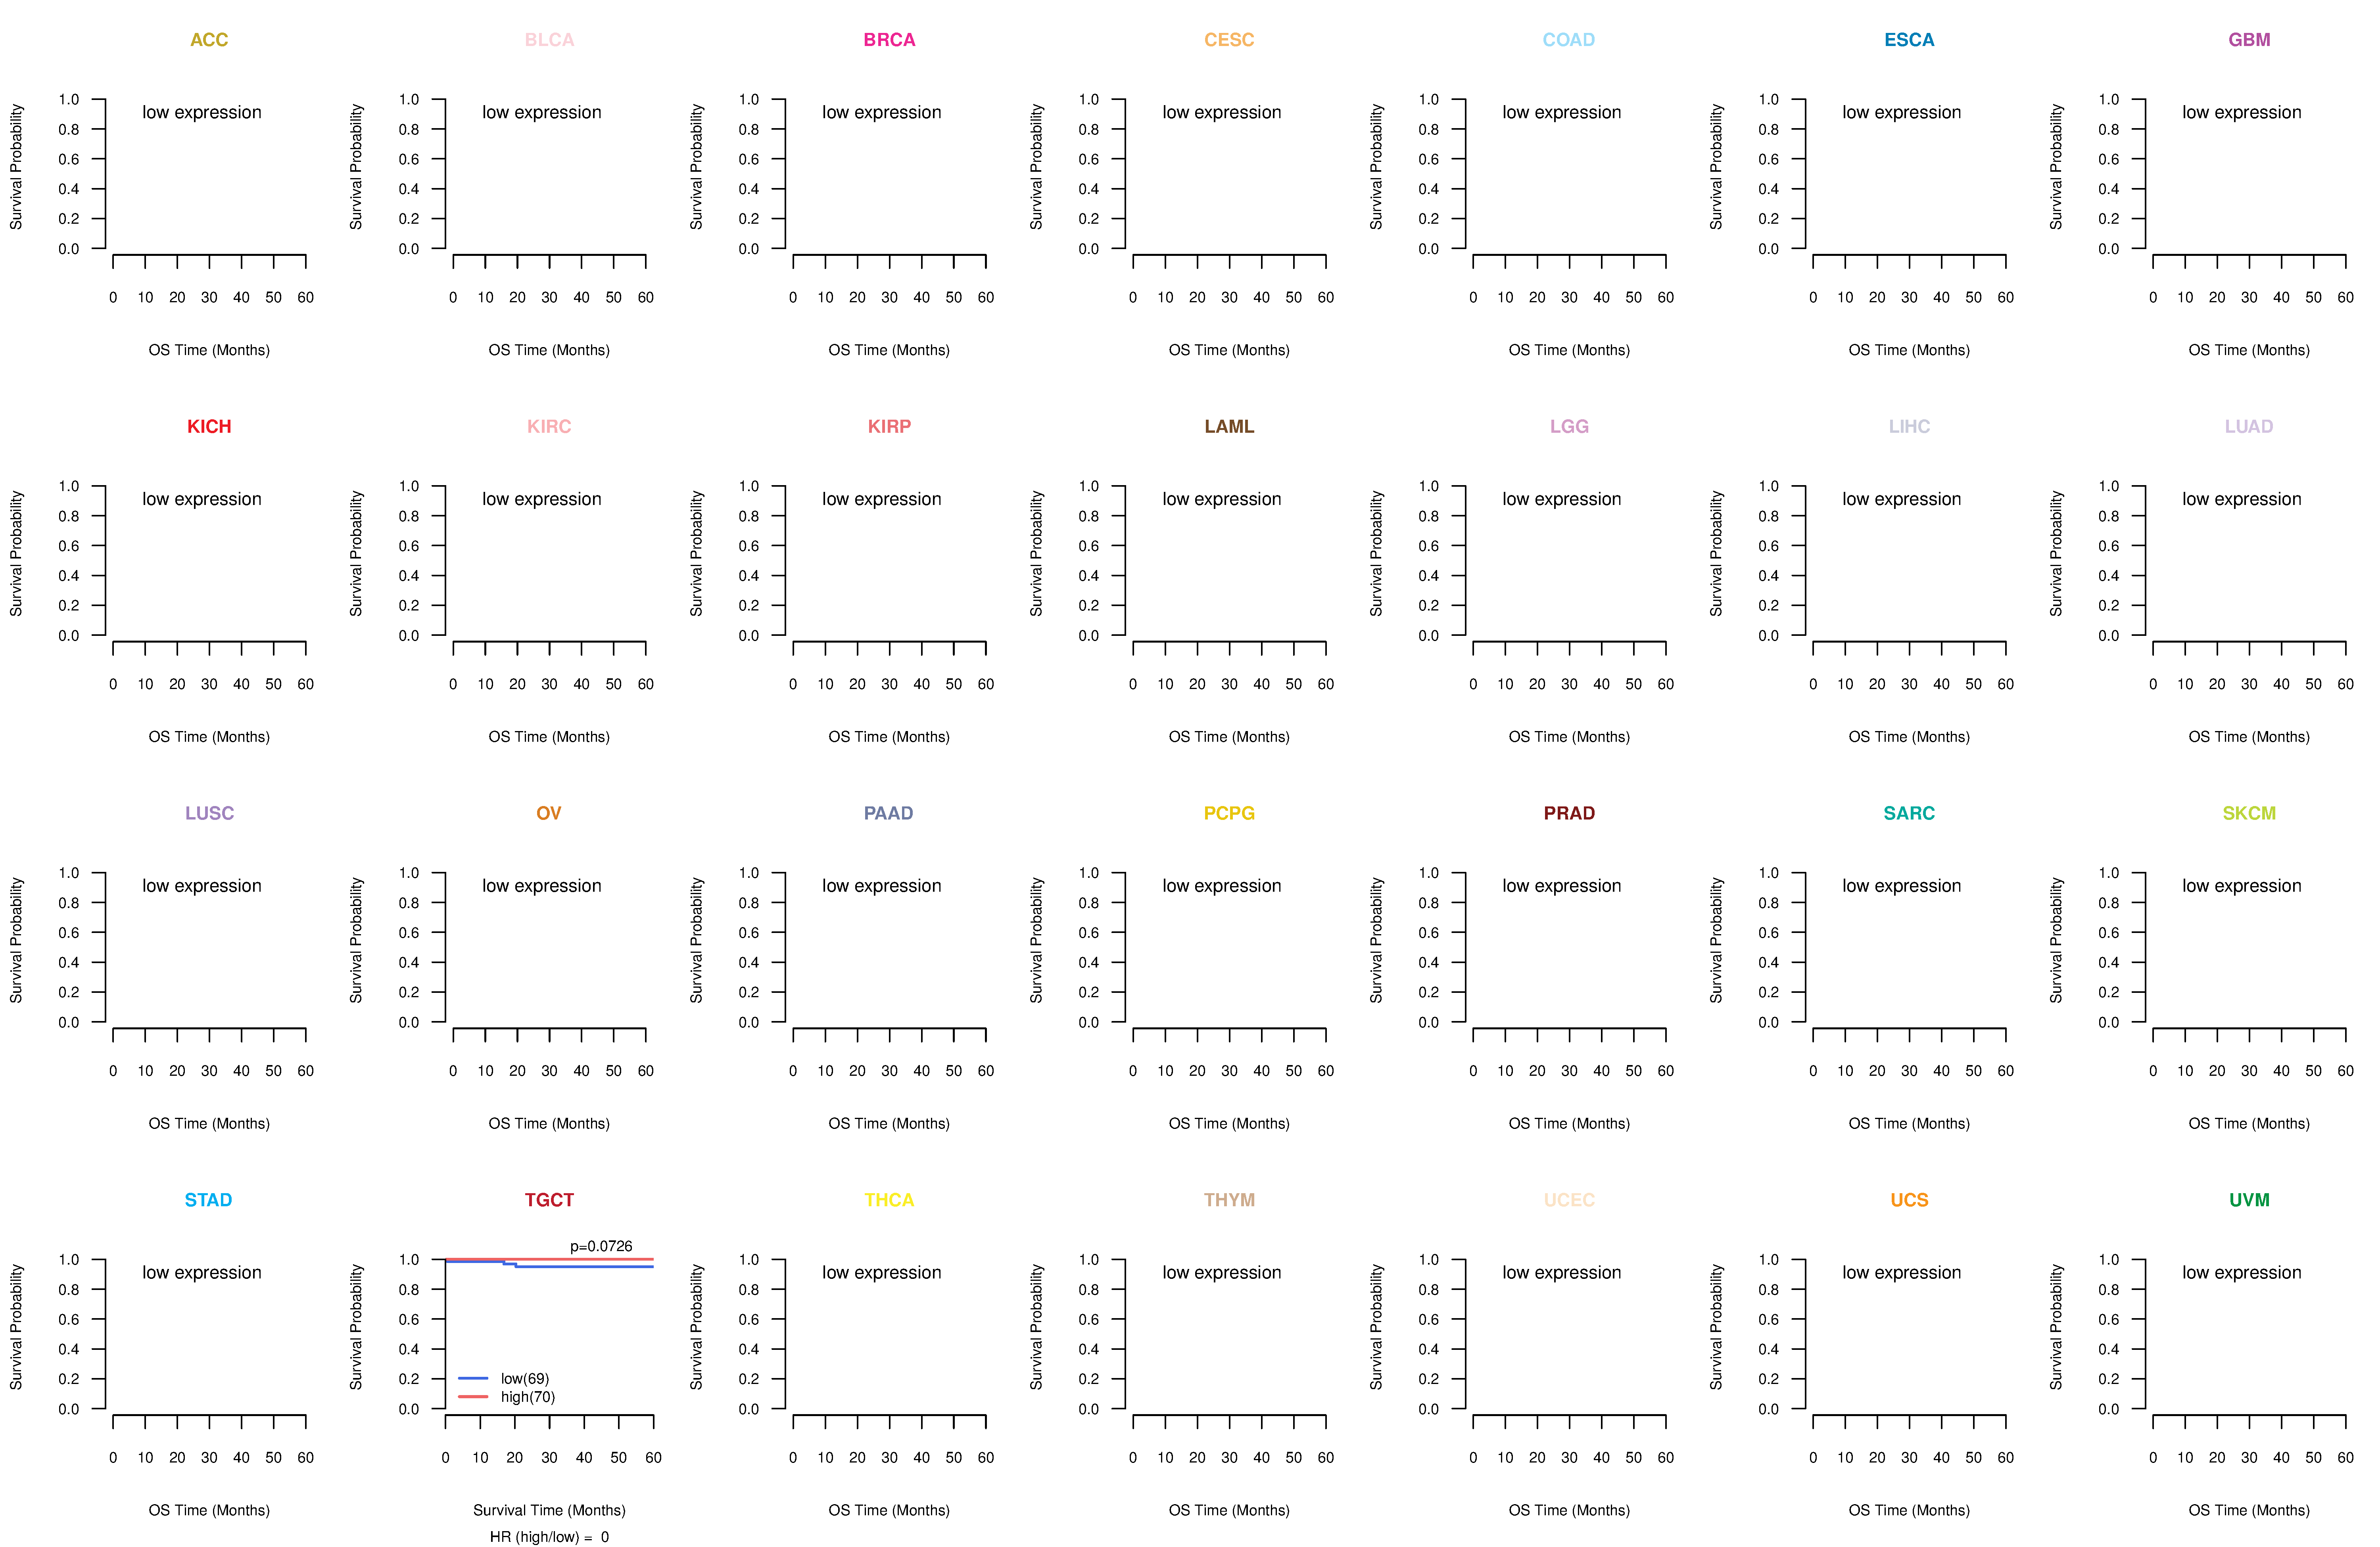
| TissGeneProg for FTMT |
| Kaplan-Meier plots with logrank tests of overall survival (OS) using 28 cancer types (TCGA IlluminaHiSeq_RNASeqV2, pan-cancer normalized log2(norm_counts+1) data, version 2016-08-16) (TCGA clinicalMatrix, phenotype data, version 2016-04-27) * Click on the image to enlarge it in a new window. |
 |
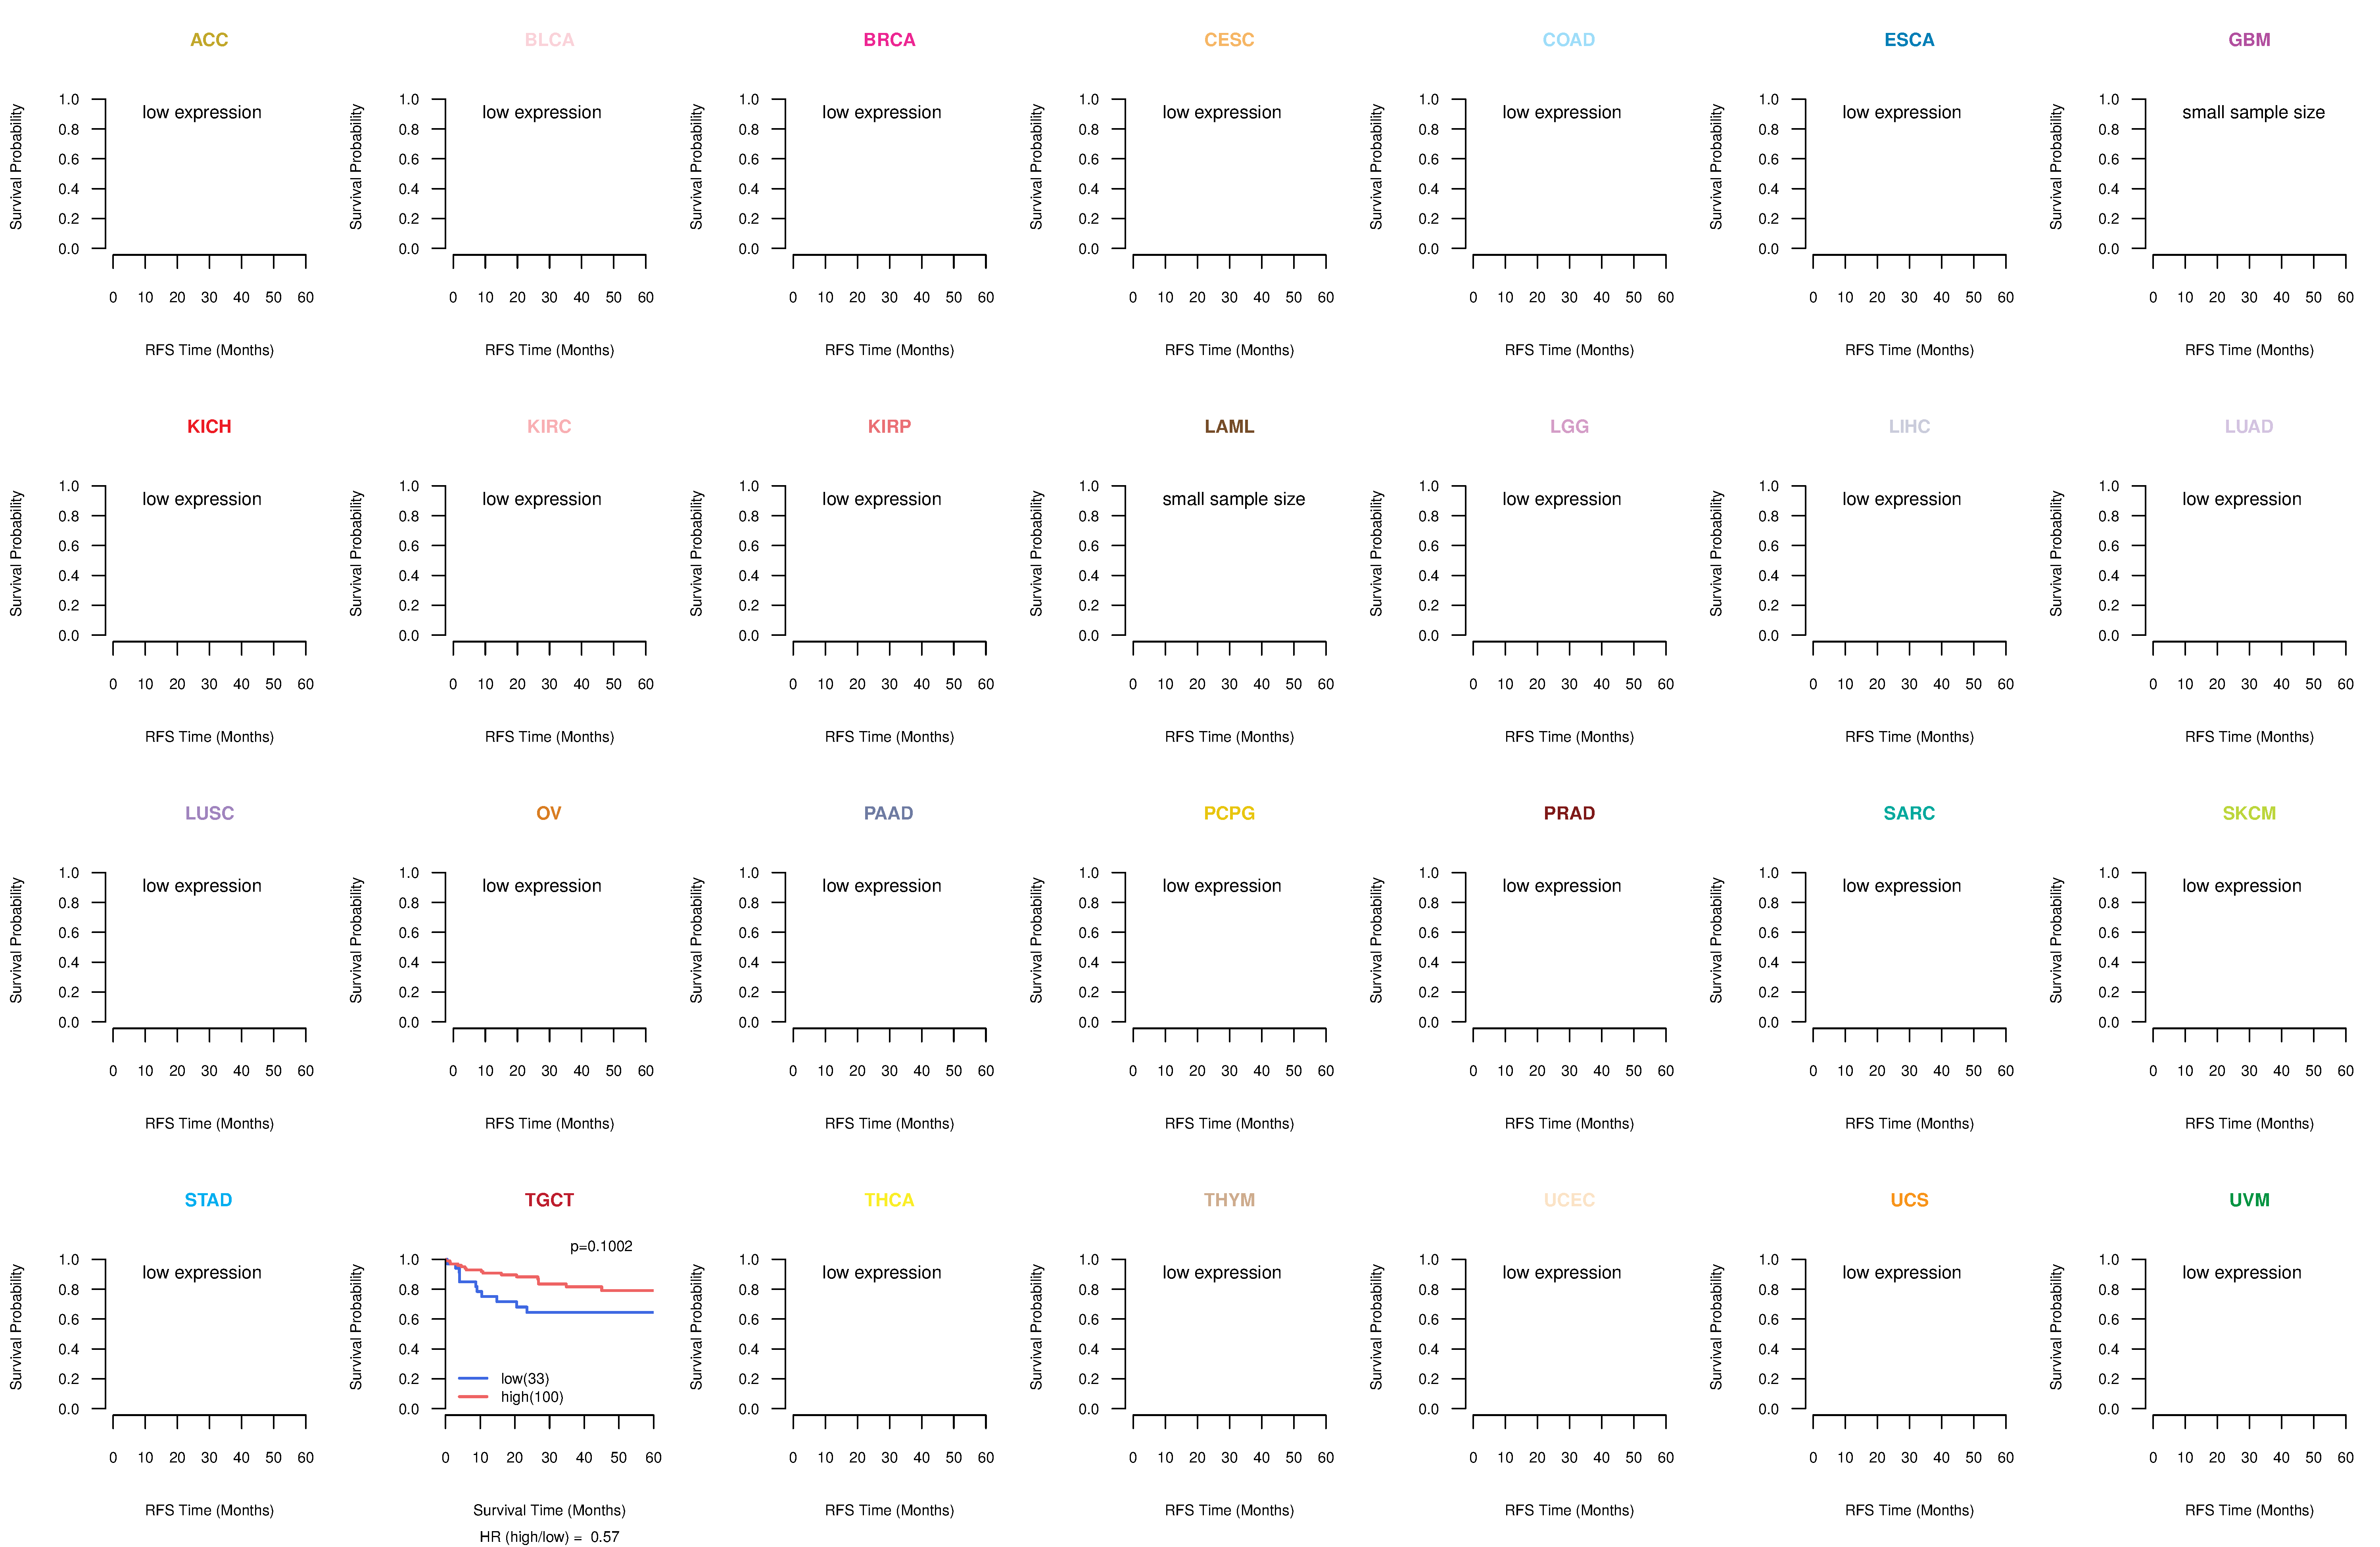
| Kaplan-Meier plots with logrank test of relapse free survival (RFS) using 28 cancer types (TCGA IlluminaHiSeq_RNASeqV2, pan-cancer normalized log2(norm_counts+1) data, version 2016-08-16) (TCGA clinicalMatrix, phenotype data, version 2016-04-27) * Click on the image enlarge it in a new window. |
 |
| Forest plot of Cox proportional hazard ratio (HR) and 95% CI of overall survival (OS) using 28 cancer types (TCGA IlluminaHiSeq_RNASeqV2, pan-cancer normalized log2(norm_counts+1) data, version 2016-08-16) (TCGA clinicalMatrix, phenotype data, version 2016-04-27) * Click on the image enlarge it in a new window. |
 |
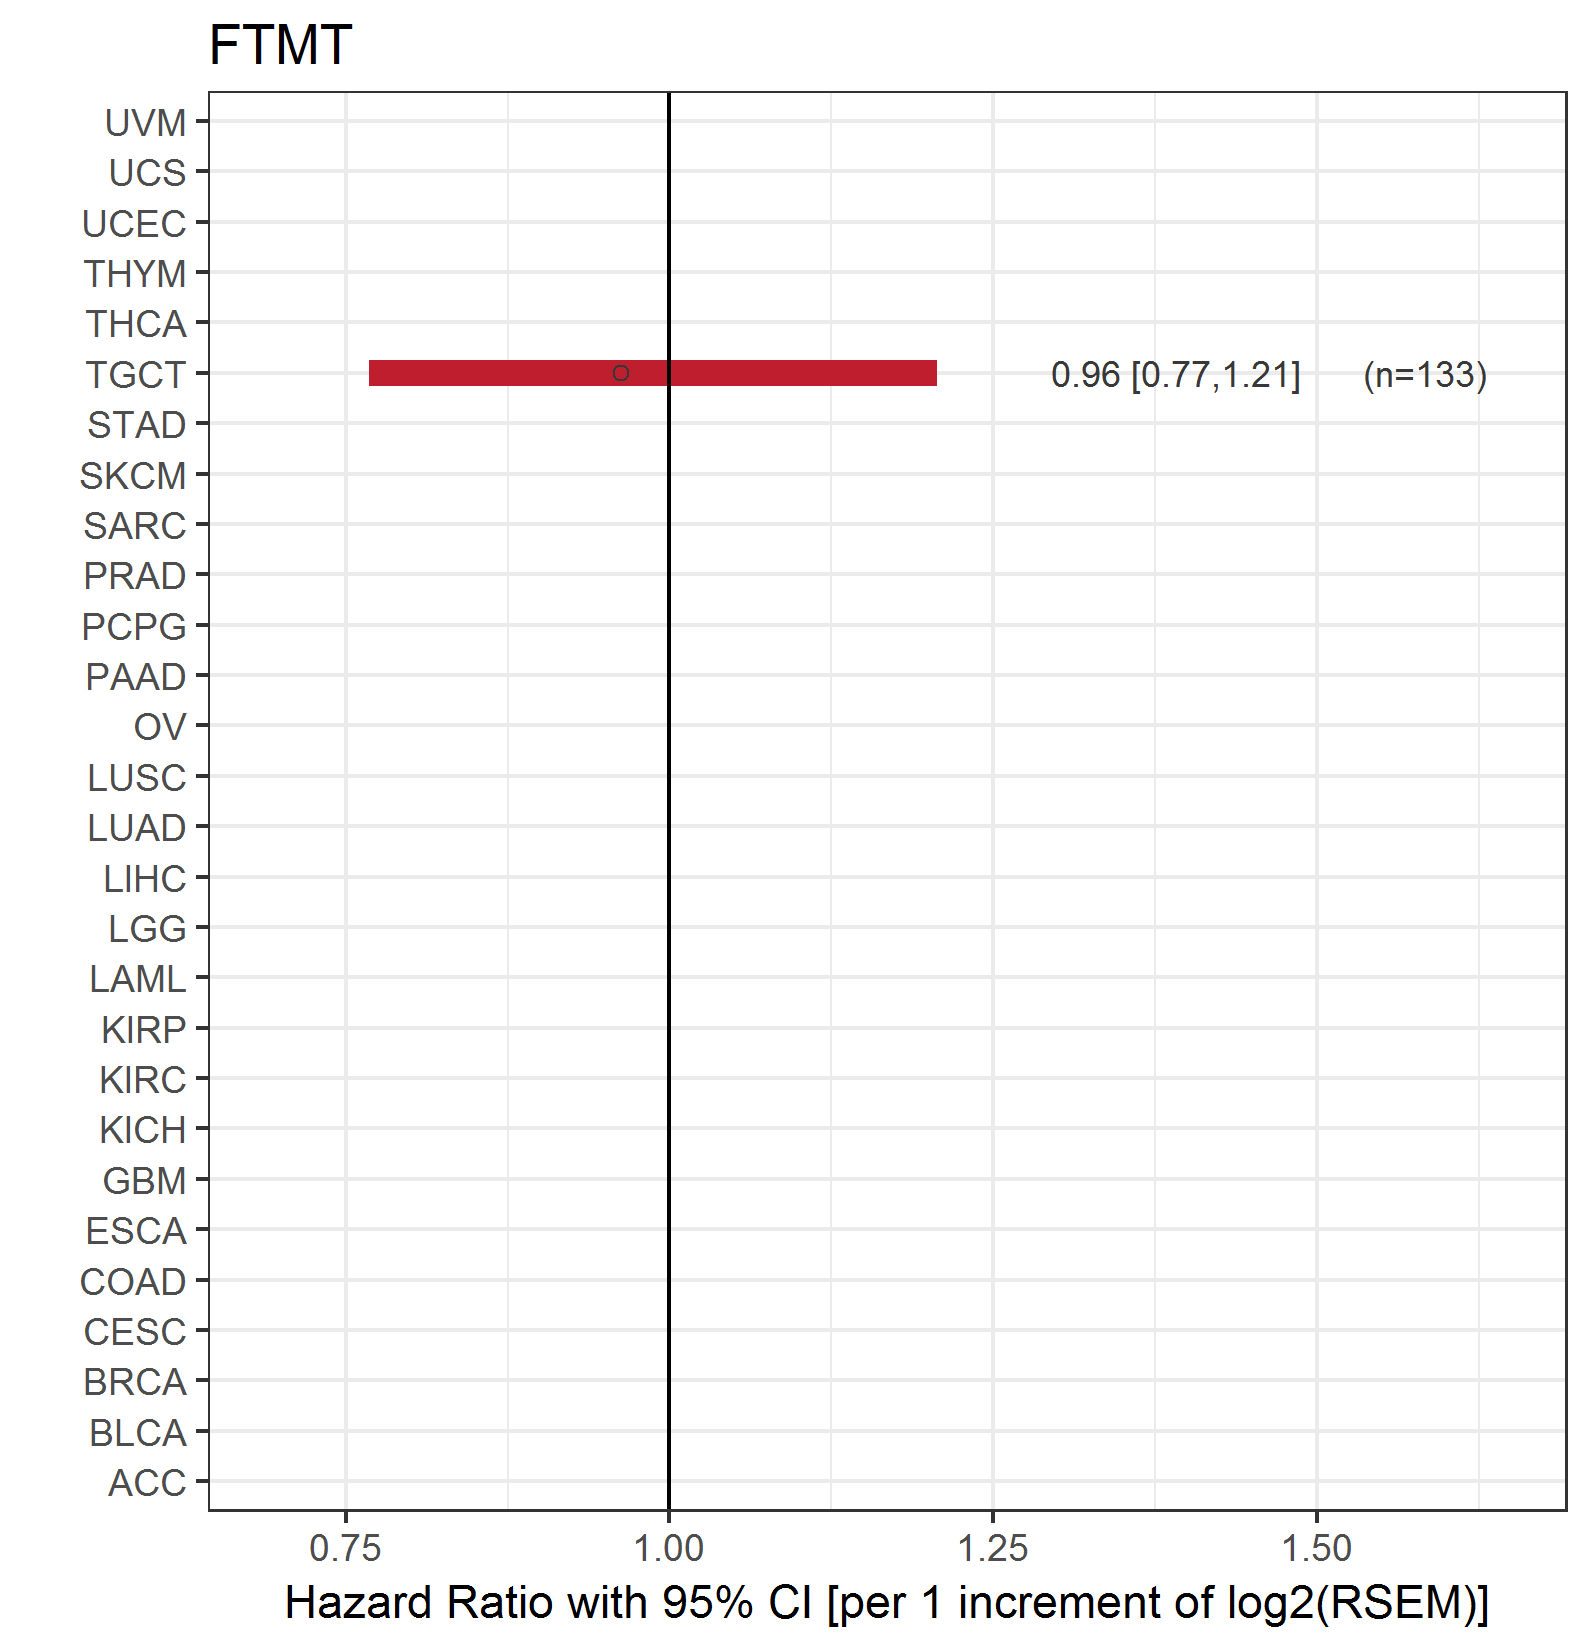
| Forest plot of Cox proportional hazard ratio (HR) and 95% CI of relapse free survival (RFS) using 28 cancer types (TCGA IlluminaHiSeq_RNASeqV2, pan-cancer normalized log2(norm_counts+1) data, version 2016-08-16) (TCGA clinicalMatrix, phenotype data, version 2016-04-27) * Click on the image enlarge it in a new window. |
 |
| Top |
| TissGeneClin for FTMT |
| TissGeneDrug for FTMT |
| Drug information targeting TissGene (DrugBank Version 5.0.6, 2017-04-01) |
| DrugBank ID | Drug name | Drug activity | Drug type | Drug status |
| Top |
| TissGeneDisease for FTMT |
| Disease information associated with TissGene (DisGeNet, 2016-06-01) |
| Disease ID | Disease name | # pubmeds | Source |
| umls:C0002893 | Refractory anemias | 4 | BeFree |
| umls:C2981142 | Refractory anemia, without ringed sideroblasts, without excess blasts | 3 | BeFree |
| umls:C0002871 | Anemia | 2 | BeFree |
| umls:C0027819 | Neuroblastoma | 2 | BeFree |
| umls:C0700095 | Central neuroblastoma | 2 | BeFree |
| umls:C0002896 | Sideroblastic anemia | 1 | BeFree,LHGDN |
| umls:C0016719 | Friedreich Ataxia | 1 | BeFree,LHGDN |
| umls:C0020459 | Hyperinsulinism | 1 | BeFree |
| umls:C0030567 | Parkinson Disease | 1 | GAD |
| umls:C0033027 | Preleukemia | 1 | GAD |
| umls:C0221018 | Hereditary sideroblastic anemia | 1 | BeFree |
| umls:C0242383 | Age related macular degeneration | 1 | BeFree |
| umls:C1305968 | Eccrine dermal cylindroma | 1 | BeFree |
| umls:C3463824 | MYELODYSPLASTIC SYNDROME | 1 | GAD |
|
Copyright 2016-Present - The University of Texas Health Science Center at Houston (UTHealth) Web File Viewing | How to Report, Fraud, Waste and Abuse | State of Texas | Statewide Search | Texas Homeland Security | Site Policies |