 |
| |
| |
| |
| |
| |
| |
|

| TissGeneSummary for ECEL1 |
 Gene summary Gene summary |
| Basic gene information | Gene symbol | ECEL1 |
| Gene name | endothelin converting enzyme-like 1 | |
| Synonyms | DA5D|DINE|ECEX|XCE | |
| Cytomap | UCSC genome browser: 2q37.1 | |
| Type of gene | protein-coding | |
| RefGenes | NM_001290787.1, NM_004826.3, | |
| Description | X converting enzymedamage induced neuronal endopeptidaseendothelin-converting enzyme-like 1 | |
| Modification date | 20141222 | |
| dbXrefs | MIM : 605896 | |
| HGNC : HGNC | ||
| Ensembl : ENSG00000171551 | ||
| HPRD : 07066 | ||
| Vega : OTTHUMG00000133262 | ||
| Protein | UniProt: go to UniProt's Cross Reference DB Table | |
| Expression | CleanEX: HS_ECEL1 | |
| BioGPS: 9427 | ||
| Pathway | NCI Pathway Interaction Database: ECEL1 | |
| KEGG: ECEL1 | ||
| REACTOME: ECEL1 | ||
| Pathway Commons: ECEL1 | ||
| Context | iHOP: ECEL1 | |
| ligand binding site mutation search in PubMed: ECEL1 | ||
| UCL Cancer Institute: ECEL1 | ||
| Assigned class in TissGDB* | B | |
| Included tissue-specific gene expression resources | HPA,TiGER,GTEx | |
| Specific-tissues in normal samples (assigned by TissGDB using HPA, TiGER, and GTEx) | OvaryEye | |
| Cancer types related to the specific-tissues in cancer samples (assigned by TissGDB using TCGA) | OVUVM | |
| Reference showing the relevant tissue of ECEL1 | ||
| Description by TissGene annotations | Protective TissGene in RFS | |
| * Class A consists of genes with literature evidence and is part of the cTissGenes. Class B consists of only cTissGenes without additional evidence. The remaining genes belong to Class C. |
| Gene ontology having evidence of Inferred from Direct Assay (IDA) from Entrez |
| GO ID | GO term | PubMed ID |
| Top |
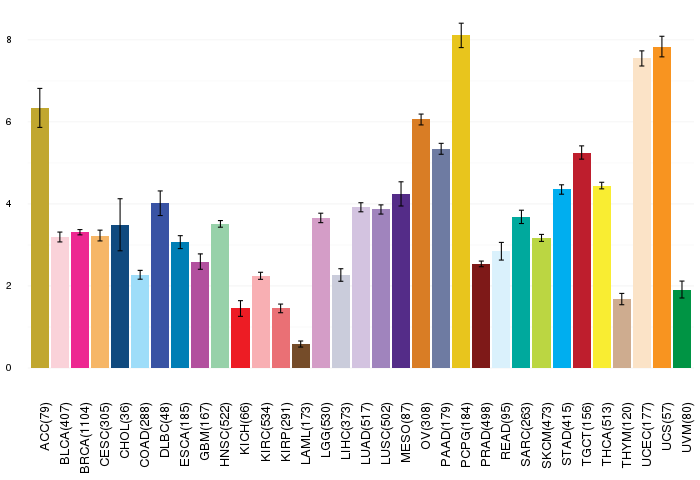
| TissGeneExp for ECEL1 |
| Gene expressions across 28 cancer types (X-axis: cancer type and Y-axis: log2(norm_counts+1)) (TCGA IlluminaHiSeq_RNASeqV2, pan-cancer normalized log2(norm_counts+1) data, version 2016-08-16) |
 |
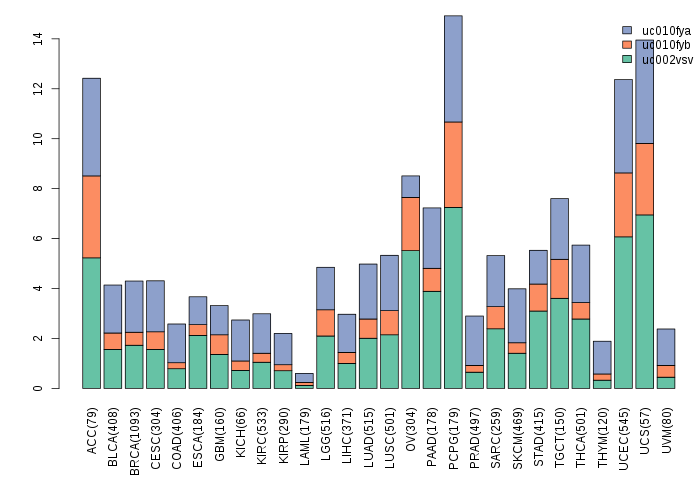
| Gene isoform expressions across 28 cancer types (X-axis: cancer type and Y-axis: log2(norm_counts+1)) (TCGA pan-cancer tcga_rsem_isoform_tpm, version 2016-09-01) |
 |
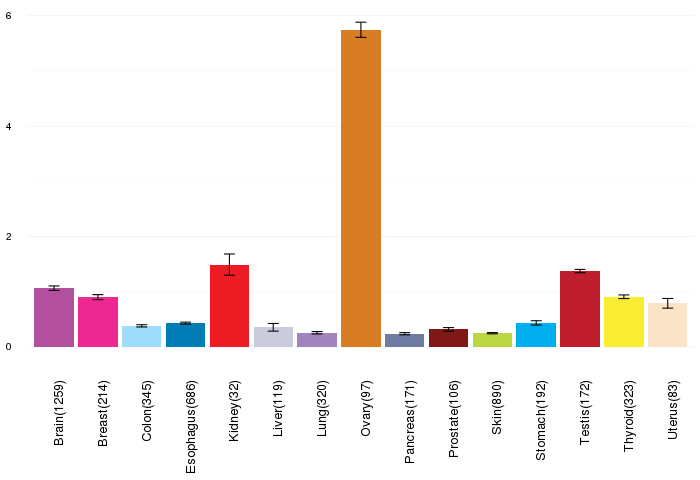
| Gene expressions across normal tissues of GTEx data (GTEx GTEx_Analysis_v6_RNA-seq_RNA-SeQCv1.1.8_gene_rpkm.gct) - Here, we shows the matched tissue types only among our 28 cancer types. |
 |
| Different expressions across 14 cancer types with more than 10 samples between matched tumors and normals (X-axis: cancer type and Y-axis: log2(norm_counts+1)) (TCGA IlluminaHiSeq_RNASeqV2, pan-cancer normalized log2(norm_counts+1) data, version 2016-08-16) |
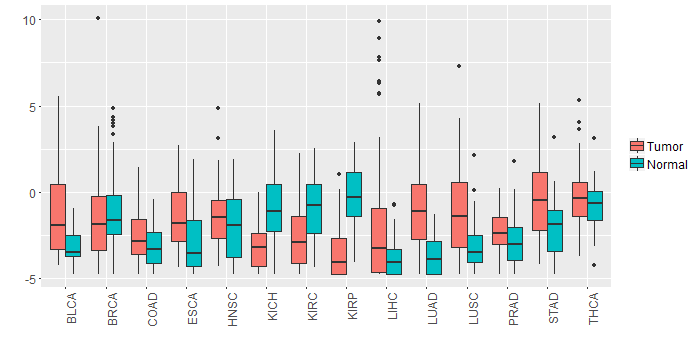 |
| - Significantly differentially expressed cancer types and information. (|Fold change|>1 and FDR<0.05) |
| Cancer type | Mean(exp) in tumor | Mean(exp) in matched normal | Log2FC | P-val. | FDR |
| KICH | -3.242111366 | -0.918331366 | -2.32378 | 2.27E-05 | 6.69E-05 |
| KIRP | -3.277702991 | -0.464099866 | -2.813603125 | 9.02E-08 | 5.48E-07 |
| KIRC | -2.469069311 | -1.040442922 | -1.428626389 | 8.77E-06 | 2.07E-05 |
| LUAD | -0.875645987 | -3.604839091 | 2.729193103 | 3.00E-11 | 1.95E-10 |
| LUSC | -1.074126582 | -3.105432464 | 2.031305882 | 7.77E-06 | 1.79E-05 |
| BLCA | -1.081961051 | -3.120708419 | 2.038747368 | 0.00609 | 0.030712381 |
| STAD | -0.422362366 | -2.128868616 | 1.70650625 | 0.00168 | 0.008004915 |
| LIHC | -1.438437366 | -3.884485366 | 2.446048 | 0.000289 | 0.000890248 |
| Top |
| TissGene-miRNA for ECEL1 |
| Significantly anti-correlated miRNAs of TissGene across 28 cancer types (Gene-miRNA relations from TargetScanHuman Relsease 7.1, Conserved_Site_Context_Scores.txt.zip, 06.01.2016) (TCGA IlluminaHiSeq_miRNASeq, log2(RPM+1) data, version 2016-11-21) (TCGA IlluminaHiSeq_RNASeqV2, log2(normalized_count+1) data, version 2016-08-16) (Spearman’s Rank Correlation (p-value<0.05 and coefficient<-0.25)) |
| Cancer type | miRNA id | miRNA accession | P-val. | Coeff. | # samples |
| Top |
| TissGeneMut for ECEL1 |
| TissGeneSNV for ECEL1 |
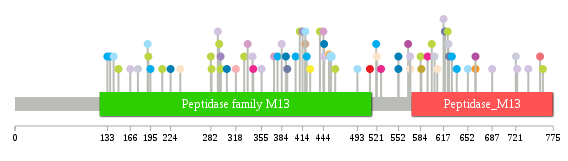
| nsSNV counts per each loci. Different colors of circles represent different cancer types. Circle size denotes number of samples. (TCGA somatic mutation (SNPs and small INDELs) data, version 2016-04-25) * Click on the image to enlarge it in a new window. |
 |
 |
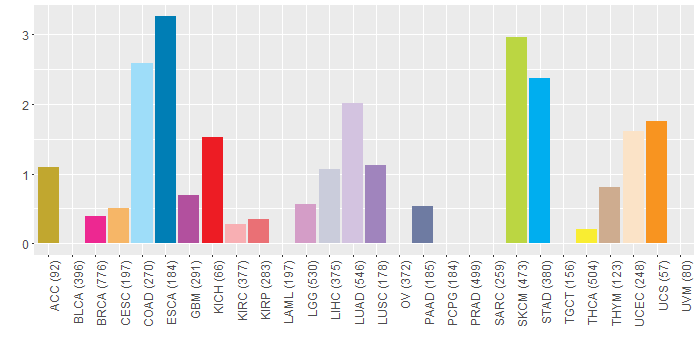
| Somatic nucleotide variants of TissGene across 28 cancer types (X-axis: cancer type and Y-axis: % of mutated samples) The numbers in parentheses are numbers of samples with mutation (nsSNVs). (TCGA somatic mutation (SNPs and small INDELs) data, version 2016-04-25) |
 |
| - nsSNVs sorted by frequency. |
| AAchange | Cancer type | # samples |
| p.A455T | COAD | 2 |
| p.A378V | STAD | 1 |
| p.M294I | SKCM | 1 |
| p.A569V | MESO | 1 |
| p.A224V | ESCA | 1 |
| p.V335I | LGG | 1 |
| p.A445T | LUAD | 1 |
| p.L270M | HNSC | 1 |
| p.Q624L | LIHC | 1 |
| p.D594V | BRCA | 1 |
| p.A425V | THCA | 1 |
| p.R355G | LUAD | 1 |
| p.R404C | STAD | 1 |
| p.Y687N | LUAD | 1 |
| p.S410N | SKCM | 1 |
| p.R418H | COAD | 1 |
| p.R663W | UCS | 1 |
| p.R439Q | SKCM | 1 |
| p.R191C | COAD | 1 |
| p.D212N | SKCM | 1 |
| p.A420V | STAD | 1 |
| p.S414Y | LUSC | 1 |
| p.G617C | LUAD | 1 |
| p.R195Q | STAD | 1 |
| p.T608I | UCEC | 1 |
| p.Q177R | LIHC | 1 |
| p.D142E | COAD | 1 |
| p.R756W | KIRP | 1 |
| p.E527Q | BRCA | 1 |
| p.A569V | LUAD | 1 |
| p.A166E | LUAD | 1 |
| p.L270Q | HNSC | 1 |
| p.S283N | SKCM | 1 |
| p.A569V | UCEC | 1 |
| p.Q318E | KIRC | 1 |
| p.D520N | STAD | 1 |
| p.C760F | SKCM | 1 |
| p.I721V | LIHC | 1 |
| p.K552T | ESCA | 1 |
| p.V238M | UCEC | 1 |
| p.Q384H | LUAD | 1 |
| p.R137C | STAD | 1 |
| p.R296Q | LUSC | 1 |
| p.R723P | LUAD | 1 |
| p.R296Q | HNSC | 1 |
| p.E373* | LGG | 1 |
| p.S600F | SKCM | 1 |
| p.A445D | ESCA | 1 |
| p.P739T | LUAD | 1 |
| p.A585V | ACC | 1 |
| p.G629V | STAD | 1 |
| p.R652H | COAD | 1 |
| p.V342L | LUAD | 1 |
| p.E192K | SKCM | 1 |
| p.A305T | ESCA | 1 |
| p.A493T | COAD | 1 |
| p.H461P | SKCM | 1 |
| p.G511D | KICH | 1 |
| p.R390H | ESCA | 1 |
| p.T636M | STAD | 1 |
| p.Y625H | PAAD | 1 |
| p.R418H | THYM | 1 |
| p.D282N | SKCM | 1 |
| p.G604R | LIHC | 1 |
| p.E429D | HNSC | 1 |
| p.T392A | PAAD | 1 |
| p.K552R | ESCA | 1 |
| p.T149I | SKCM | 1 |
| p.P566L | GBM | 1 |
| p.A521D | UCEC | 1 |
| p.G623S | SKCM | 1 |
| p.L270K | HNSC | 1 |
| p.G133S | STAD | 1 |
| p.V292L | LUAD | 1 |
| p.T343M | BRCA | 1 |
| p.C649R | HNSC | 1 |
| p.R663W | GBM | 1 |
| p.Q444P | LGG | 1 |
| p.D330N | SKCM | 1 |
| p.A452V | CESC | 1 |
| p.R296Q | SKCM | 1 |
| p.P584S | SKCM | 1 |
| p.D619N | PAAD | 1 |
| Top |
| TissGeneCNV for ECEL1 |
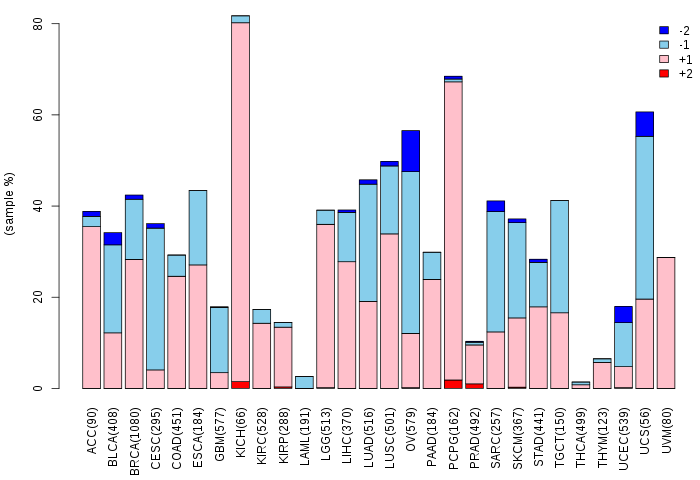
| Copy number variations of TissGene across 28 cancer types (X-axis: cancer type and Y-axis: % of CNV samples) (TCGA Gistic2_CopyNumber_Gistic2_all_data_by_genes, Gistic2 copy number data, version 2016-08-16) |
 |
| Top |
| TissGeneFusions for ECEL1 |
| Fusion genes including TissGene (ChimerDB 3.0, 2016-12-01 and TCGA fusion Portal 2015-12-01) |
| Database | Src | Cancer type | Sample | Fusion gene | ORF | 5'-gene BP | 3'-gene BP |
| Top |
| TissGeneNet for ECEL1 |
| Co-expressed gene networks based on protein-protein interaction data (CePIN) (TCGA IlluminaHiSeq_RNASeqV2, pan-cancer normalized log2(norm_counts+1) data, version 2016-08-16) (PINA2 ppi data) |
| Top |
| TissGeneProg for ECEL1 |
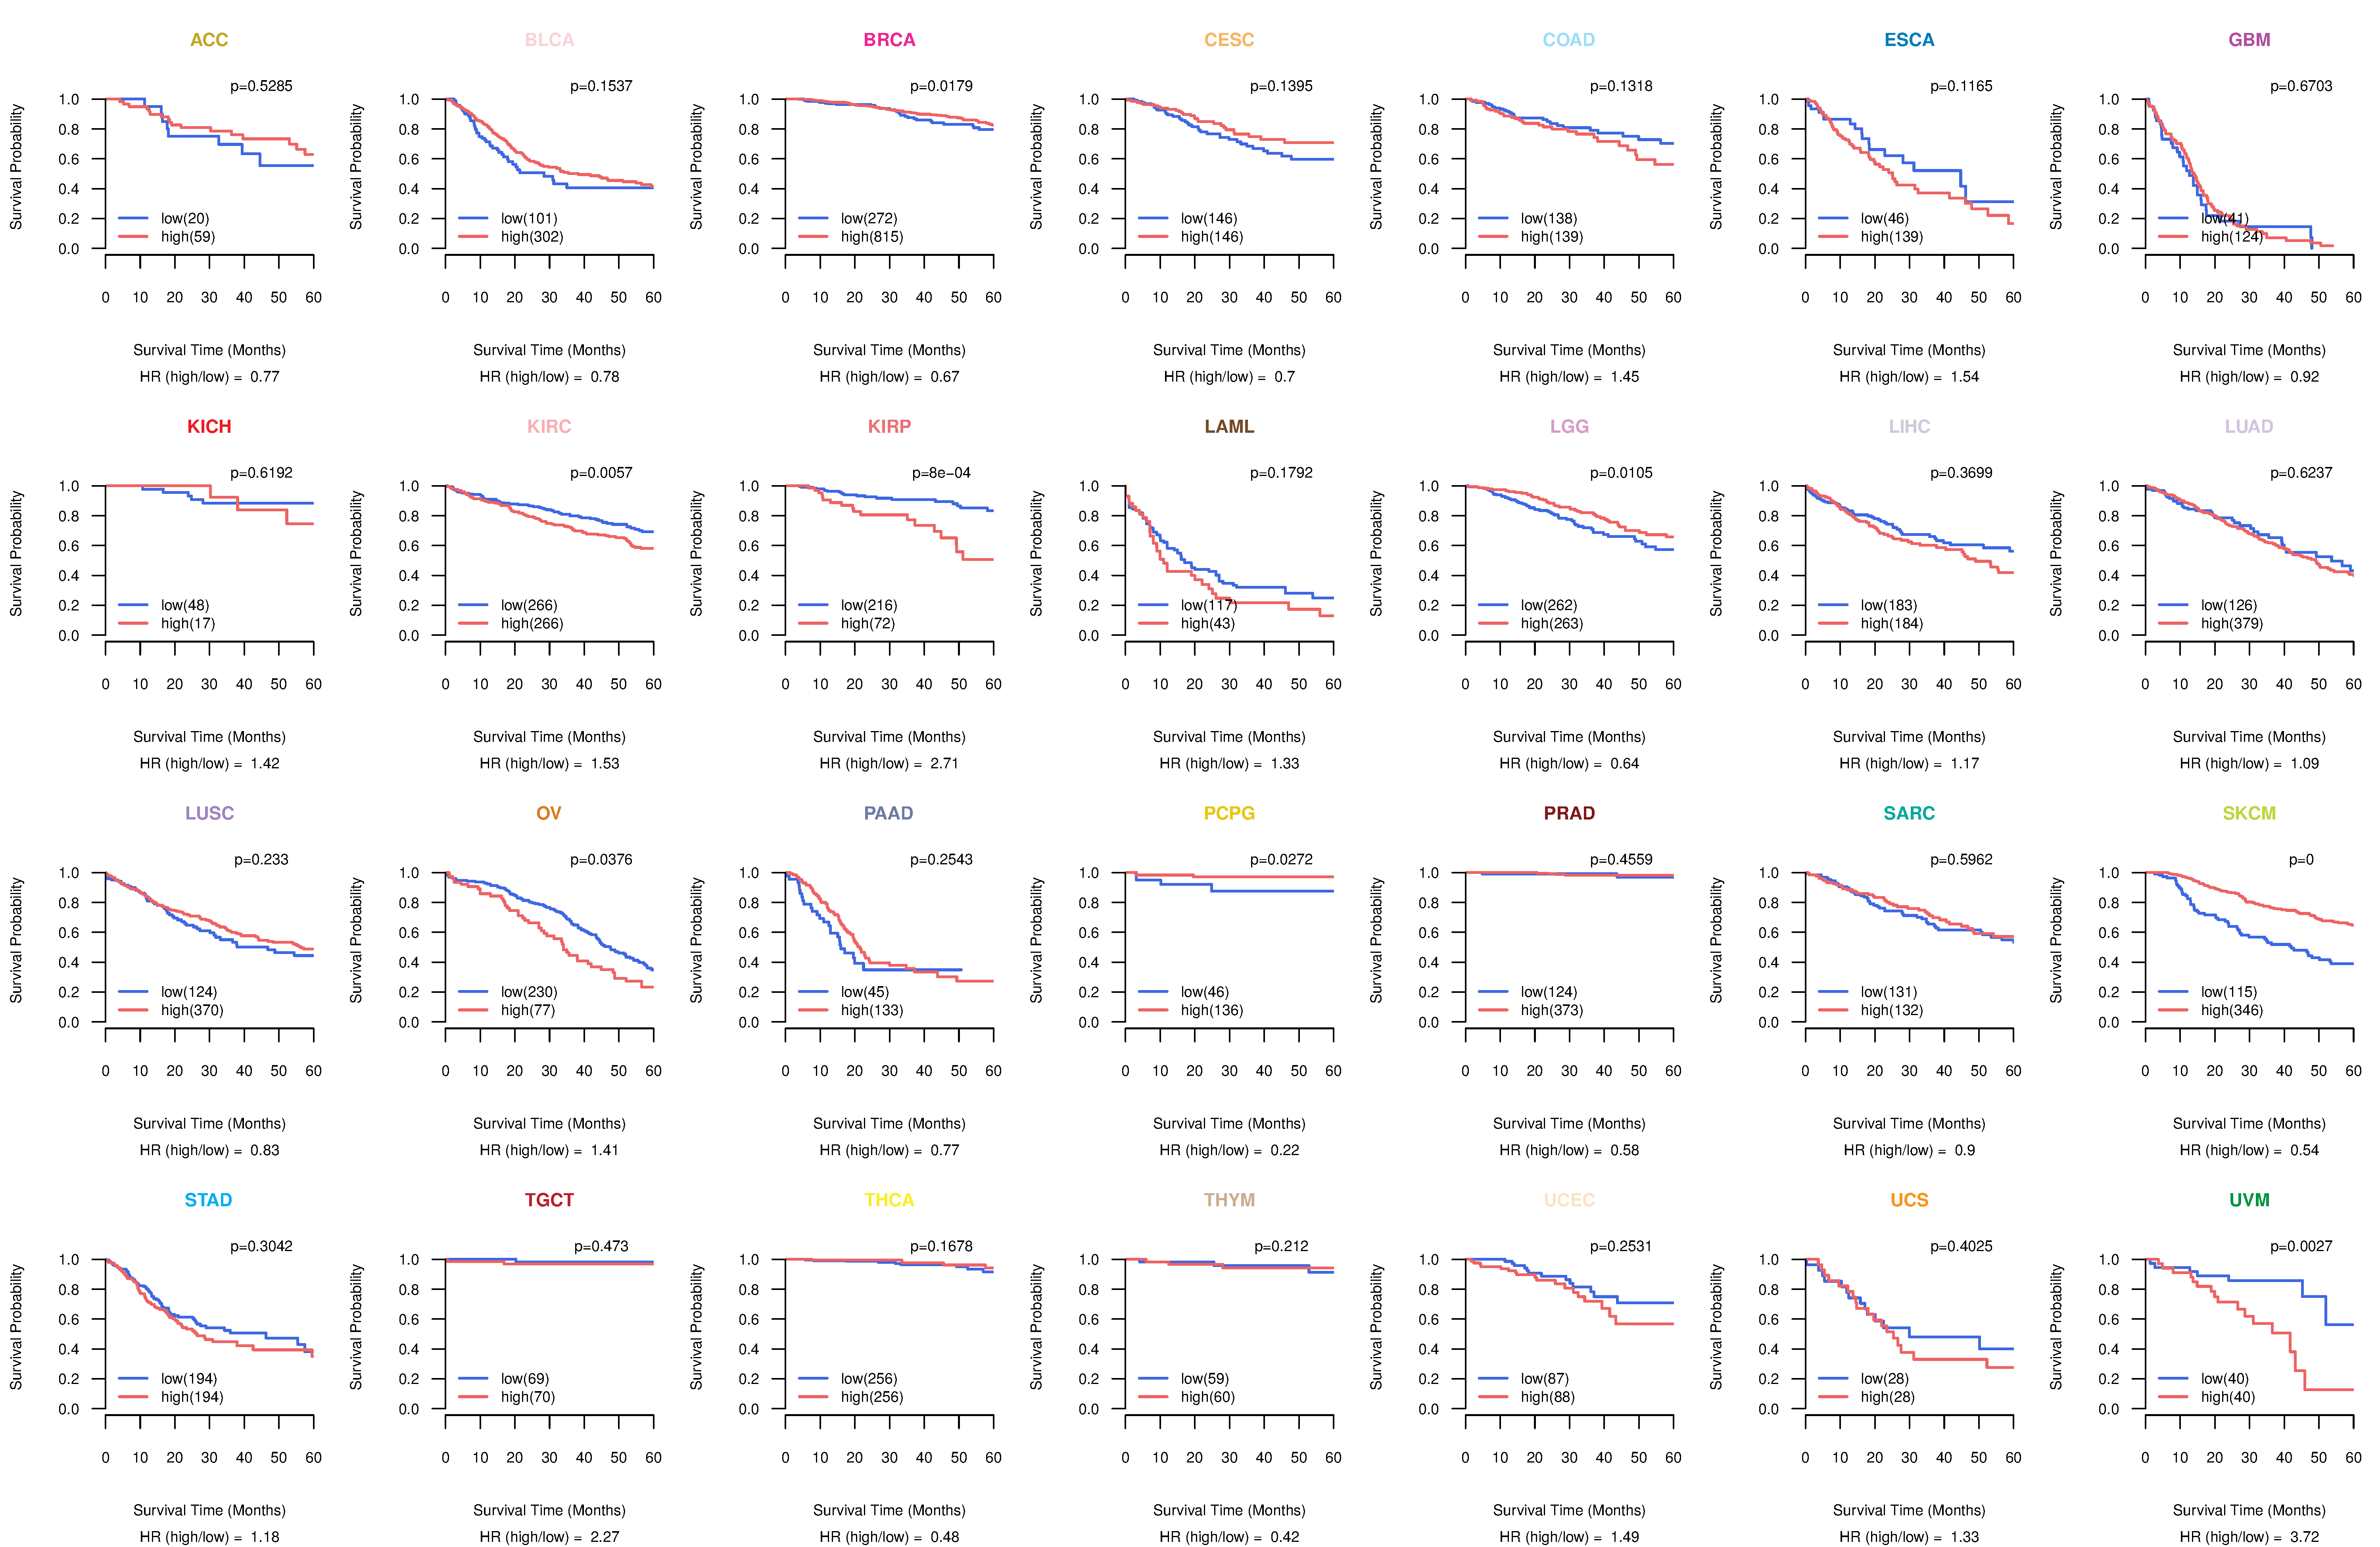
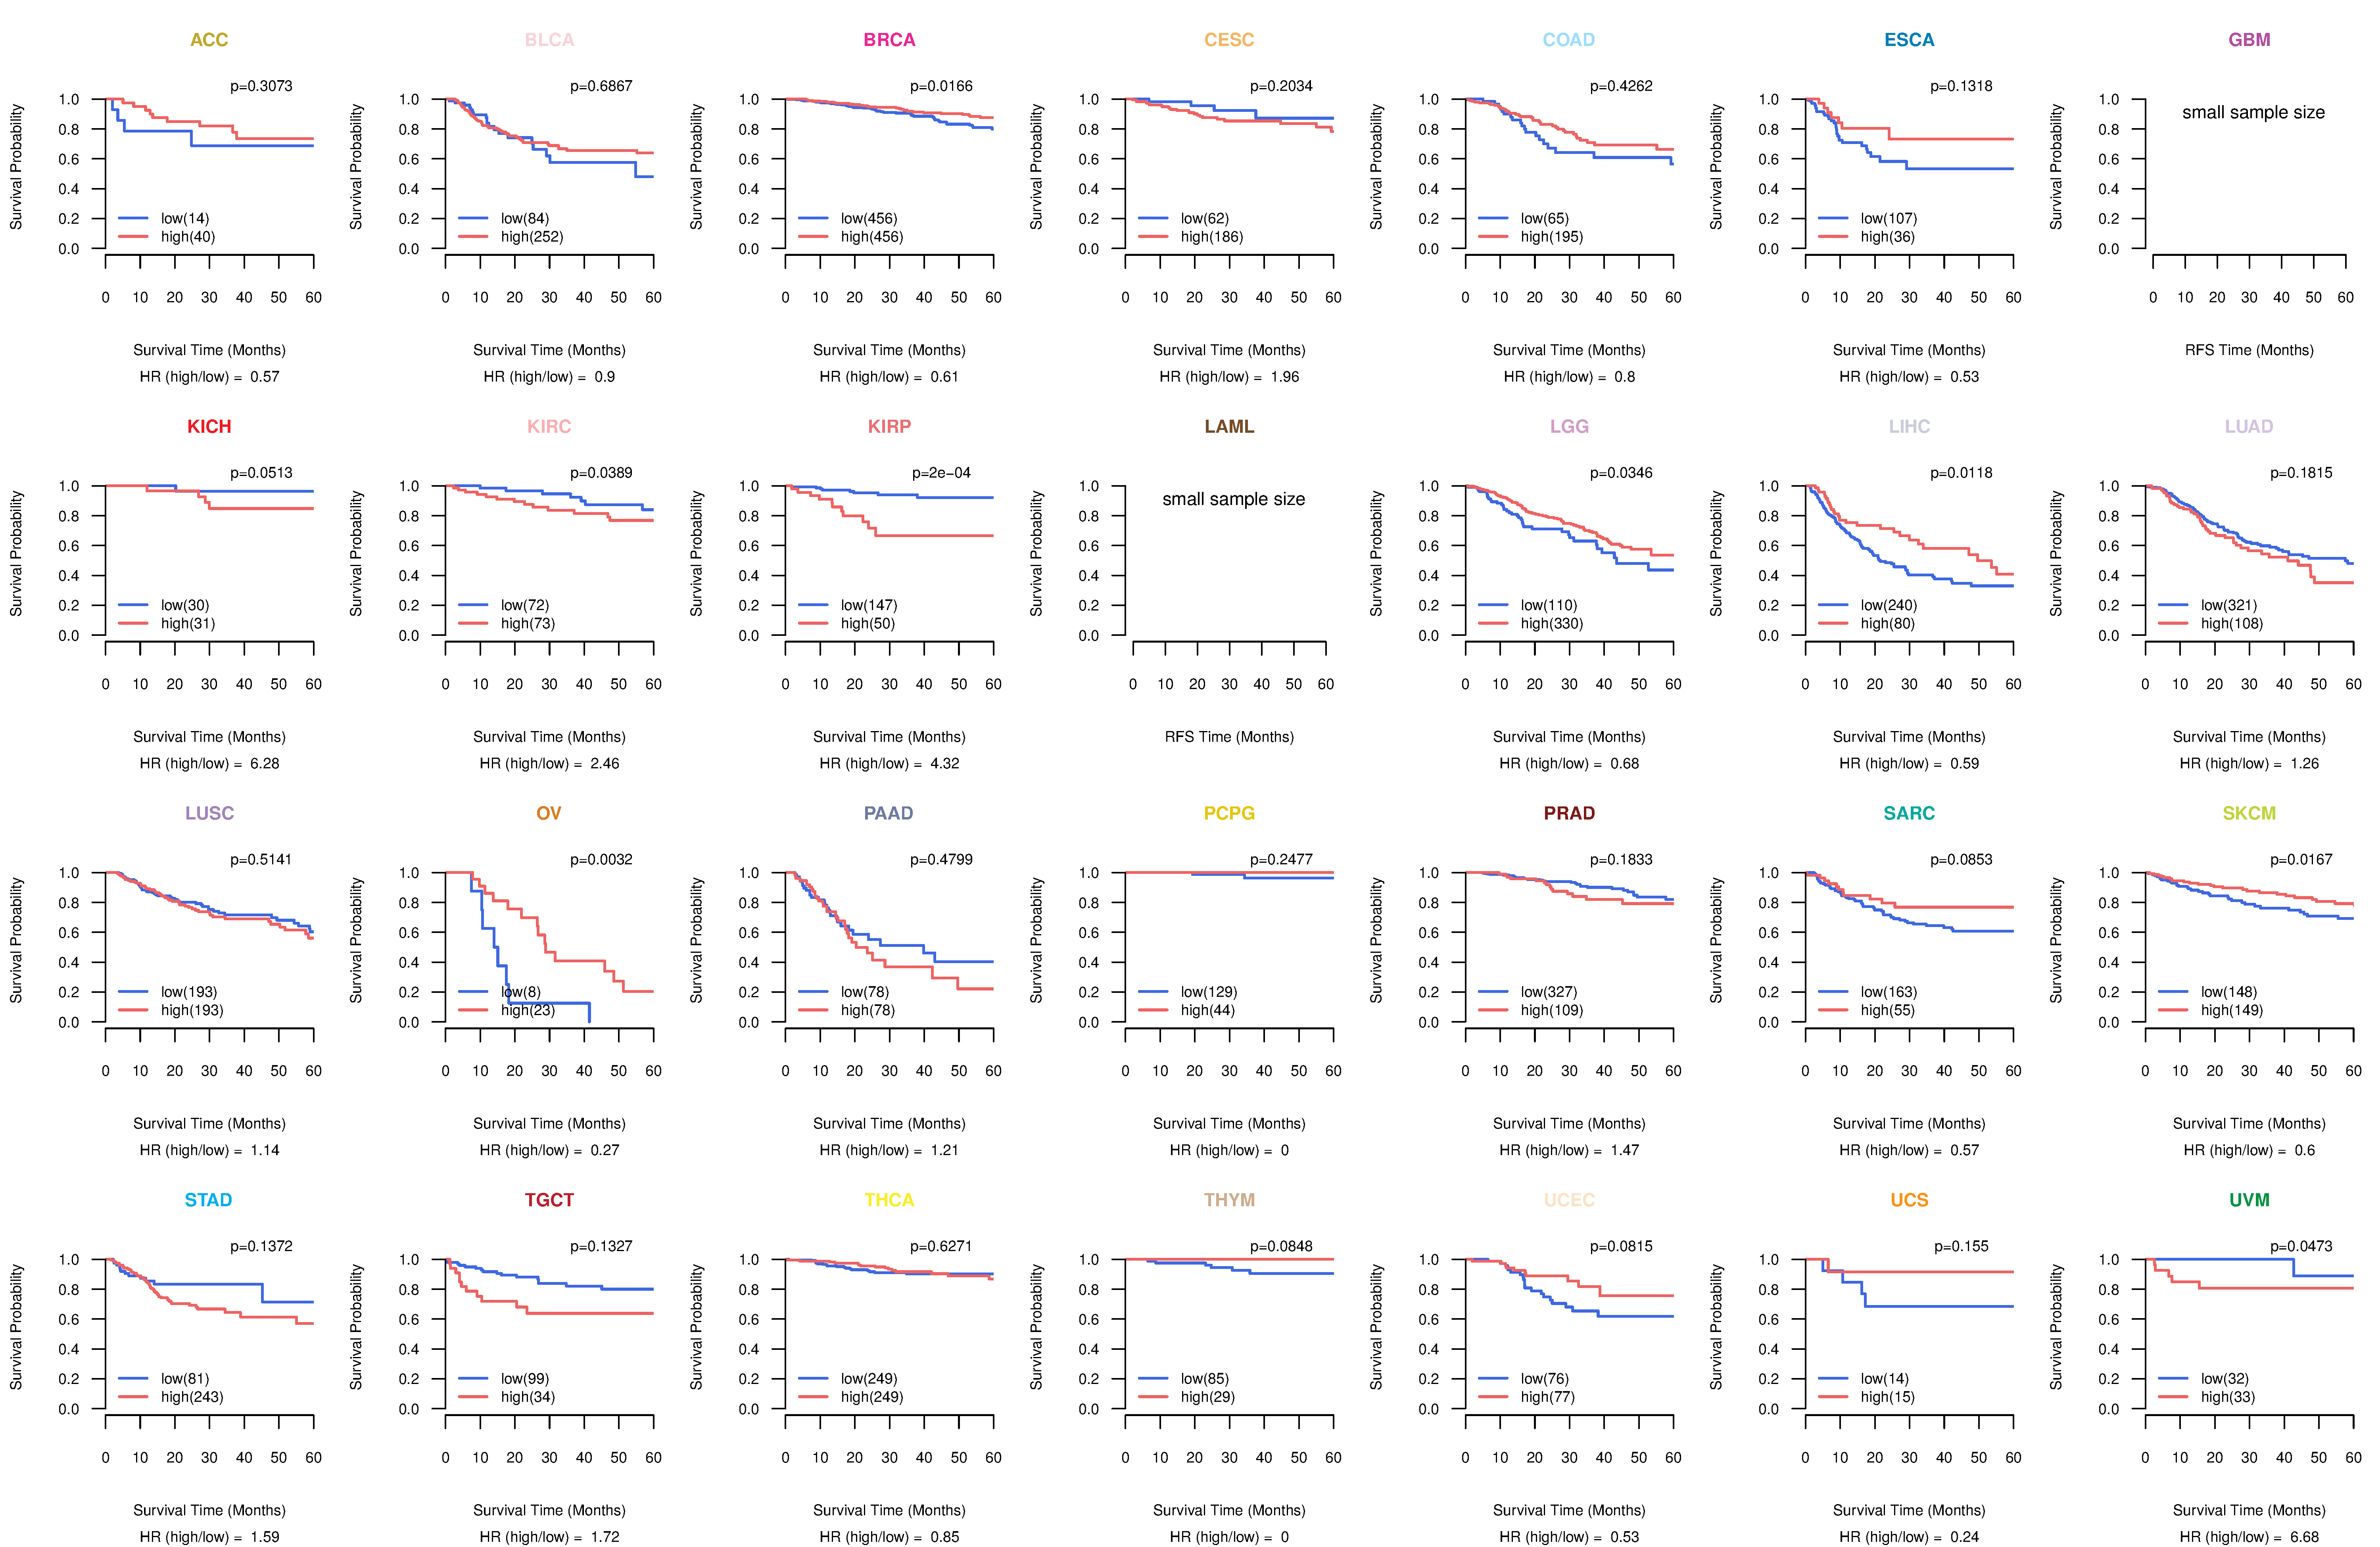
| Kaplan-Meier plots with logrank tests of overall survival (OS) using 28 cancer types (TCGA IlluminaHiSeq_RNASeqV2, pan-cancer normalized log2(norm_counts+1) data, version 2016-08-16) (TCGA clinicalMatrix, phenotype data, version 2016-04-27) * Click on the image to enlarge it in a new window. |
 |
| Kaplan-Meier plots with logrank test of relapse free survival (RFS) using 28 cancer types (TCGA IlluminaHiSeq_RNASeqV2, pan-cancer normalized log2(norm_counts+1) data, version 2016-08-16) (TCGA clinicalMatrix, phenotype data, version 2016-04-27) * Click on the image enlarge it in a new window. |
 |
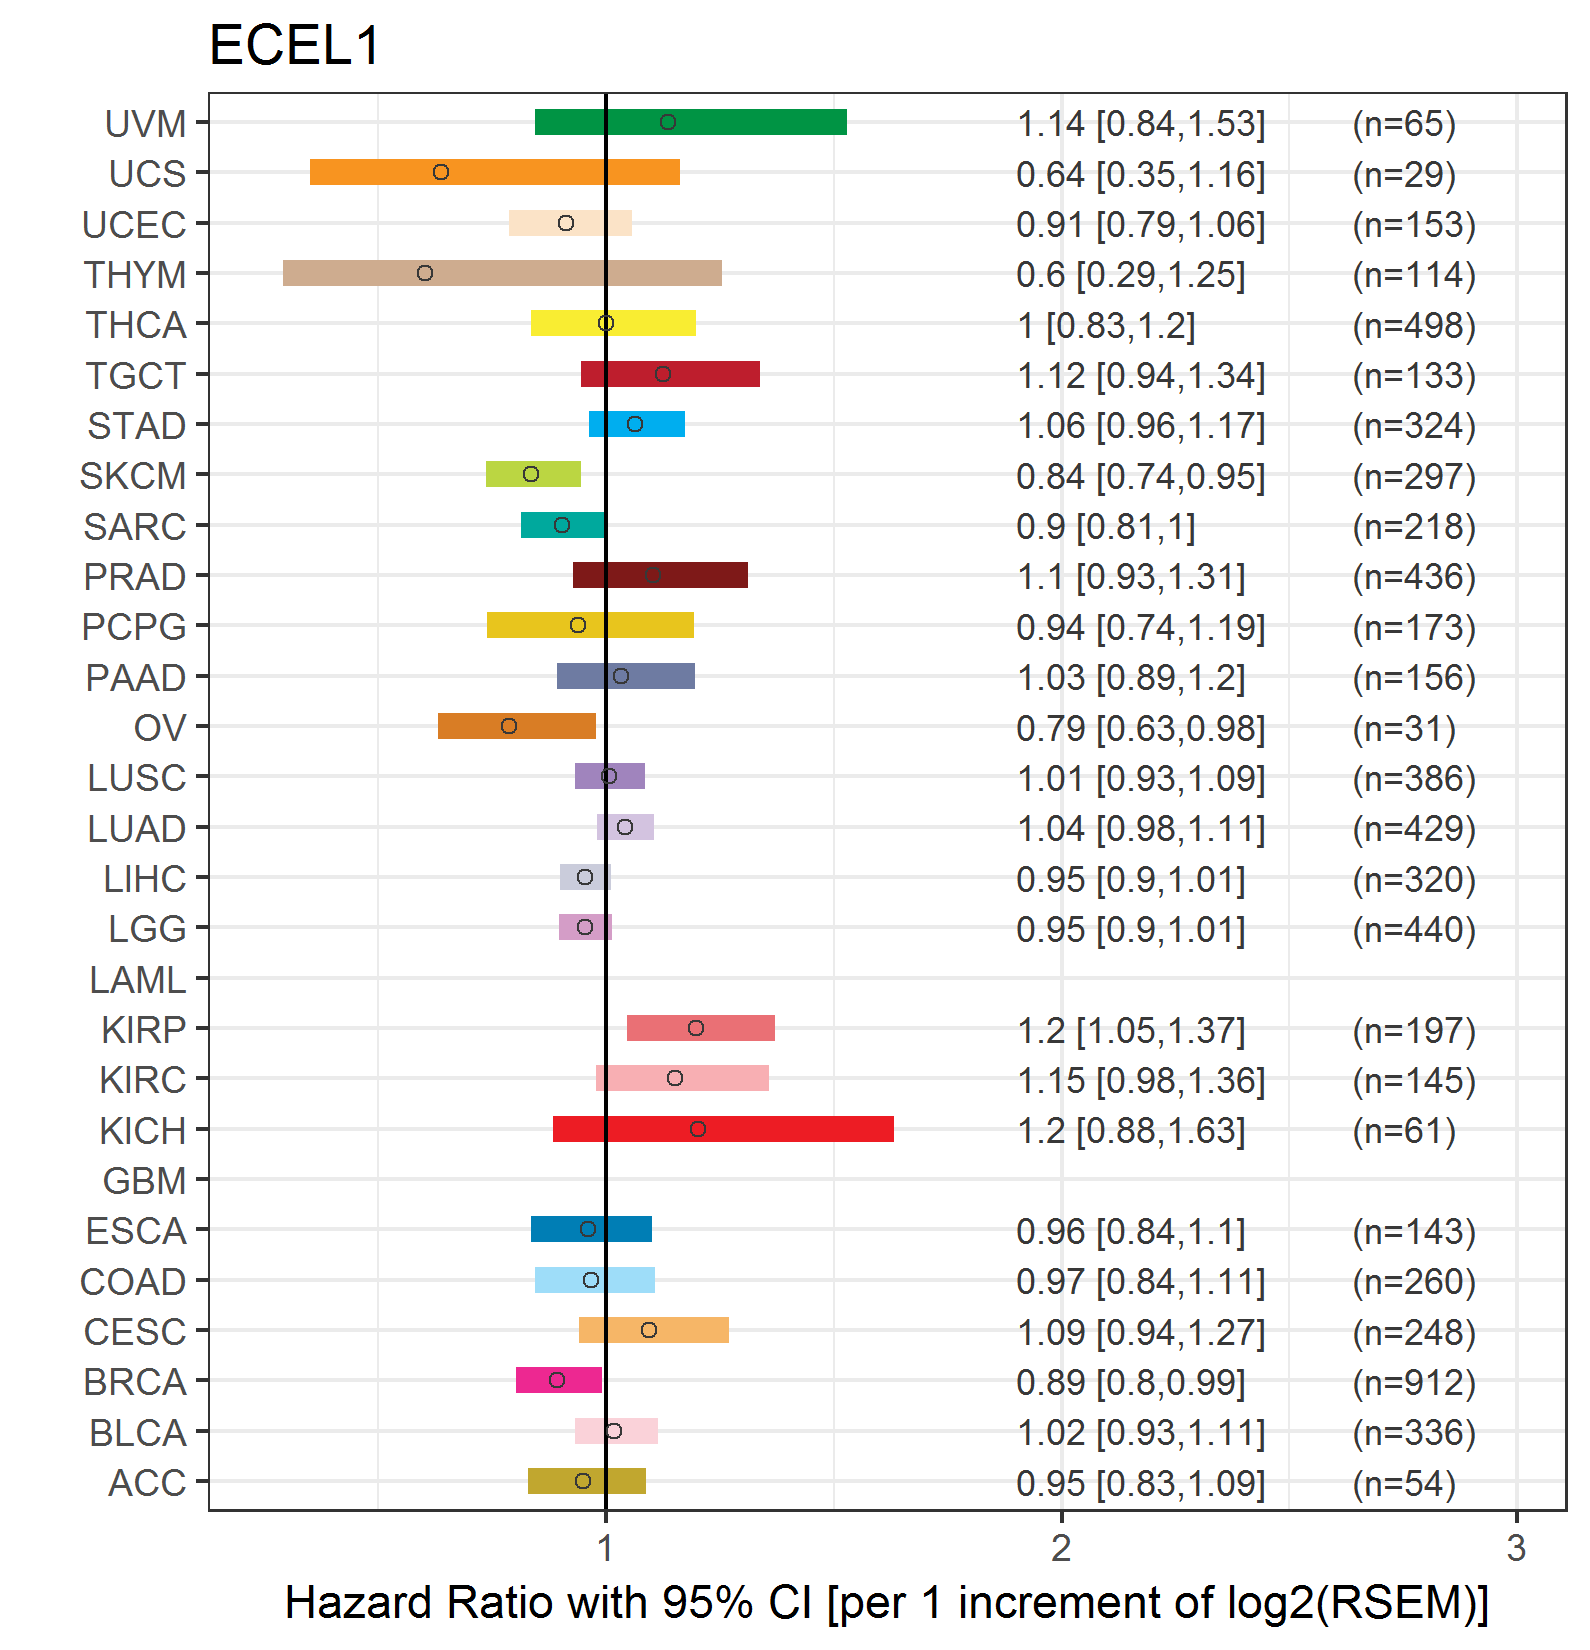
| Forest plot of Cox proportional hazard ratio (HR) and 95% CI of overall survival (OS) using 28 cancer types (TCGA IlluminaHiSeq_RNASeqV2, pan-cancer normalized log2(norm_counts+1) data, version 2016-08-16) (TCGA clinicalMatrix, phenotype data, version 2016-04-27) * Click on the image enlarge it in a new window. |
 |
| Forest plot of Cox proportional hazard ratio (HR) and 95% CI of relapse free survival (RFS) using 28 cancer types (TCGA IlluminaHiSeq_RNASeqV2, pan-cancer normalized log2(norm_counts+1) data, version 2016-08-16) (TCGA clinicalMatrix, phenotype data, version 2016-04-27) * Click on the image enlarge it in a new window. |
 |
| Top |
| TissGeneClin for ECEL1 |
| TissGeneDrug for ECEL1 |
| Drug information targeting TissGene (DrugBank Version 5.0.6, 2017-04-01) |
| DrugBank ID | Drug name | Drug activity | Drug type | Drug status |
| Top |
| TissGeneDisease for ECEL1 |
| Disease information associated with TissGene (DisGeNet, 2016-06-01) |
| Disease ID | Disease name | # pubmeds | Source |
| umls:C0265213 | Distal arthrogryposis syndrome | 5 | BeFree |
| umls:C3554415 | ARTHROGRYPOSIS, DISTAL, TYPE 5D | 4 | CLINVAR,ORPHANET,UNIPROT |
| umls:C0005745 | Blepharoptosis | 3 | BeFree |
| umls:C0033377 | Ptosis | 3 | BeFree |
| umls:C0003886 | Arthrogryposis | 2 | BeFree |
| umls:C0027819 | Neuroblastoma | 2 | BeFree |
| umls:C0038379 | Strabismus | 2 | BeFree |
| umls:C0332878 | Congenital joint contractures | 2 | BeFree |
| umls:C0700095 | Central neuroblastoma | 2 | BeFree |
| umls:C0009917 | Contracture | 1 | BeFree |
| umls:C0013261 | Duane Retraction Syndrome | 1 | BeFree |
| umls:C0027868 | Neuromuscular Diseases | 1 | BeFree |
| umls:C0029089 | Ophthalmoplegia | 1 | BeFree |
| umls:C0158113 | Contracture of joint of hand | 1 | BeFree |
| umls:C0175709 | Centronuclear myopathy | 1 | BeFree |
| umls:C0221369 | Acquired Camptodactyly | 1 | BeFree |
| umls:C0234362 | Synkinesis | 1 | BeFree |
| umls:C0426070 | Flexed fetal attitude | 1 | BeFree |
| umls:C0685409 | Congenital Camptodactyly | 1 | BeFree |
| umls:C0752282 | Congenital Structural Myopathy | 1 | BeFree |
|
Copyright 2016-Present - The University of Texas Health Science Center at Houston (UTHealth) Web File Viewing | How to Report, Fraud, Waste and Abuse | State of Texas | Statewide Search | Texas Homeland Security | Site Policies |