 |
| |
| |
| |
| |
| |
| |
|

| TissGeneSummary for ITM2A |
 Gene summary Gene summary |
| Basic gene information | Gene symbol | ITM2A |
| Gene name | integral membrane protein 2A | |
| Synonyms | BRICD2A|E25A | |
| Cytomap | UCSC genome browser: Xq13.3-Xq21.2 | |
| Type of gene | protein-coding | |
| RefGenes | NM_001171581.1, NM_004867.4, | |
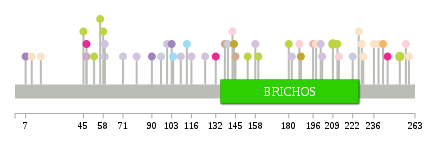
| Description | BRICHOS domain containing 2A | |
| Modification date | 20141222 | |
| dbXrefs | MIM : 300222 | |
| HGNC : HGNC | ||
| Ensembl : ENSG00000078596 | ||
| HPRD : 02200 | ||
| Vega : OTTHUMG00000021900 | ||
| Protein | UniProt: go to UniProt's Cross Reference DB Table | |
| Expression | CleanEX: HS_ITM2A | |
| BioGPS: 9452 | ||
| Pathway | NCI Pathway Interaction Database: ITM2A | |
| KEGG: ITM2A | ||
| REACTOME: ITM2A | ||
| Pathway Commons: ITM2A | ||
| Context | iHOP: ITM2A | |
| ligand binding site mutation search in PubMed: ITM2A | ||
| UCL Cancer Institute: ITM2A | ||
| Assigned class in TissGDB* | C | |
| Included tissue-specific gene expression resources | TiGER,GTEx | |
| Specific-tissues in normal samples (assigned by TissGDB using HPA, TiGER, and GTEx) | Bone marrowOvaryThymus | |
| Cancer types related to the specific-tissues in cancer samples (assigned by TissGDB using TCGA) | LAMLOVTHYM | |
| Reference showing the relevant tissue of ITM2A | ||
| Description by TissGene annotations | ||
| * Class A consists of genes with literature evidence and is part of the cTissGenes. Class B consists of only cTissGenes without additional evidence. The remaining genes belong to Class C. |
| Gene ontology having evidence of Inferred from Direct Assay (IDA) from Entrez |
| GO ID | GO term | PubMed ID |
| Top |
| TissGeneExp for ITM2A |
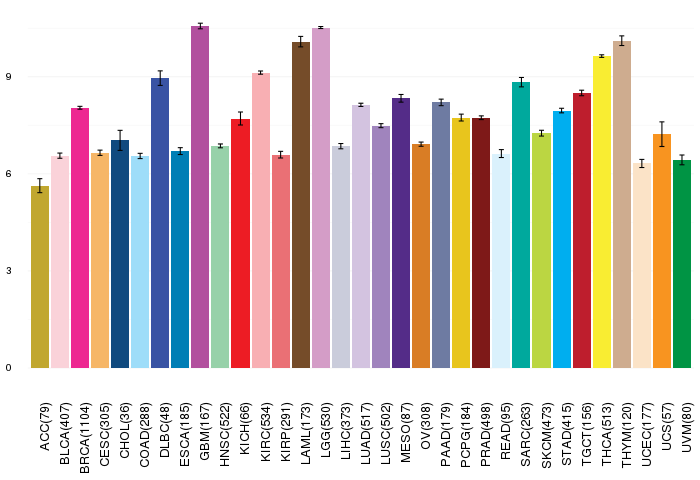
| Gene expressions across 28 cancer types (X-axis: cancer type and Y-axis: log2(norm_counts+1)) (TCGA IlluminaHiSeq_RNASeqV2, pan-cancer normalized log2(norm_counts+1) data, version 2016-08-16) |
 |
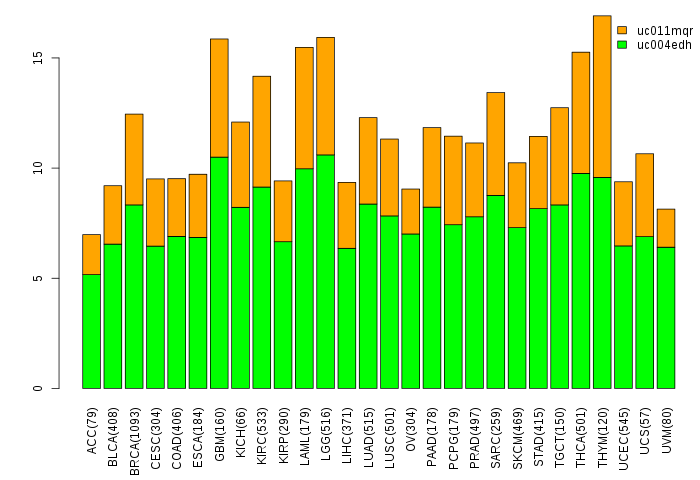
| Gene isoform expressions across 28 cancer types (X-axis: cancer type and Y-axis: log2(norm_counts+1)) (TCGA pan-cancer tcga_rsem_isoform_tpm, version 2016-09-01) |
 |
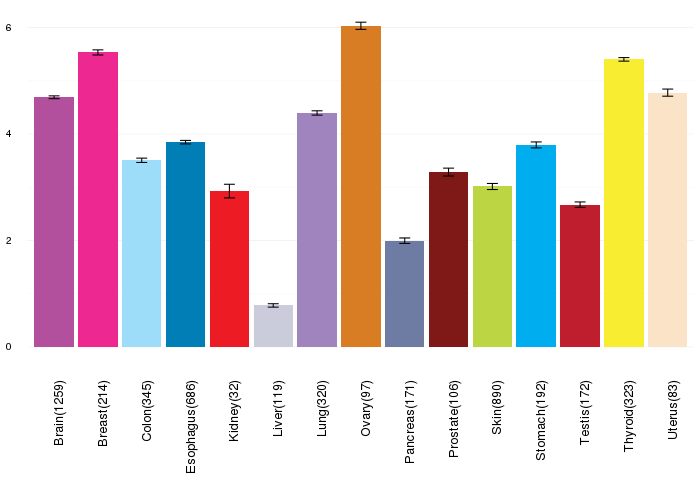
| Gene expressions across normal tissues of GTEx data (GTEx GTEx_Analysis_v6_RNA-seq_RNA-SeQCv1.1.8_gene_rpkm.gct) - Here, we shows the matched tissue types only among our 28 cancer types. |
 |
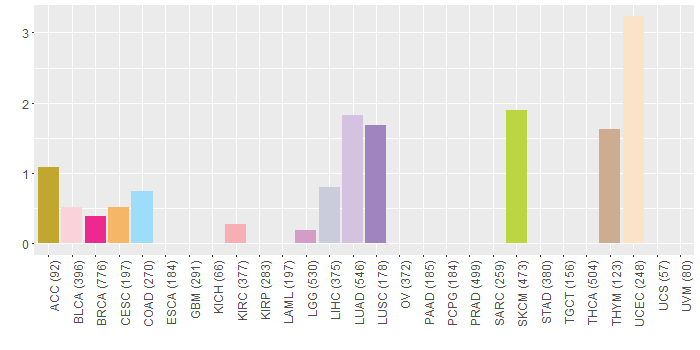
| Different expressions across 14 cancer types with more than 10 samples between matched tumors and normals (X-axis: cancer type and Y-axis: log2(norm_counts+1)) (TCGA IlluminaHiSeq_RNASeqV2, pan-cancer normalized log2(norm_counts+1) data, version 2016-08-16) |
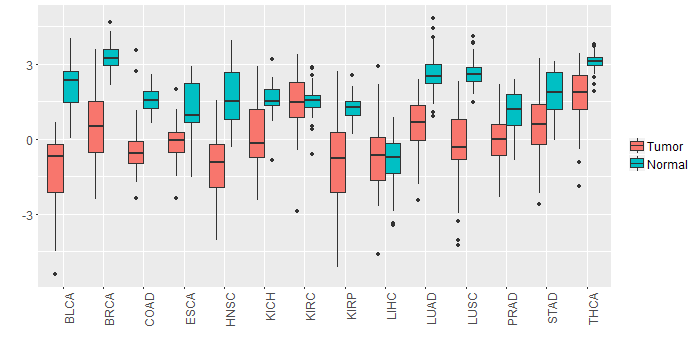 |
| - Significantly differentially expressed cancer types and information. (|Fold change|>1 and FDR<0.05) |
| Cancer type | Mean(exp) in tumor | Mean(exp) in matched normal | Log2FC | P-val. | FDR |
| BLCA | -1.308397805 | 2.134723247 | -3.443121053 | 9.84E-09 | 9.51E-07 |
| KIRP | -0.832054549 | 1.273601701 | -2.10565625 | 1.27E-07 | 7.51E-07 |
| COAD | -0.329375943 | 1.589989442 | -1.919365385 | 6.07E-08 | 4.46E-07 |
| THCA | 1.79627347 | 3.091632792 | -1.295359322 | 4.50E-13 | 4.33E-12 |
| PRAD | 0.022535596 | 1.083641365 | -1.061105769 | 2.70E-08 | 2.95E-07 |
| HNSC | -1.08078936 | 1.636443198 | -2.717232558 | 9.34E-17 | 1.50E-14 |
| LUAD | 0.571039309 | 2.624249654 | -2.053210345 | 4.55E-21 | 1.06E-19 |
| LUSC | -0.237215762 | 2.621360709 | -2.858576471 | 1.02E-18 | 1.02E-17 |
| BRCA | 0.475835528 | 3.269470616 | -2.793635088 | 2.54E-43 | 1.00E-41 |
| STAD | 0.598967326 | 1.851604826 | -1.2526375 | 7.25E-05 | 0.00058233 |
| KICH | 0.121714826 | 1.587366826 | -1.465652 | 8.21E-05 | 0.000218273 |
| Top |
| TissGene-miRNA for ITM2A |
| Significantly anti-correlated miRNAs of TissGene across 28 cancer types (Gene-miRNA relations from TargetScanHuman Relsease 7.1, Conserved_Site_Context_Scores.txt.zip, 06.01.2016) (TCGA IlluminaHiSeq_miRNASeq, log2(RPM+1) data, version 2016-11-21) (TCGA IlluminaHiSeq_RNASeqV2, log2(normalized_count+1) data, version 2016-08-16) (Spearman’s Rank Correlation (p-value<0.05 and coefficient<-0.25)) |
| Cancer type | miRNA id | miRNA accession | P-val. | Coeff. | # samples |
| Top |
| TissGeneMut for ITM2A |
| TissGeneSNV for ITM2A |
| nsSNV counts per each loci. Different colors of circles represent different cancer types. Circle size denotes number of samples. (TCGA somatic mutation (SNPs and small INDELs) data, version 2016-04-25) * Click on the image to enlarge it in a new window. |
 |
 |
| Somatic nucleotide variants of TissGene across 28 cancer types (X-axis: cancer type and Y-axis: % of mutated samples) The numbers in parentheses are numbers of samples with mutation (nsSNVs). (TCGA somatic mutation (SNPs and small INDELs) data, version 2016-04-25) |
 |
| - nsSNVs sorted by frequency. |
| AAchange | Cancer type | # samples |
| p.E253K | SKCM | 2 |
| p.E209K | SKCM | 2 |
| p.L109V | HNSC | 2 |
| p.D198Y | UCEC | 1 |
| p.Y144N | ACC | 1 |
| p.R229C | UCEC | 1 |
| p.V202M | LUAD | 1 |
| p.E257Q | BLCA | 1 |
| p.R162C | HNSC | 1 |
| p.E153K | SKCM | 1 |
| p.R58C | SKCM | 1 |
| p.R222K | LIHC | 1 |
| p.A11T | UCEC | 1 |
| p.R229S | HNSC | 1 |
| p.F236L | UCEC | 1 |
| p.G103V | LUSC | 1 |
| p.I125F | LUAD | 1 |
| p.A71V | LIHC | 1 |
| p.R143K | BLCA | 1 |
| p.E213Q | BLCA | 1 |
| p.R228C | UCEC | 1 |
| p.S132I | BRCA | 1 |
| p.D100E | LUAD | 1 |
| p.V212F | SKCM | 1 |
| p.G59V | LUAD | 1 |
| p.R187K | BLCA | 1 |
| p.F145L | THYM | 1 |
| p.E45K | SKCM | 1 |
| p.W201C | LUAD | 1 |
| p.G104X | COAD | 1 |
| p.S56F | SKCM | 1 |
| p.R196G | KIRC | 1 |
| p.V158M | LUAD | 1 |
| p.E47V | BRCA | 1 |
| p.E47* | LGG | 1 |
| p.D242H | CESC | 1 |
| p.Y188N | ACC | 1 |
| p.L109M | LUAD | 1 |
| p.A140G | LIHC | 1 |
| p.C90S | LUSC | 1 |
| p.D52N | SKCM | 1 |
| p.R206C | HNSC | 1 |
| p.G59* | LUAD | 1 |
| p.S180F | SKCM | 1 |
| p.L176V | READ | 1 |
| p.W245* | BRCA | 1 |
| p.R182C | LUAD | 1 |
| p.K259N | UCEC | 1 |
| p.R226C | UCEC | 1 |
| p.A80T | LUAD | 1 |
| p.C116W | LUAD | 1 |
| p.N7S | LUSC | 1 |
| p.N208T | HNSC | 1 |
| p.R239H | UCEC | 1 |
| p.R185S | HNSC | 1 |
| p.E113G | COAD | 1 |
| p.E160K | SKCM | 1 |
| p.A17V | UCEC | 1 |
| p.A96G | LIHC | 1 |
| p.P138H | THYM | 1 |
| Top |
| TissGeneCNV for ITM2A |
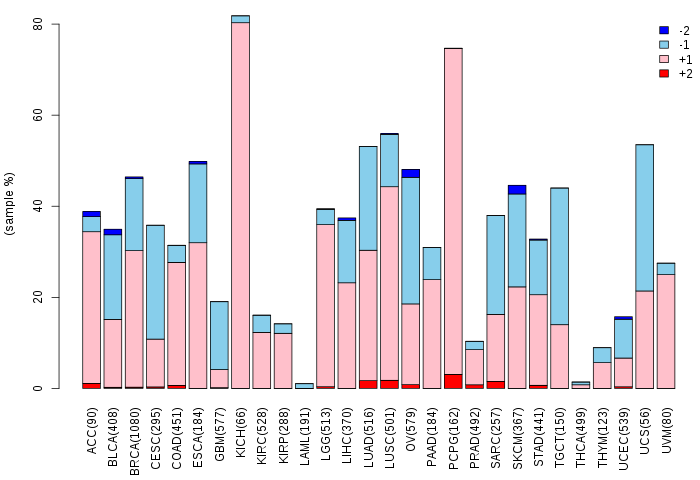
| Copy number variations of TissGene across 28 cancer types (X-axis: cancer type and Y-axis: % of CNV samples) (TCGA Gistic2_CopyNumber_Gistic2_all_data_by_genes, Gistic2 copy number data, version 2016-08-16) |
 |
| Top |
| TissGeneFusions for ITM2A |
| Fusion genes including TissGene (ChimerDB 3.0, 2016-12-01 and TCGA fusion Portal 2015-12-01) |
| Database | Src | Cancer type | Sample | Fusion gene | ORF | 5'-gene BP | 3'-gene BP |
| Chimerdb3.0 | ChiTaRs | NA | BF931704 | ITM2A-LUC7L | chrX:78618580 | chr16:239036 |
| Top |
| TissGeneNet for ITM2A |
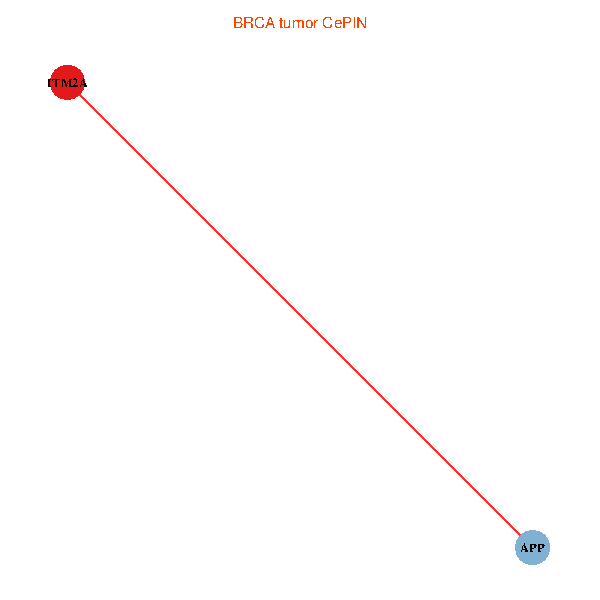
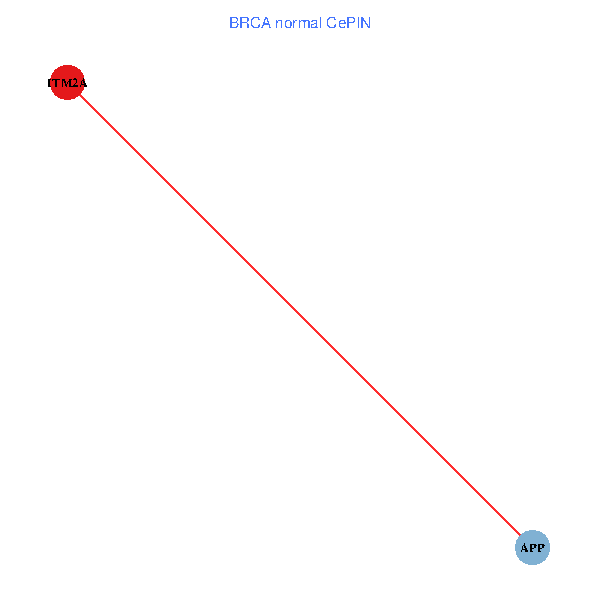
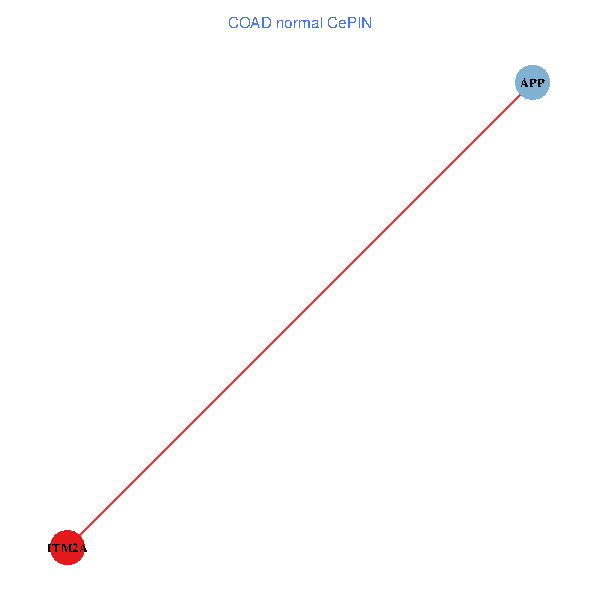
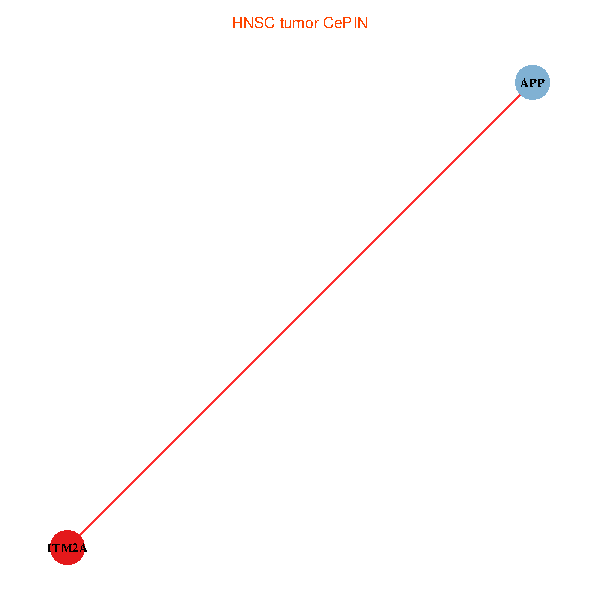
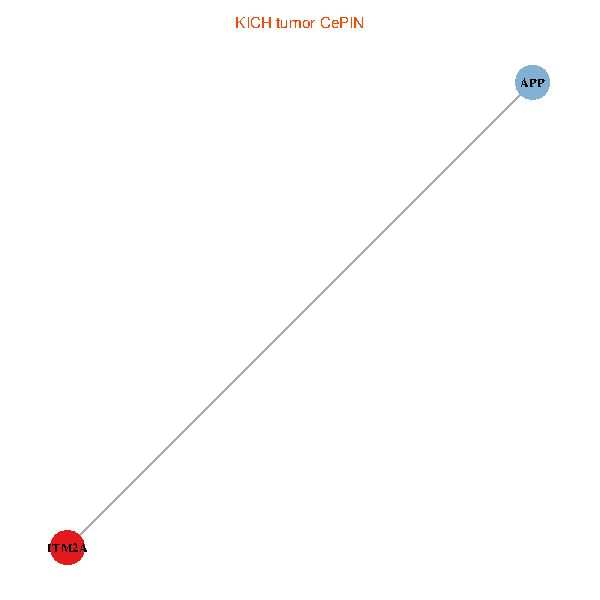
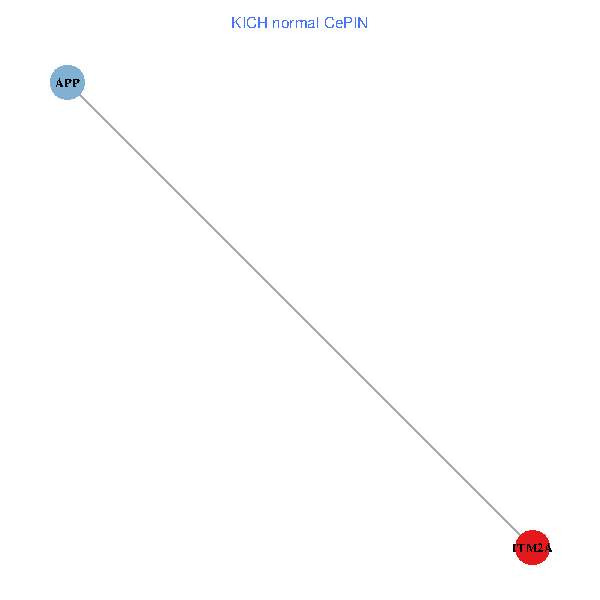
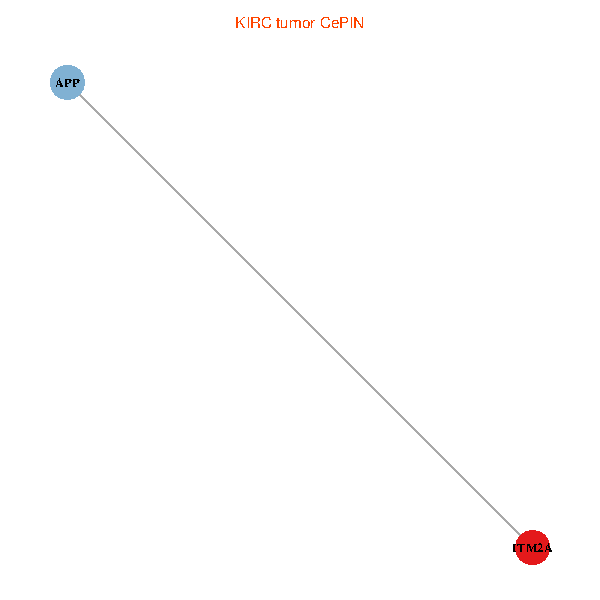
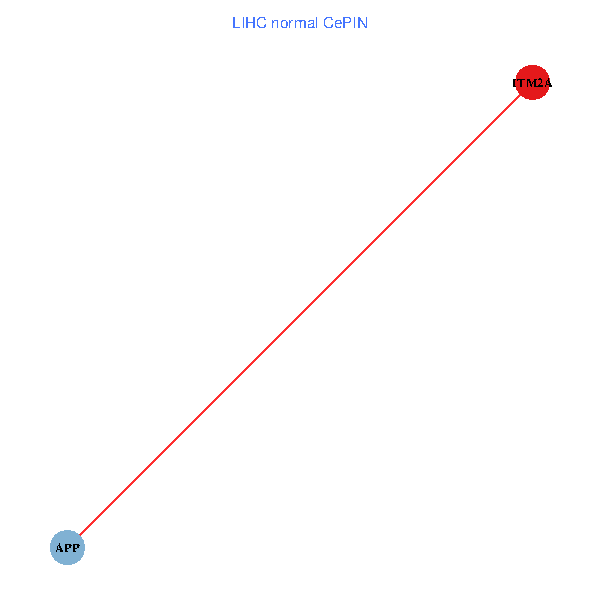
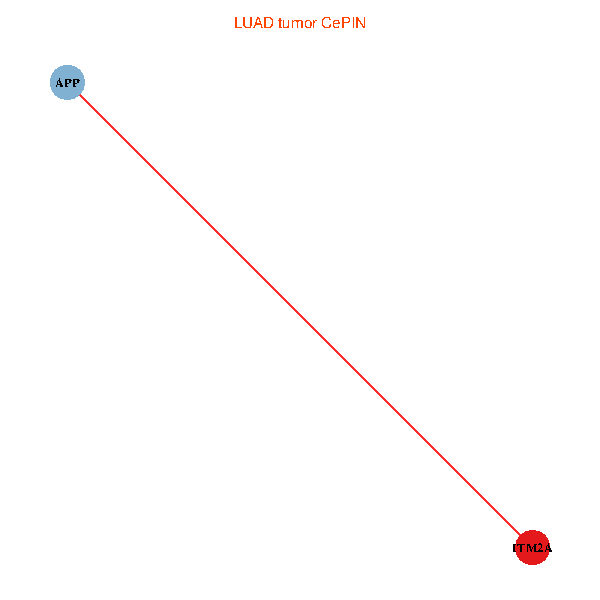
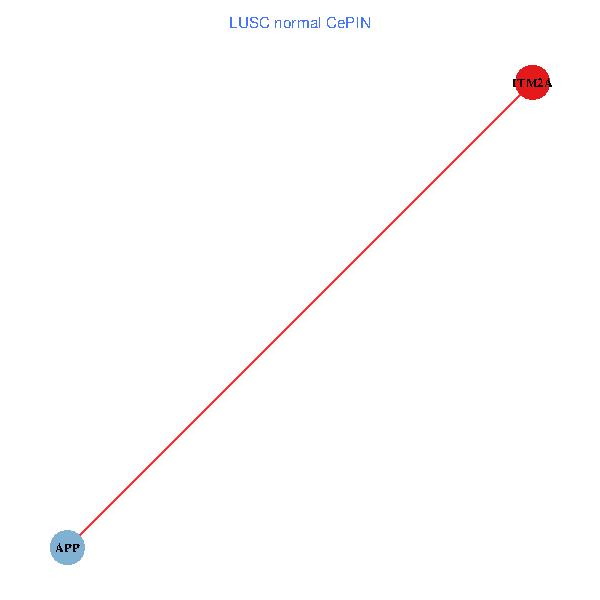
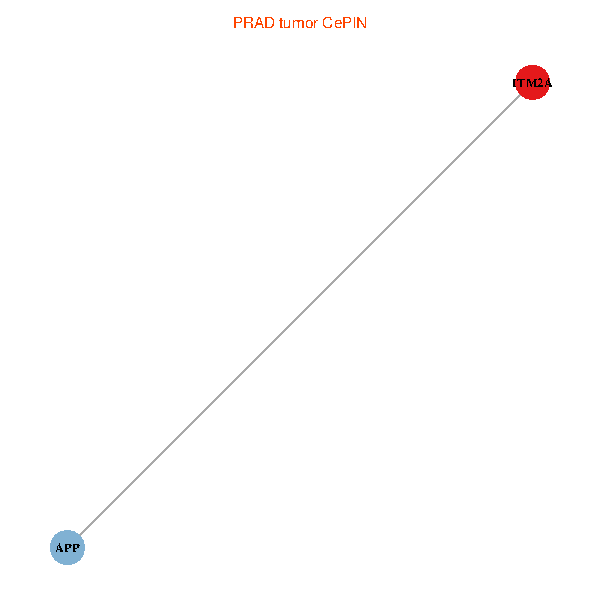
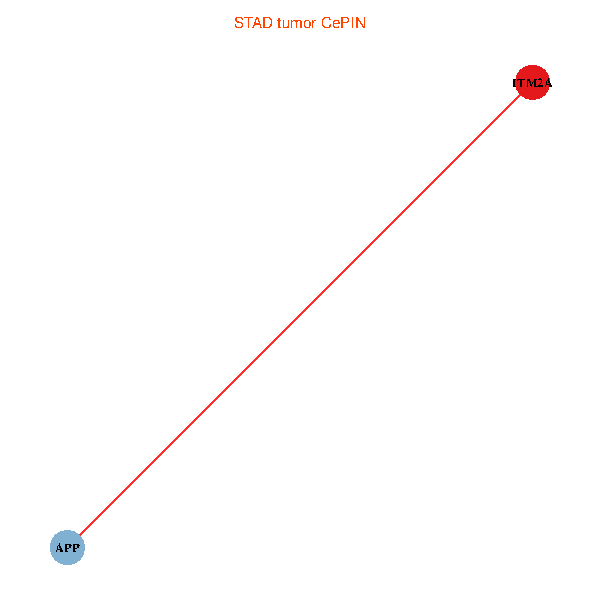
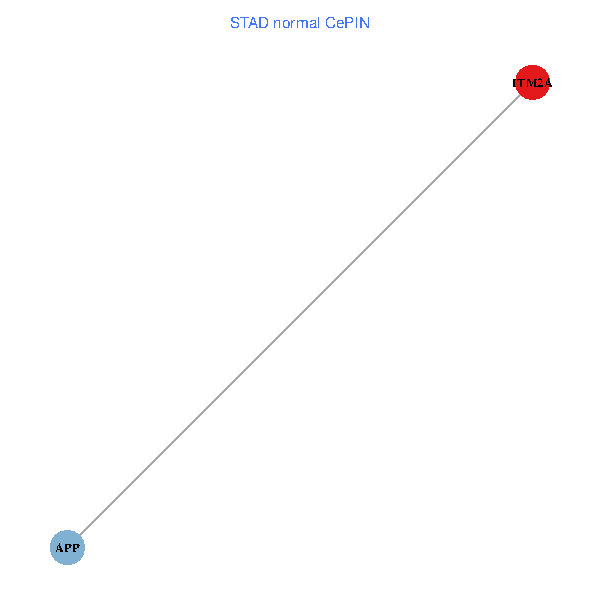
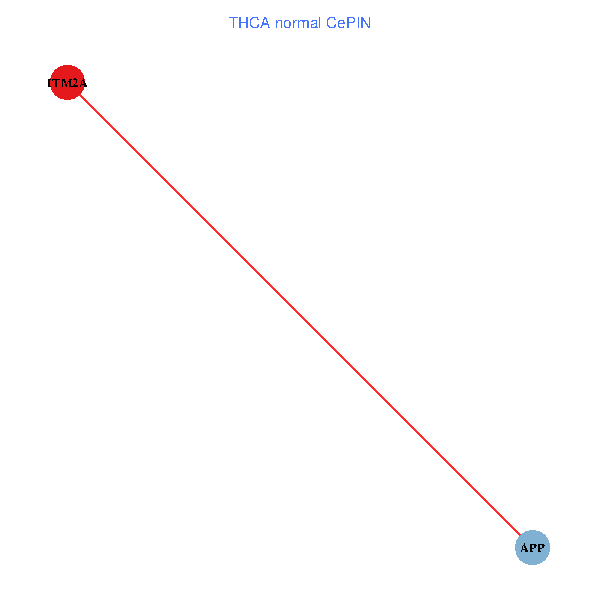
| Co-expressed gene networks based on protein-protein interaction data (CePIN) (TCGA IlluminaHiSeq_RNASeqV2, pan-cancer normalized log2(norm_counts+1) data, version 2016-08-16) (PINA2 ppi data) |
| BRCA (tumor) | BRCA (normal) |
| ITM2A, APP (tumor) | ITM2A, APP (normal) |
 |  |
| COAD (tumor) | COAD (normal) |
| ITM2A, APP (tumor) | ITM2A, APP (normal) |
 |  |
| HNSC (tumor) | HNSC (normal) |
| ITM2A, APP (tumor) | ITM2A, APP (normal) |
 |  |
| KICH (tumor) | KICH (normal) |
| ITM2A, APP (tumor) | ITM2A, APP (normal) |
 |  |
| KIRC (tumor) | KIRC (normal) |
| ITM2A, APP (tumor) | ITM2A, APP (normal) |
 |  |
| KIRP (tumor) | KIRP (normal) |
| ITM2A, APP (tumor) | ITM2A, APP (normal) |
 |  |
| LIHC (tumor) | LIHC (normal) |
| ITM2A, APP (tumor) | ITM2A, APP (normal) |
 |  |
| LUAD (tumor) | LUAD (normal) |
| ITM2A, APP (tumor) | ITM2A, APP (normal) |
 |  |
| LUSC (tumor) | LUSC (normal) |
| ITM2A, APP (tumor) | ITM2A, APP (normal) |
 |  |
| PRAD (tumor) | PRAD (normal) |
| ITM2A, APP (tumor) | ITM2A, APP (normal) |
 |  |
| STAD (tumor) | STAD (normal) |
| ITM2A, APP (tumor) | ITM2A, APP (normal) |
 |  |
| THCA (tumor) | THCA (normal) |
| ITM2A, APP (tumor) | ITM2A, APP (normal) |
 |  |
| Top |
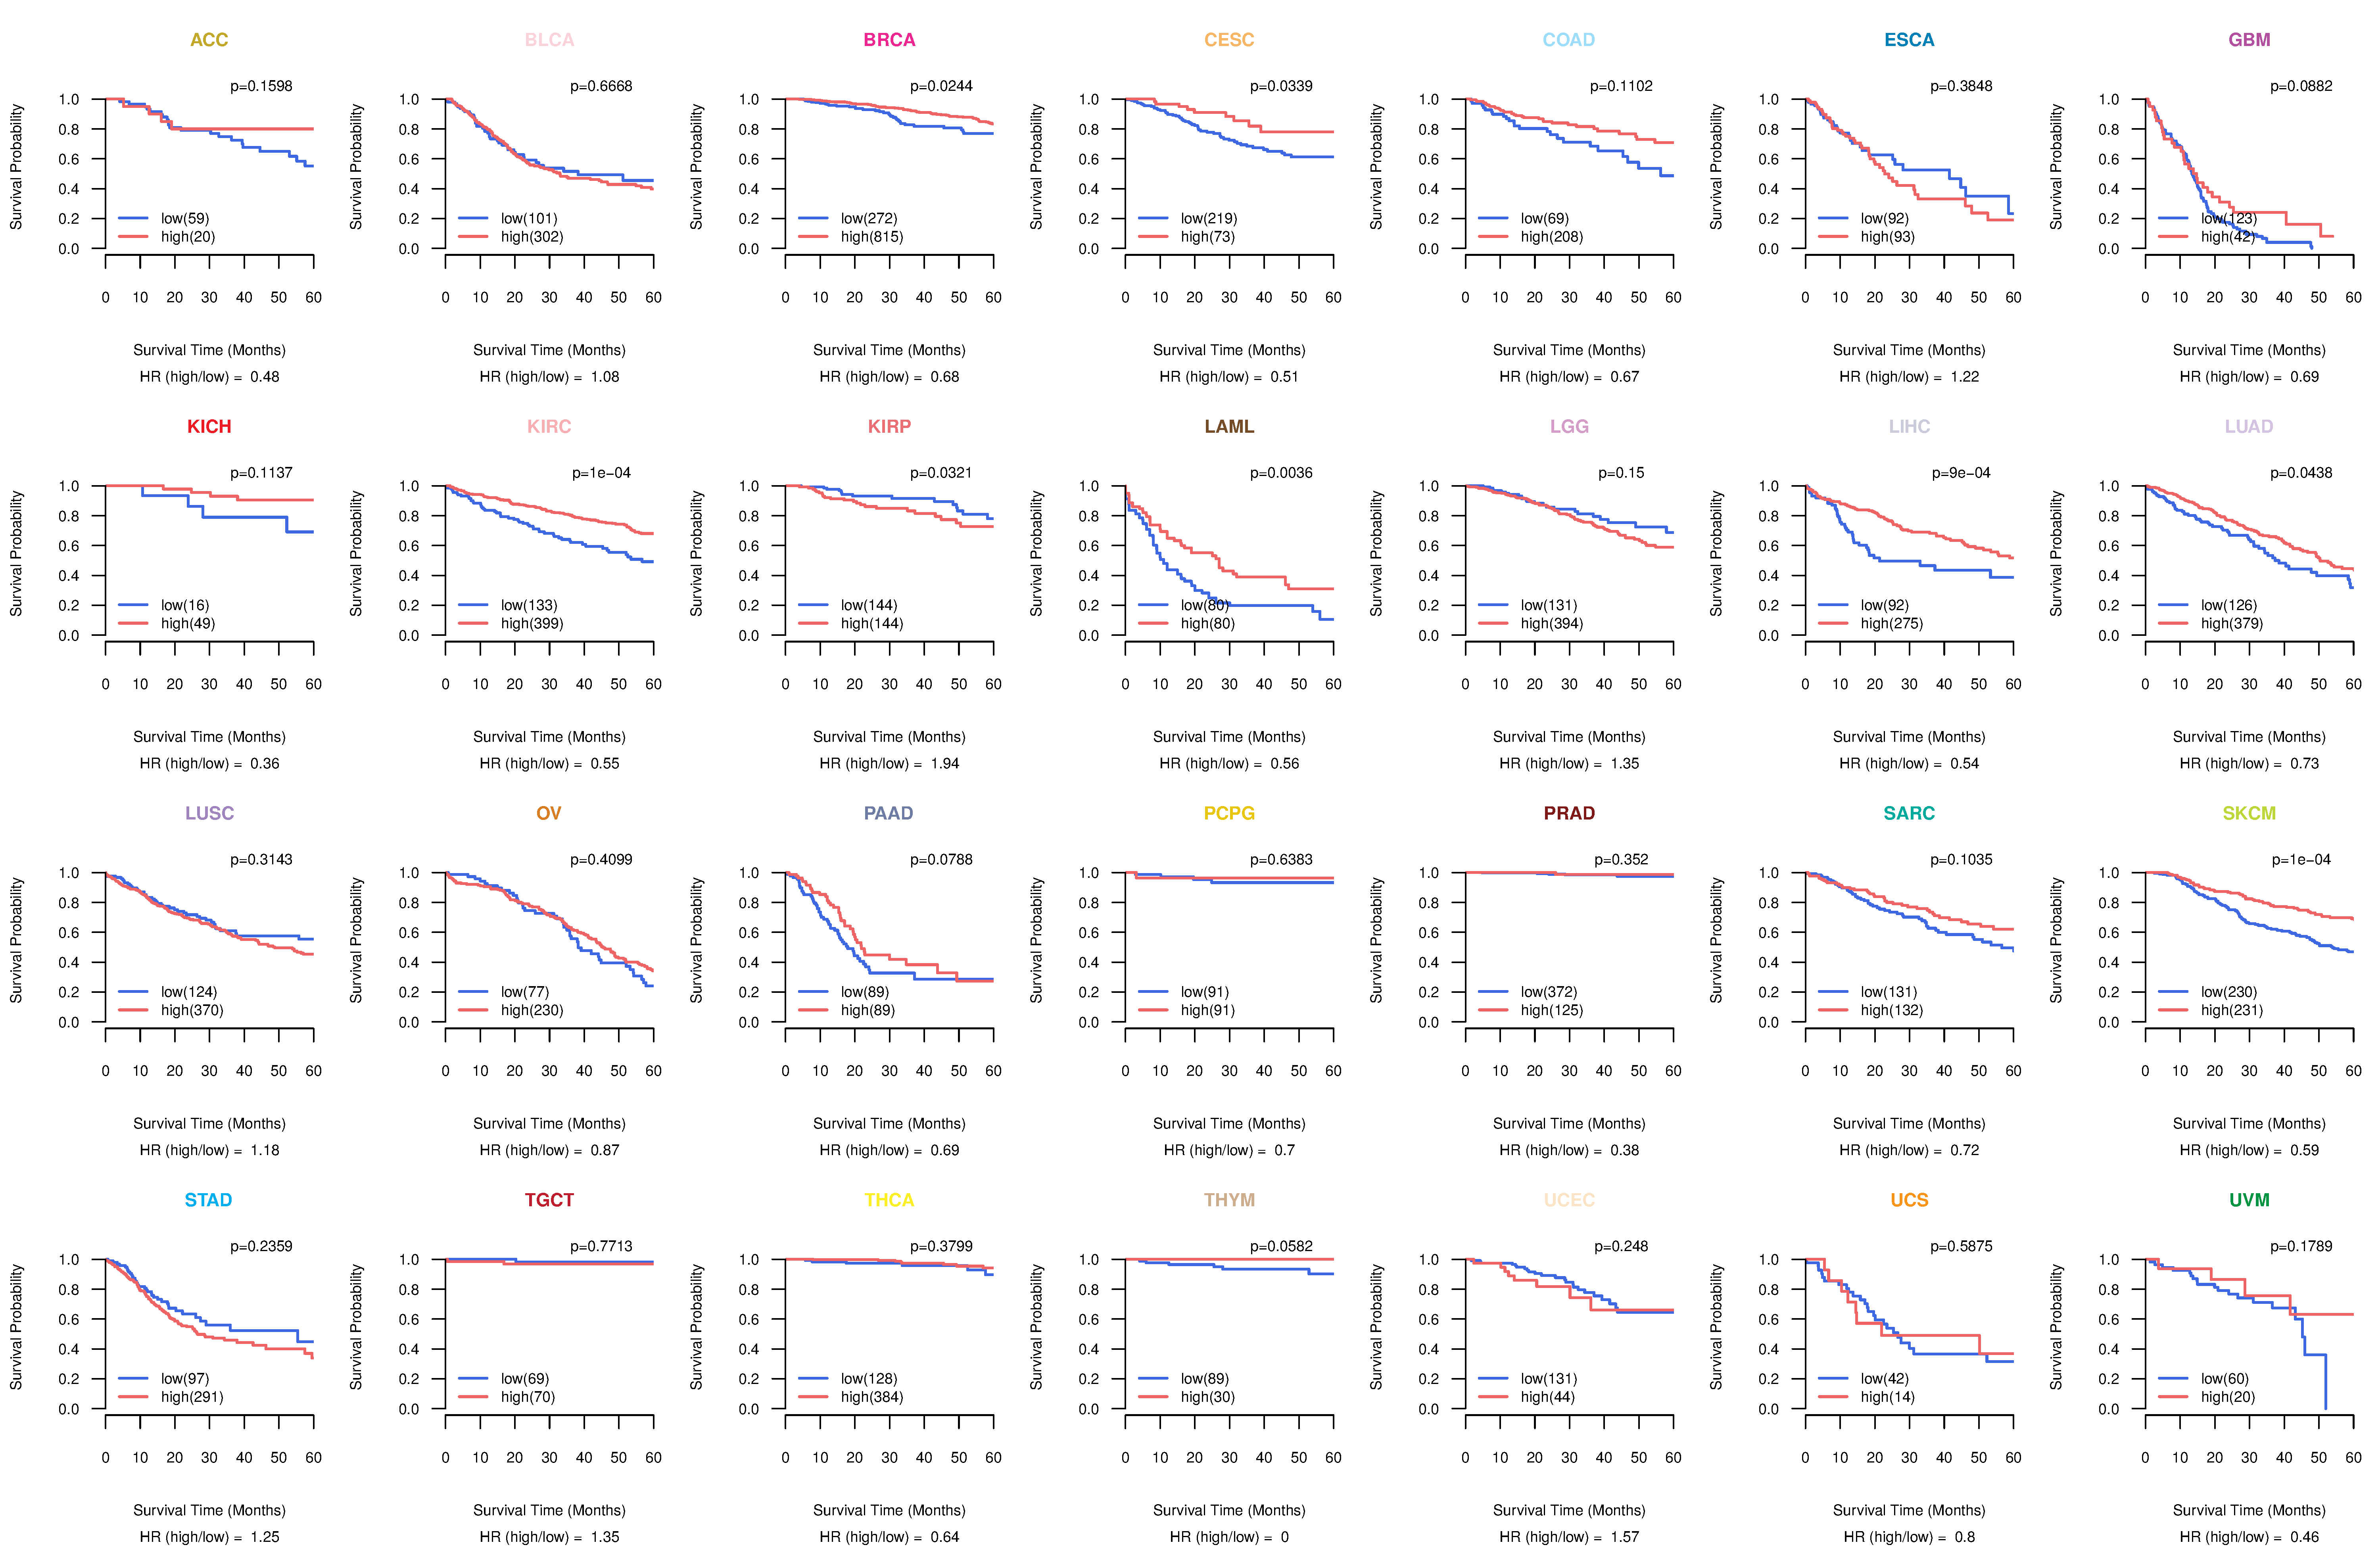
| TissGeneProg for ITM2A |
| Kaplan-Meier plots with logrank tests of overall survival (OS) using 28 cancer types (TCGA IlluminaHiSeq_RNASeqV2, pan-cancer normalized log2(norm_counts+1) data, version 2016-08-16) (TCGA clinicalMatrix, phenotype data, version 2016-04-27) * Click on the image to enlarge it in a new window. |
 |
| Kaplan-Meier plots with logrank test of relapse free survival (RFS) using 28 cancer types (TCGA IlluminaHiSeq_RNASeqV2, pan-cancer normalized log2(norm_counts+1) data, version 2016-08-16) (TCGA clinicalMatrix, phenotype data, version 2016-04-27) * Click on the image enlarge it in a new window. |
 |
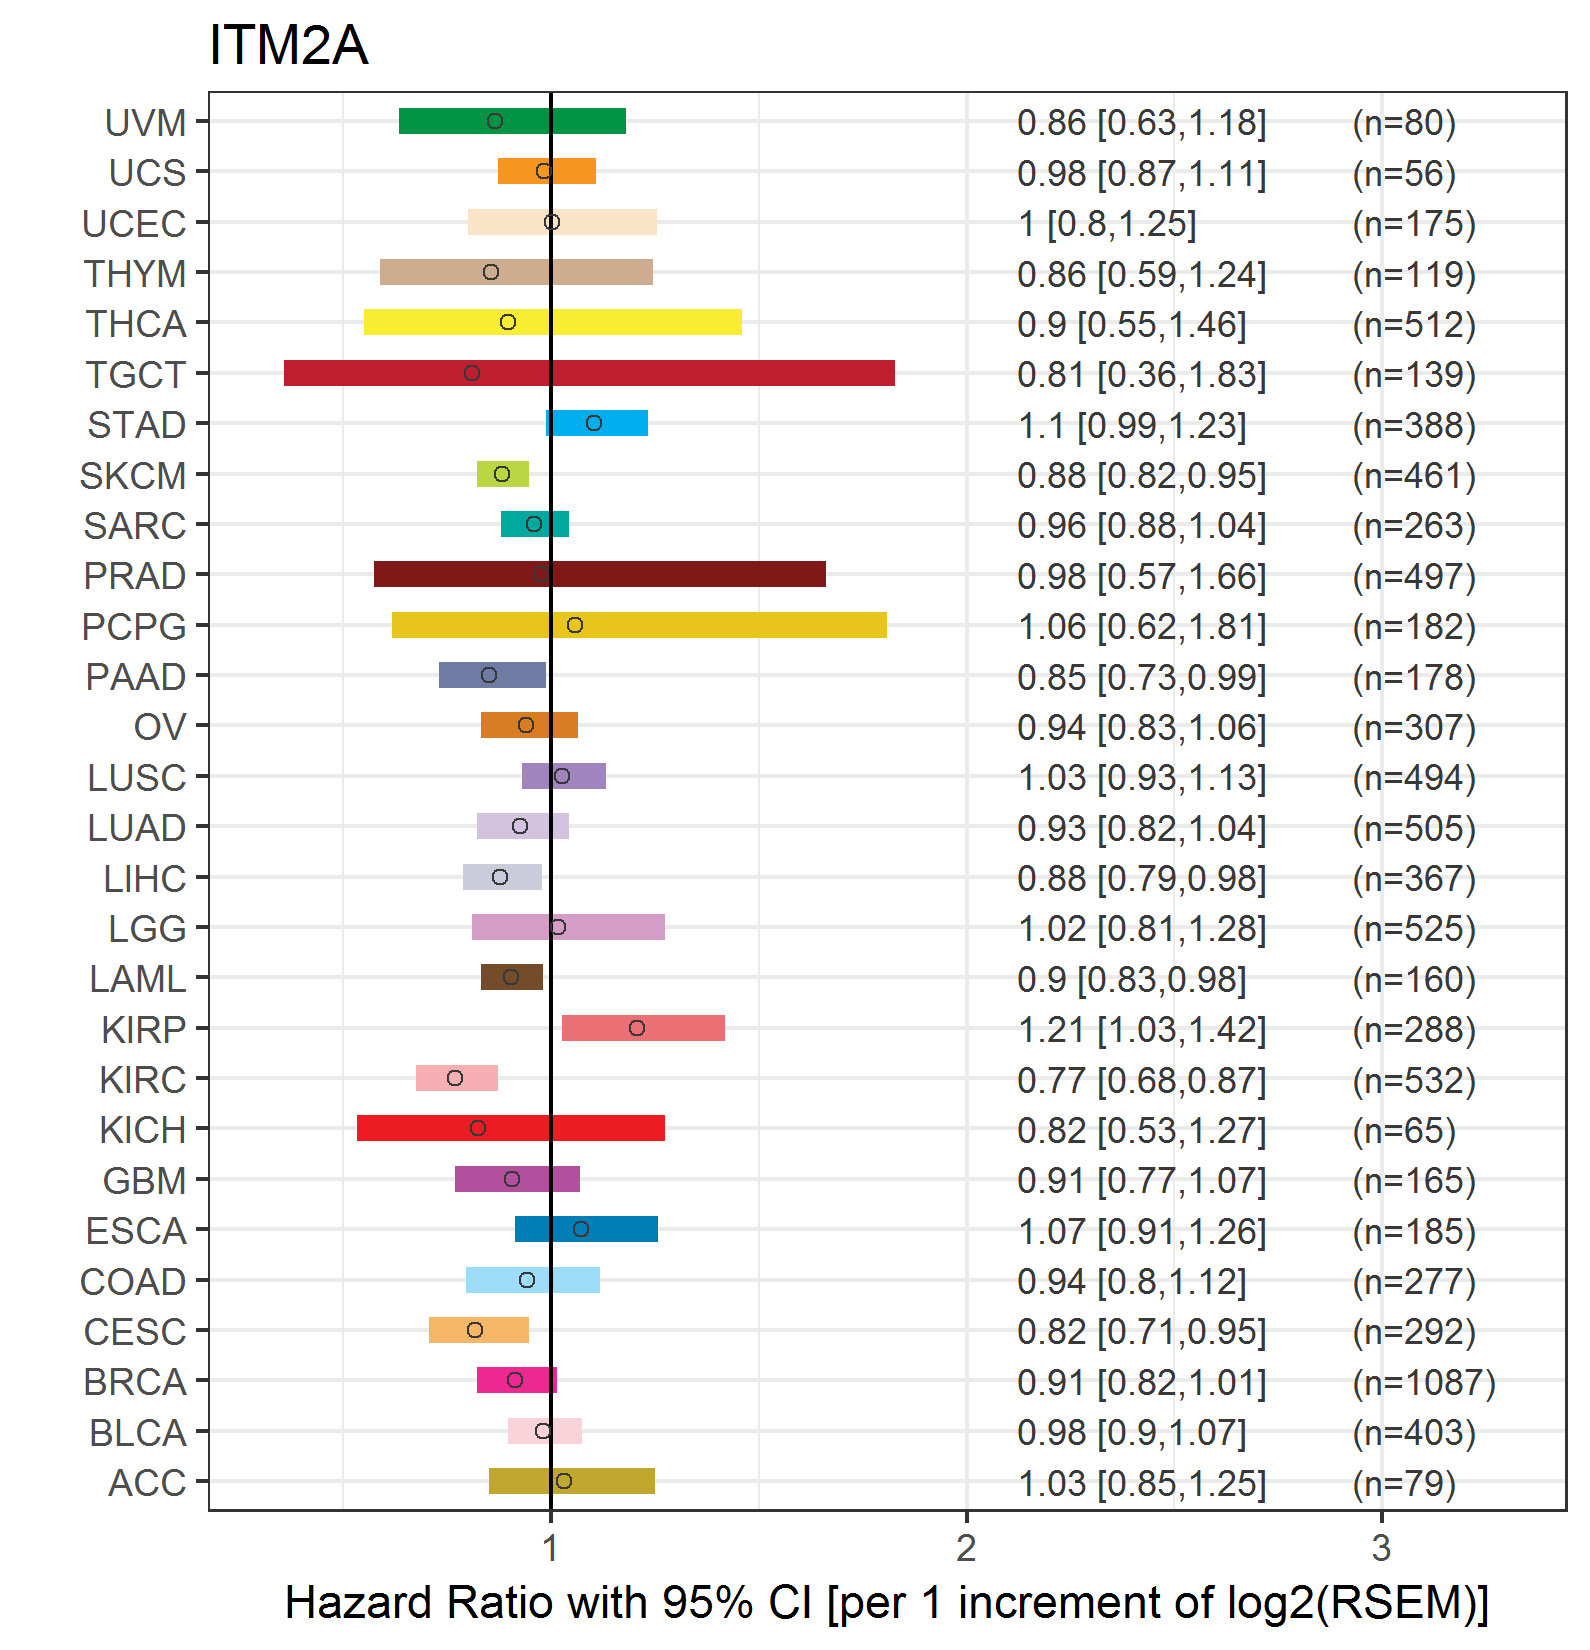
| Forest plot of Cox proportional hazard ratio (HR) and 95% CI of overall survival (OS) using 28 cancer types (TCGA IlluminaHiSeq_RNASeqV2, pan-cancer normalized log2(norm_counts+1) data, version 2016-08-16) (TCGA clinicalMatrix, phenotype data, version 2016-04-27) * Click on the image enlarge it in a new window. |
 |
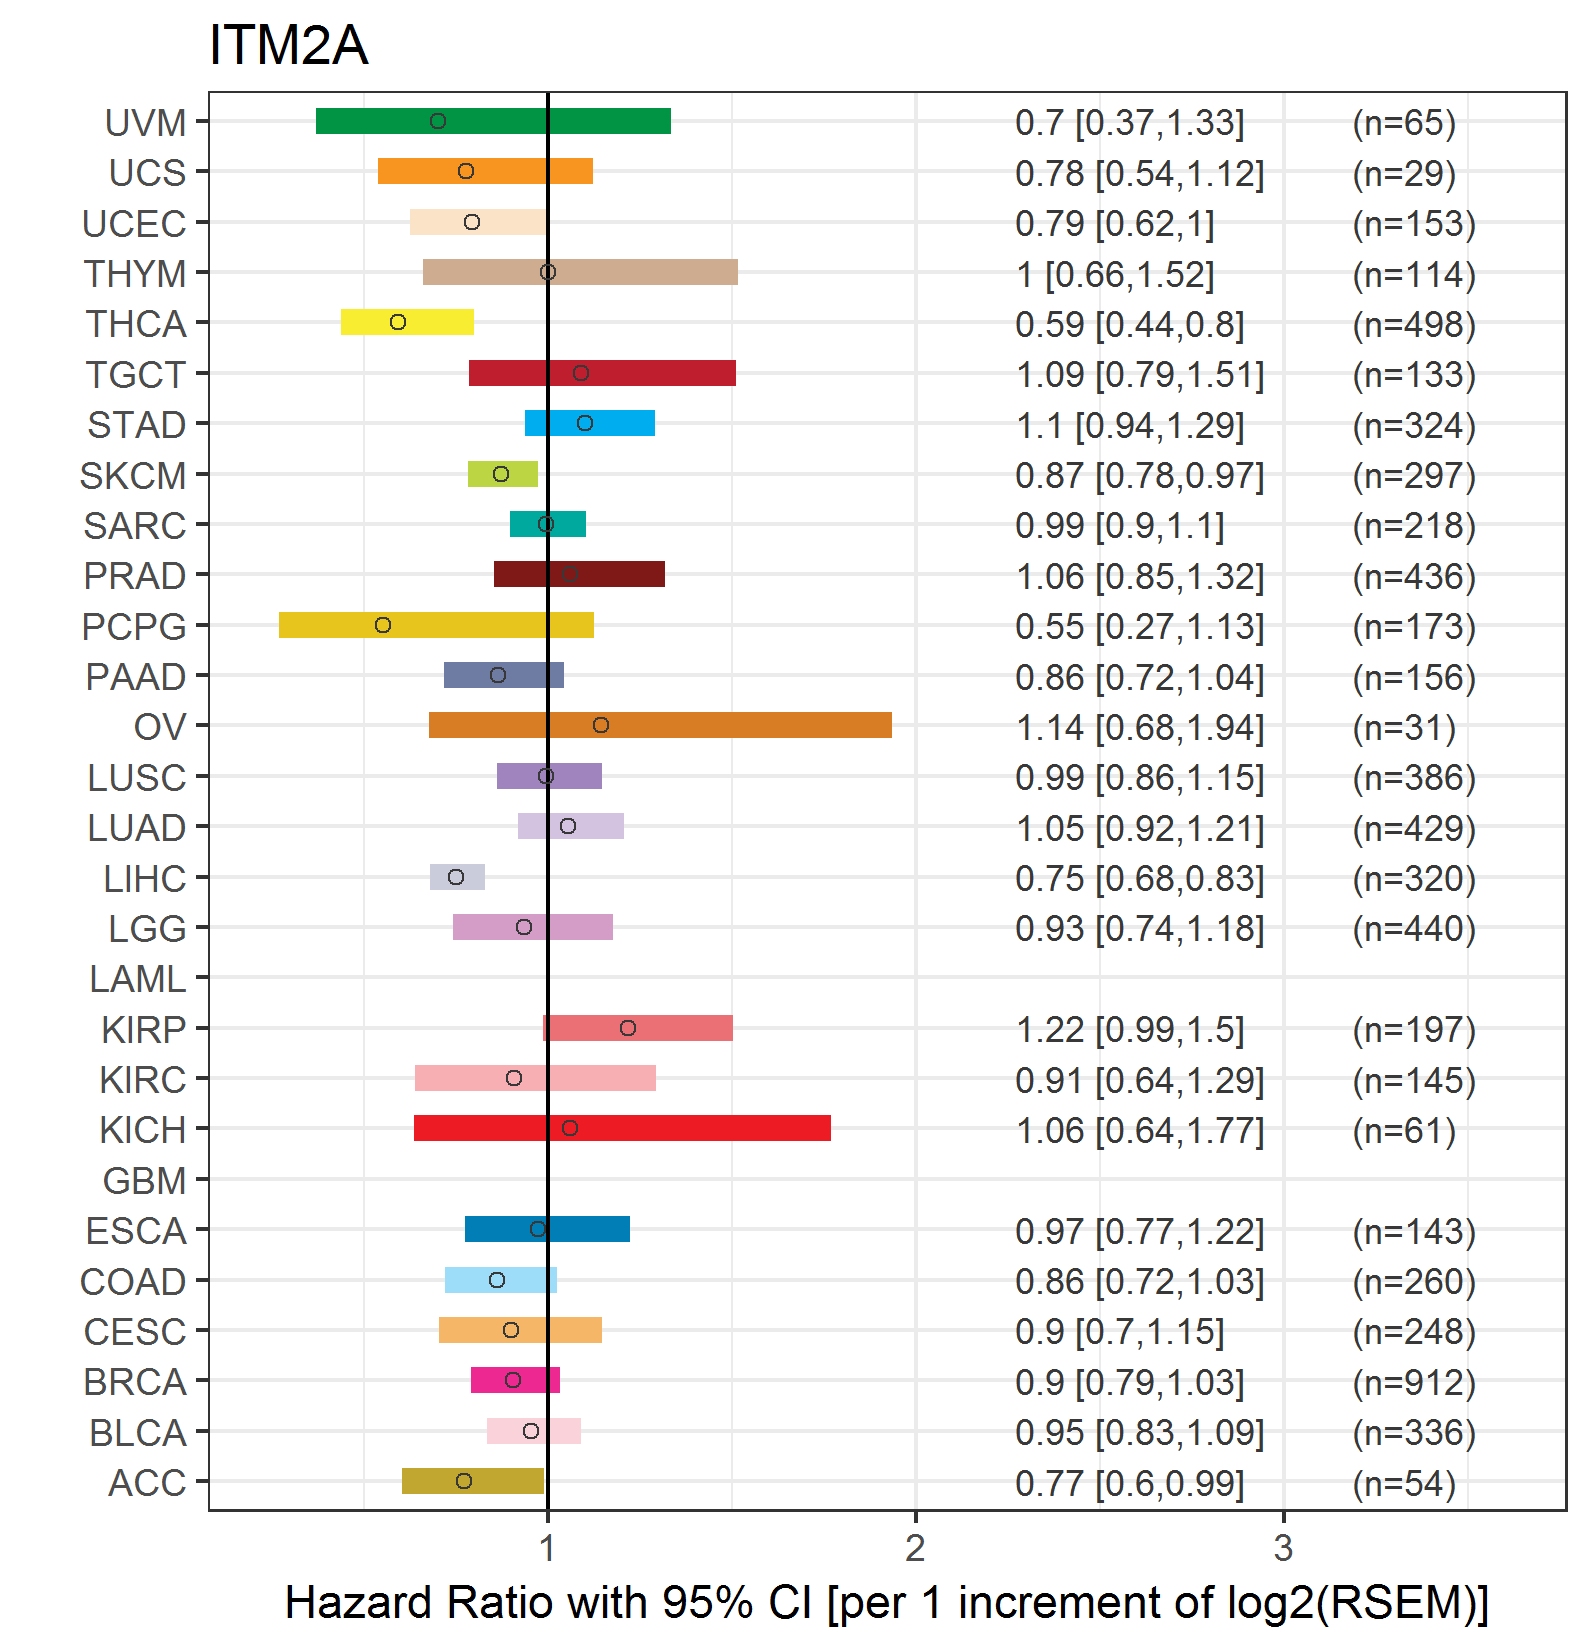
| Forest plot of Cox proportional hazard ratio (HR) and 95% CI of relapse free survival (RFS) using 28 cancer types (TCGA IlluminaHiSeq_RNASeqV2, pan-cancer normalized log2(norm_counts+1) data, version 2016-08-16) (TCGA clinicalMatrix, phenotype data, version 2016-04-27) * Click on the image enlarge it in a new window. |
 |
| Top |
| TissGeneClin for ITM2A |
| TissGeneDrug for ITM2A |
| Drug information targeting TissGene (DrugBank Version 5.0.6, 2017-04-01) |
| DrugBank ID | Drug name | Drug activity | Drug type | Drug status |
| Top |
| TissGeneDisease for ITM2A |
| Disease information associated with TissGene (DisGeNet, 2016-06-01) |
| Disease ID | Disease name | # pubmeds | Source |
| umls:C0008925 | Cleft Palate | 1 | BeFree |
| umls:C0018213 | Graves Disease | 1 | BeFree |
| umls:C0029408 | Degenerative polyarthritis | 1 | BeFree |
| umls:C0031117 | Peripheral Neuropathy | 1 | CTD_human |
| umls:C3714756 | Intellectual Disability | 1 | BeFree |
|
Copyright 2016-Present - The University of Texas Health Science Center at Houston (UTHealth) Web File Viewing | How to Report, Fraud, Waste and Abuse | State of Texas | Statewide Search | Texas Homeland Security | Site Policies |