 |
| |
| |
| |
| |
| |
| |
|

| TissGeneSummary for PAGE4 |
 Gene summary Gene summary |
| Basic gene information | Gene symbol | PAGE4 |
| Gene name | P antigen family, member 4 (prostate associated) | |
| Synonyms | CT16.7|GAGE-9|GAGEC1|JM-27|PAGE-1|PAGE-4 | |
| Cytomap | UCSC genome browser: Xp11.23 | |
| Type of gene | protein-coding | |
| RefGenes | NM_007003.3, | |
| Description | P antigen family member 4g antigen family C member 1prostate-associated gene protein 4 | |
| Modification date | 20141207 | |
| dbXrefs | MIM : 300287 | |
| HGNC : HGNC | ||
| Ensembl : ENSG00000101951 | ||
| HPRD : 02239 | ||
| Vega : OTTHUMG00000024155 | ||
| Protein | UniProt: go to UniProt's Cross Reference DB Table | |
| Expression | CleanEX: HS_PAGE4 | |
| BioGPS: 9506 | ||
| Pathway | NCI Pathway Interaction Database: PAGE4 | |
| KEGG: PAGE4 | ||
| REACTOME: PAGE4 | ||
| Pathway Commons: PAGE4 | ||
| Context | iHOP: PAGE4 | |
| ligand binding site mutation search in PubMed: PAGE4 | ||
| UCL Cancer Institute: PAGE4 | ||
| Assigned class in TissGDB* | C | |
| Included tissue-specific gene expression resources | TiGER,GTEx | |
| Specific-tissues in normal samples (assigned by TissGDB using HPA, TiGER, and GTEx) | Prostate | |
| Cancer types related to the specific-tissues in cancer samples (assigned by TissGDB using TCGA) | PRAD | |
| Reference showing the relevant tissue of PAGE4 | ||
| Description by TissGene annotations | Protective TissGene in OS Protective TissGene in RFS Significant down-regulated DEG TissgsKTS CNV lost TissGeneKTS | |
| * Class A consists of genes with literature evidence and is part of the cTissGenes. Class B consists of only cTissGenes without additional evidence. The remaining genes belong to Class C. |
| Gene ontology having evidence of Inferred from Direct Assay (IDA) from Entrez |
| GO ID | GO term | PubMed ID |
| Top |
| TissGeneExp for PAGE4 |
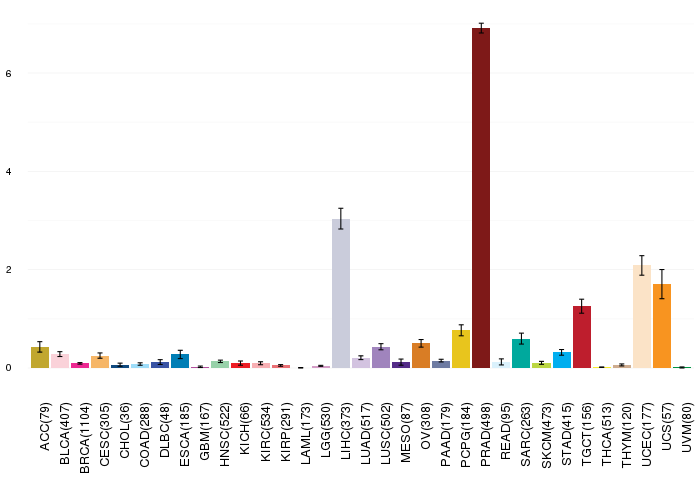
| Gene expressions across 28 cancer types (X-axis: cancer type and Y-axis: log2(norm_counts+1)) (TCGA IlluminaHiSeq_RNASeqV2, pan-cancer normalized log2(norm_counts+1) data, version 2016-08-16) |
 |
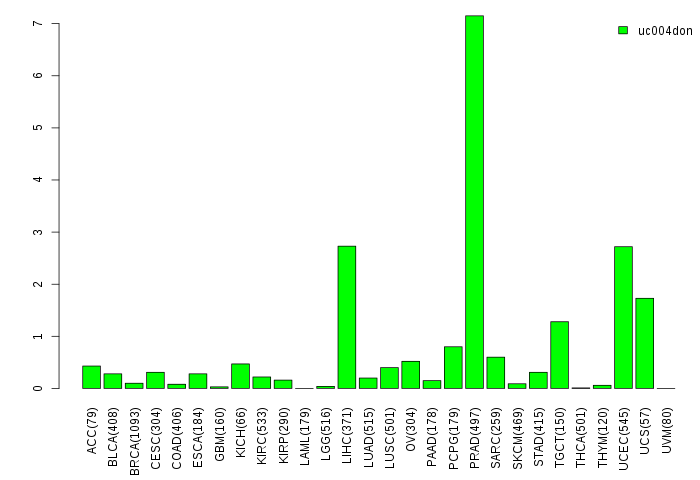
| Gene isoform expressions across 28 cancer types (X-axis: cancer type and Y-axis: log2(norm_counts+1)) (TCGA pan-cancer tcga_rsem_isoform_tpm, version 2016-09-01) |
 |
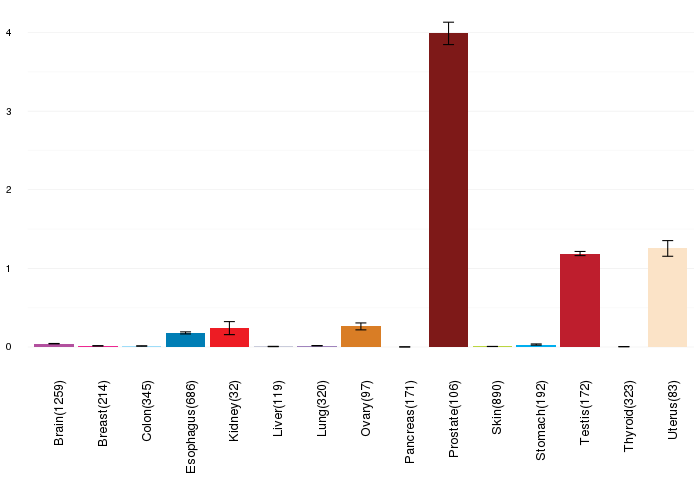
| Gene expressions across normal tissues of GTEx data (GTEx GTEx_Analysis_v6_RNA-seq_RNA-SeQCv1.1.8_gene_rpkm.gct) - Here, we shows the matched tissue types only among our 28 cancer types. |
 |
| Different expressions across 14 cancer types with more than 10 samples between matched tumors and normals (X-axis: cancer type and Y-axis: log2(norm_counts+1)) (TCGA IlluminaHiSeq_RNASeqV2, pan-cancer normalized log2(norm_counts+1) data, version 2016-08-16) |
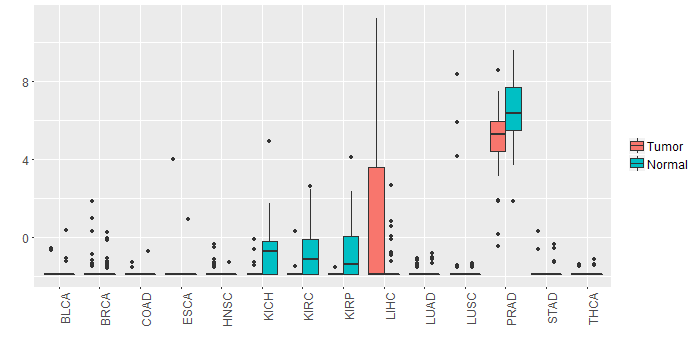 |
| - Significantly differentially expressed cancer types and information. (|Fold change|>1 and FDR<0.05) |
| Cancer type | Mean(exp) in tumor | Mean(exp) in matched normal | Log2FC | P-val. | FDR |
| KIRC | -1.830730909 | -0.791682297 | -1.039048611 | 5.27E-10 | 1.76E-09 |
| KICH | -1.691943964 | -0.558235964 | -1.133708 | 0.00128 | 0.002720463 |
| LIHC | 0.717026036 | -1.406613964 | 2.12364 | 0.000139 | 0.000464938 |
| KIRP | -1.861542714 | -0.784689589 | -1.076853125 | 0.000119 | 0.000396431 |
| PRAD | 5.026716421 | 6.374141421 | -1.347425 | 5.77E-05 | 0.000256559 |
| Top |
| TissGene-miRNA for PAGE4 |
| Significantly anti-correlated miRNAs of TissGene across 28 cancer types (Gene-miRNA relations from TargetScanHuman Relsease 7.1, Conserved_Site_Context_Scores.txt.zip, 06.01.2016) (TCGA IlluminaHiSeq_miRNASeq, log2(RPM+1) data, version 2016-11-21) (TCGA IlluminaHiSeq_RNASeqV2, log2(normalized_count+1) data, version 2016-08-16) (Spearman’s Rank Correlation (p-value<0.05 and coefficient<-0.25)) |
| Cancer type | miRNA id | miRNA accession | P-val. | Coeff. | # samples |
| Top |
| TissGeneMut for PAGE4 |
| TissGeneSNV for PAGE4 |
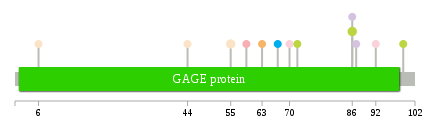
| nsSNV counts per each loci. Different colors of circles represent different cancer types. Circle size denotes number of samples. (TCGA somatic mutation (SNPs and small INDELs) data, version 2016-04-25) * Click on the image to enlarge it in a new window. |
 |
 |
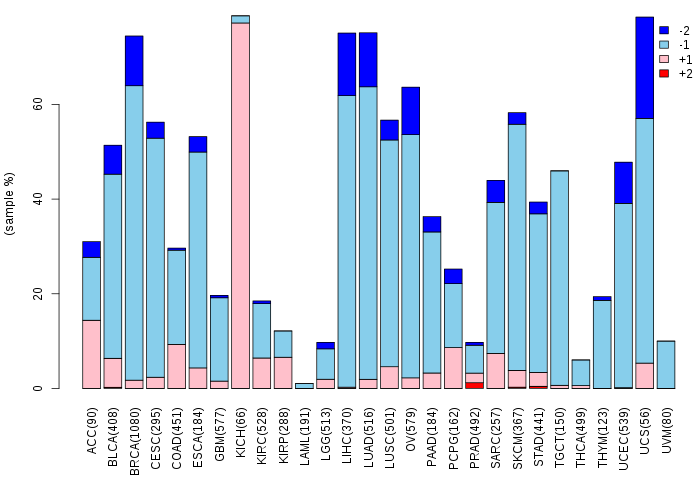
| Somatic nucleotide variants of TissGene across 28 cancer types (X-axis: cancer type and Y-axis: % of mutated samples) The numbers in parentheses are numbers of samples with mutation (nsSNVs). (TCGA somatic mutation (SNPs and small INDELs) data, version 2016-04-25) |
 |
| - nsSNVs sorted by frequency. |
| AAchange | Cancer type | # samples |
| p.P86L | SKCM | 2 |
| p.E55K | UCEC | 2 |
| p.P89L | HNSC | 1 |
| p.C63F | CESC | 1 |
| p.P44L | UCEC | 1 |
| p.R72Q | SKCM | 1 |
| p.D99N | SKCM | 1 |
| p.G78C | HNSC | 1 |
| p.A92V | BLCA | 1 |
| p.K70N | BLCA | 1 |
| p.V59I | KIRC | 1 |
| p.R6I | UCEC | 1 |
| p.P86A | LUAD | 1 |
| p.P87T | LUAD | 1 |
| p.D67H | STAD | 1 |
| Top |
| TissGeneCNV for PAGE4 |
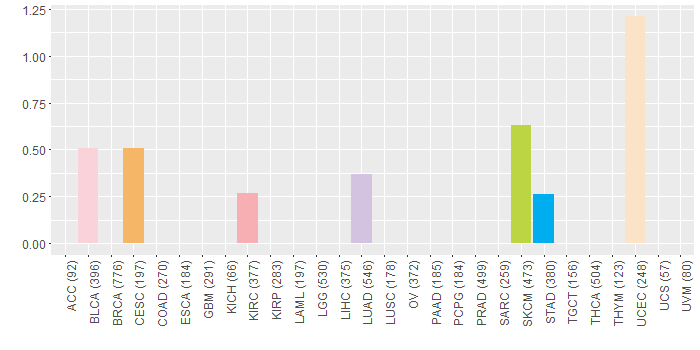
| Copy number variations of TissGene across 28 cancer types (X-axis: cancer type and Y-axis: % of CNV samples) (TCGA Gistic2_CopyNumber_Gistic2_all_data_by_genes, Gistic2 copy number data, version 2016-08-16) |
 |
| Top |
| TissGeneFusions for PAGE4 |
| Fusion genes including TissGene (ChimerDB 3.0, 2016-12-01 and TCGA fusion Portal 2015-12-01) |
| Database | Src | Cancer type | Sample | Fusion gene | ORF | 5'-gene BP | 3'-gene BP |
| TCGAfusionPortal | PRADA | BRCA | TCGA-A2-A04U-01A | PSD3-PAGE4 | CDS-5UTR | Chr8:18871073 | ChrX:49595002 |
| Top |
| TissGeneNet for PAGE4 |
| Co-expressed gene networks based on protein-protein interaction data (CePIN) (TCGA IlluminaHiSeq_RNASeqV2, pan-cancer normalized log2(norm_counts+1) data, version 2016-08-16) (PINA2 ppi data) |
| Top |
| TissGeneProg for PAGE4 |
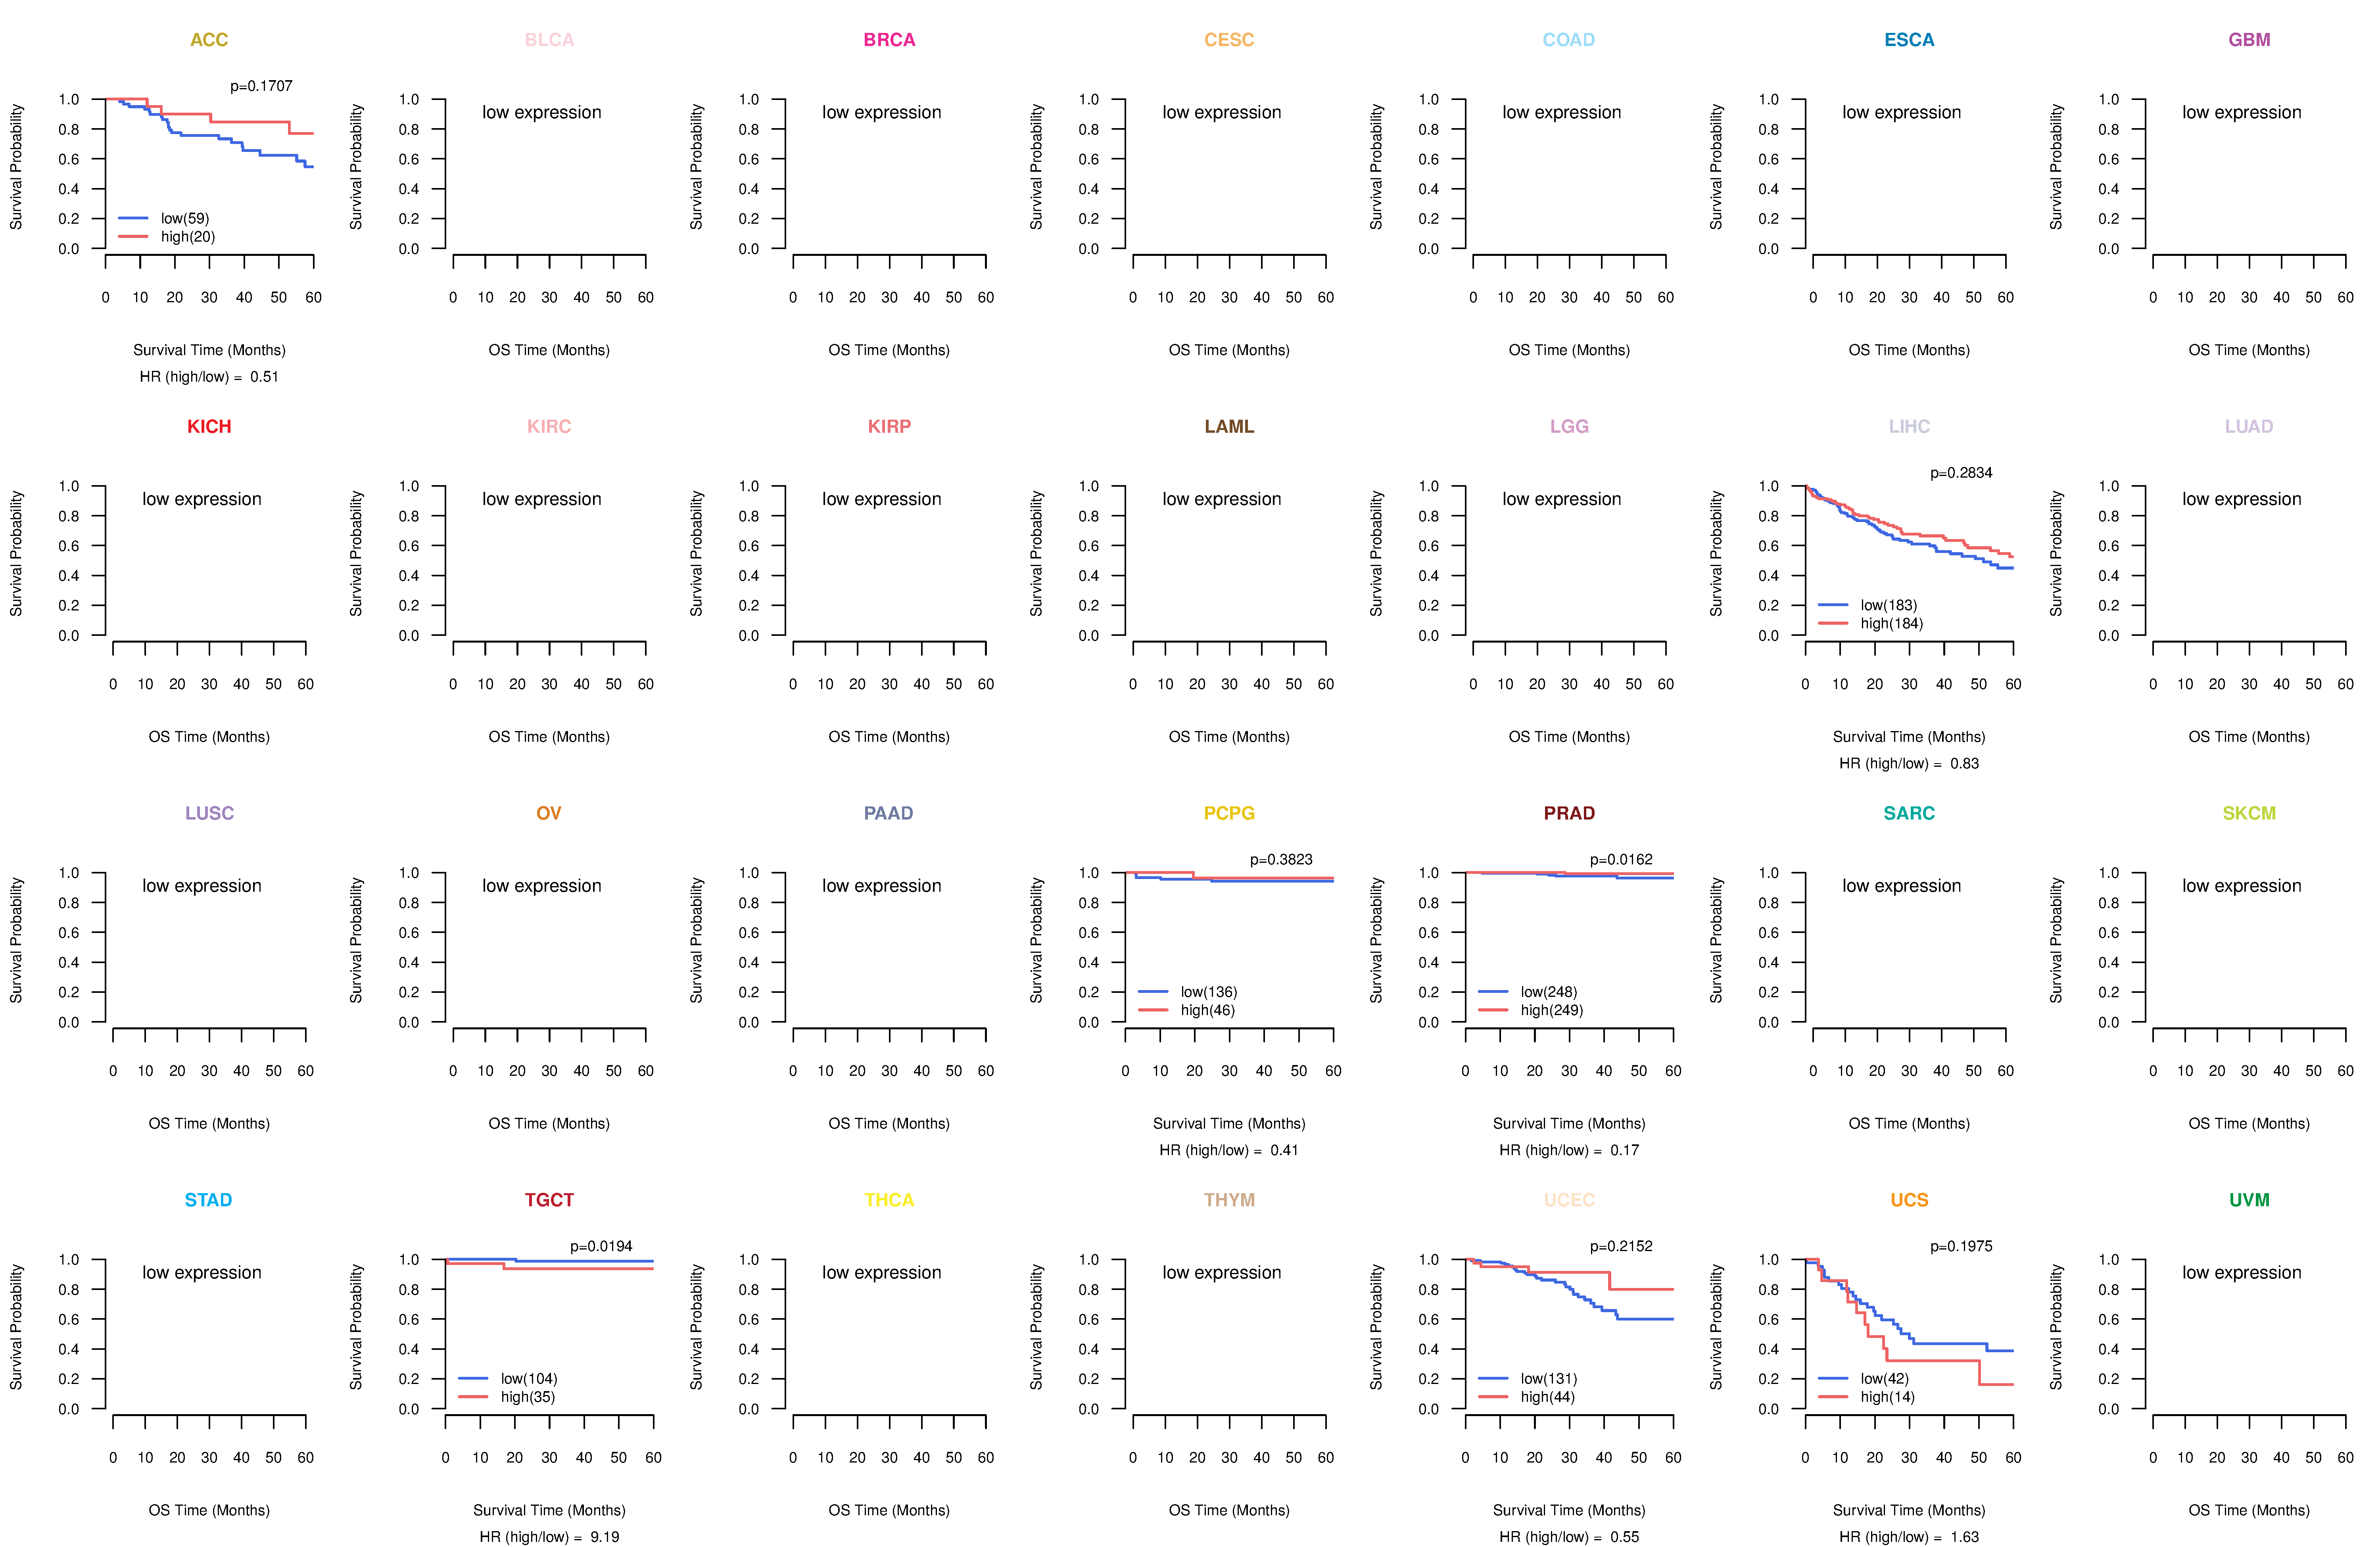
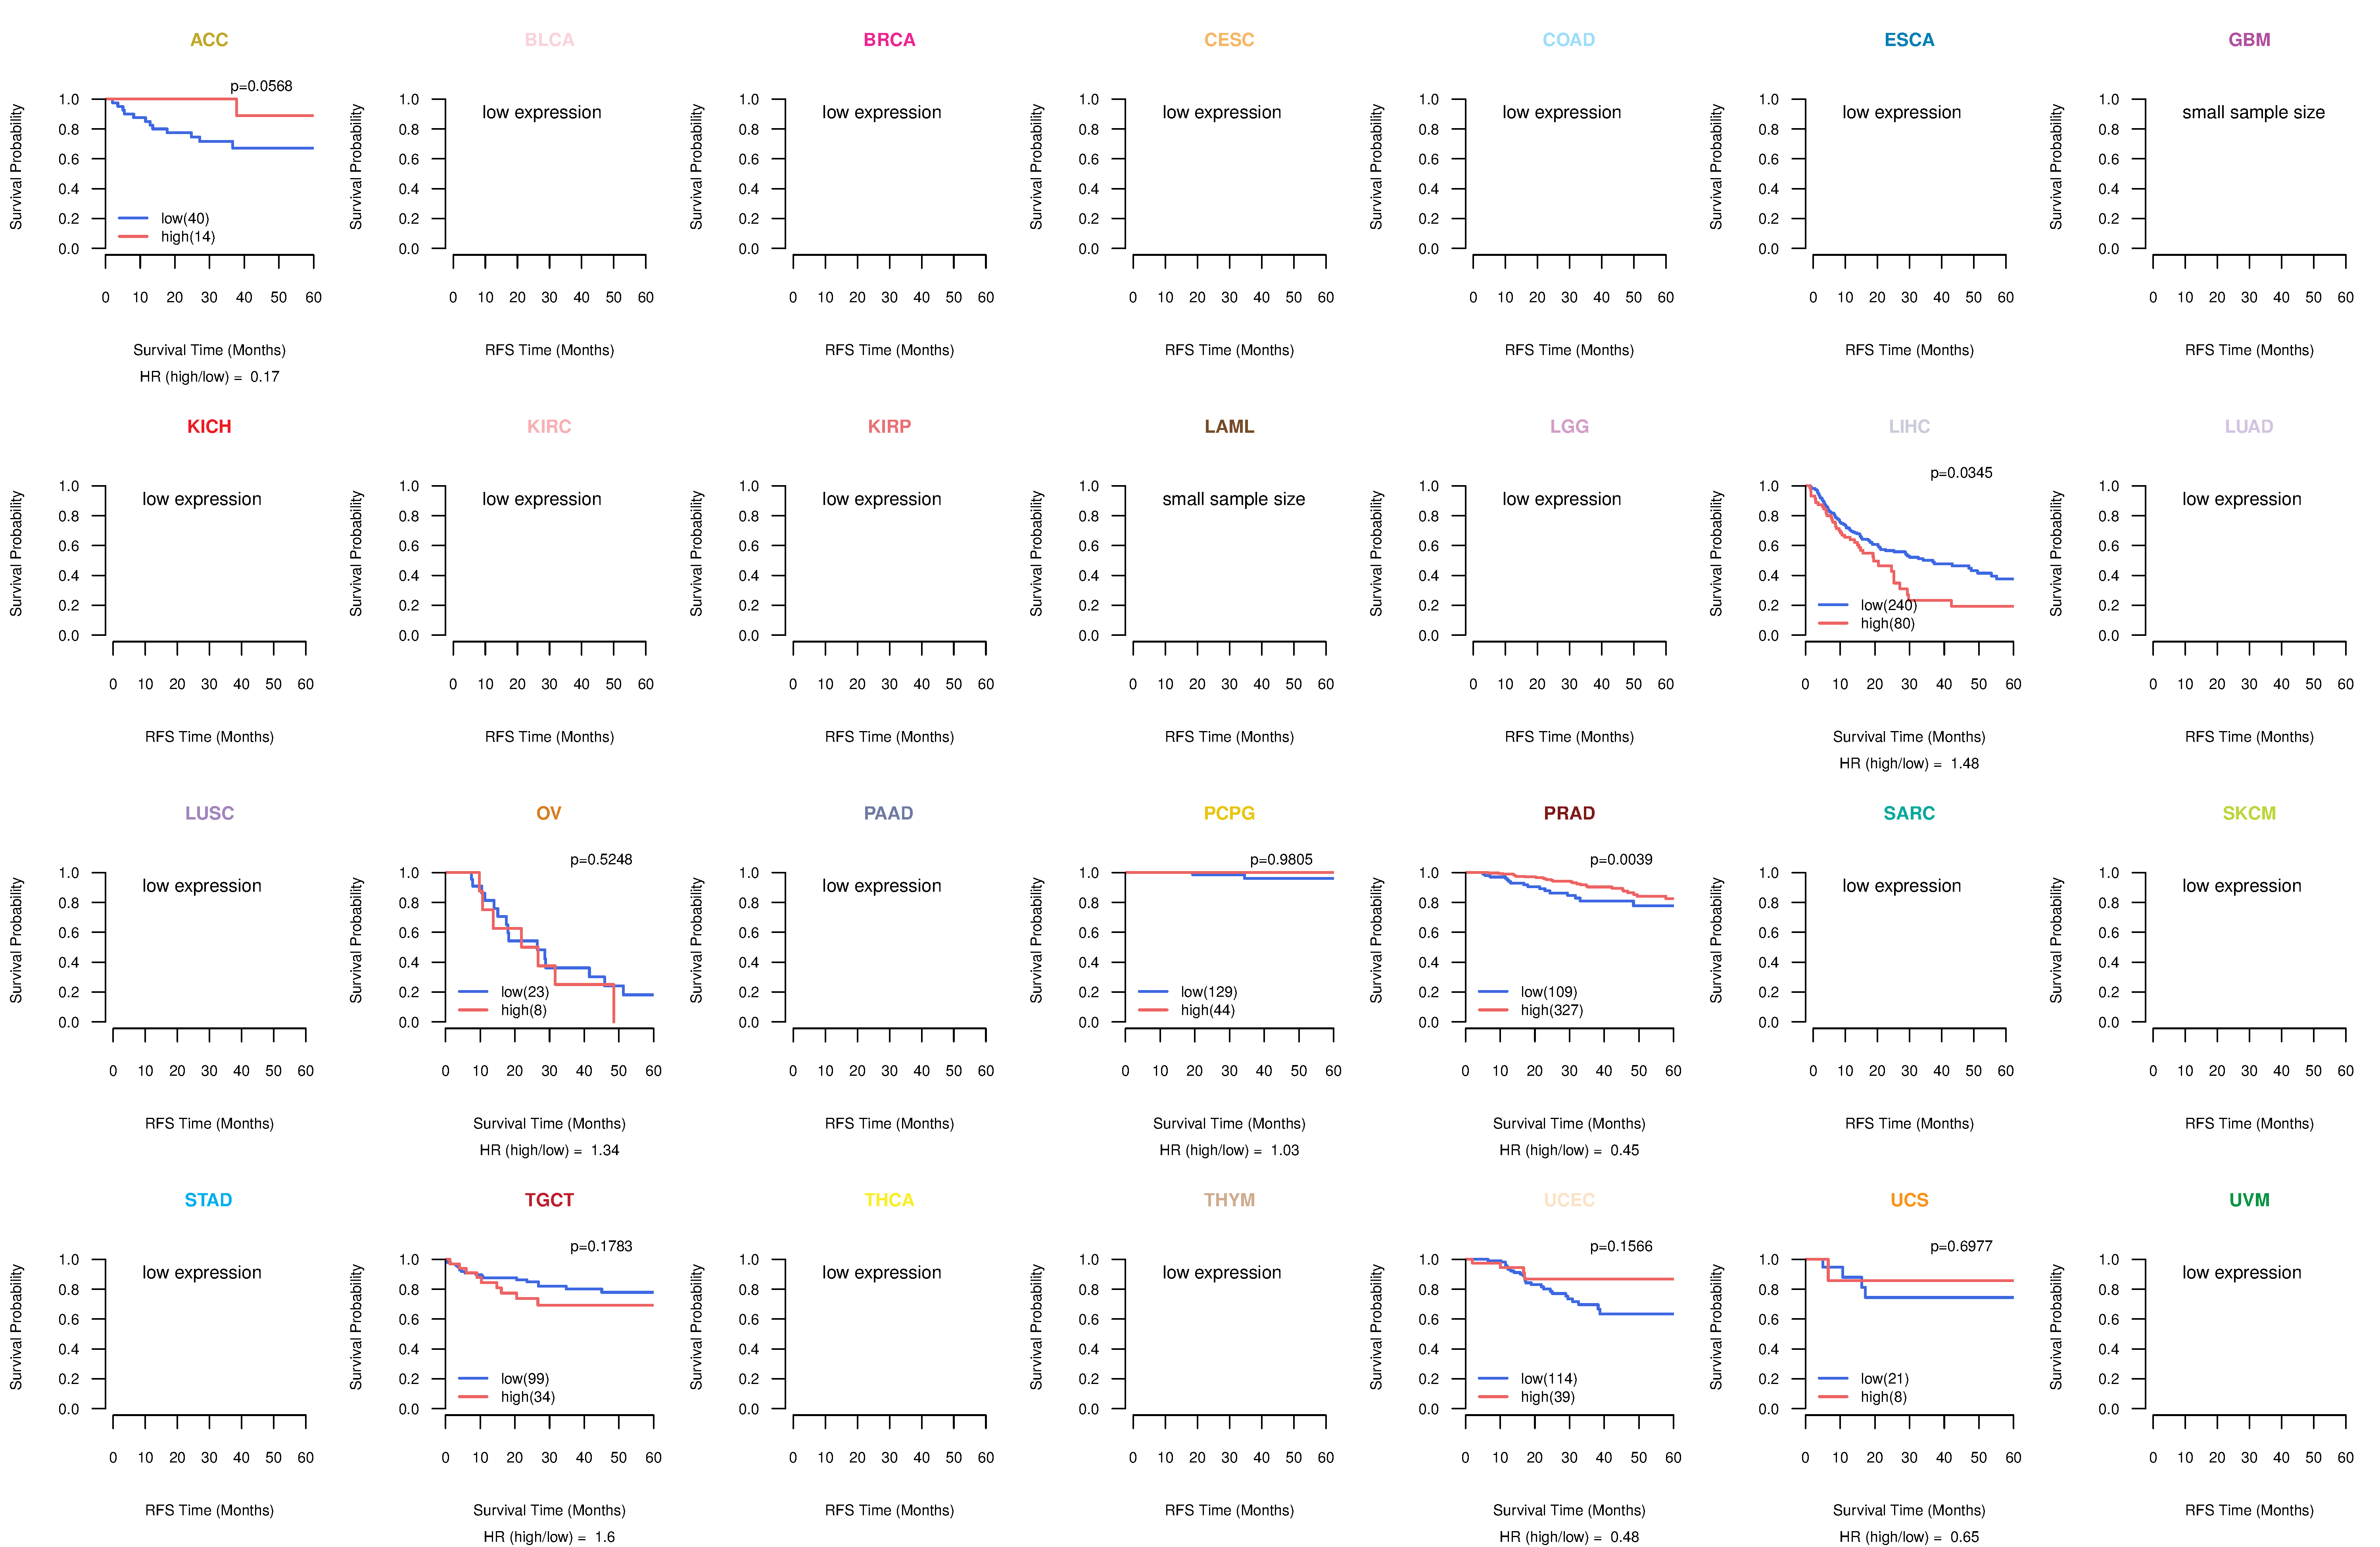
| Kaplan-Meier plots with logrank tests of overall survival (OS) using 28 cancer types (TCGA IlluminaHiSeq_RNASeqV2, pan-cancer normalized log2(norm_counts+1) data, version 2016-08-16) (TCGA clinicalMatrix, phenotype data, version 2016-04-27) * Click on the image to enlarge it in a new window. |
 |
| Kaplan-Meier plots with logrank test of relapse free survival (RFS) using 28 cancer types (TCGA IlluminaHiSeq_RNASeqV2, pan-cancer normalized log2(norm_counts+1) data, version 2016-08-16) (TCGA clinicalMatrix, phenotype data, version 2016-04-27) * Click on the image enlarge it in a new window. |
 |
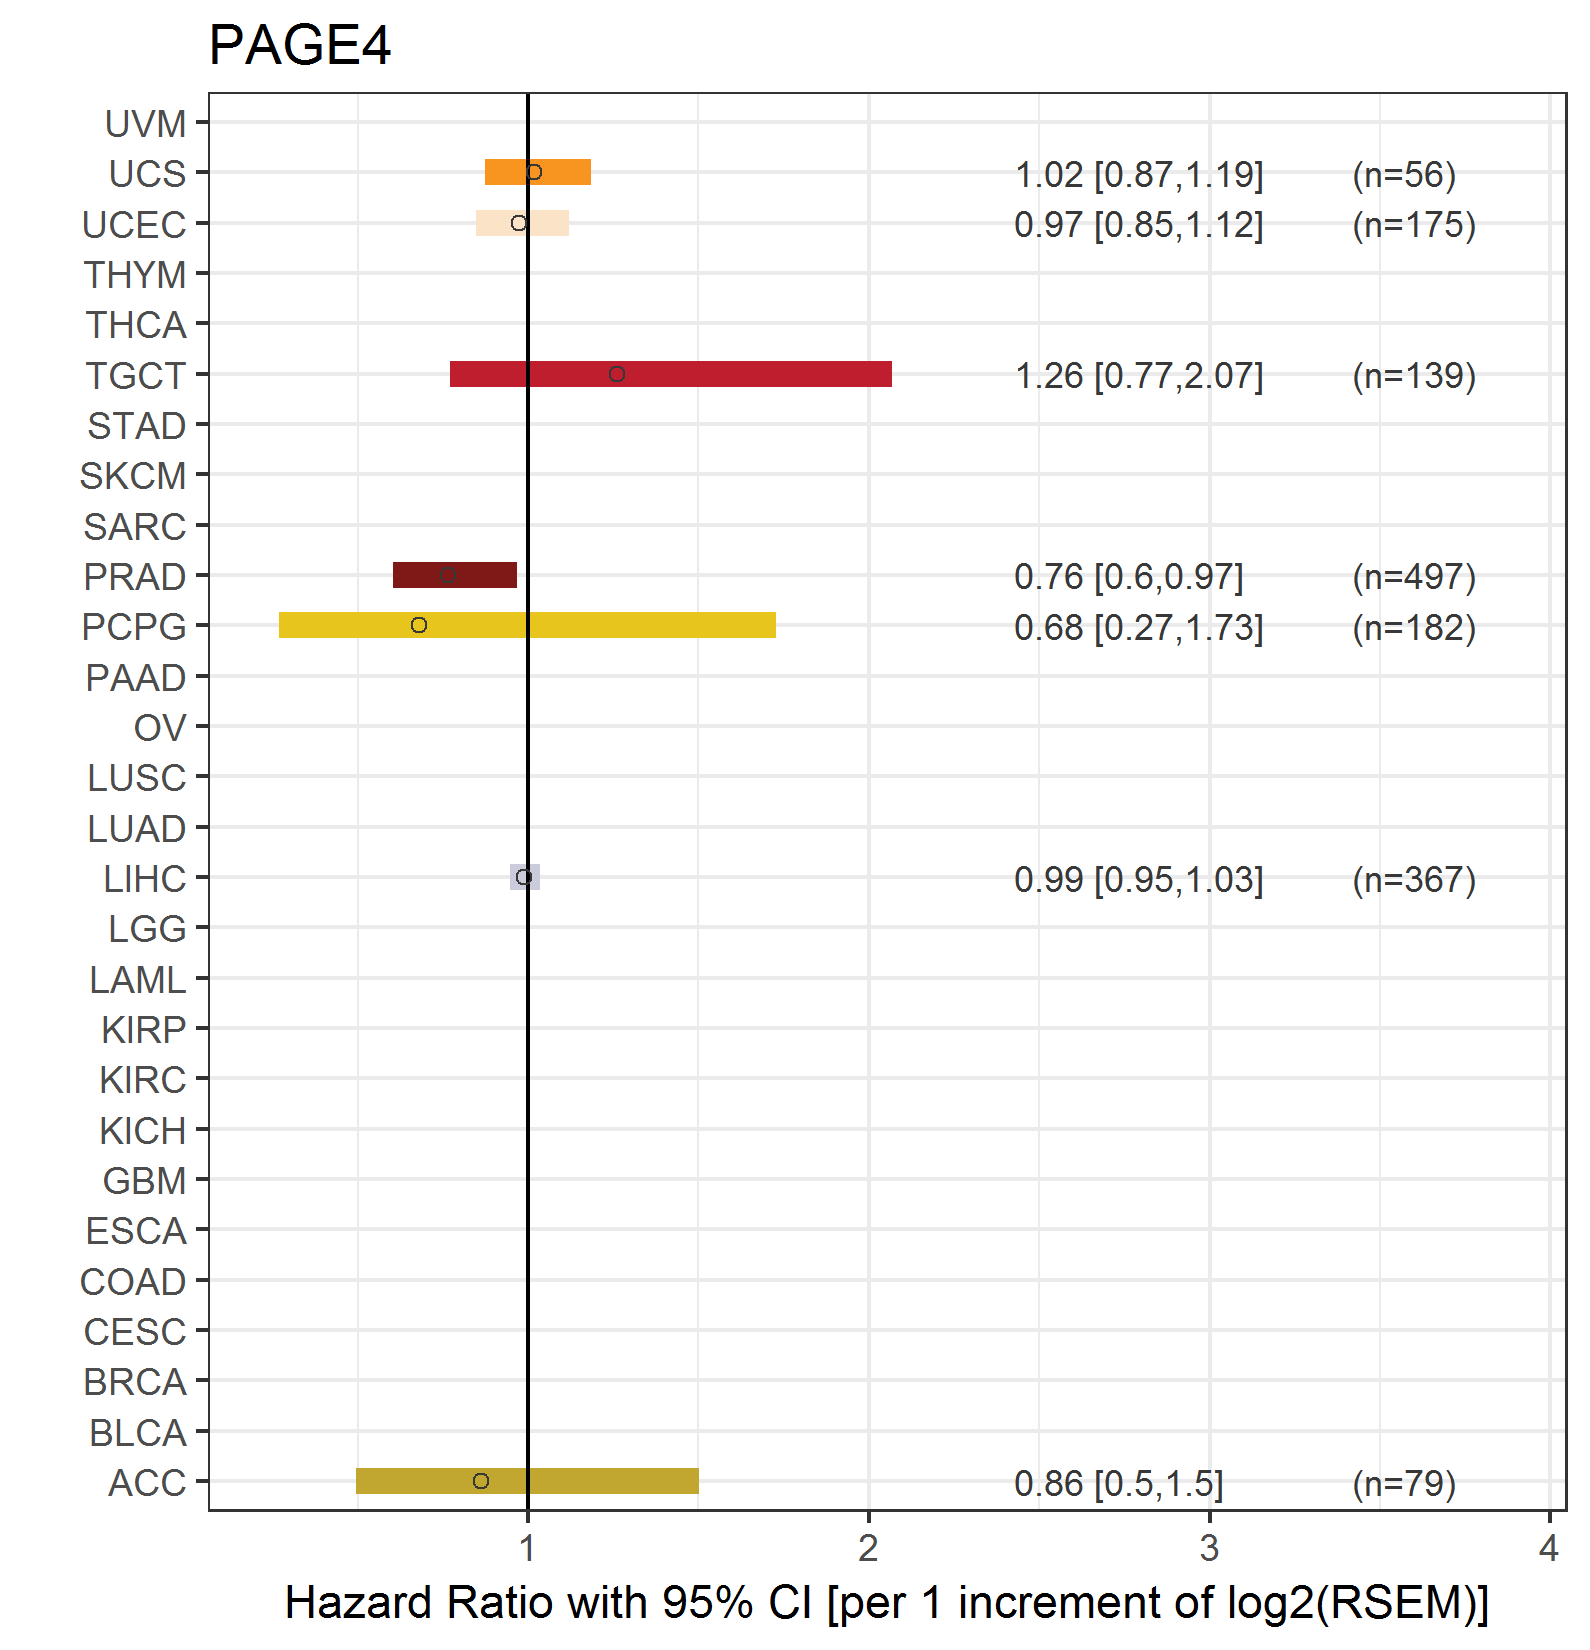
| Forest plot of Cox proportional hazard ratio (HR) and 95% CI of overall survival (OS) using 28 cancer types (TCGA IlluminaHiSeq_RNASeqV2, pan-cancer normalized log2(norm_counts+1) data, version 2016-08-16) (TCGA clinicalMatrix, phenotype data, version 2016-04-27) * Click on the image enlarge it in a new window. |
 |
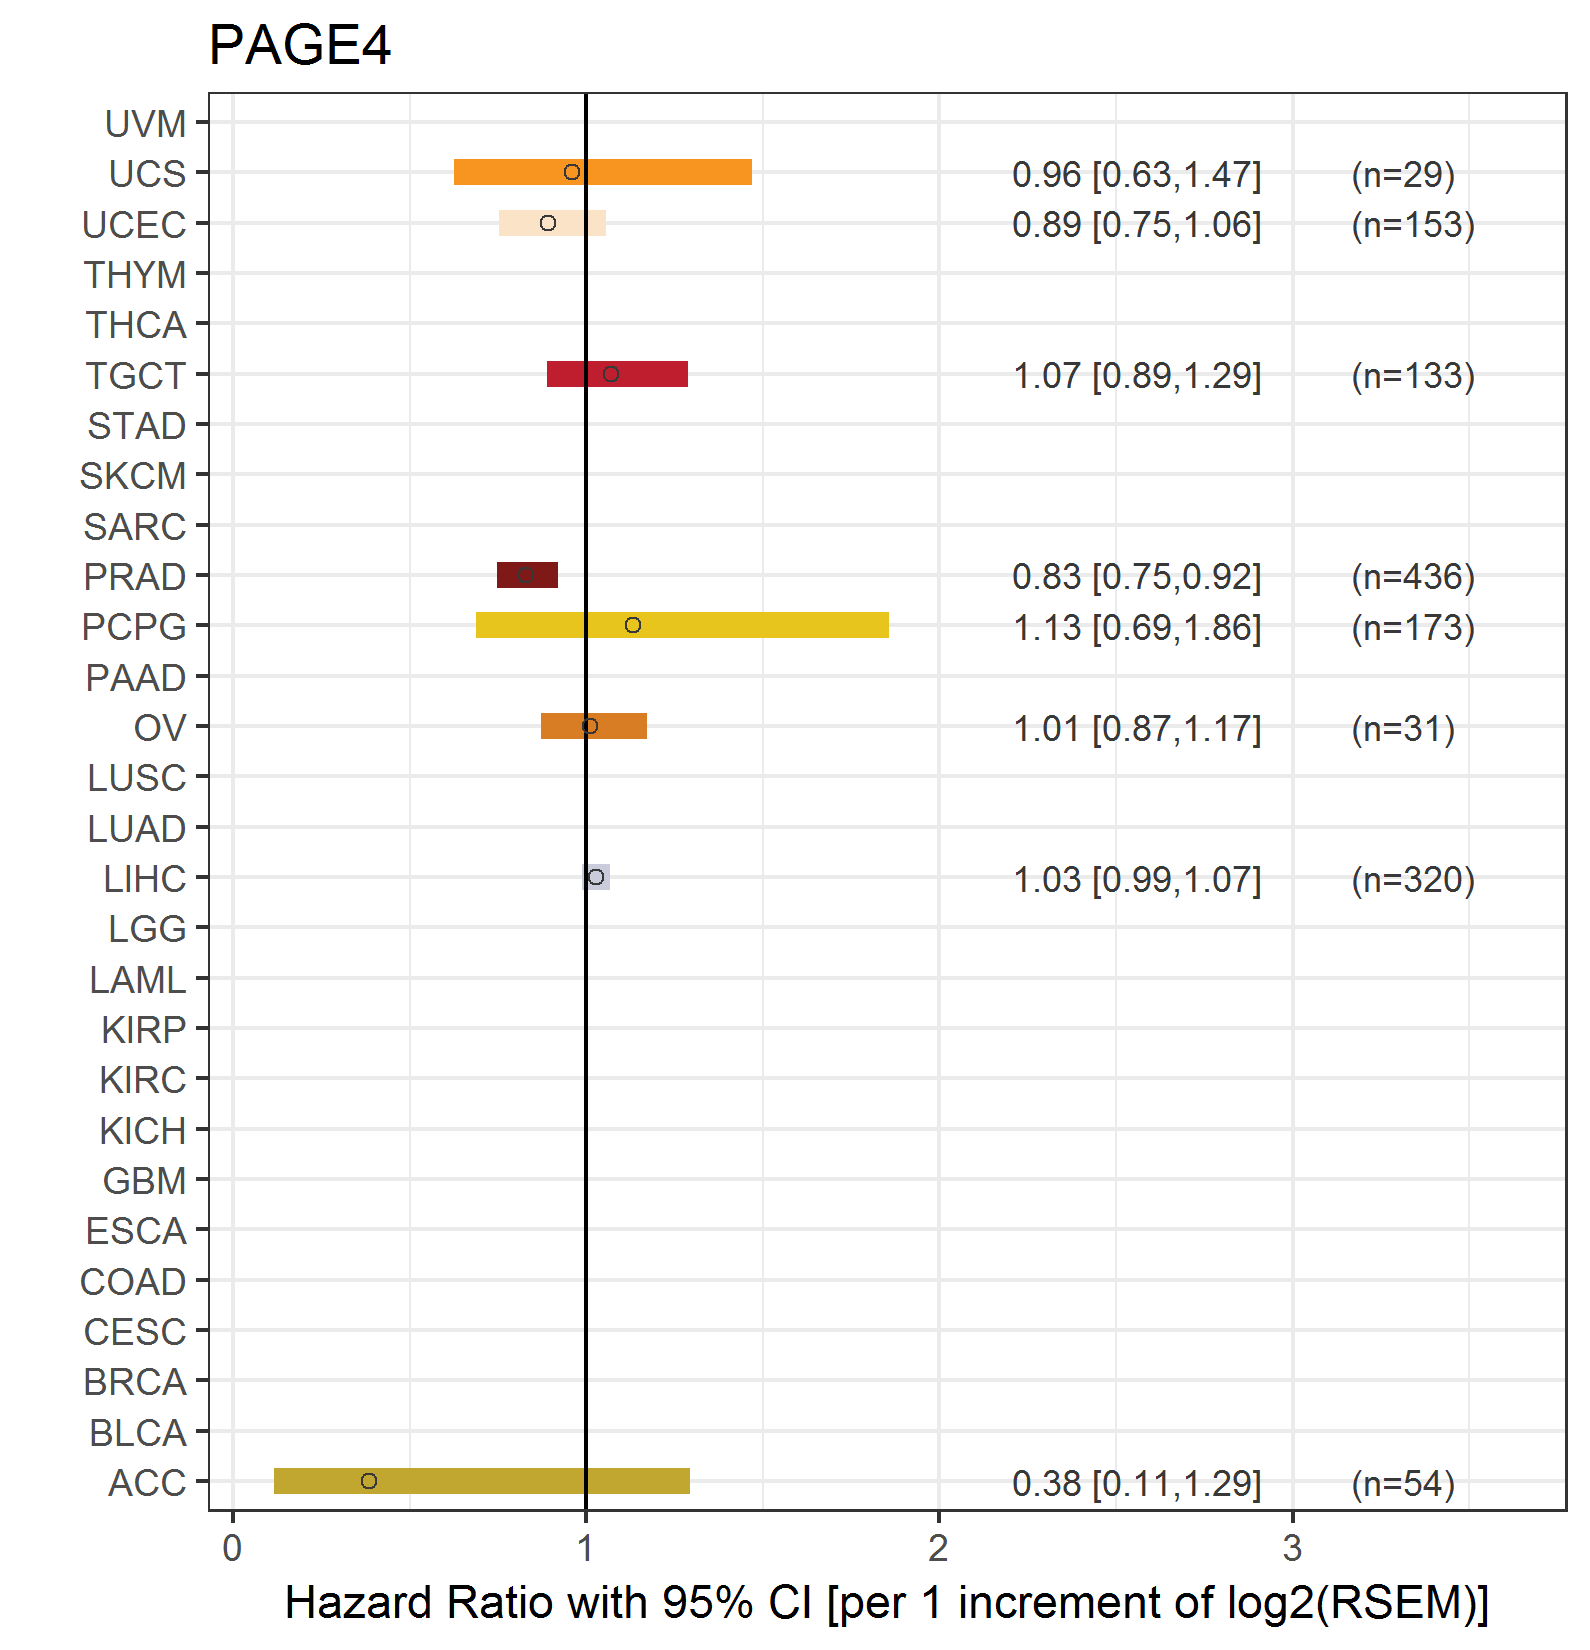
| Forest plot of Cox proportional hazard ratio (HR) and 95% CI of relapse free survival (RFS) using 28 cancer types (TCGA IlluminaHiSeq_RNASeqV2, pan-cancer normalized log2(norm_counts+1) data, version 2016-08-16) (TCGA clinicalMatrix, phenotype data, version 2016-04-27) * Click on the image enlarge it in a new window. |
 |
| Top |
| TissGeneClin for PAGE4 |
| TissGeneDrug for PAGE4 |
| Drug information targeting TissGene (DrugBank Version 5.0.6, 2017-04-01) |
| DrugBank ID | Drug name | Drug activity | Drug type | Drug status |
| Top |
| TissGeneDisease for PAGE4 |
| Disease information associated with TissGene (DisGeNet, 2016-06-01) |
| Disease ID | Disease name | # pubmeds | Source |
| umls:C0009402 | Colorectal Carcinoma | 1 | BeFree |
| umls:C0025202 | melanoma | 1 | BeFree |
| umls:C0027626 | Neoplasm Invasiveness | 1 | CTD_human |
| umls:C0038356 | Stomach Neoplasms | 1 | LHGDN |
| umls:C0205851 | Germ cell tumor | 1 | BeFree |
| umls:C0376358 | Malignant neoplasm of prostate | 1 | BeFree |
| umls:C0494165 | Secondary malignant neoplasm of liver | 1 | BeFree |
| umls:C0600139 | Prostate carcinoma | 1 | BeFree |
| umls:C1527249 | Colorectal Cancer | 1 | BeFree |
| umls:C1704272 | Benign Prostatic Hyperplasia | 1 | BeFree |
|
Copyright 2016-Present - The University of Texas Health Science Center at Houston (UTHealth) Web File Viewing | How to Report, Fraud, Waste and Abuse | State of Texas | Statewide Search | Texas Homeland Security | Site Policies |