 |
| |
| |
| |
| |
| |
| |
|

| TissGeneSummary for IGDCC3 |
 Gene summary Gene summary |
| Basic gene information | Gene symbol | IGDCC3 |
| Gene name | immunoglobulin superfamily, DCC subclass, member 3 | |
| Synonyms | HsT18880|PUNC | |
| Cytomap | UCSC genome browser: 15q22.3-q23 | |
| Type of gene | protein-coding | |
| RefGenes | NM_004884.3, | |
| Description | immunoglobulin superfamily DCC subclass member 3putative neuronal cell adhesion molecule | |
| Modification date | 20141207 | |
| dbXrefs | MIM : 604184 | |
| HGNC : HGNC | ||
| Ensembl : ENSG00000174498 | ||
| HPRD : 09169 | ||
| Vega : OTTHUMG00000133137 | ||
| Protein | UniProt: go to UniProt's Cross Reference DB Table | |
| Expression | CleanEX: HS_IGDCC3 | |
| BioGPS: 9543 | ||
| Pathway | NCI Pathway Interaction Database: IGDCC3 | |
| KEGG: IGDCC3 | ||
| REACTOME: IGDCC3 | ||
| Pathway Commons: IGDCC3 | ||
| Context | iHOP: IGDCC3 | |
| ligand binding site mutation search in PubMed: IGDCC3 | ||
| UCL Cancer Institute: IGDCC3 | ||
| Assigned class in TissGDB* | C | |
| Included tissue-specific gene expression resources | TiGER,GTEx | |
| Specific-tissues in normal samples (assigned by TissGDB using HPA, TiGER, and GTEx) | TestisEye | |
| Cancer types related to the specific-tissues in cancer samples (assigned by TissGDB using TCGA) | TGCTUVM | |
| Reference showing the relevant tissue of IGDCC3 | ||
| Description by TissGene annotations | ||
| * Class A consists of genes with literature evidence and is part of the cTissGenes. Class B consists of only cTissGenes without additional evidence. The remaining genes belong to Class C. |
| Gene ontology having evidence of Inferred from Direct Assay (IDA) from Entrez |
| GO ID | GO term | PubMed ID |
| Top |
| TissGeneExp for IGDCC3 |
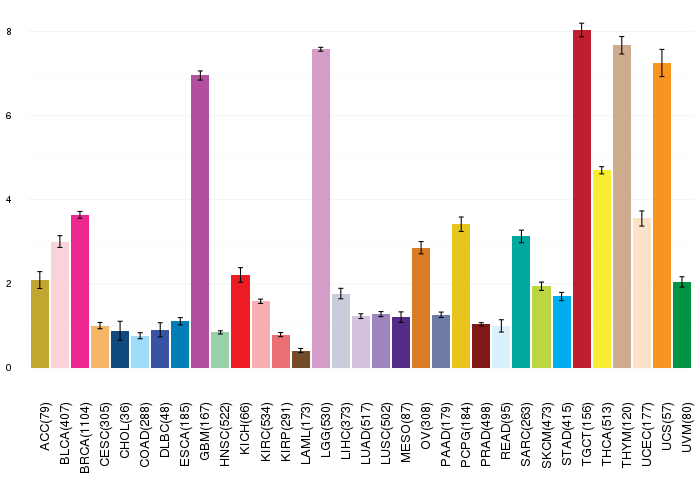
| Gene expressions across 28 cancer types (X-axis: cancer type and Y-axis: log2(norm_counts+1)) (TCGA IlluminaHiSeq_RNASeqV2, pan-cancer normalized log2(norm_counts+1) data, version 2016-08-16) |
 |
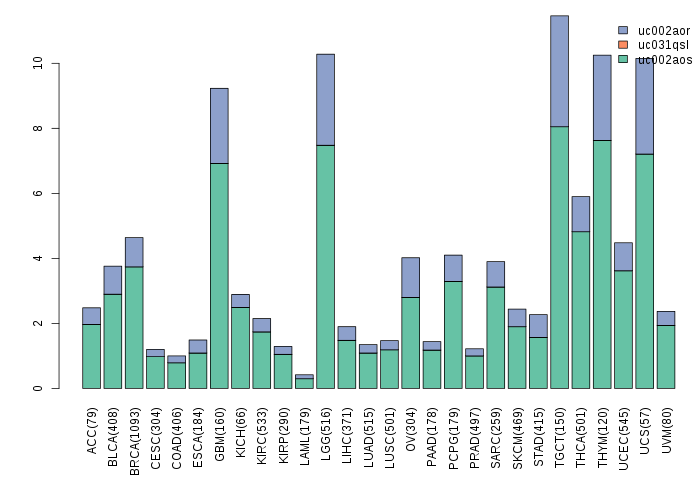
| Gene isoform expressions across 28 cancer types (X-axis: cancer type and Y-axis: log2(norm_counts+1)) (TCGA pan-cancer tcga_rsem_isoform_tpm, version 2016-09-01) |
 |
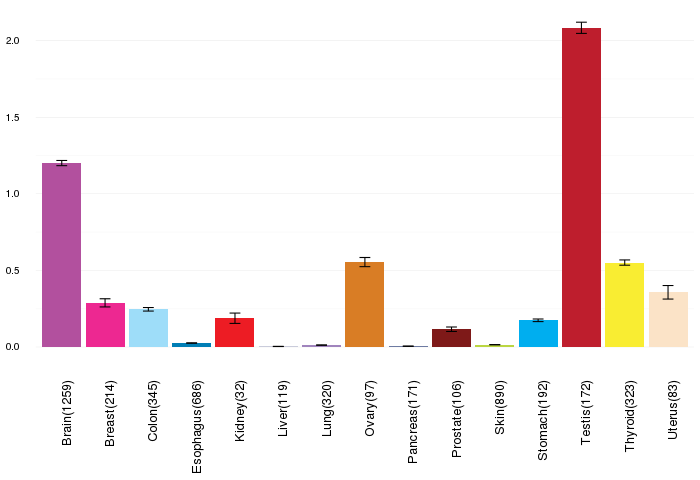
| Gene expressions across normal tissues of GTEx data (GTEx GTEx_Analysis_v6_RNA-seq_RNA-SeQCv1.1.8_gene_rpkm.gct) - Here, we shows the matched tissue types only among our 28 cancer types. |
 |
| Different expressions across 14 cancer types with more than 10 samples between matched tumors and normals (X-axis: cancer type and Y-axis: log2(norm_counts+1)) (TCGA IlluminaHiSeq_RNASeqV2, pan-cancer normalized log2(norm_counts+1) data, version 2016-08-16) |
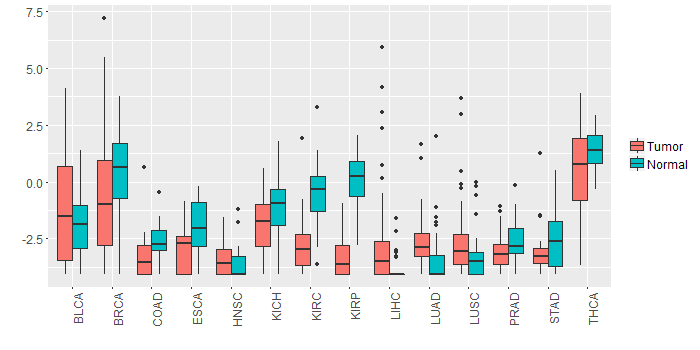 |
| - Significantly differentially expressed cancer types and information. (|Fold change|>1 and FDR<0.05) |
| Cancer type | Mean(exp) in tumor | Mean(exp) in matched normal | Log2FC | P-val. | FDR |
| KIRC | -2.794738139 | -0.485403417 | -2.309334722 | 4.23E-23 | 4.29E-22 |
| KIRP | -3.365106542 | 0.049762208 | -3.41486875 | 2.28E-18 | 1.09E-16 |
| KICH | -1.983090917 | -0.974538917 | -1.008552 | 0.00639 | 0.011986009 |
| LIHC | -2.657530917 | -3.907988917 | 1.250458 | 0.000405 | 0.001205771 |
| BRCA | -0.734370741 | 0.32220382 | -1.056574561 | 0.000542 | 0.00109665 |
| Top |
| TissGene-miRNA for IGDCC3 |
| Significantly anti-correlated miRNAs of TissGene across 28 cancer types (Gene-miRNA relations from TargetScanHuman Relsease 7.1, Conserved_Site_Context_Scores.txt.zip, 06.01.2016) (TCGA IlluminaHiSeq_miRNASeq, log2(RPM+1) data, version 2016-11-21) (TCGA IlluminaHiSeq_RNASeqV2, log2(normalized_count+1) data, version 2016-08-16) (Spearman’s Rank Correlation (p-value<0.05 and coefficient<-0.25)) |
| Cancer type | miRNA id | miRNA accession | P-val. | Coeff. | # samples |
| ACC | hsa-miR-4262 | MIMAT0016894 | 0.025 | -0.26 | 78 |
| ACC | hsa-miR-4262 | MIMAT0016894 | 0.025 | -0.26 | 78 |
| Top |
| TissGeneMut for IGDCC3 |
| TissGeneSNV for IGDCC3 |
| nsSNV counts per each loci. Different colors of circles represent different cancer types. Circle size denotes number of samples. (TCGA somatic mutation (SNPs and small INDELs) data, version 2016-04-25) * Click on the image to enlarge it in a new window. |
 |
 |
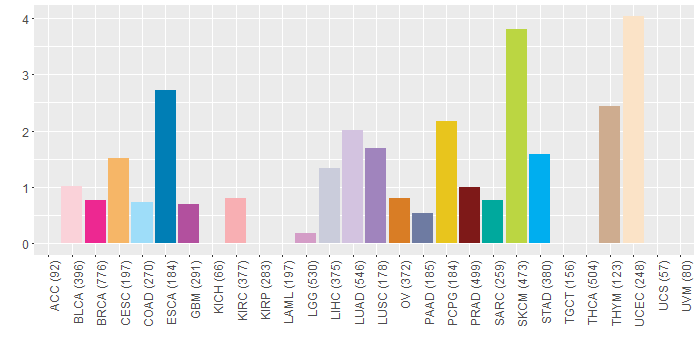
| Somatic nucleotide variants of TissGene across 28 cancer types (X-axis: cancer type and Y-axis: % of mutated samples) The numbers in parentheses are numbers of samples with mutation (nsSNVs). (TCGA somatic mutation (SNPs and small INDELs) data, version 2016-04-25) |
 |
| - nsSNVs sorted by frequency. |
| AAchange | Cancer type | # samples |
| p.V751L | PCPG | 4 |
| p.R805W | SKCM | 2 |
| p.P786T | LUAD | 1 |
| p.R200G | BLCA | 1 |
| p.R608H | LIHC | 1 |
| p.Q146H | ESCA | 1 |
| p.E184Q | BRCA | 1 |
| p.T319K | ESCA | 1 |
| p.G391S | UCEC | 1 |
| p.S750Y | SKCM | 1 |
| p.E41K | READ | 1 |
| p.V589M | UCEC | 1 |
| p.A493V | SKCM | 1 |
| p.A774V | SKCM | 1 |
| p.E709K | CESC | 1 |
| p.V673A | LUAD | 1 |
| p.E453A | UCEC | 1 |
| p.E813* | LUAD | 1 |
| p.R414M | ESCA | 1 |
| p.S578F | BLCA | 1 |
| p.P730L | ESCA | 1 |
| p.Q599K | LUAD | 1 |
| p.R277C | SKCM | 1 |
| p.V751L | BRCA | 1 |
| p.V304I | LUAD | 1 |
| p.E41* | KIRC | 1 |
| p.V251M | UCEC | 1 |
| p.A500T | LUSC | 1 |
| p.R132C | SKCM | 1 |
| p.R664M | LUAD | 1 |
| p.A620S | PRAD | 1 |
| p.H100P | HNSC | 1 |
| p.R200Q | UCEC | 1 |
| p.D180H | CESC | 1 |
| p.E630K | HNSC | 1 |
| p.H38Q | LUAD | 1 |
| p.T575N | THYM | 1 |
| p.E617K | LUAD | 1 |
| p.E766K | BRCA | 1 |
| p.R176K | SKCM | 1 |
| p.V642I | THYM | 1 |
| p.E813K | CESC | 1 |
| p.R431W | STAD | 1 |
| p.N381S | LIHC | 1 |
| p.G778S | UCEC | 1 |
| p.P683S | SKCM | 1 |
| p.A211V | PRAD | 1 |
| p.G644V | OV | 1 |
| p.P426H | PAAD | 1 |
| p.P426T | LUAD | 1 |
| p.Q583K | THYM | 1 |
| p.G425R | SKCM | 1 |
| p.E469G | OV | 1 |
| p.A136E | LUAD | 1 |
| p.M348L | OV | 1 |
| p.P586S | SKCM | 1 |
| p.V592A | UCEC | 1 |
| p.L90W | BRCA | 1 |
| p.E403* | LUSC | 1 |
| p.E551K | LUAD | 1 |
| p.R200* | BRCA | 1 |
| p.R711C | LGG | 1 |
| p.A727S | STAD | 1 |
| p.V435M | LIHC | 1 |
| p.P683S | STAD | 1 |
| p.R157C | SKCM | 1 |
| p.F721L | KIRC | 1 |
| p.R702W | LIHC | 1 |
| p.A767V | COAD | 1 |
| p.R711C | UCEC | 1 |
| p.A211V | SKCM | 1 |
| p.R323L | COAD | 1 |
| p.A548V | SKCM | 1 |
| p.R431W | PRAD | 1 |
| p.E771V | GBM | 1 |
| p.V54I | ESCA | 1 |
| p.L96V | SKCM | 1 |
| p.G233R | SKCM | 1 |
| p.N175I | UCEC | 1 |
| p.G758S | BLCA | 1 |
| p.A588V | BRCA | 1 |
| p.M97I | SKCM | 1 |
| p.R72Q | PRAD | 1 |
| p.V149M | UCEC | 1 |
| p.R618K | SKCM | 1 |
| p.V440A | STAD | 1 |
| p.D182V | KIRC | 1 |
| p.A742T | LIHC | 1 |
| p.D708Y | SARC | 1 |
| p.T314I | LUSC | 1 |
| p.R707Q | SARC | 1 |
| p.A215T | STAD | 1 |
| p.A131D | LUAD | 1 |
| p.P55L | GBM | 1 |
| p.T319M | LGG | 1 |
| p.A810T | UCEC | 1 |
| p.E84* | BLCA | 1 |
| p.D203G | STAD | 1 |
| p.Q538H | PRAD | 1 |
| Top |
| TissGeneCNV for IGDCC3 |
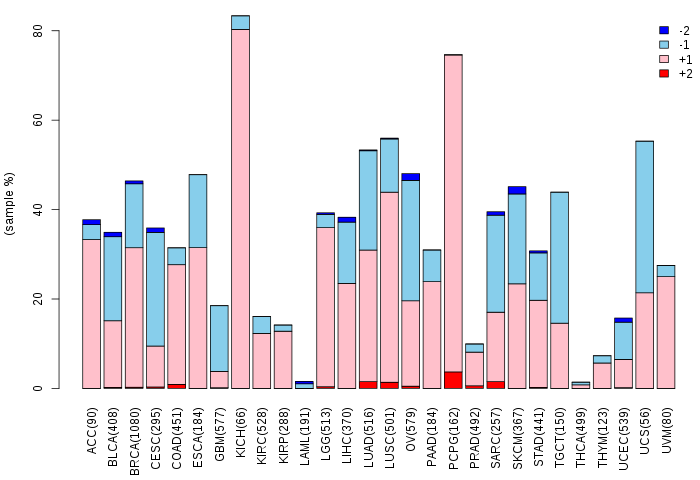
| Copy number variations of TissGene across 28 cancer types (X-axis: cancer type and Y-axis: % of CNV samples) (TCGA Gistic2_CopyNumber_Gistic2_all_data_by_genes, Gistic2 copy number data, version 2016-08-16) |
 |
| Top |
| TissGeneFusions for IGDCC3 |
| Fusion genes including TissGene (ChimerDB 3.0, 2016-12-01 and TCGA fusion Portal 2015-12-01) |
| Database | Src | Cancer type | Sample | Fusion gene | ORF | 5'-gene BP | 3'-gene BP |
| Chimerdb3.0 | ChiTaRs | NA | BE093173 | IGDCC3-TNRC18 | chr15:65622103 | chr7:5432773 | |
| Chimerdb3.0 | ChiTaRs | NA | R23707 | IGDCC3-KIF3B | chr15:65621004 | chr20:30922597 | |
| Chimerdb3.0 | FusionScan | LGG | TCGA-DB-5277-01A | IGDCC3-GLDN | In-Frame | chr15:65667434 | chr15:51675981 |
| TCGAfusionPortal | PRADA | LGG | TCGA-DB-5277-01A | IGDCC3-GLDN | In-frame | Chr15:65667435 | Chr15:51675982 |
| Top |
| TissGeneNet for IGDCC3 |
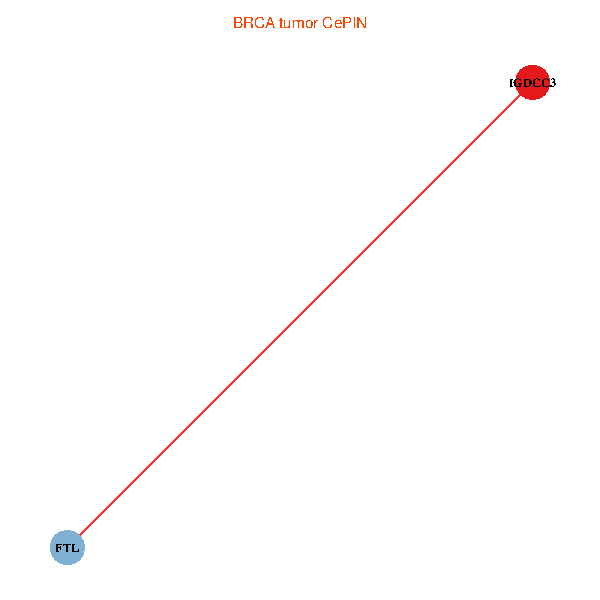
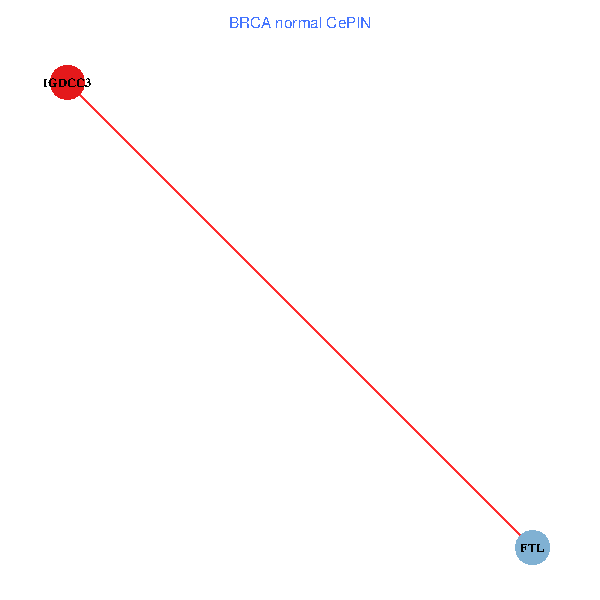
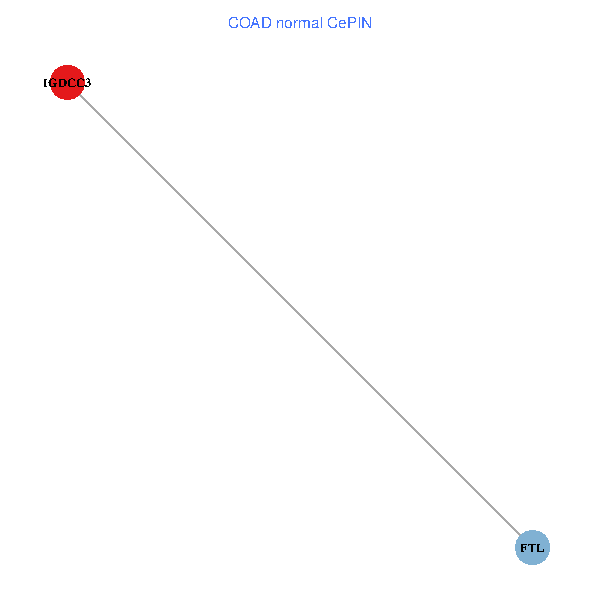
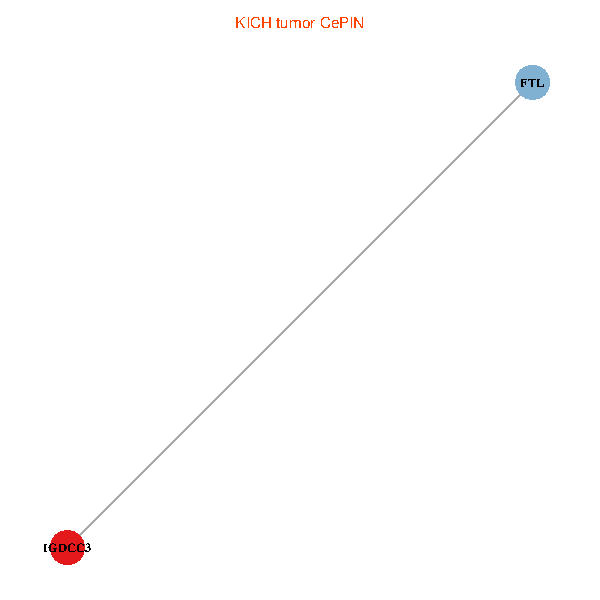
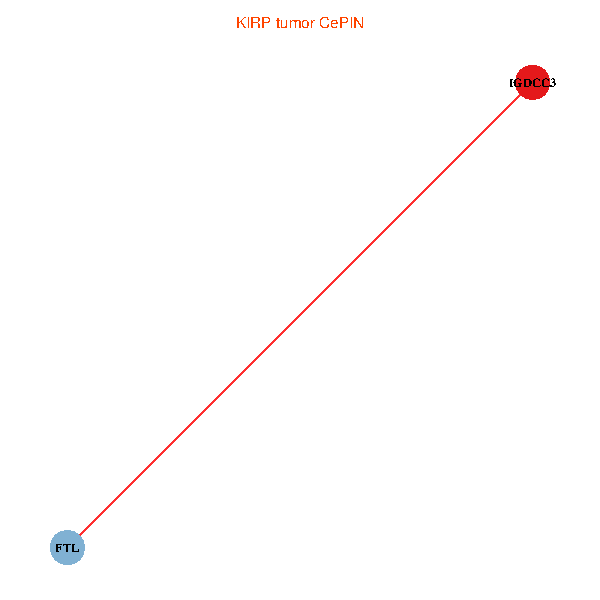
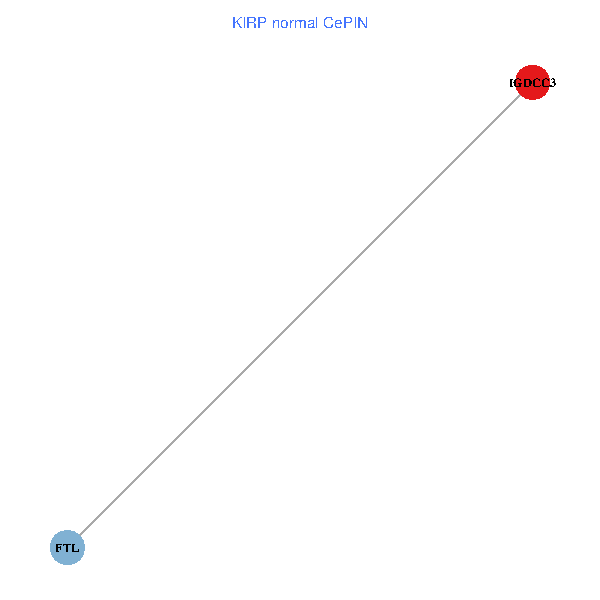
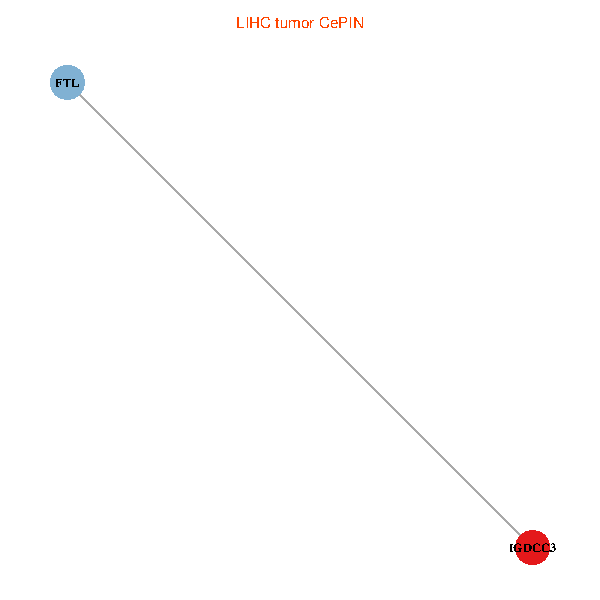
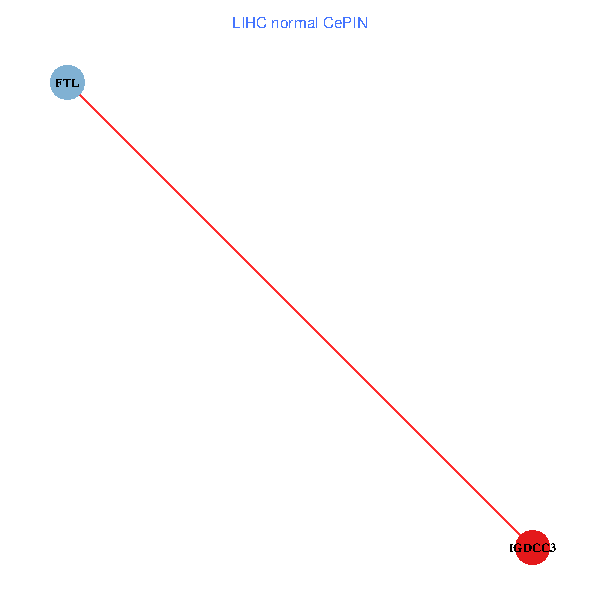
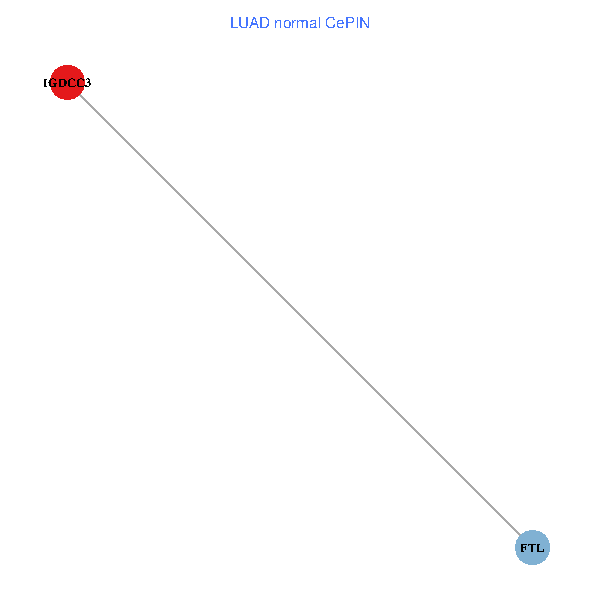
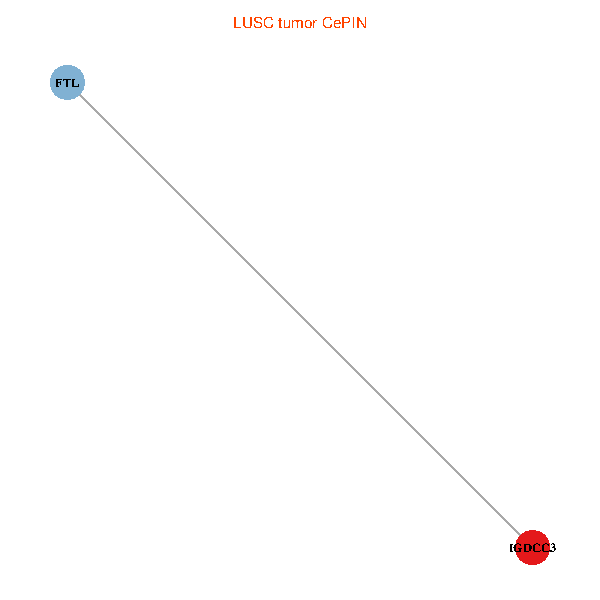
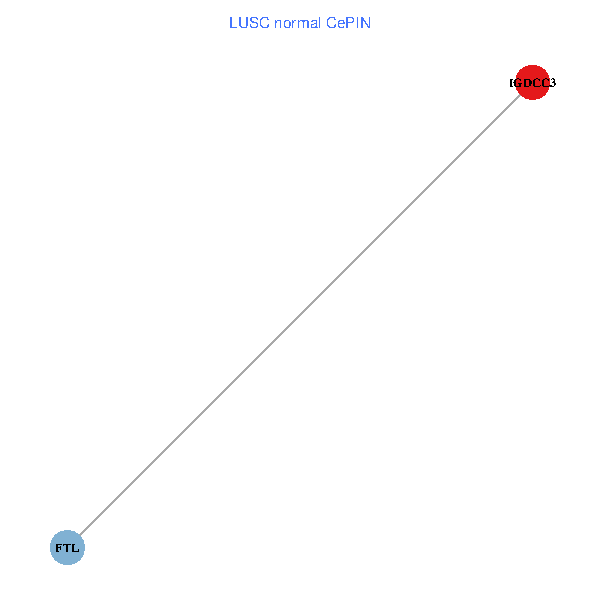
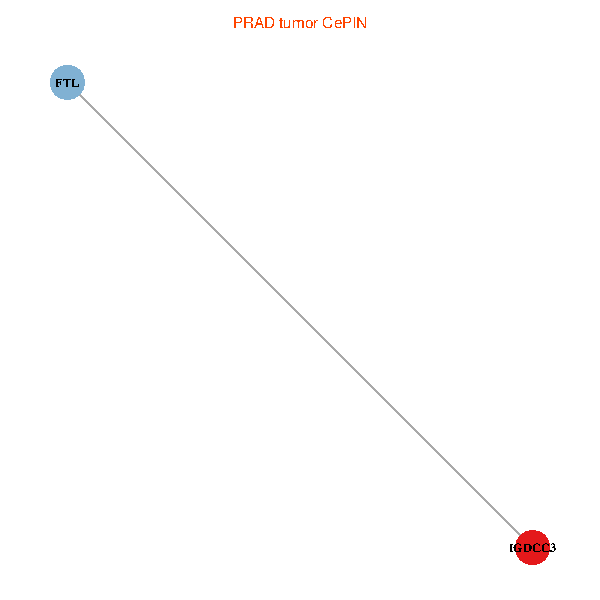
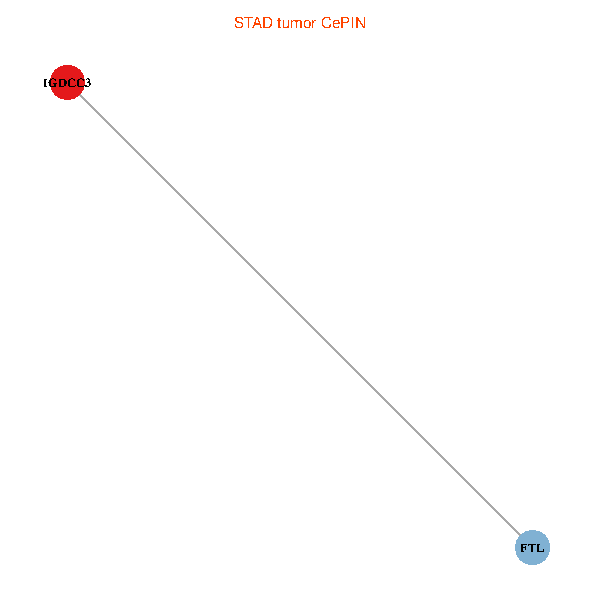
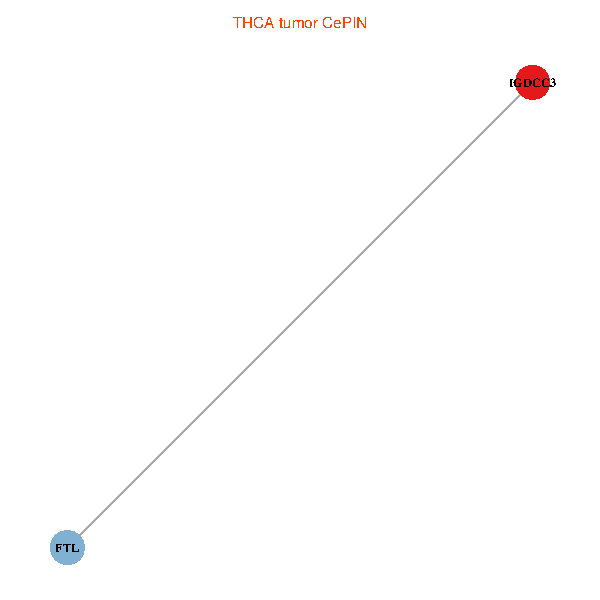
| Co-expressed gene networks based on protein-protein interaction data (CePIN) (TCGA IlluminaHiSeq_RNASeqV2, pan-cancer normalized log2(norm_counts+1) data, version 2016-08-16) (PINA2 ppi data) |
| BRCA (tumor) | BRCA (normal) |
| IGDCC3, FTL (tumor) | IGDCC3, FTL (normal) |
 |  |
| COAD (tumor) | COAD (normal) |
| IGDCC3, FTL (tumor) | IGDCC3, FTL (normal) |
 |  |
| HNSC (tumor) | HNSC (normal) |
| IGDCC3, FTL (tumor) | IGDCC3, FTL (normal) |
 |  |
| KICH (tumor) | KICH (normal) |
| IGDCC3, FTL (tumor) | IGDCC3, FTL (normal) |
 |  |
| KIRC (tumor) | KIRC (normal) |
| IGDCC3, FTL (tumor) | IGDCC3, FTL (normal) |
 |  |
| KIRP (tumor) | KIRP (normal) |
| IGDCC3, FTL (tumor) | IGDCC3, FTL (normal) |
 |  |
| LIHC (tumor) | LIHC (normal) |
| IGDCC3, FTL (tumor) | IGDCC3, FTL (normal) |
 |  |
| LUAD (tumor) | LUAD (normal) |
| IGDCC3, FTL (tumor) | IGDCC3, FTL (normal) |
 |  |
| LUSC (tumor) | LUSC (normal) |
| IGDCC3, FTL (tumor) | IGDCC3, FTL (normal) |
 |  |
| PRAD (tumor) | PRAD (normal) |
| IGDCC3, FTL (tumor) | IGDCC3, FTL (normal) |
 |  |
| STAD (tumor) | STAD (normal) |
| IGDCC3, FTL (tumor) | IGDCC3, FTL (normal) |
 |  |
| THCA (tumor) | THCA (normal) |
| IGDCC3, FTL (tumor) | IGDCC3, FTL (normal) |
 |  |
| Top |
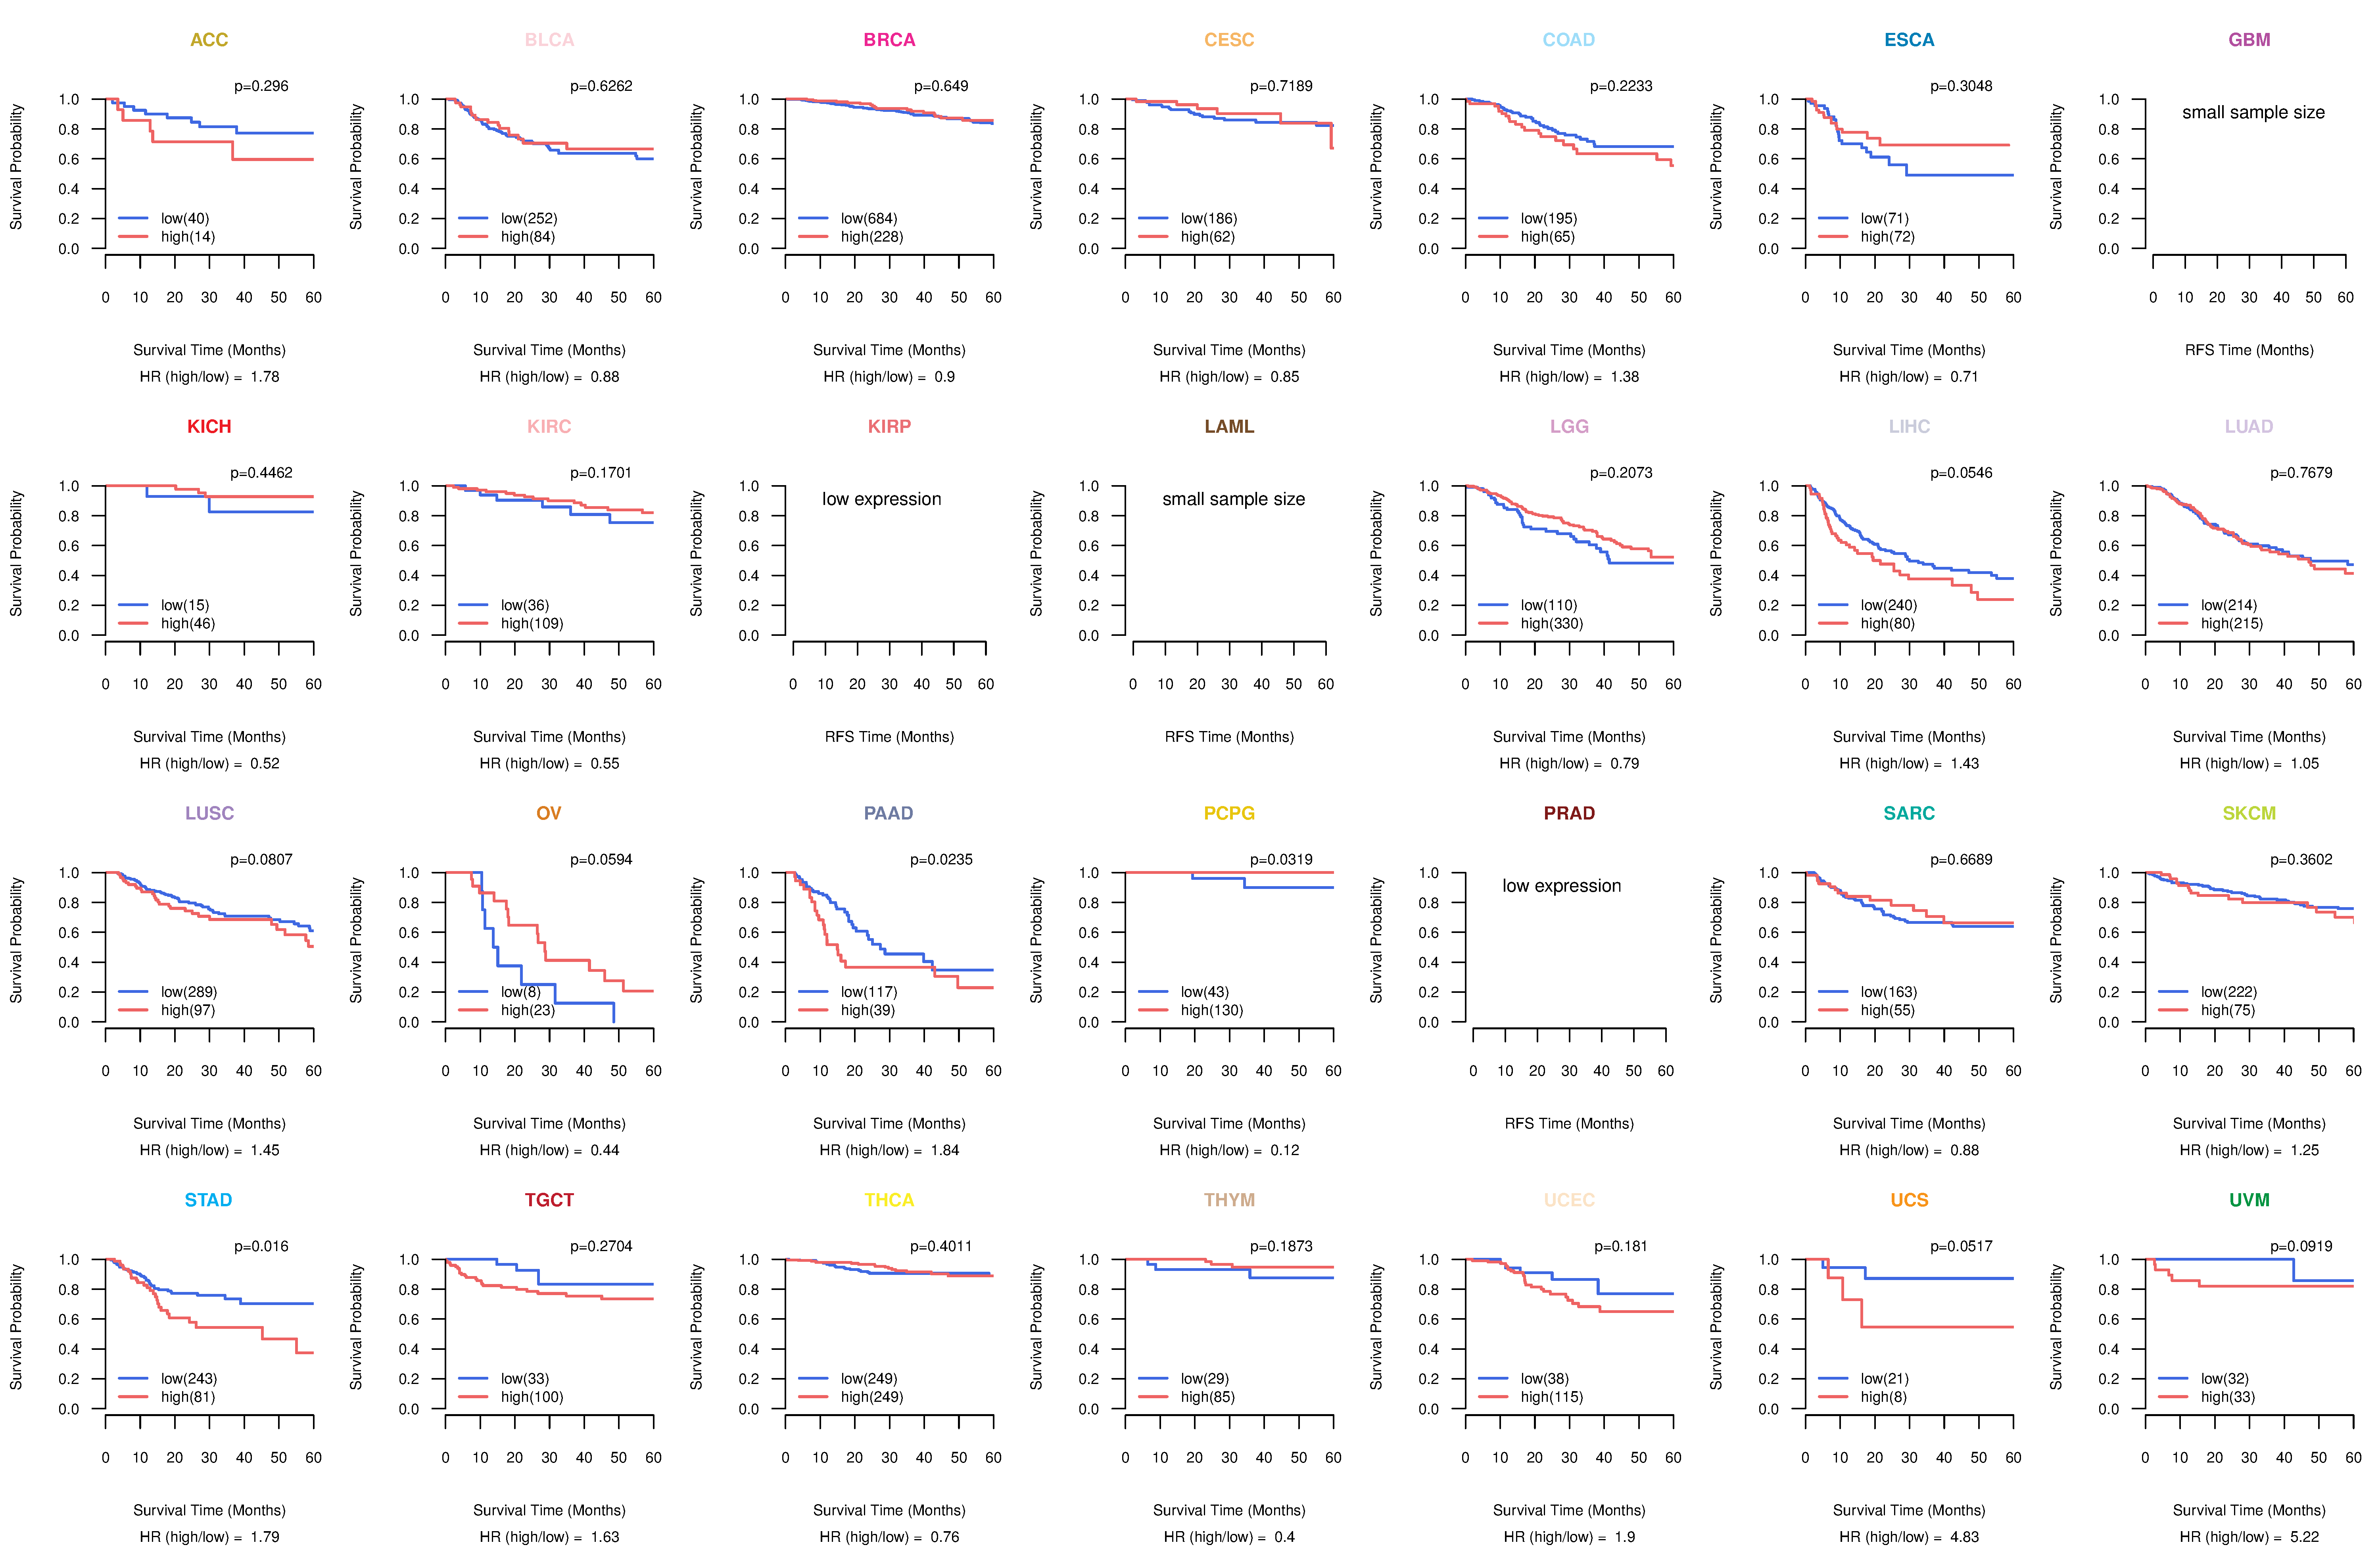
| TissGeneProg for IGDCC3 |
| Kaplan-Meier plots with logrank tests of overall survival (OS) using 28 cancer types (TCGA IlluminaHiSeq_RNASeqV2, pan-cancer normalized log2(norm_counts+1) data, version 2016-08-16) (TCGA clinicalMatrix, phenotype data, version 2016-04-27) * Click on the image to enlarge it in a new window. |
 |
| Kaplan-Meier plots with logrank test of relapse free survival (RFS) using 28 cancer types (TCGA IlluminaHiSeq_RNASeqV2, pan-cancer normalized log2(norm_counts+1) data, version 2016-08-16) (TCGA clinicalMatrix, phenotype data, version 2016-04-27) * Click on the image enlarge it in a new window. |
 |
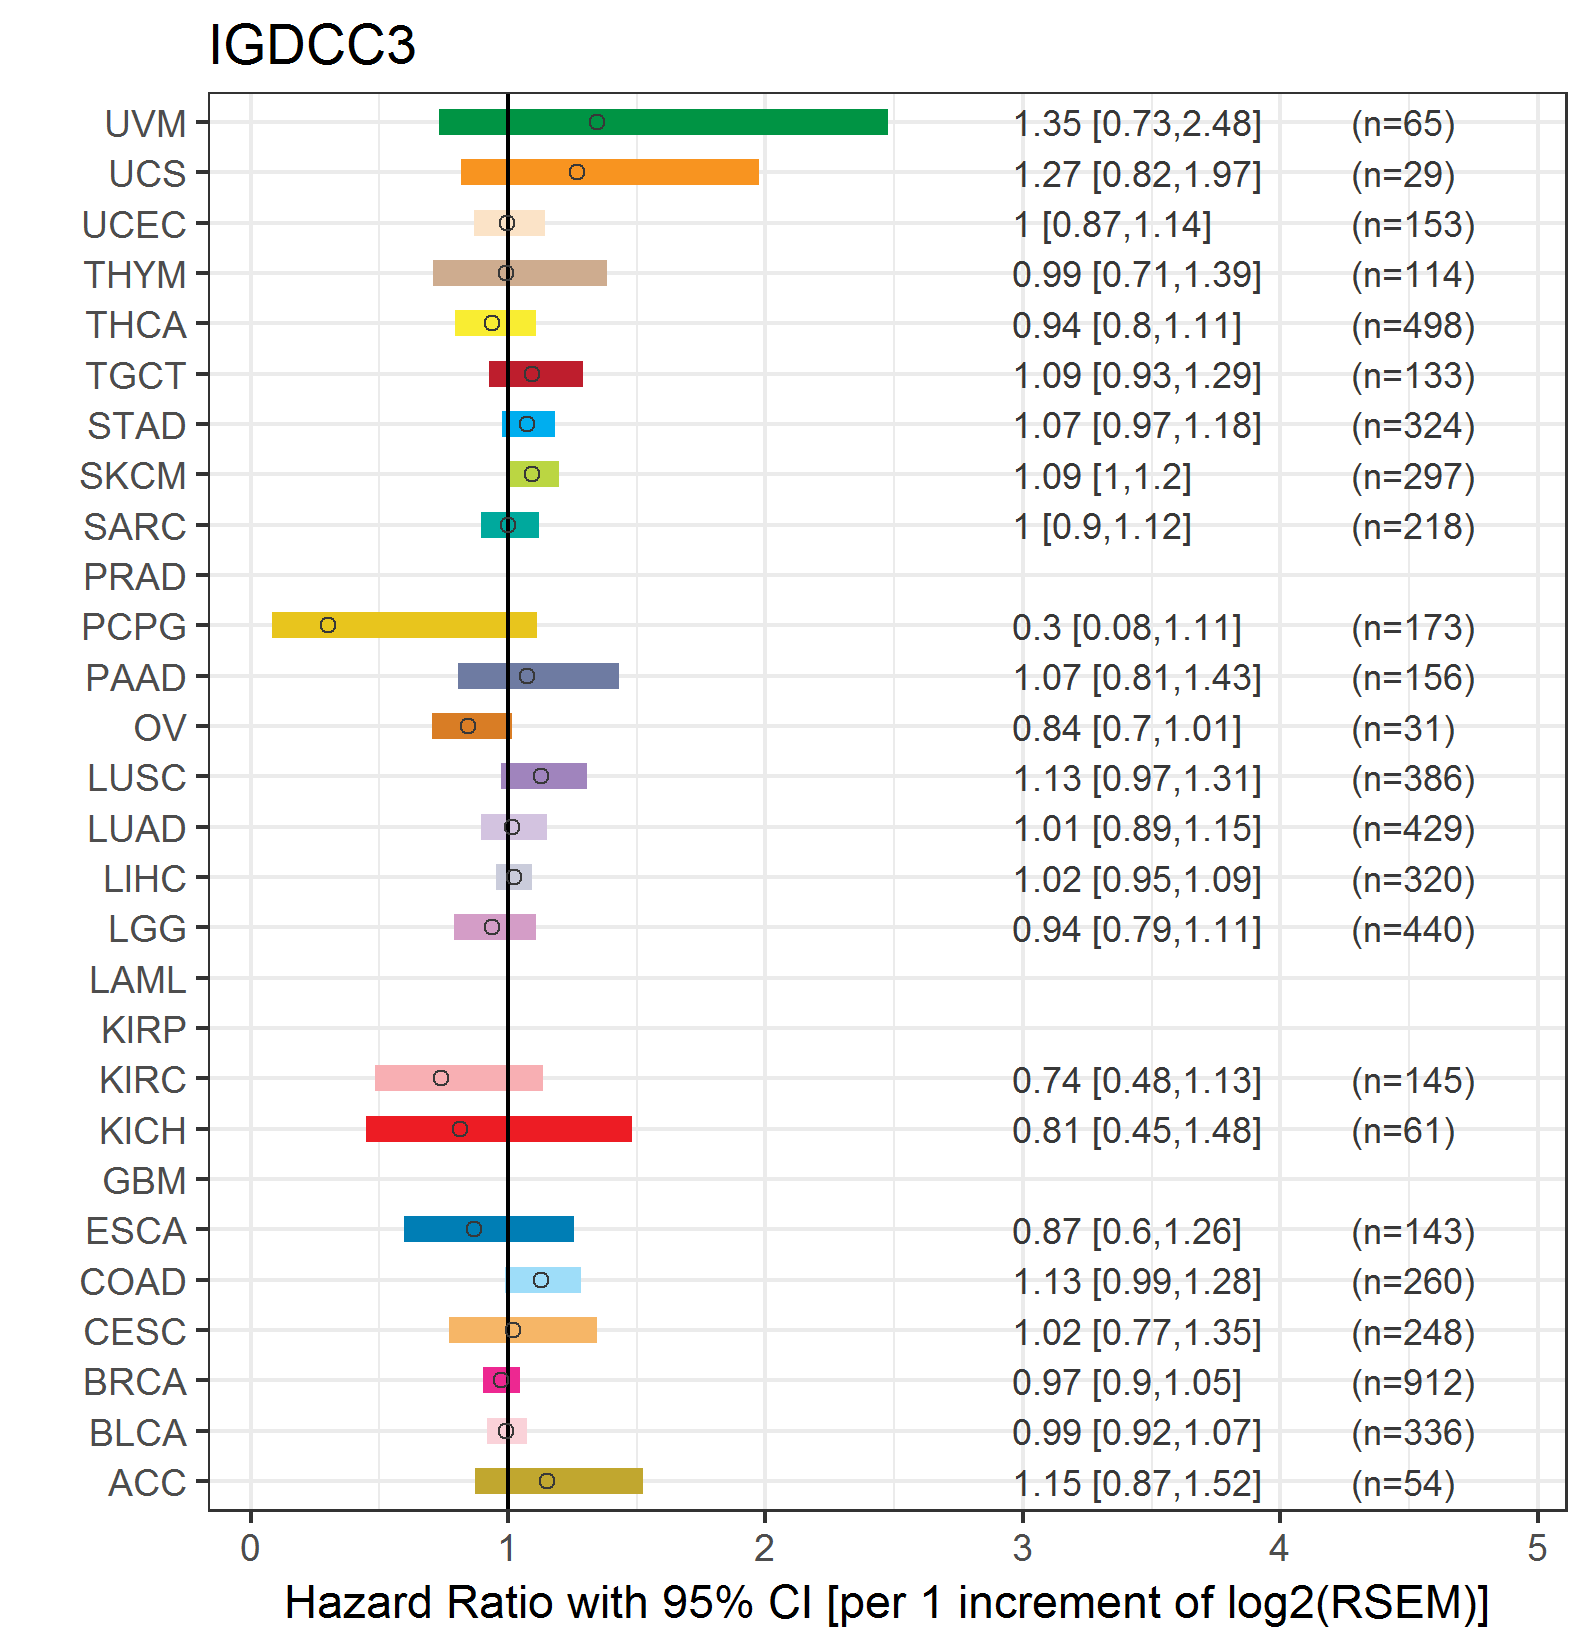
| Forest plot of Cox proportional hazard ratio (HR) and 95% CI of overall survival (OS) using 28 cancer types (TCGA IlluminaHiSeq_RNASeqV2, pan-cancer normalized log2(norm_counts+1) data, version 2016-08-16) (TCGA clinicalMatrix, phenotype data, version 2016-04-27) * Click on the image enlarge it in a new window. |
 |
| Forest plot of Cox proportional hazard ratio (HR) and 95% CI of relapse free survival (RFS) using 28 cancer types (TCGA IlluminaHiSeq_RNASeqV2, pan-cancer normalized log2(norm_counts+1) data, version 2016-08-16) (TCGA clinicalMatrix, phenotype data, version 2016-04-27) * Click on the image enlarge it in a new window. |
 |
| Top |
| TissGeneClin for IGDCC3 |
| TissGeneDrug for IGDCC3 |
| Drug information targeting TissGene (DrugBank Version 5.0.6, 2017-04-01) |
| DrugBank ID | Drug name | Drug activity | Drug type | Drug status |
| Top |
| TissGeneDisease for IGDCC3 |
| Disease information associated with TissGene (DisGeNet, 2016-06-01) |
| Disease ID | Disease name | # pubmeds | Source |
| umls:C0006142 | Malignant neoplasm of breast | 1 | BeFree |
| umls:C0040336 | Tobacco Use Disorder | 1 | GAD |
| umls:C0678222 | Breast Carcinoma | 1 | BeFree |
|
Copyright 2016-Present - The University of Texas Health Science Center at Houston (UTHealth) Web File Viewing | How to Report, Fraud, Waste and Abuse | State of Texas | Statewide Search | Texas Homeland Security | Site Policies |