 |
| |
| |
| |
| |
| |
| |
|

| TissGeneSummary for GPRIN2 |
 Gene summary Gene summary |
| Basic gene information | Gene symbol | GPRIN2 |
| Gene name | G protein regulated inducer of neurite outgrowth 2 | |
| Synonyms | GRIN2|KIAA0514 | |
| Cytomap | UCSC genome browser: 10q11.22 | |
| Type of gene | protein-coding | |
| RefGenes | NM_014696.3, | |
| Description | G protein-regulated inducer of neurite outgrowth 2 | |
| Modification date | 20141207 | |
| dbXrefs | MIM : 611240 | |
| HGNC : HGNC | ||
| HPRD : 13804 | ||
| Protein | UniProt: go to UniProt's Cross Reference DB Table | |
| Expression | CleanEX: HS_GPRIN2 | |
| BioGPS: 9721 | ||
| Pathway | NCI Pathway Interaction Database: GPRIN2 | |
| KEGG: GPRIN2 | ||
| REACTOME: GPRIN2 | ||
| Pathway Commons: GPRIN2 | ||
| Context | iHOP: GPRIN2 | |
| ligand binding site mutation search in PubMed: GPRIN2 | ||
| UCL Cancer Institute: GPRIN2 | ||
| Assigned class in TissGDB* | C | |
| Included tissue-specific gene expression resources | TiGER,GTEx | |
| Specific-tissues in normal samples (assigned by TissGDB using HPA, TiGER, and GTEx) | LungPancreas | |
| Cancer types related to the specific-tissues in cancer samples (assigned by TissGDB using TCGA) | LUAD,LUSCPAAD | |
| Reference showing the relevant tissue of GPRIN2 | ||
| Description by TissGene annotations | Risk TissGene in OS | |
| * Class A consists of genes with literature evidence and is part of the cTissGenes. Class B consists of only cTissGenes without additional evidence. The remaining genes belong to Class C. |
| Gene ontology having evidence of Inferred from Direct Assay (IDA) from Entrez |
| GO ID | GO term | PubMed ID |
| Top |
| TissGeneExp for GPRIN2 |
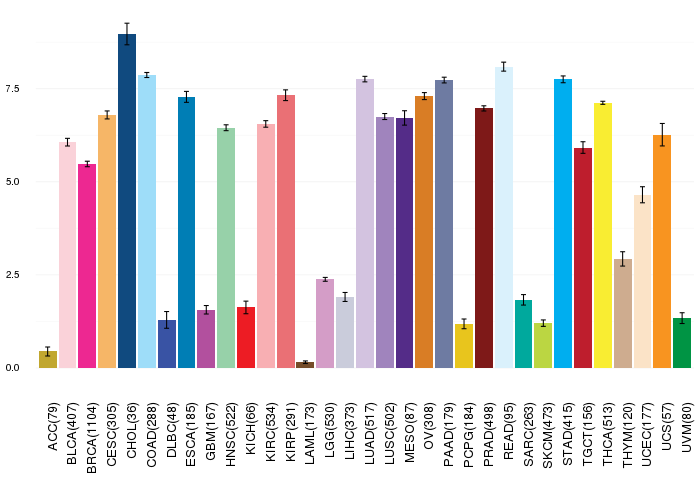
| Gene expressions across 28 cancer types (X-axis: cancer type and Y-axis: log2(norm_counts+1)) (TCGA IlluminaHiSeq_RNASeqV2, pan-cancer normalized log2(norm_counts+1) data, version 2016-08-16) |
 |
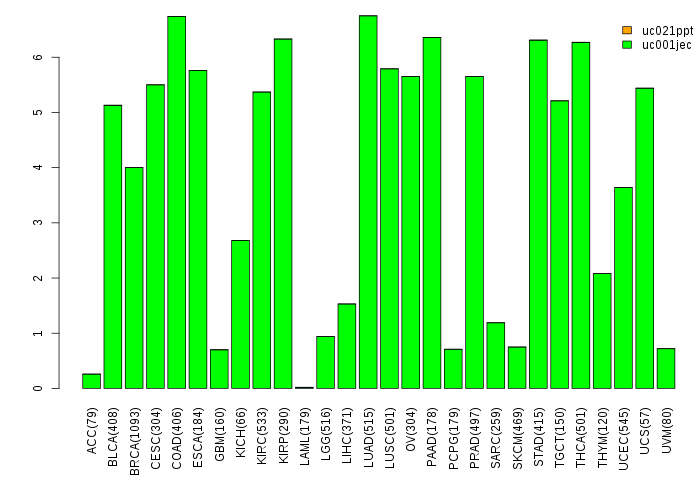
| Gene isoform expressions across 28 cancer types (X-axis: cancer type and Y-axis: log2(norm_counts+1)) (TCGA pan-cancer tcga_rsem_isoform_tpm, version 2016-09-01) |
 |
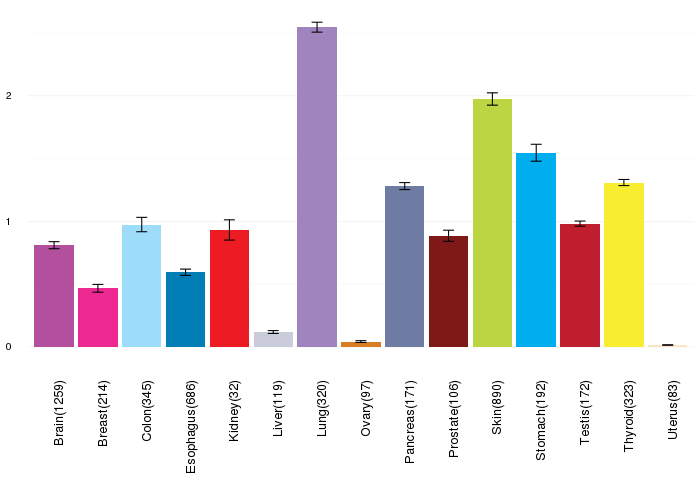
| Gene expressions across normal tissues of GTEx data (GTEx GTEx_Analysis_v6_RNA-seq_RNA-SeQCv1.1.8_gene_rpkm.gct) - Here, we shows the matched tissue types only among our 28 cancer types. |
 |
| Different expressions across 14 cancer types with more than 10 samples between matched tumors and normals (X-axis: cancer type and Y-axis: log2(norm_counts+1)) (TCGA IlluminaHiSeq_RNASeqV2, pan-cancer normalized log2(norm_counts+1) data, version 2016-08-16) |
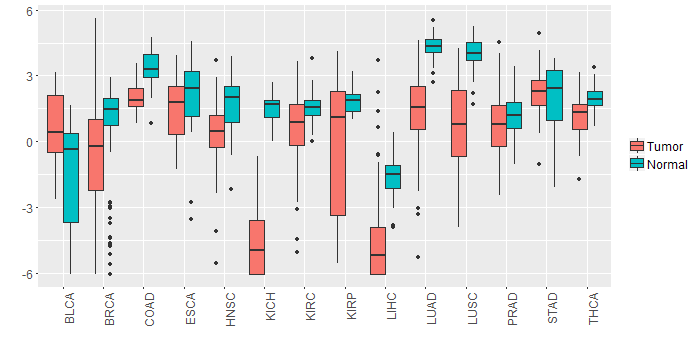 |
| - Significantly differentially expressed cancer types and information. (|Fold change|>1 and FDR<0.05) |
| Cancer type | Mean(exp) in tumor | Mean(exp) in matched normal | Log2FC | P-val. | FDR |
| BRCA | -0.531903437 | 0.75086937 | -1.282772807 | 2.78E-05 | 6.57E-05 |
| KICH | -4.532863262 | 1.554984738 | -6.087848 | 1.18E-18 | 6.19E-17 |
| LUAD | 1.257509842 | 4.326768462 | -3.069258621 | 2.01E-18 | 2.89E-17 |
| COAD | 2.023578277 | 3.351828277 | -1.32825 | 3.09E-07 | 1.96E-06 |
| LUSC | 0.704265758 | 4.013052032 | -3.308786275 | 2.49E-16 | 1.82E-15 |
| LIHC | -4.231993262 | -1.608515262 | -2.623478 | 1.21E-09 | 1.30E-08 |
| BLCA | 0.50836937 | -1.438462209 | 1.946831579 | 0.00993 | 0.044886829 |
| KIRP | -0.174295762 | 1.843057363 | -2.017353125 | 0.00103 | 0.002829975 |
| HNSC | 0.265656273 | 1.717188831 | -1.451532558 | 2.10E-05 | 0.00011014 |
| Top |
| TissGene-miRNA for GPRIN2 |
| Significantly anti-correlated miRNAs of TissGene across 28 cancer types (Gene-miRNA relations from TargetScanHuman Relsease 7.1, Conserved_Site_Context_Scores.txt.zip, 06.01.2016) (TCGA IlluminaHiSeq_miRNASeq, log2(RPM+1) data, version 2016-11-21) (TCGA IlluminaHiSeq_RNASeqV2, log2(normalized_count+1) data, version 2016-08-16) (Spearman’s Rank Correlation (p-value<0.05 and coefficient<-0.25)) |
| Cancer type | miRNA id | miRNA accession | P-val. | Coeff. | # samples |
| Top |
| TissGeneMut for GPRIN2 |
| TissGeneSNV for GPRIN2 |
| nsSNV counts per each loci. Different colors of circles represent different cancer types. Circle size denotes number of samples. (TCGA somatic mutation (SNPs and small INDELs) data, version 2016-04-25) * Click on the image to enlarge it in a new window. |
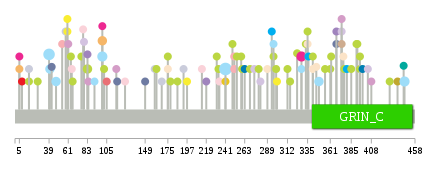 |
 |
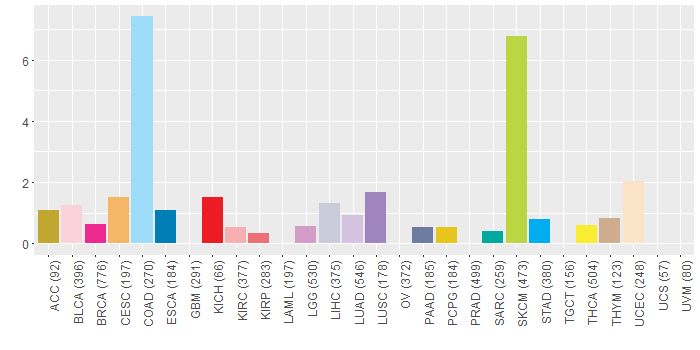
| Somatic nucleotide variants of TissGene across 28 cancer types (X-axis: cancer type and Y-axis: % of mutated samples) The numbers in parentheses are numbers of samples with mutation (nsSNVs). (TCGA somatic mutation (SNPs and small INDELs) data, version 2016-04-25) |
 |
| - nsSNVs sorted by frequency. |
| AAchange | Cancer type | # samples |
| p.V241M | COAD | 10 |
| p.L39V | COAD | 6 |
| p.S328C | BRCA | 3 |
| p.R446H | COAD | 3 |
| p.T100P | COAD | 3 |
| p.R40H | COAD | 2 |
| p.V47M | COAD | 2 |
| p.V348L | COAD | 2 |
| p.R83Q | SKCM | 2 |
| p.T100P | CESC | 2 |
| p.A186T | SKCM | 1 |
| p.P231L | SKCM | 1 |
| p.P341L | SKCM | 1 |
| p.P341S | UCEC | 1 |
| p.E374D | LUAD | 1 |
| p.A335T | SKCM | 1 |
| p.R445W | SARC | 1 |
| p.A116V | LGG | 1 |
| p.S78F | BLCA | 1 |
| p.A168D | LIHC | 1 |
| p.E65Q | BLCA | 1 |
| p.V398A | ESCA | 1 |
| p.D175N | SKCM | 1 |
| p.S328C | COAD | 1 |
| p.Q408H | LGG | 1 |
| p.E374K | LGG | 1 |
| p.P84H | LGG | 1 |
| p.P259L | SKCM | 1 |
| p.G336V | STAD | 1 |
| p.G395R | SKCM | 1 |
| p.A61V | LGG | 1 |
| p.P16L | SKCM | 1 |
| p.H279Y | SKCM | 1 |
| p.R438Q | ACC | 1 |
| p.P251A | KIRC | 1 |
| p.L368M | PAAD | 1 |
| p.T42P | PAAD | 1 |
| p.R281S | LUAD | 1 |
| p.K260R | SKCM | 1 |
| p.A233V | SKCM | 1 |
| p.D105N | KIRP | 1 |
| p.R5H | BRCA | 1 |
| p.A263V | ESCA | 1 |
| p.Q60X | THCA | 1 |
| p.W391X | SKCM | 1 |
| p.H274P | LUAD | 1 |
| p.H289Y | UCEC | 1 |
| p.T100P | BRCA | 1 |
| p.Q60* | THCA | 1 |
| p.A12E | HNSC | 1 |
| p.A249V | SKCM | 1 |
| p.P251L | KIRC | 1 |
| p.R33Q | HNSC | 1 |
| p.W90S | HNSC | 1 |
| p.G79V | LUAD | 1 |
| p.E214K | BLCA | 1 |
| p.C345Y | UCEC | 1 |
| p.G102S | SKCM | 1 |
| p.L234I | BLCA | 1 |
| p.P178S | SKCM | 1 |
| p.D385N | SKCM | 1 |
| p.A335D | UCEC | 1 |
| p.R76Q | SKCM | 1 |
| p.G160S | LIHC | 1 |
| p.R126H | BLCA | 1 |
| p.R5C | CESC | 1 |
| p.D175N | UCEC | 1 |
| p.P8L | KICH | 1 |
| p.A294T | STAD | 1 |
| p.Q193E | LIHC | 1 |
| p.G254E | SKCM | 1 |
| p.L296I | COAD | 1 |
| p.M117I | PAAD | 1 |
| p.G395E | SKCM | 1 |
| p.S162F | SKCM | 1 |
| p.S149N | PAAD | 1 |
| p.V241M | PCPG | 1 |
| p.A323G | SKCM | 1 |
| p.R380W | STAD | 1 |
| p.G298S | HNSC | 1 |
| p.E54K | KIRC | 1 |
| p.G254R | MESO | 1 |
| p.E392K | SKCM | 1 |
| p.A300T | THCA | 1 |
| p.P376L | UCEC | 1 |
| p.G404S | LUAD | 1 |
| p.P169S | DLBC | 1 |
| p.G66E | SKCM | 1 |
| p.V362L | SKCM | 1 |
| p.H361Q | SKCM | 1 |
| p.P16S | LIHC | 1 |
| p.E219K | LUSC | 1 |
| p.Q333R | SKCM | 1 |
| p.G269R | SKCM | 1 |
| p.P299L | SKCM | 1 |
| p.T315I | SKCM | 1 |
| p.D312N | SKCM | 1 |
| p.S26F | SKCM | 1 |
| p.L368V | LUSC | 1 |
| p.S429F | SKCM | 1 |
| p.E64K | SKCM | 1 |
| p.S377T | SKCM | 1 |
| p.R58G | LIHC | 1 |
| p.E374D | THYM | 1 |
| p.W187C | HNSC | 1 |
| p.E355K | SKCM | 1 |
| p.R446H | READ | 1 |
| p.P197T | THCA | 1 |
| p.L296H | SKCM | 1 |
| p.W91R | COAD | 1 |
| p.R83P | LUSC | 1 |
| Top |
| TissGeneCNV for GPRIN2 |
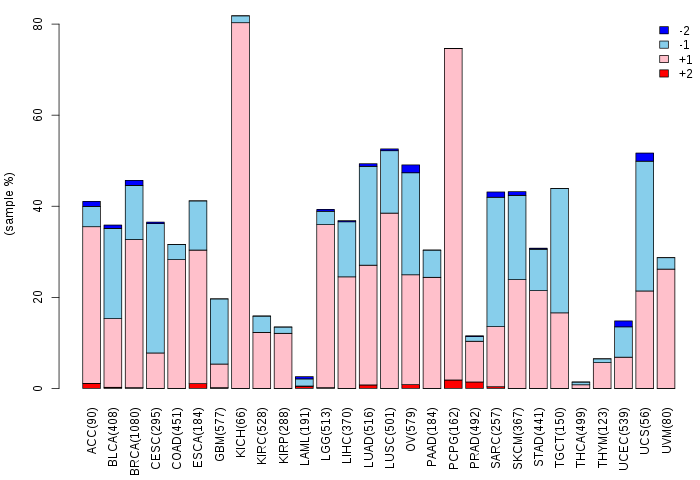
| Copy number variations of TissGene across 28 cancer types (X-axis: cancer type and Y-axis: % of CNV samples) (TCGA Gistic2_CopyNumber_Gistic2_all_data_by_genes, Gistic2 copy number data, version 2016-08-16) |
 |
| Top |
| TissGeneFusions for GPRIN2 |
| Fusion genes including TissGene (ChimerDB 3.0, 2016-12-01 and TCGA fusion Portal 2015-12-01) |
| Database | Src | Cancer type | Sample | Fusion gene | ORF | 5'-gene BP | 3'-gene BP |
| Top |
| TissGeneNet for GPRIN2 |
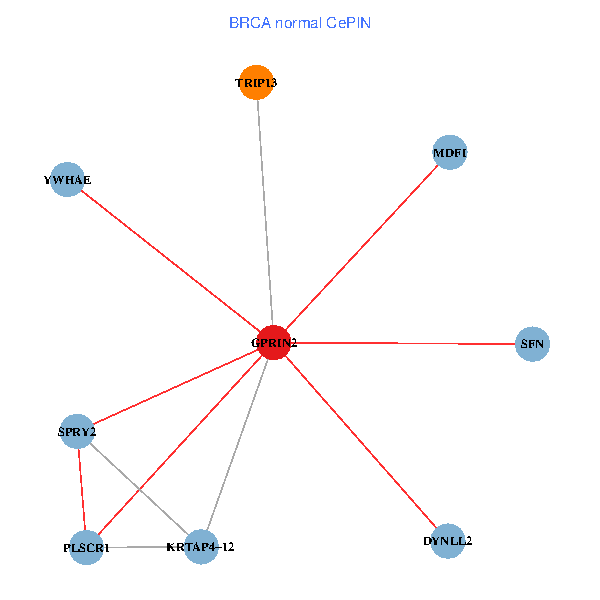
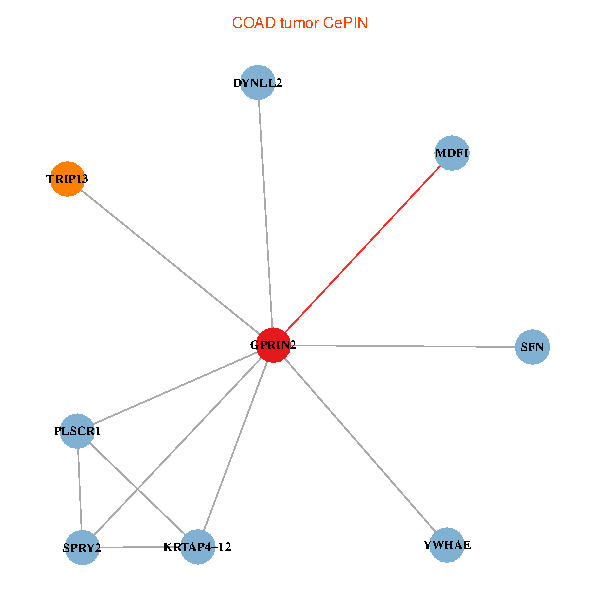
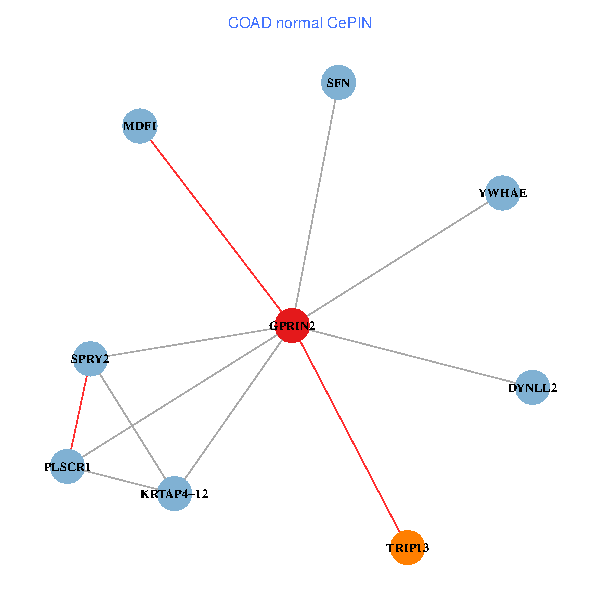
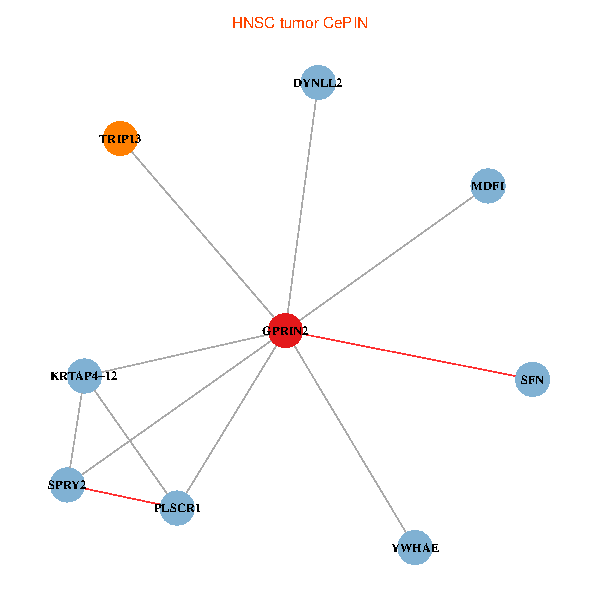
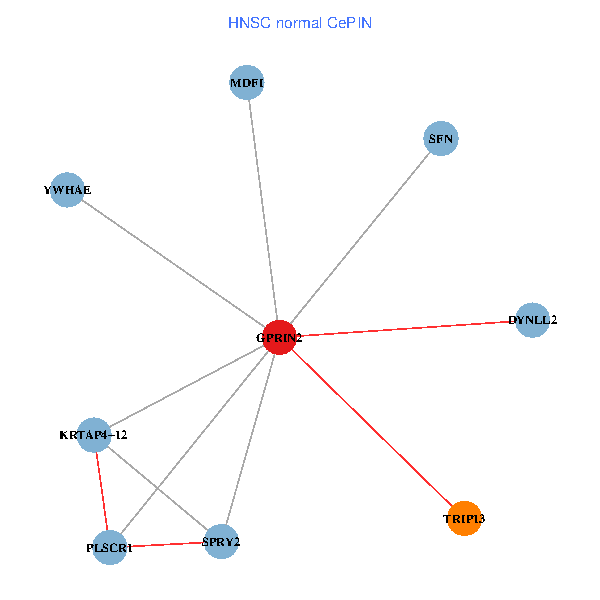
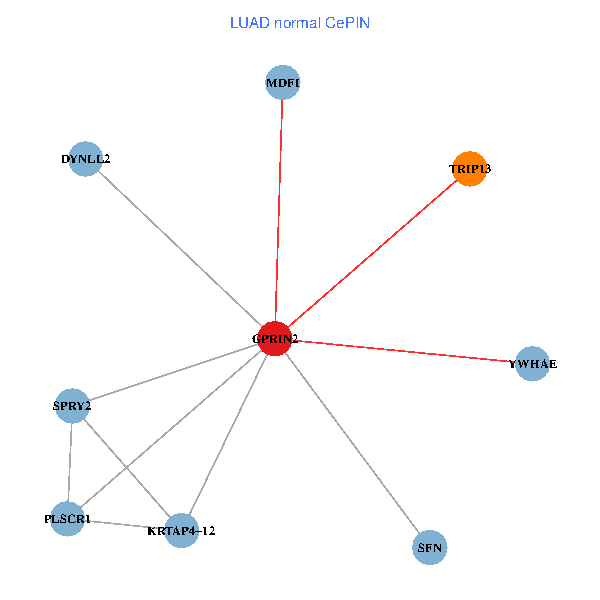
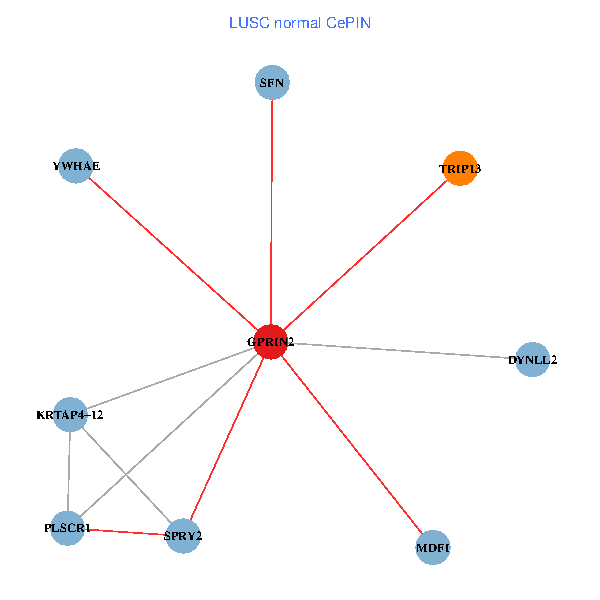
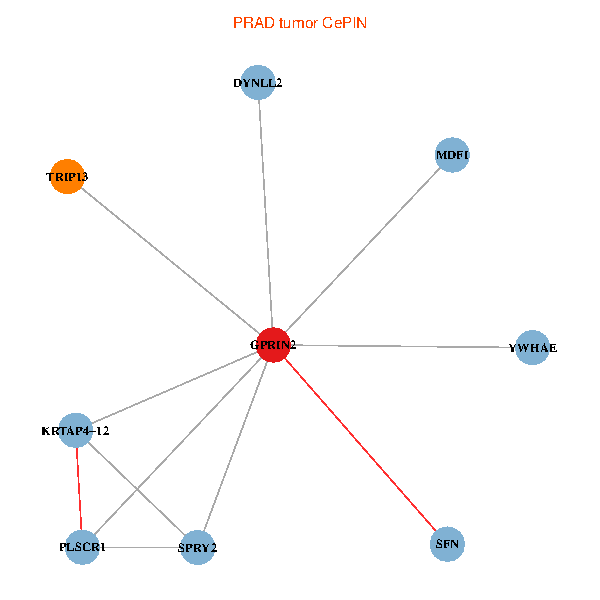
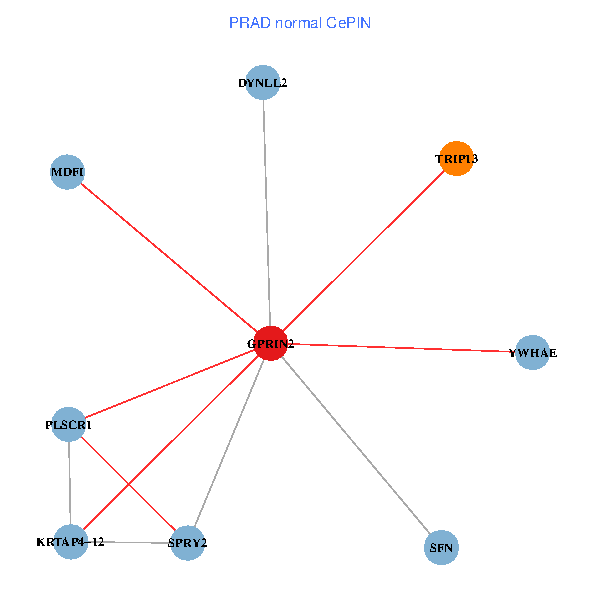
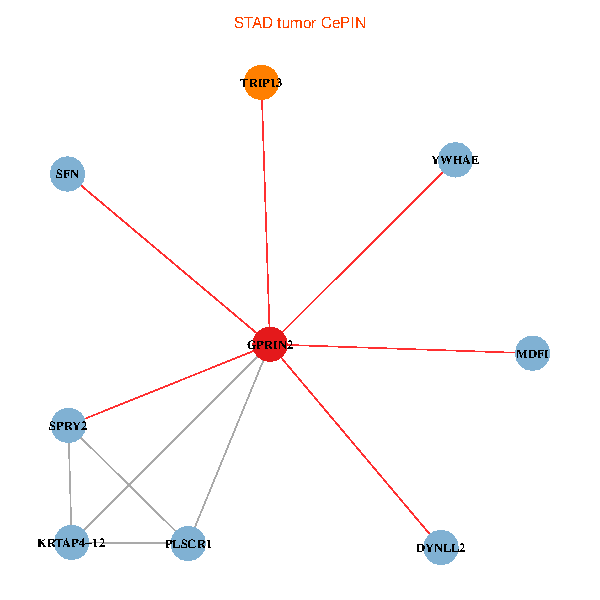
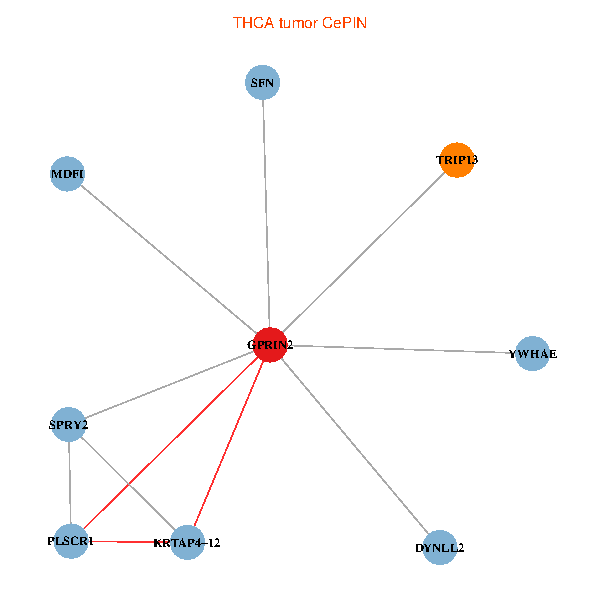
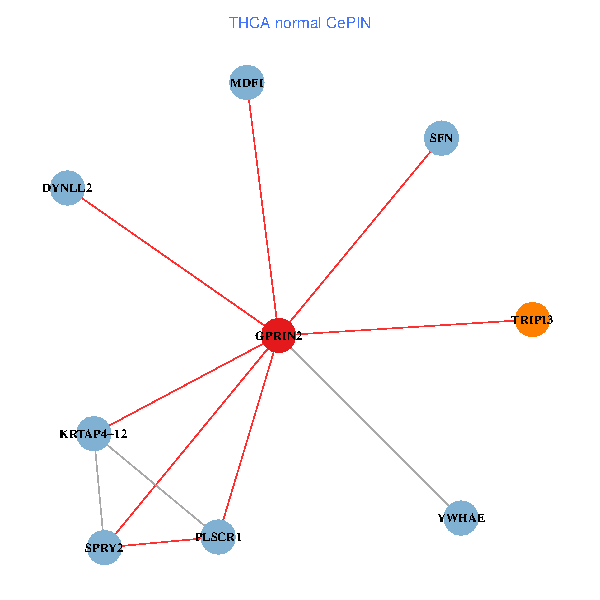
| Co-expressed gene networks based on protein-protein interaction data (CePIN) (TCGA IlluminaHiSeq_RNASeqV2, pan-cancer normalized log2(norm_counts+1) data, version 2016-08-16) (PINA2 ppi data) |
| BRCA (tumor) | BRCA (normal) |
| GPRIN2, TRIP13, MDFI, PLSCR1, YWHAE, KRTAP4-12, SFN, SPRY2, DYNLL2 (tumor) | GPRIN2, TRIP13, MDFI, PLSCR1, YWHAE, KRTAP4-12, SFN, SPRY2, DYNLL2 (normal) |
 |  |
| COAD (tumor) | COAD (normal) |
| GPRIN2, TRIP13, MDFI, PLSCR1, YWHAE, KRTAP4-12, SFN, SPRY2, DYNLL2 (tumor) | GPRIN2, TRIP13, MDFI, PLSCR1, YWHAE, KRTAP4-12, SFN, SPRY2, DYNLL2 (normal) |
 |  |
| HNSC (tumor) | HNSC (normal) |
| GPRIN2, TRIP13, MDFI, PLSCR1, YWHAE, KRTAP4-12, SFN, SPRY2, DYNLL2 (tumor) | GPRIN2, TRIP13, MDFI, PLSCR1, YWHAE, KRTAP4-12, SFN, SPRY2, DYNLL2 (normal) |
 |  |
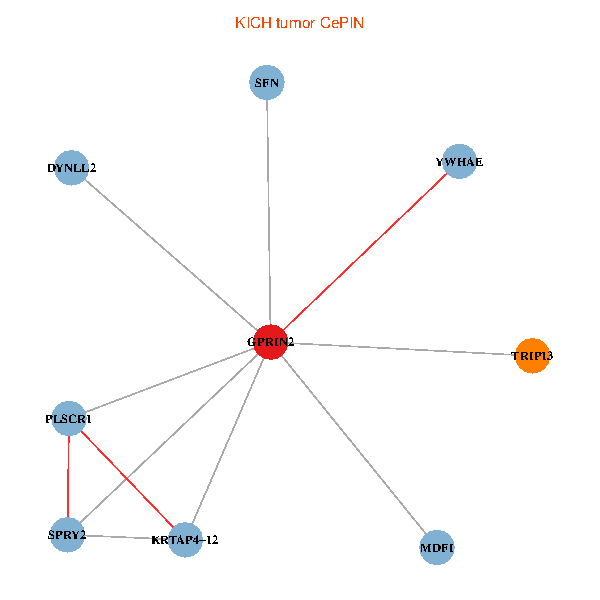
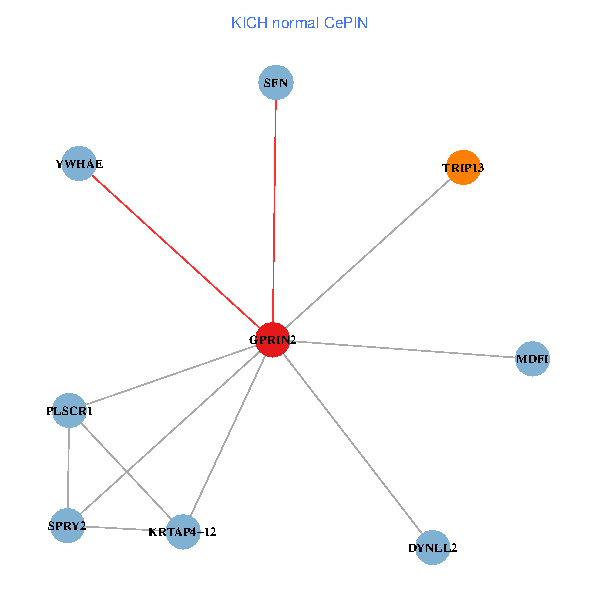
| KICH (tumor) | KICH (normal) |
| GPRIN2, TRIP13, MDFI, PLSCR1, YWHAE, KRTAP4-12, SFN, SPRY2, DYNLL2 (tumor) | GPRIN2, TRIP13, MDFI, PLSCR1, YWHAE, KRTAP4-12, SFN, SPRY2, DYNLL2 (normal) |
 |  |
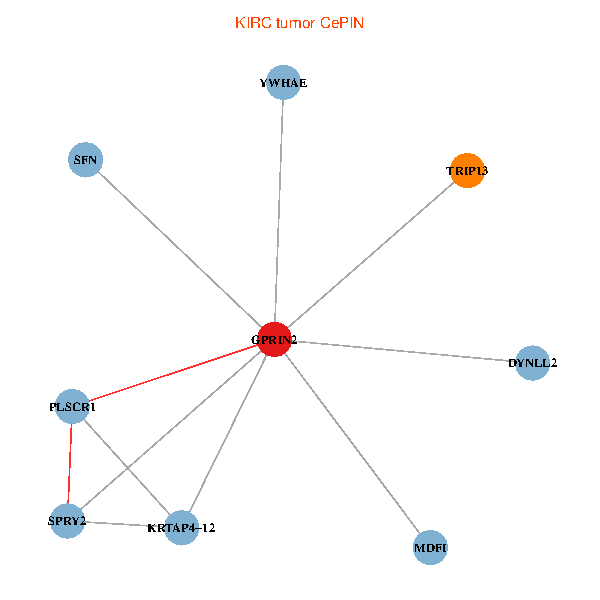
| KIRC (tumor) | KIRC (normal) |
| GPRIN2, TRIP13, MDFI, PLSCR1, YWHAE, KRTAP4-12, SFN, SPRY2, DYNLL2 (tumor) | GPRIN2, TRIP13, MDFI, PLSCR1, YWHAE, KRTAP4-12, SFN, SPRY2, DYNLL2 (normal) |
 |  |
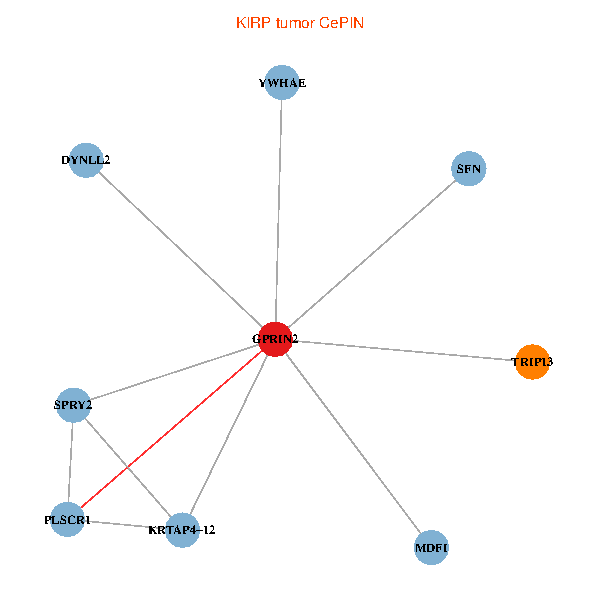
| KIRP (tumor) | KIRP (normal) |
| GPRIN2, TRIP13, MDFI, PLSCR1, YWHAE, KRTAP4-12, SFN, SPRY2, DYNLL2 (tumor) | GPRIN2, TRIP13, MDFI, PLSCR1, YWHAE, KRTAP4-12, SFN, SPRY2, DYNLL2 (normal) |
 |  |
| LIHC (tumor) | LIHC (normal) |
| GPRIN2, TRIP13, MDFI, PLSCR1, YWHAE, KRTAP4-12, SFN, SPRY2, DYNLL2 (tumor) | GPRIN2, TRIP13, MDFI, PLSCR1, YWHAE, KRTAP4-12, SFN, SPRY2, DYNLL2 (normal) |
 |  |
| LUAD (tumor) | LUAD (normal) |
| GPRIN2, TRIP13, MDFI, PLSCR1, YWHAE, KRTAP4-12, SFN, SPRY2, DYNLL2 (tumor) | GPRIN2, TRIP13, MDFI, PLSCR1, YWHAE, KRTAP4-12, SFN, SPRY2, DYNLL2 (normal) |
 |  |
| LUSC (tumor) | LUSC (normal) |
| GPRIN2, TRIP13, MDFI, PLSCR1, YWHAE, KRTAP4-12, SFN, SPRY2, DYNLL2 (tumor) | GPRIN2, TRIP13, MDFI, PLSCR1, YWHAE, KRTAP4-12, SFN, SPRY2, DYNLL2 (normal) |
 |  |
| PRAD (tumor) | PRAD (normal) |
| GPRIN2, TRIP13, MDFI, PLSCR1, YWHAE, KRTAP4-12, SFN, SPRY2, DYNLL2 (tumor) | GPRIN2, TRIP13, MDFI, PLSCR1, YWHAE, KRTAP4-12, SFN, SPRY2, DYNLL2 (normal) |
 |  |
| STAD (tumor) | STAD (normal) |
| GPRIN2, TRIP13, MDFI, PLSCR1, YWHAE, KRTAP4-12, SFN, SPRY2, DYNLL2 (tumor) | GPRIN2, TRIP13, MDFI, PLSCR1, YWHAE, KRTAP4-12, SFN, SPRY2, DYNLL2 (normal) |
 |  |
| THCA (tumor) | THCA (normal) |
| GPRIN2, TRIP13, MDFI, PLSCR1, YWHAE, KRTAP4-12, SFN, SPRY2, DYNLL2 (tumor) | GPRIN2, TRIP13, MDFI, PLSCR1, YWHAE, KRTAP4-12, SFN, SPRY2, DYNLL2 (normal) |
 |  |
| Top |
| TissGeneProg for GPRIN2 |
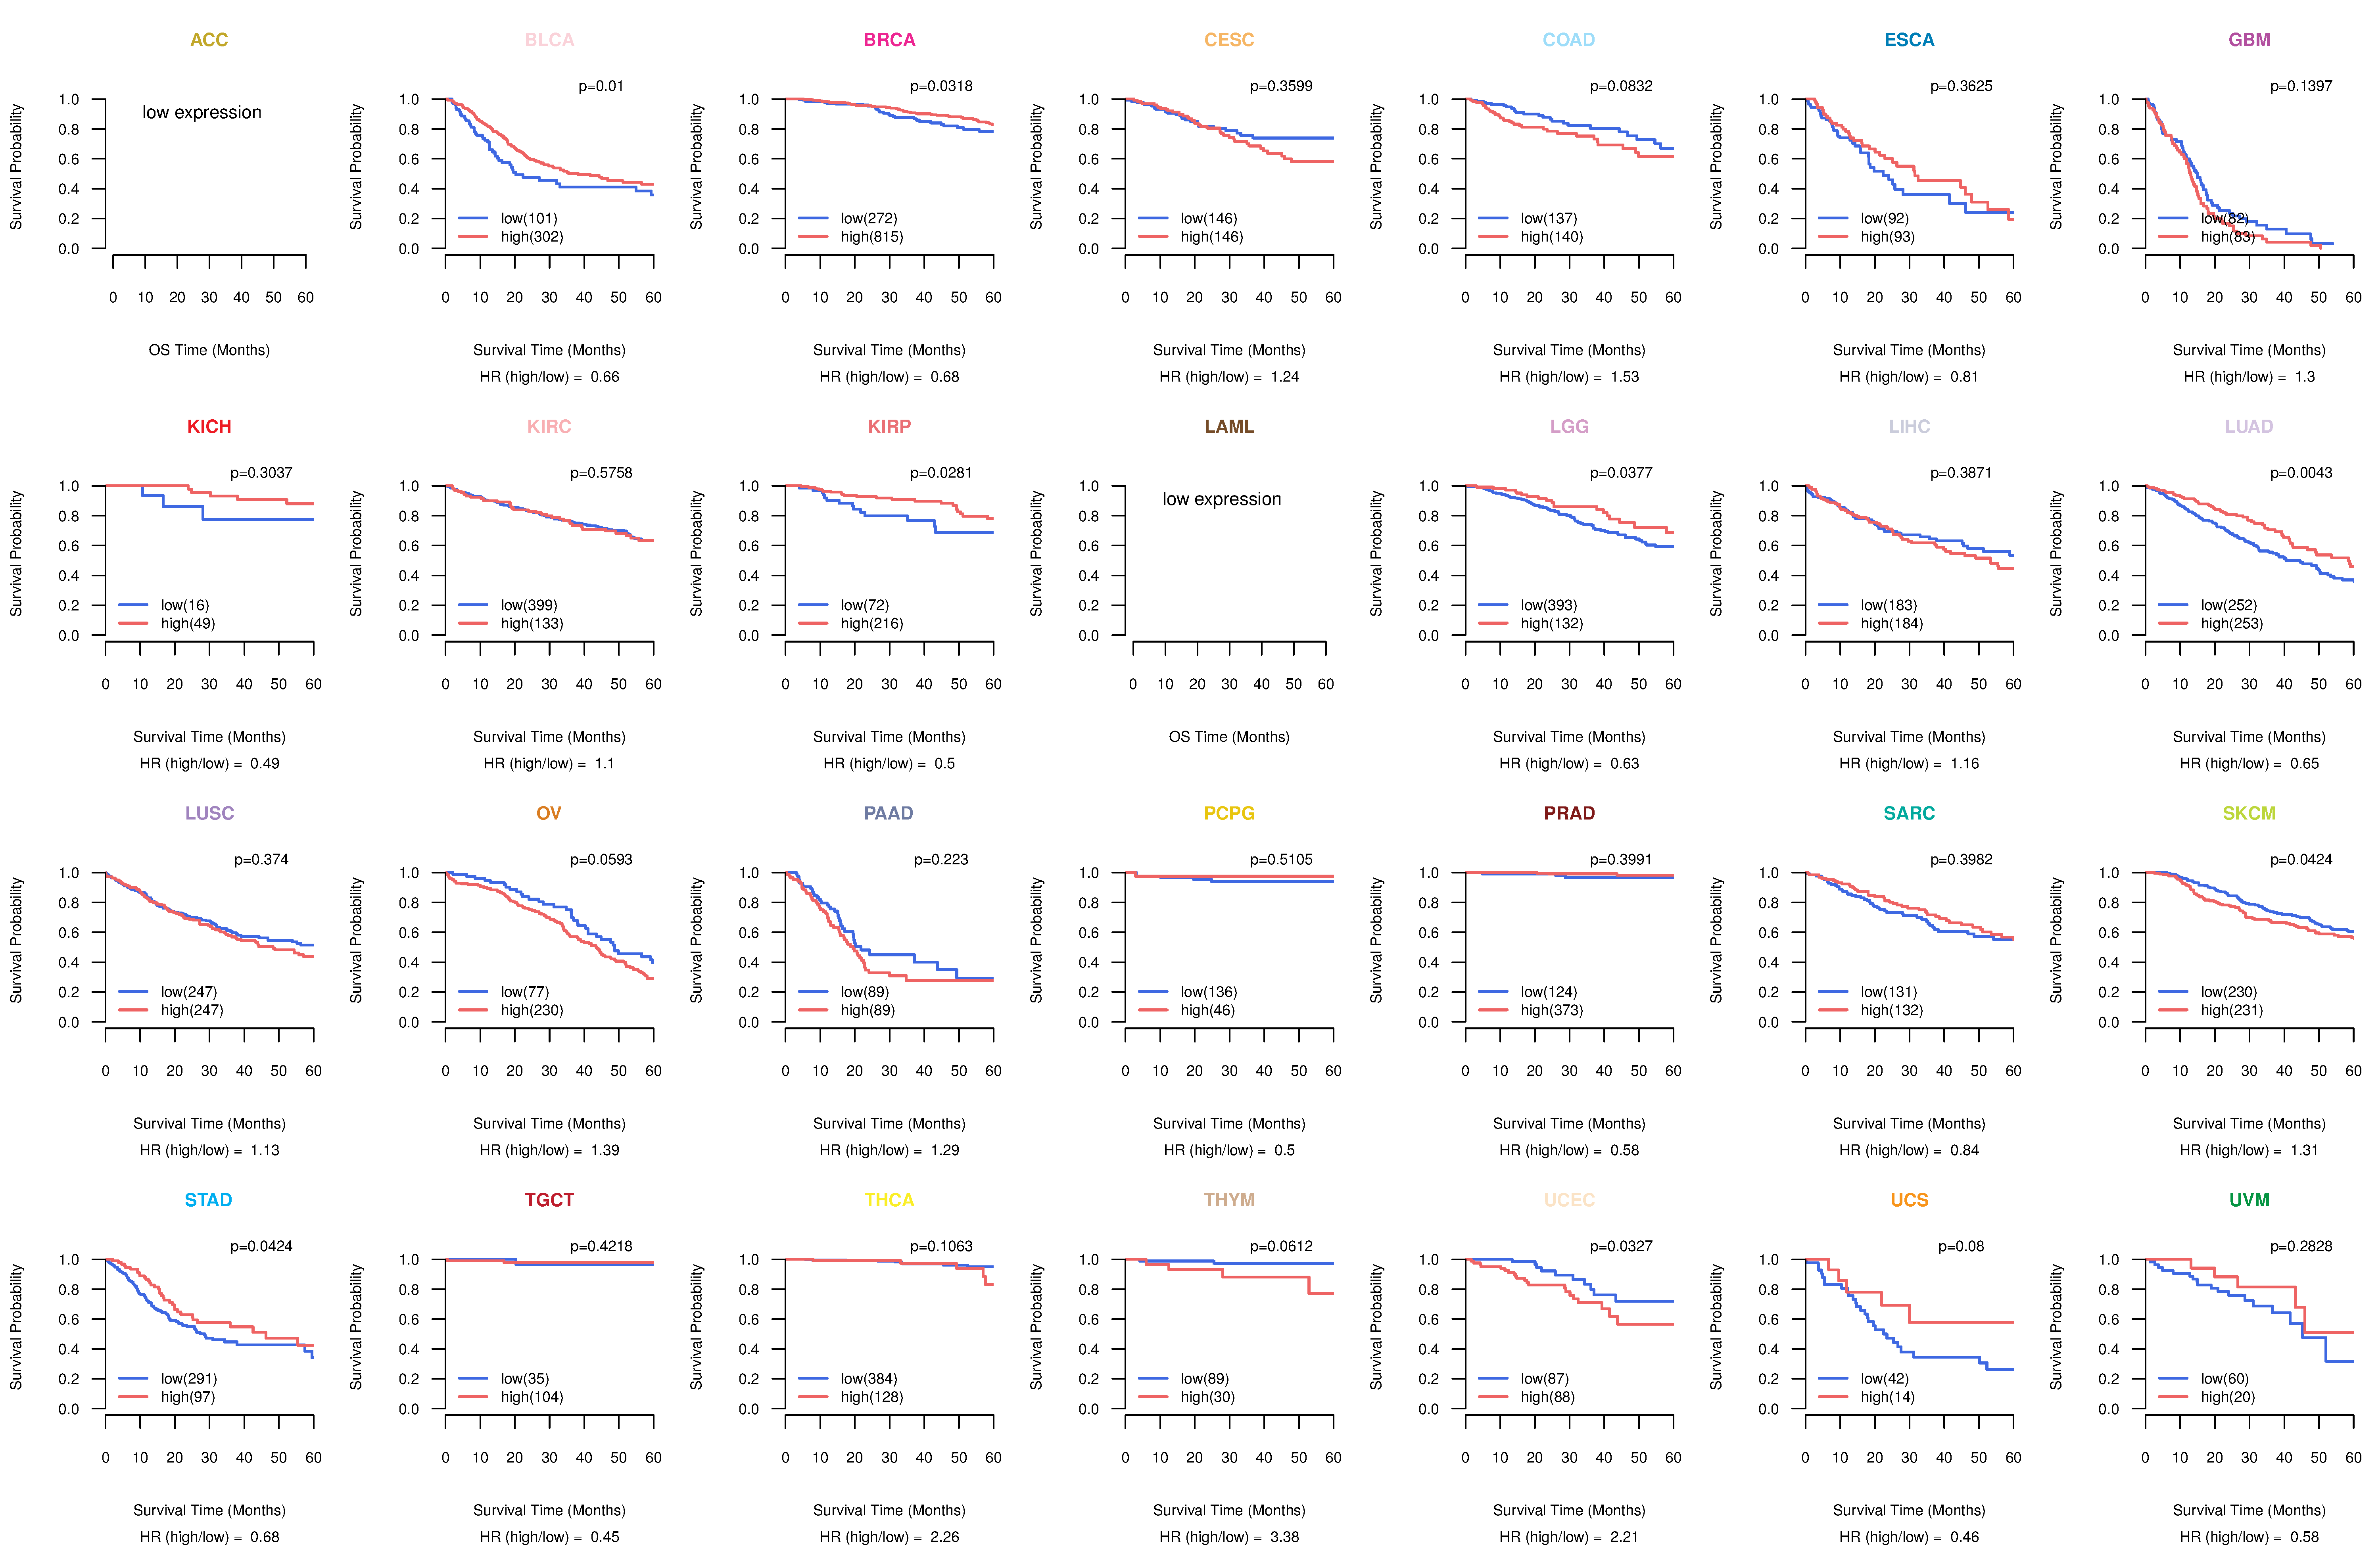
| Kaplan-Meier plots with logrank tests of overall survival (OS) using 28 cancer types (TCGA IlluminaHiSeq_RNASeqV2, pan-cancer normalized log2(norm_counts+1) data, version 2016-08-16) (TCGA clinicalMatrix, phenotype data, version 2016-04-27) * Click on the image to enlarge it in a new window. |
 |
| Kaplan-Meier plots with logrank test of relapse free survival (RFS) using 28 cancer types (TCGA IlluminaHiSeq_RNASeqV2, pan-cancer normalized log2(norm_counts+1) data, version 2016-08-16) (TCGA clinicalMatrix, phenotype data, version 2016-04-27) * Click on the image enlarge it in a new window. |
 |
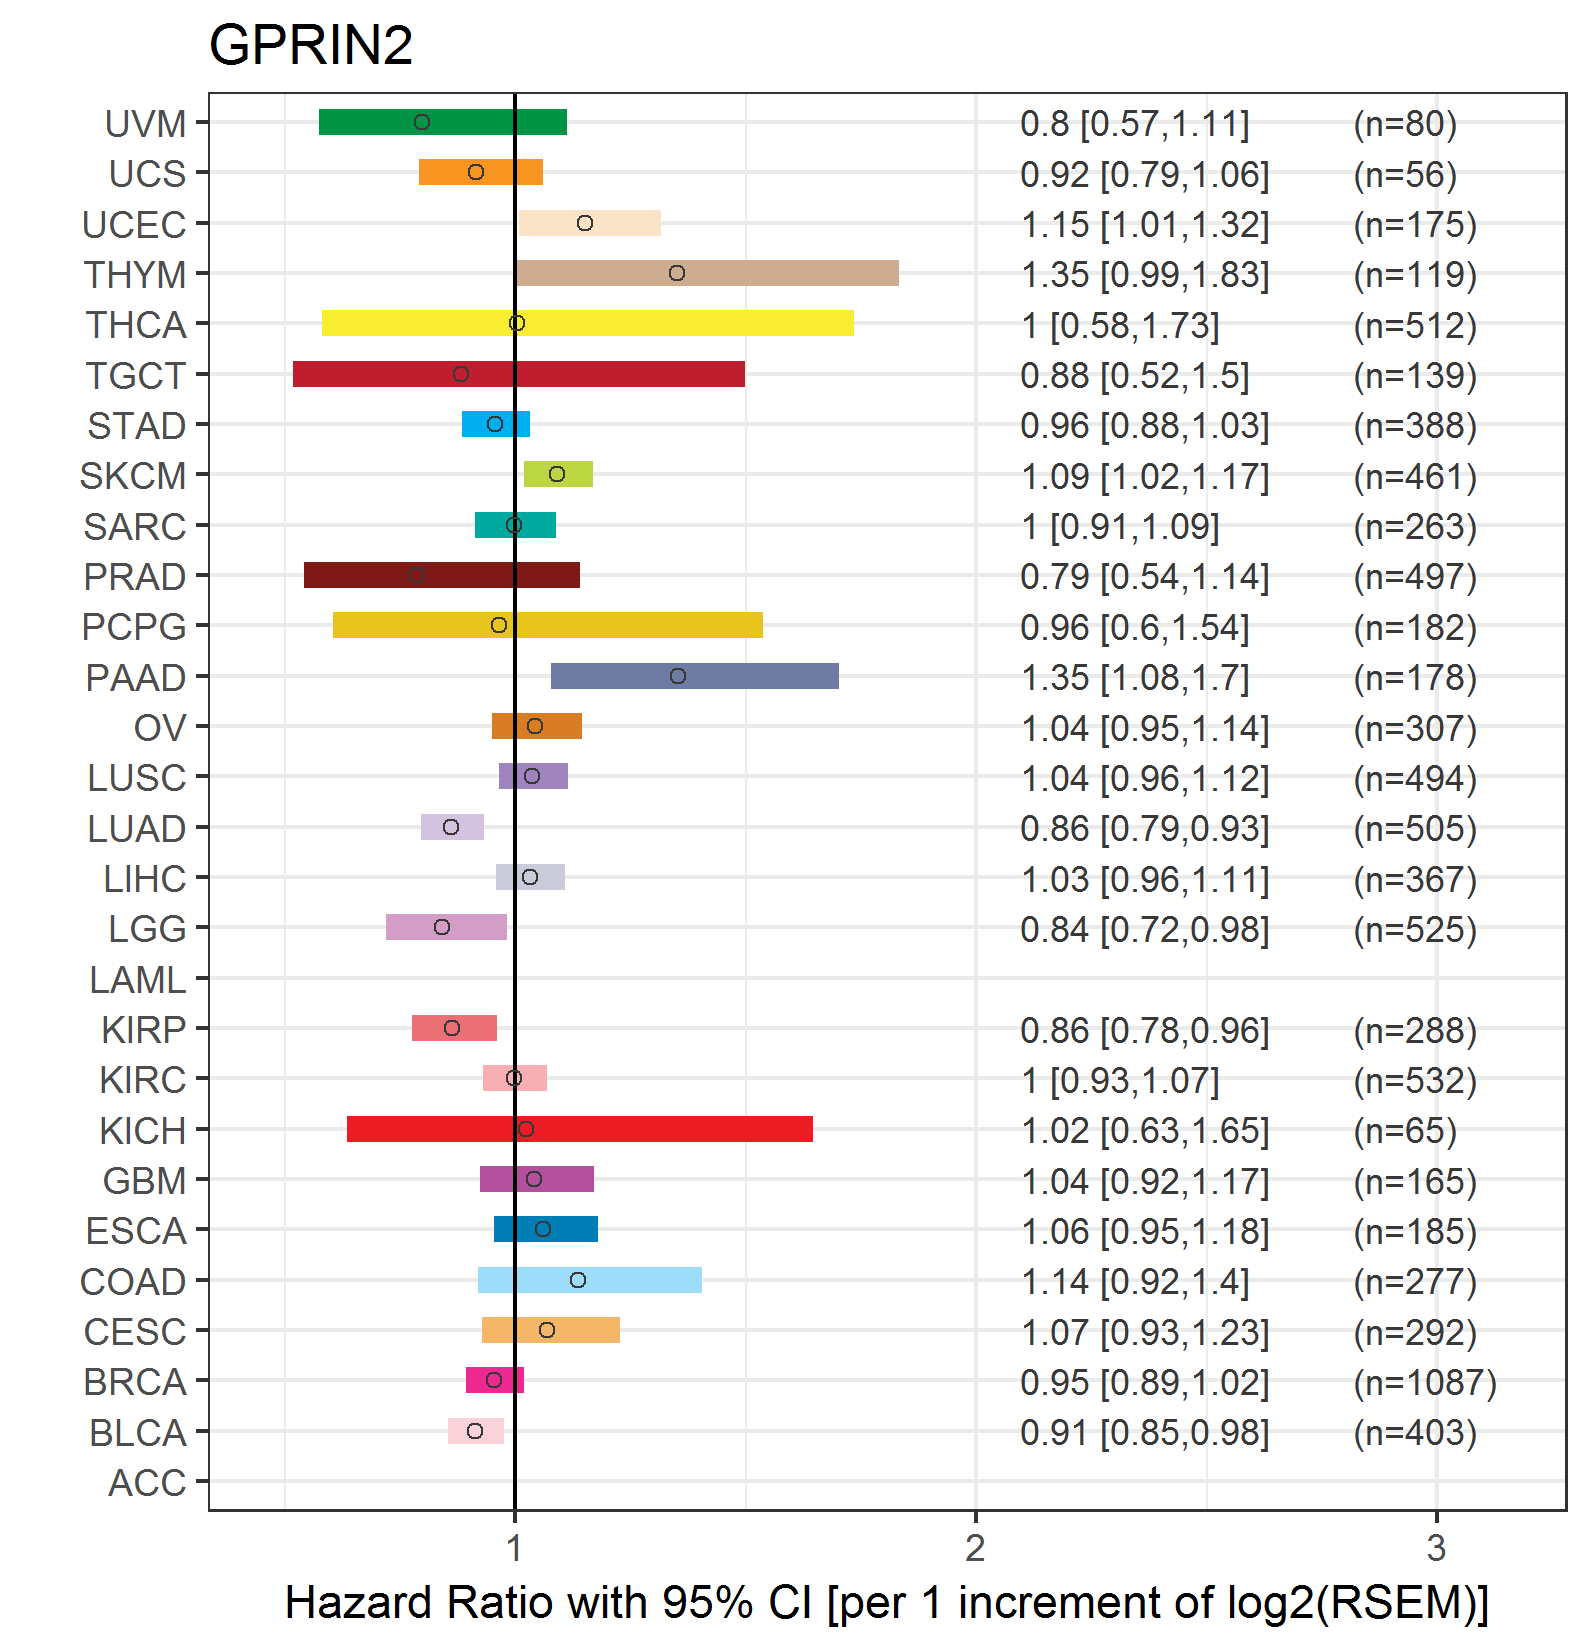
| Forest plot of Cox proportional hazard ratio (HR) and 95% CI of overall survival (OS) using 28 cancer types (TCGA IlluminaHiSeq_RNASeqV2, pan-cancer normalized log2(norm_counts+1) data, version 2016-08-16) (TCGA clinicalMatrix, phenotype data, version 2016-04-27) * Click on the image enlarge it in a new window. |
 |
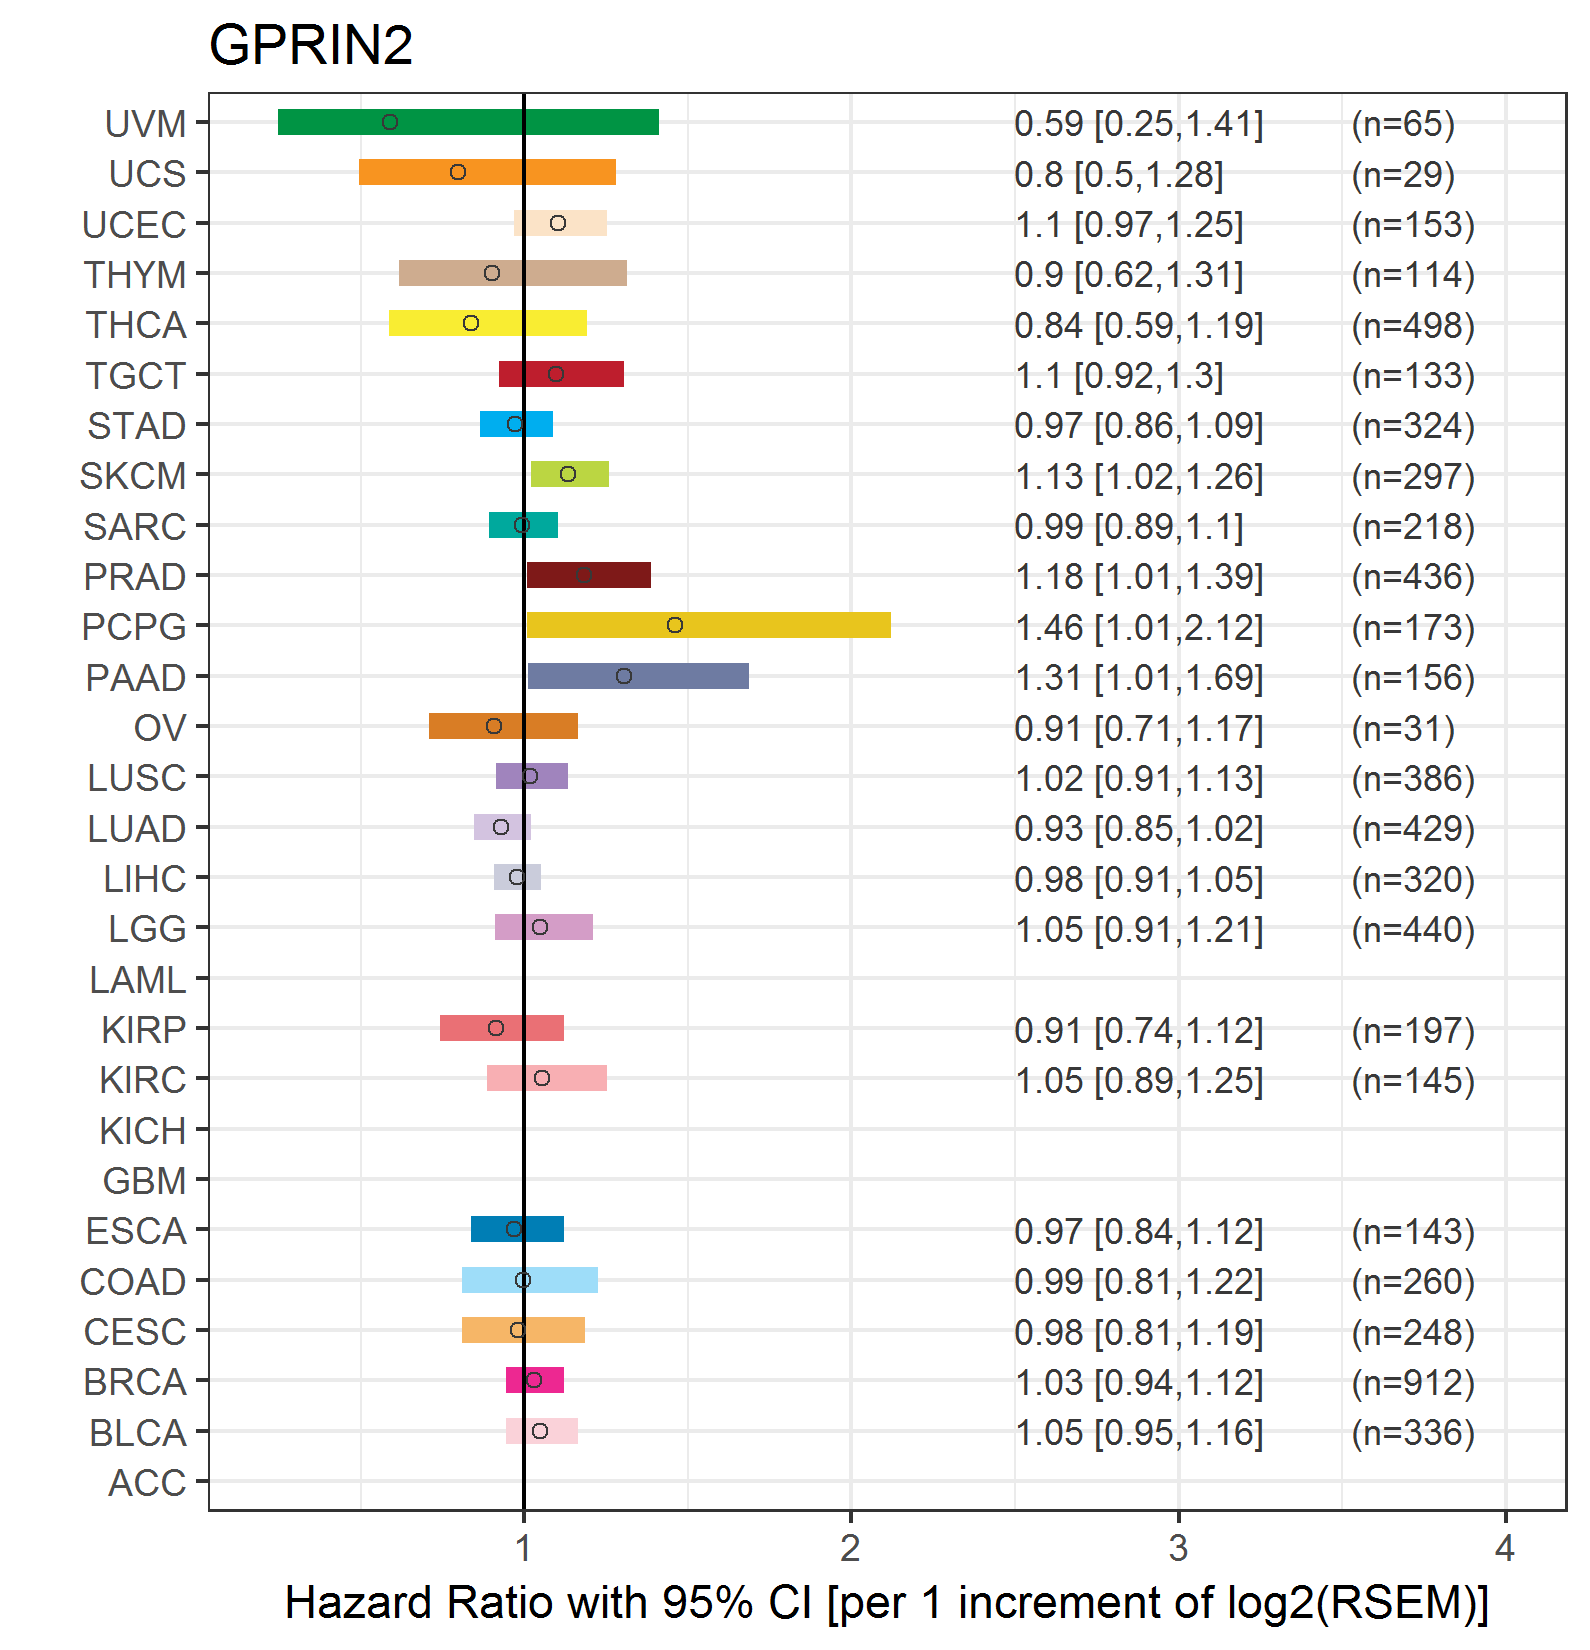
| Forest plot of Cox proportional hazard ratio (HR) and 95% CI of relapse free survival (RFS) using 28 cancer types (TCGA IlluminaHiSeq_RNASeqV2, pan-cancer normalized log2(norm_counts+1) data, version 2016-08-16) (TCGA clinicalMatrix, phenotype data, version 2016-04-27) * Click on the image enlarge it in a new window. |
 |
| Top |
| TissGeneClin for GPRIN2 |
| TissGeneDrug for GPRIN2 |
| Drug information targeting TissGene (DrugBank Version 5.0.6, 2017-04-01) |
| DrugBank ID | Drug name | Drug activity | Drug type | Drug status |
| Top |
| TissGeneDisease for GPRIN2 |
| Disease information associated with TissGene (DisGeNet, 2016-06-01) |
| Disease ID | Disease name | # pubmeds | Source |
| umls:C0005586 | Bipolar Disorder | 1 | BeFree |
| umls:C0041696 | Unipolar Depression | 1 | BeFree |
| umls:C1269683 | Major Depressive Disorder | 1 | BeFree |
|
Copyright 2016-Present - The University of Texas Health Science Center at Houston (UTHealth) Web File Viewing | How to Report, Fraud, Waste and Abuse | State of Texas | Statewide Search | Texas Homeland Security | Site Policies |