 |
| |
| |
| |
| |
| |
| |
|

| TissGeneSummary for FGFBP1 |
 Gene summary Gene summary |
| Basic gene information | Gene symbol | FGFBP1 |
| Gene name | fibroblast growth factor binding protein 1 | |
| Synonyms | FGF-BP|FGF-BP1|FGFBP|FGFBP-1|HBP17 | |
| Cytomap | UCSC genome browser: 4p15.32 | |
| Type of gene | protein-coding | |
| RefGenes | NM_005130.4, | |
| Description | 17 kDa HBGF-binding protein17 kDa heparin-binding growth factor-binding proteinFGF-binding protein 1fibroblast growth factor-binding protein 1heparin-binding growth factor binding protein | |
| Modification date | 20141222 | |
| dbXrefs | MIM : 607737 | |
| HGNC : HGNC | ||
| Ensembl : ENSG00000137440 | ||
| HPRD : 06371 | ||
| Vega : OTTHUMG00000097745 | ||
| Protein | UniProt: go to UniProt's Cross Reference DB Table | |
| Expression | CleanEX: HS_FGFBP1 | |
| BioGPS: 9982 | ||
| Pathway | NCI Pathway Interaction Database: FGFBP1 | |
| KEGG: FGFBP1 | ||
| REACTOME: FGFBP1 | ||
| Pathway Commons: FGFBP1 | ||
| Context | iHOP: FGFBP1 | |
| ligand binding site mutation search in PubMed: FGFBP1 | ||
| UCL Cancer Institute: FGFBP1 | ||
| Assigned class in TissGDB* | B | |
| Included tissue-specific gene expression resources | HPA,TiGER,GTEx | |
| Specific-tissues in normal samples (assigned by TissGDB using HPA, TiGER, and GTEx) | EsophagusStomach | |
| Cancer types related to the specific-tissues in cancer samples (assigned by TissGDB using TCGA) | ESCASTAD | |
| Reference showing the relevant tissue of FGFBP1 | ||
| Description by TissGene annotations | ||
| * Class A consists of genes with literature evidence and is part of the cTissGenes. Class B consists of only cTissGenes without additional evidence. The remaining genes belong to Class C. |
| Gene ontology having evidence of Inferred from Direct Assay (IDA) from Entrez |
| GO ID | GO term | PubMed ID |
| Top |
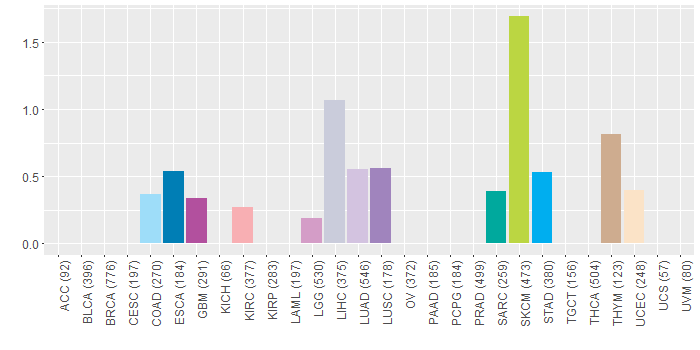
| TissGeneExp for FGFBP1 |
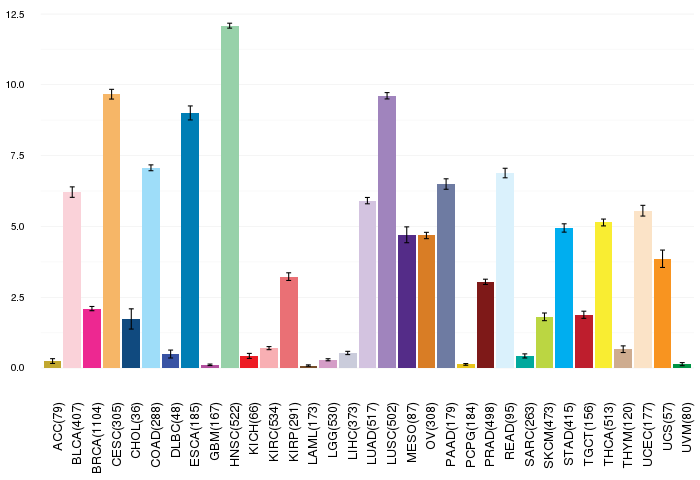
| Gene expressions across 28 cancer types (X-axis: cancer type and Y-axis: log2(norm_counts+1)) (TCGA IlluminaHiSeq_RNASeqV2, pan-cancer normalized log2(norm_counts+1) data, version 2016-08-16) |
 |
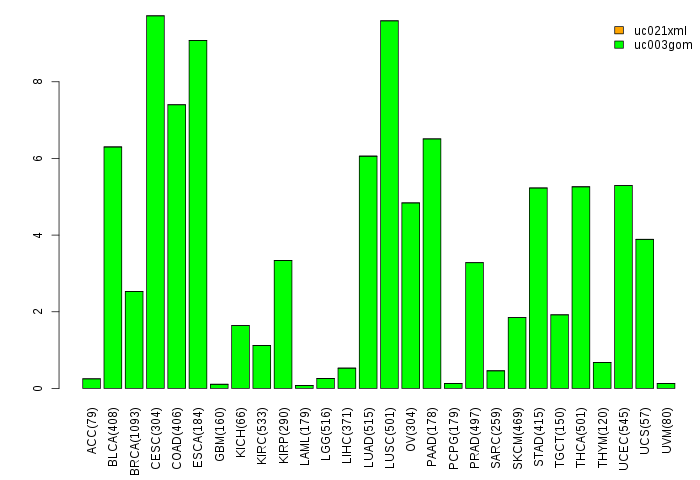
| Gene isoform expressions across 28 cancer types (X-axis: cancer type and Y-axis: log2(norm_counts+1)) (TCGA pan-cancer tcga_rsem_isoform_tpm, version 2016-09-01) |
 |
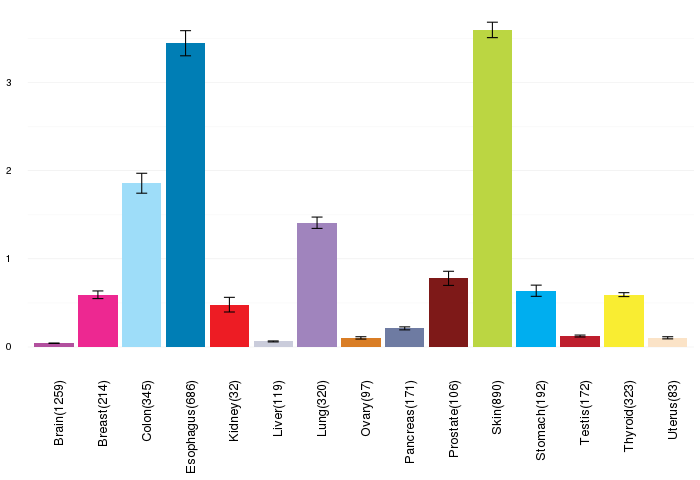
| Gene expressions across normal tissues of GTEx data (GTEx GTEx_Analysis_v6_RNA-seq_RNA-SeQCv1.1.8_gene_rpkm.gct) - Here, we shows the matched tissue types only among our 28 cancer types. |
 |
| Different expressions across 14 cancer types with more than 10 samples between matched tumors and normals (X-axis: cancer type and Y-axis: log2(norm_counts+1)) (TCGA IlluminaHiSeq_RNASeqV2, pan-cancer normalized log2(norm_counts+1) data, version 2016-08-16) |
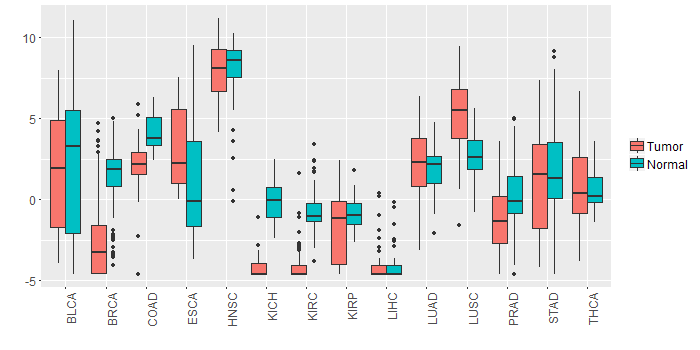 |
| - Significantly differentially expressed cancer types and information. (|Fold change|>1 and FDR<0.05) |
| Cancer type | Mean(exp) in tumor | Mean(exp) in matched normal | Log2FC | P-val. | FDR |
| LUSC | 5.194378896 | 2.600635759 | 2.593743137 | 2.02E-09 | 6.74E-09 |
| KIRC | -4.057243081 | -0.74304447 | -3.314198611 | 1.05E-35 | 2.94E-34 |
| KICH | -4.154685025 | -0.089669025 | -4.065016 | 1.62E-14 | 2.86E-13 |
| BRCA | -2.545765376 | 1.369777606 | -3.915542982 | 7.28E-32 | 1.06E-30 |
| PRAD | -1.201501948 | 0.061740359 | -1.263242308 | 0.00425 | 0.011284468 |
| COAD | 2.015517282 | 4.125790359 | -2.110273077 | 4.10E-05 | 0.000163329 |
| Top |
| TissGene-miRNA for FGFBP1 |
| Significantly anti-correlated miRNAs of TissGene across 28 cancer types (Gene-miRNA relations from TargetScanHuman Relsease 7.1, Conserved_Site_Context_Scores.txt.zip, 06.01.2016) (TCGA IlluminaHiSeq_miRNASeq, log2(RPM+1) data, version 2016-11-21) (TCGA IlluminaHiSeq_RNASeqV2, log2(normalized_count+1) data, version 2016-08-16) (Spearman’s Rank Correlation (p-value<0.05 and coefficient<-0.25)) |
| Cancer type | miRNA id | miRNA accession | P-val. | Coeff. | # samples |
| Top |
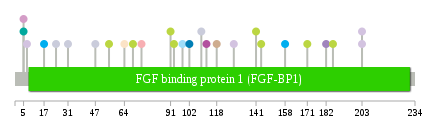
| TissGeneMut for FGFBP1 |
| TissGeneSNV for FGFBP1 |
| nsSNV counts per each loci. Different colors of circles represent different cancer types. Circle size denotes number of samples. (TCGA somatic mutation (SNPs and small INDELs) data, version 2016-04-25) * Click on the image to enlarge it in a new window. |
 |
 |
| Somatic nucleotide variants of TissGene across 28 cancer types (X-axis: cancer type and Y-axis: % of mutated samples) The numbers in parentheses are numbers of samples with mutation (nsSNVs). (TCGA somatic mutation (SNPs and small INDELs) data, version 2016-04-25) |
 |
| - nsSNVs sorted by frequency. |
| AAchange | Cancer type | # samples |
| p.S93F | SKCM | 1 |
| p.R118Q | THYM | 1 |
| p.S102L | ESCA | 1 |
| p.M203I | LUAD | 1 |
| p.R69K | SKCM | 1 |
| p.R171K | SKCM | 1 |
| p.P144S | SKCM | 1 |
| p.Q17H | STAD | 1 |
| p.E91K | SKCM | 1 |
| p.S182C | LUSC | 1 |
| p.S5R | SARC | 1 |
| p.T7N | LUAD | 1 |
| p.Q47L | LIHC | 1 |
| p.M203K | LUAD | 1 |
| p.E74D | KIRC | 1 |
| p.G55E | SKCM | 1 |
| p.Y112H | GBM | 1 |
| p.L31I | LIHC | 1 |
| p.K141* | SKCM | 1 |
| p.N158S | STAD | 1 |
| p.V186M | SKCM | 1 |
| p.R128K | LUAD | 1 |
| p.G98D | COAD | 1 |
| p.E109D | LIHC | 1 |
| p.D64Y | UCEC | 1 |
| p.S5N | LGG | 1 |
| p.K24E | LIHC | 1 |
| Top |
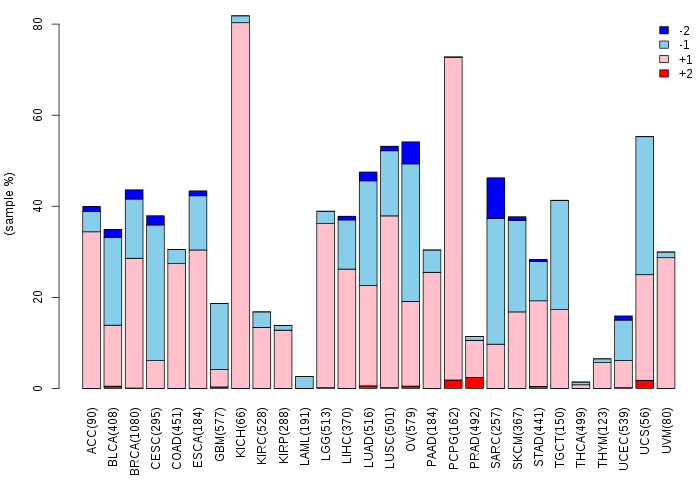
| TissGeneCNV for FGFBP1 |
| Copy number variations of TissGene across 28 cancer types (X-axis: cancer type and Y-axis: % of CNV samples) (TCGA Gistic2_CopyNumber_Gistic2_all_data_by_genes, Gistic2 copy number data, version 2016-08-16) |
 |
| Top |
| TissGeneFusions for FGFBP1 |
| Fusion genes including TissGene (ChimerDB 3.0, 2016-12-01 and TCGA fusion Portal 2015-12-01) |
| Database | Src | Cancer type | Sample | Fusion gene | ORF | 5'-gene BP | 3'-gene BP |
| Top |
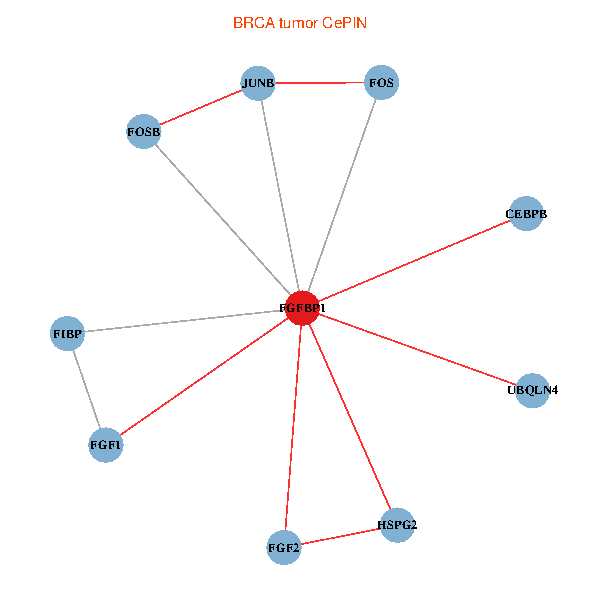
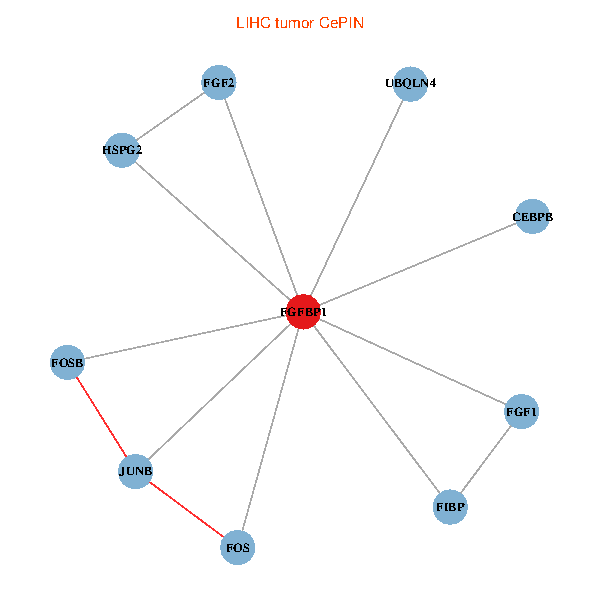
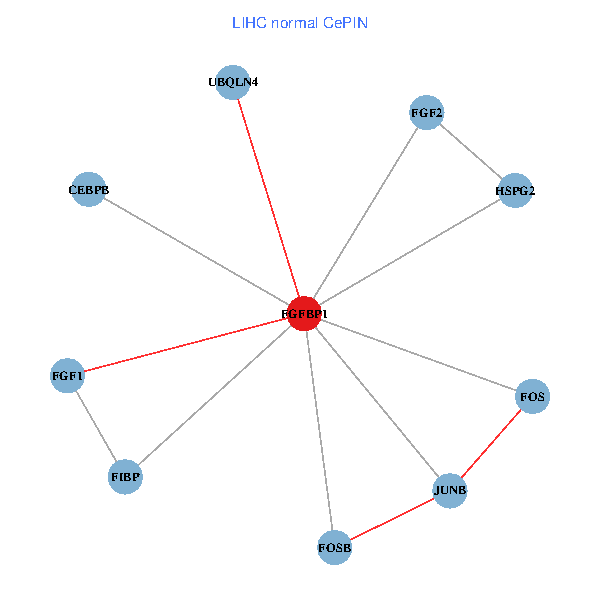
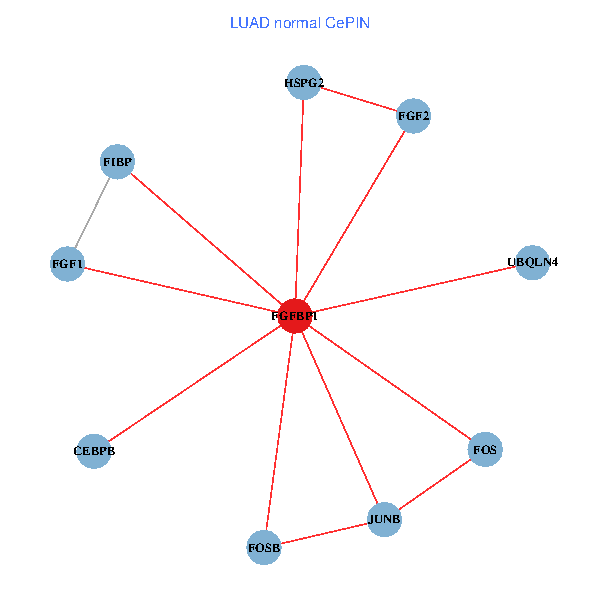
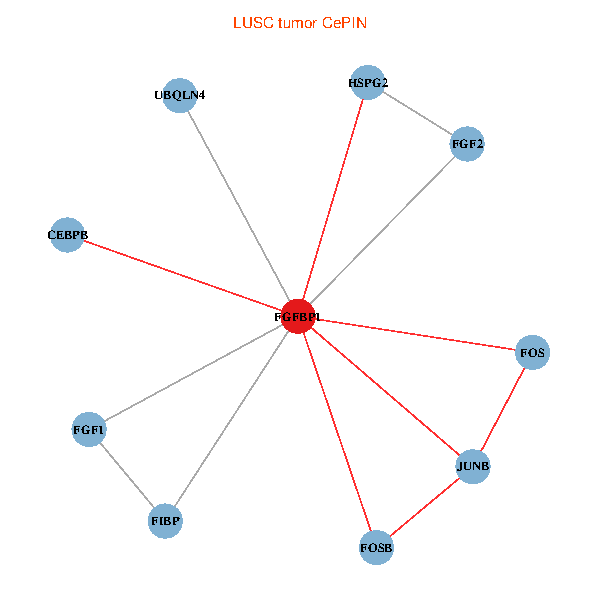
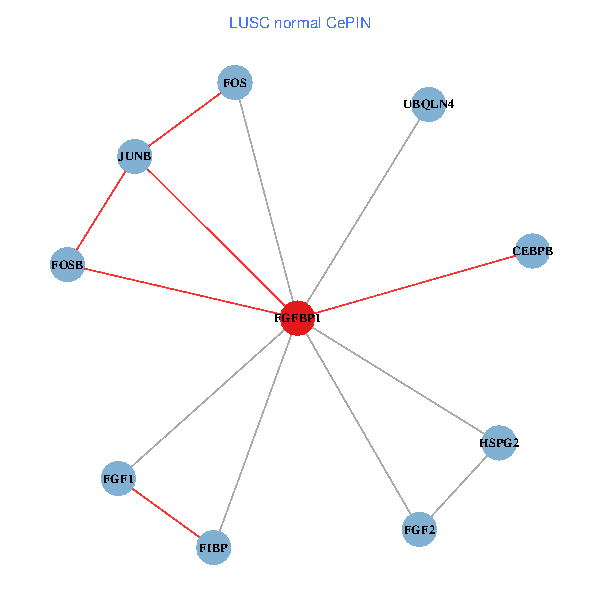
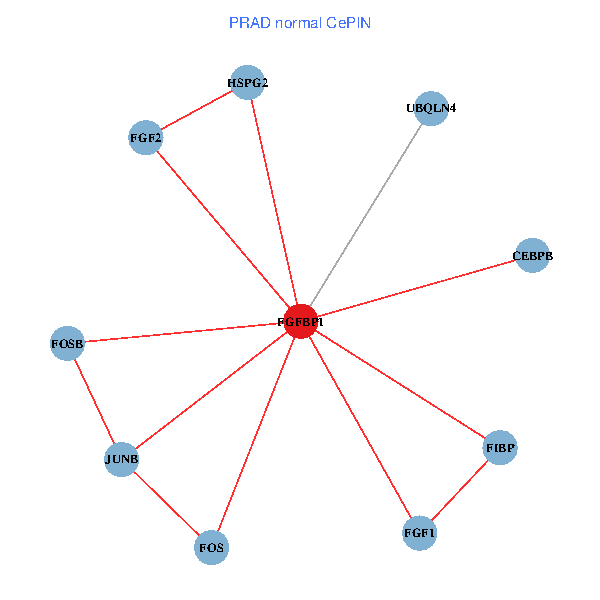
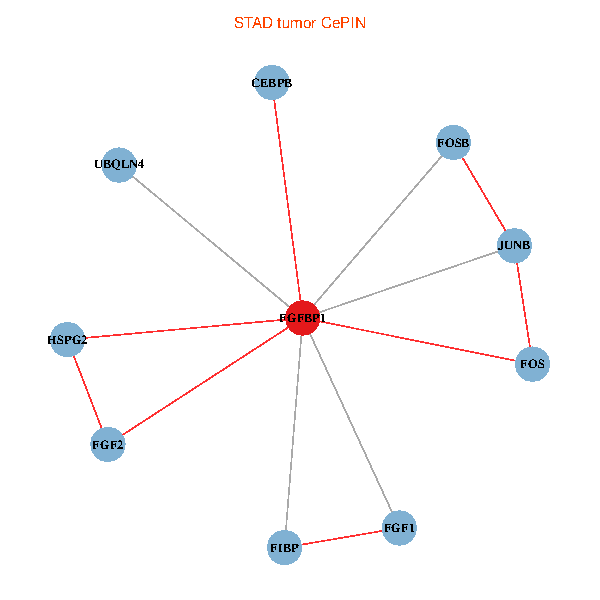
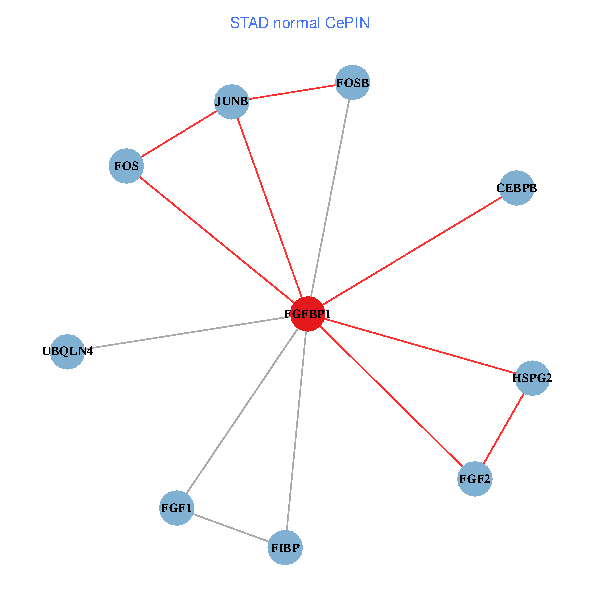
| TissGeneNet for FGFBP1 |
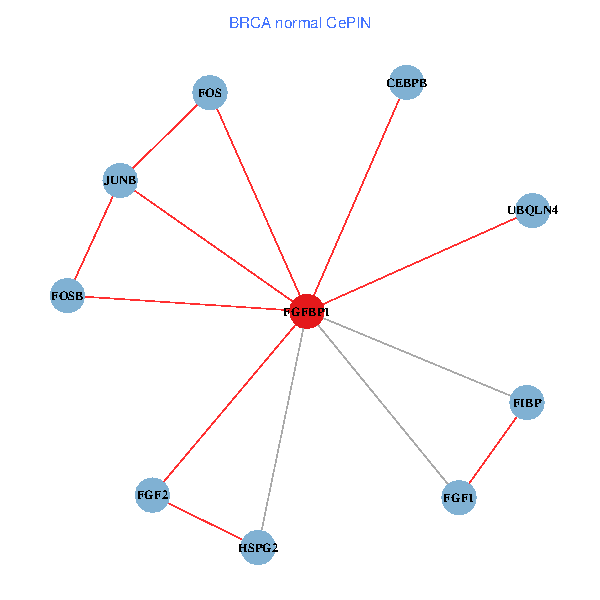
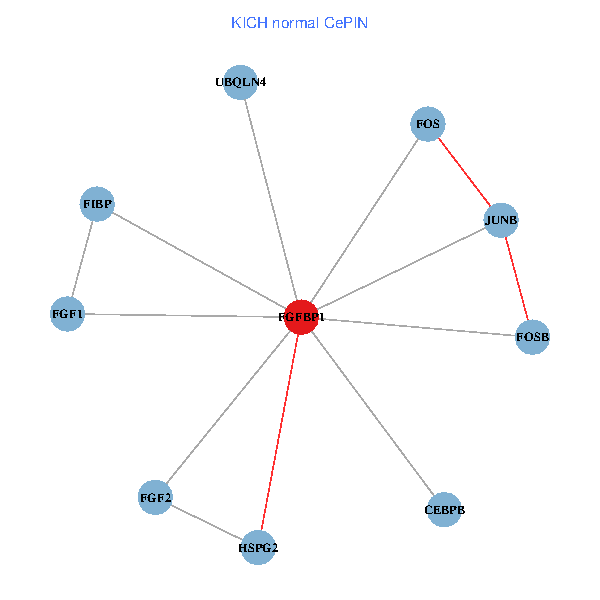
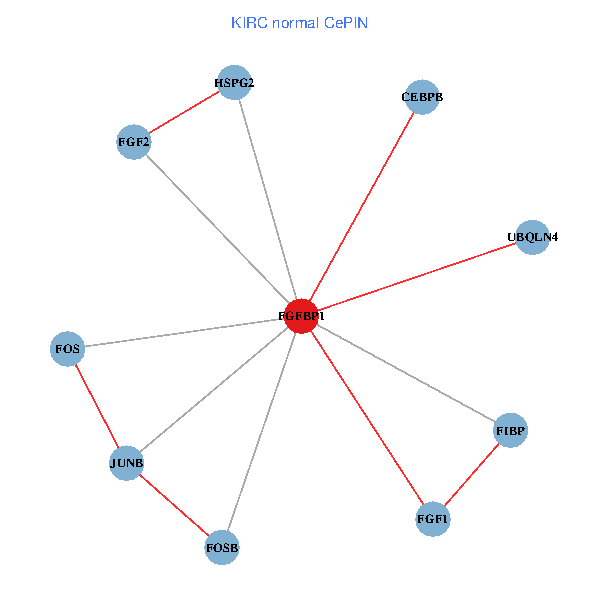
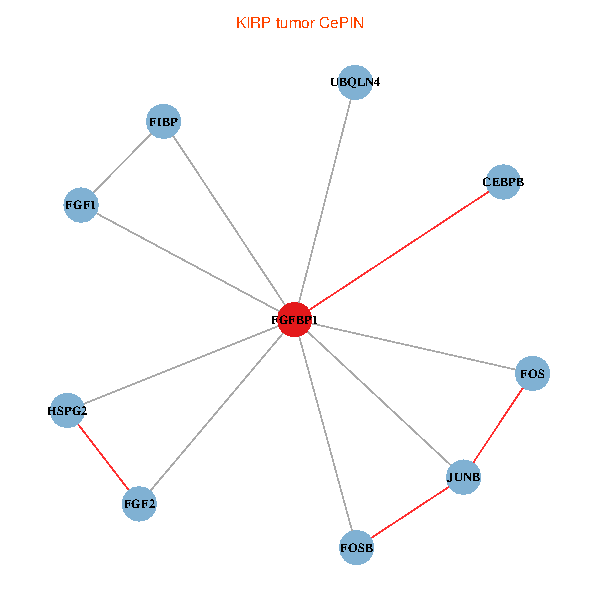
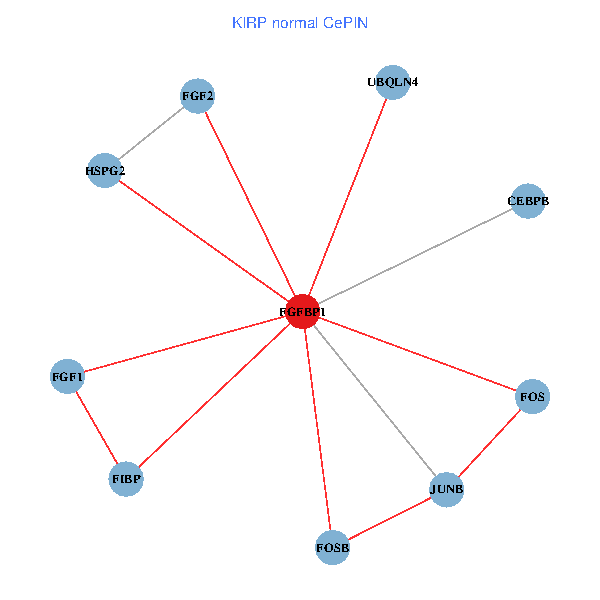
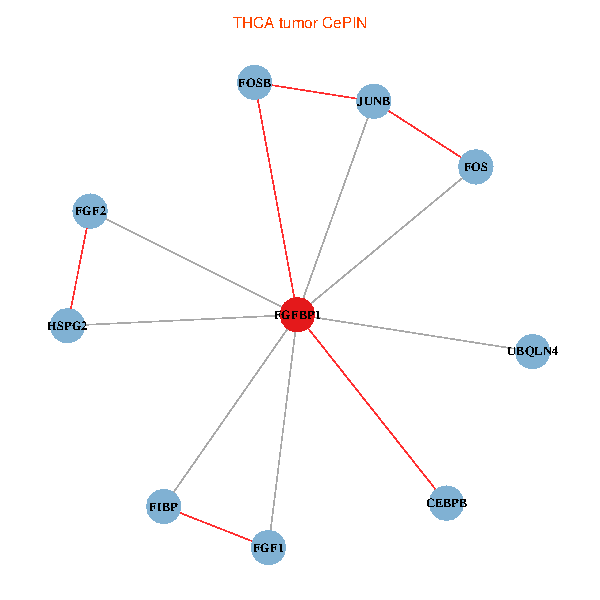
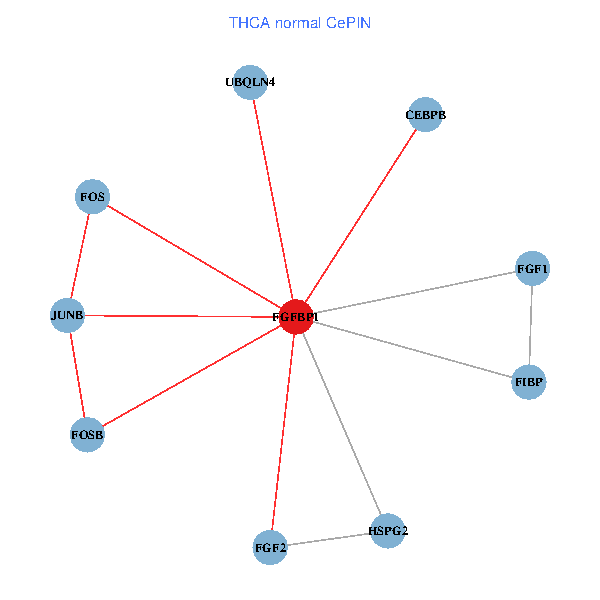
| Co-expressed gene networks based on protein-protein interaction data (CePIN) (TCGA IlluminaHiSeq_RNASeqV2, pan-cancer normalized log2(norm_counts+1) data, version 2016-08-16) (PINA2 ppi data) |
| BRCA (tumor) | BRCA (normal) |
| FGFBP1, FOS, CEBPB, FGF2, UBQLN4, HSPG2, FIBP, JUNB, FGF1, FOSB (tumor) | FGFBP1, FOS, CEBPB, FGF2, UBQLN4, HSPG2, FIBP, JUNB, FGF1, FOSB (normal) |
 |  |
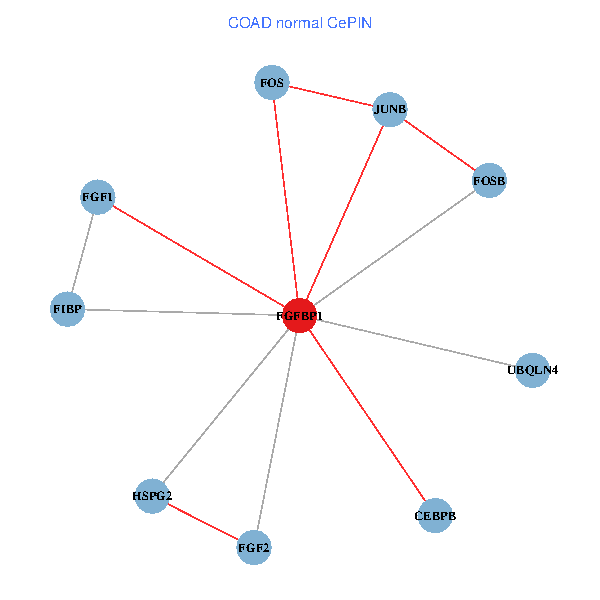
| COAD (tumor) | COAD (normal) |
| FGFBP1, FOS, CEBPB, FGF2, UBQLN4, HSPG2, FIBP, JUNB, FGF1, FOSB (tumor) | FGFBP1, FOS, CEBPB, FGF2, UBQLN4, HSPG2, FIBP, JUNB, FGF1, FOSB (normal) |
 |  |
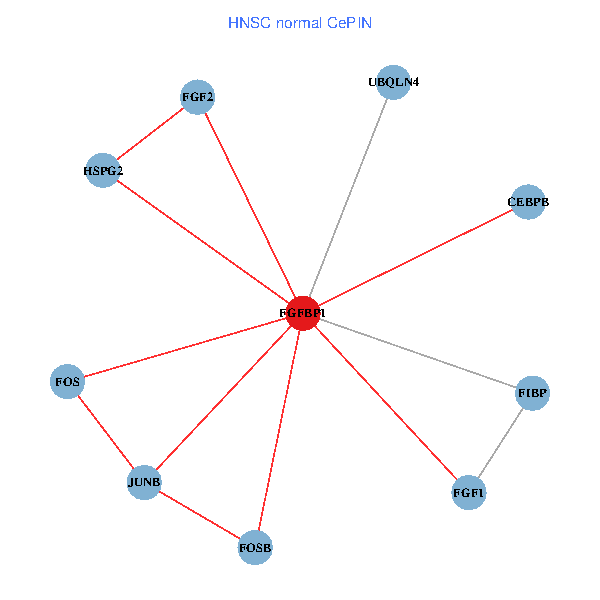
| HNSC (tumor) | HNSC (normal) |
| FGFBP1, FOS, CEBPB, FGF2, UBQLN4, HSPG2, FIBP, JUNB, FGF1, FOSB (tumor) | FGFBP1, FOS, CEBPB, FGF2, UBQLN4, HSPG2, FIBP, JUNB, FGF1, FOSB (normal) |
 |  |
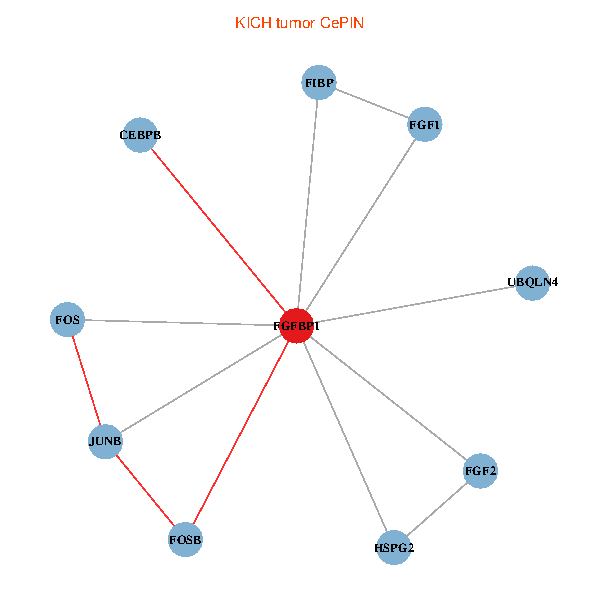
| KICH (tumor) | KICH (normal) |
| FGFBP1, FOS, CEBPB, FGF2, UBQLN4, HSPG2, FIBP, JUNB, FGF1, FOSB (tumor) | FGFBP1, FOS, CEBPB, FGF2, UBQLN4, HSPG2, FIBP, JUNB, FGF1, FOSB (normal) |
 |  |
| KIRC (tumor) | KIRC (normal) |
| FGFBP1, FOS, CEBPB, FGF2, UBQLN4, HSPG2, FIBP, JUNB, FGF1, FOSB (tumor) | FGFBP1, FOS, CEBPB, FGF2, UBQLN4, HSPG2, FIBP, JUNB, FGF1, FOSB (normal) |
 |  |
| KIRP (tumor) | KIRP (normal) |
| FGFBP1, FOS, CEBPB, FGF2, UBQLN4, HSPG2, FIBP, JUNB, FGF1, FOSB (tumor) | FGFBP1, FOS, CEBPB, FGF2, UBQLN4, HSPG2, FIBP, JUNB, FGF1, FOSB (normal) |
 |  |
| LIHC (tumor) | LIHC (normal) |
| FGFBP1, FOS, CEBPB, FGF2, UBQLN4, HSPG2, FIBP, JUNB, FGF1, FOSB (tumor) | FGFBP1, FOS, CEBPB, FGF2, UBQLN4, HSPG2, FIBP, JUNB, FGF1, FOSB (normal) |
 |  |
| LUAD (tumor) | LUAD (normal) |
| FGFBP1, FOS, CEBPB, FGF2, UBQLN4, HSPG2, FIBP, JUNB, FGF1, FOSB (tumor) | FGFBP1, FOS, CEBPB, FGF2, UBQLN4, HSPG2, FIBP, JUNB, FGF1, FOSB (normal) |
 |  |
| LUSC (tumor) | LUSC (normal) |
| FGFBP1, FOS, CEBPB, FGF2, UBQLN4, HSPG2, FIBP, JUNB, FGF1, FOSB (tumor) | FGFBP1, FOS, CEBPB, FGF2, UBQLN4, HSPG2, FIBP, JUNB, FGF1, FOSB (normal) |
 |  |
| PRAD (tumor) | PRAD (normal) |
| FGFBP1, FOS, CEBPB, FGF2, UBQLN4, HSPG2, FIBP, JUNB, FGF1, FOSB (tumor) | FGFBP1, FOS, CEBPB, FGF2, UBQLN4, HSPG2, FIBP, JUNB, FGF1, FOSB (normal) |
 |  |
| STAD (tumor) | STAD (normal) |
| FGFBP1, FOS, CEBPB, FGF2, UBQLN4, HSPG2, FIBP, JUNB, FGF1, FOSB (tumor) | FGFBP1, FOS, CEBPB, FGF2, UBQLN4, HSPG2, FIBP, JUNB, FGF1, FOSB (normal) |
 |  |
| THCA (tumor) | THCA (normal) |
| FGFBP1, FOS, CEBPB, FGF2, UBQLN4, HSPG2, FIBP, JUNB, FGF1, FOSB (tumor) | FGFBP1, FOS, CEBPB, FGF2, UBQLN4, HSPG2, FIBP, JUNB, FGF1, FOSB (normal) |
 |  |
| Top |
| TissGeneProg for FGFBP1 |
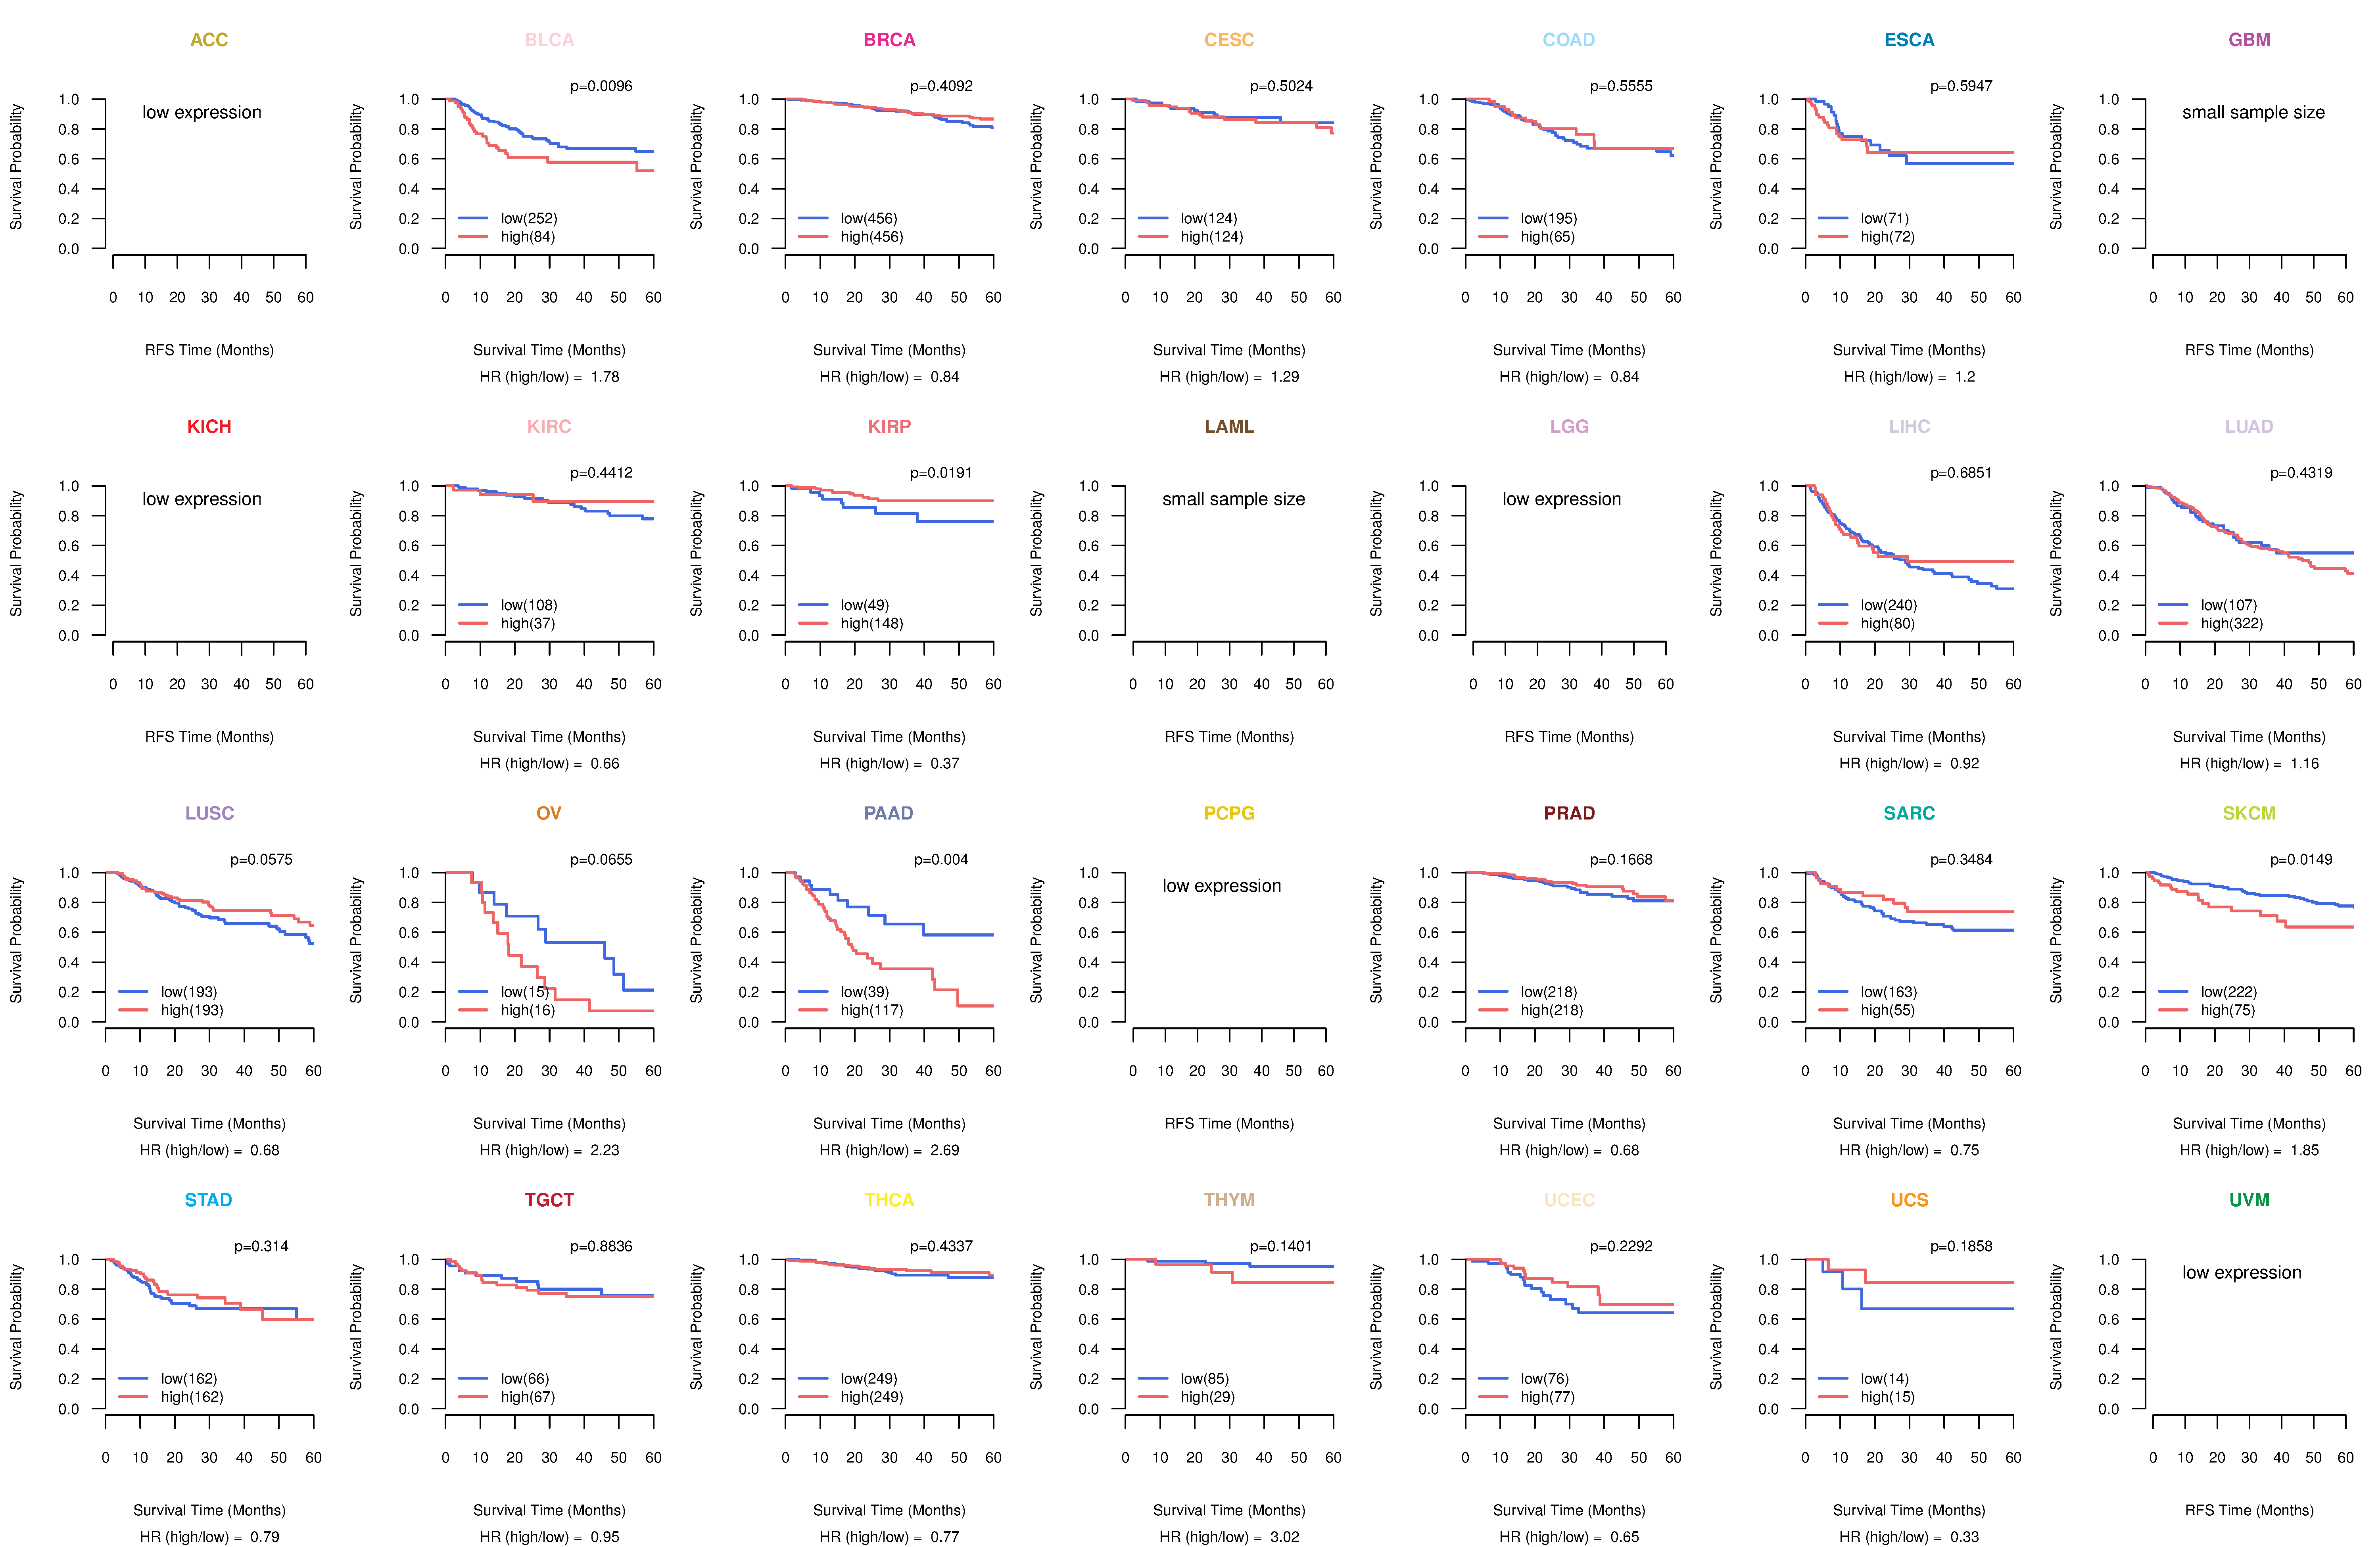
| Kaplan-Meier plots with logrank tests of overall survival (OS) using 28 cancer types (TCGA IlluminaHiSeq_RNASeqV2, pan-cancer normalized log2(norm_counts+1) data, version 2016-08-16) (TCGA clinicalMatrix, phenotype data, version 2016-04-27) * Click on the image to enlarge it in a new window. |
 |
| Kaplan-Meier plots with logrank test of relapse free survival (RFS) using 28 cancer types (TCGA IlluminaHiSeq_RNASeqV2, pan-cancer normalized log2(norm_counts+1) data, version 2016-08-16) (TCGA clinicalMatrix, phenotype data, version 2016-04-27) * Click on the image enlarge it in a new window. |
 |
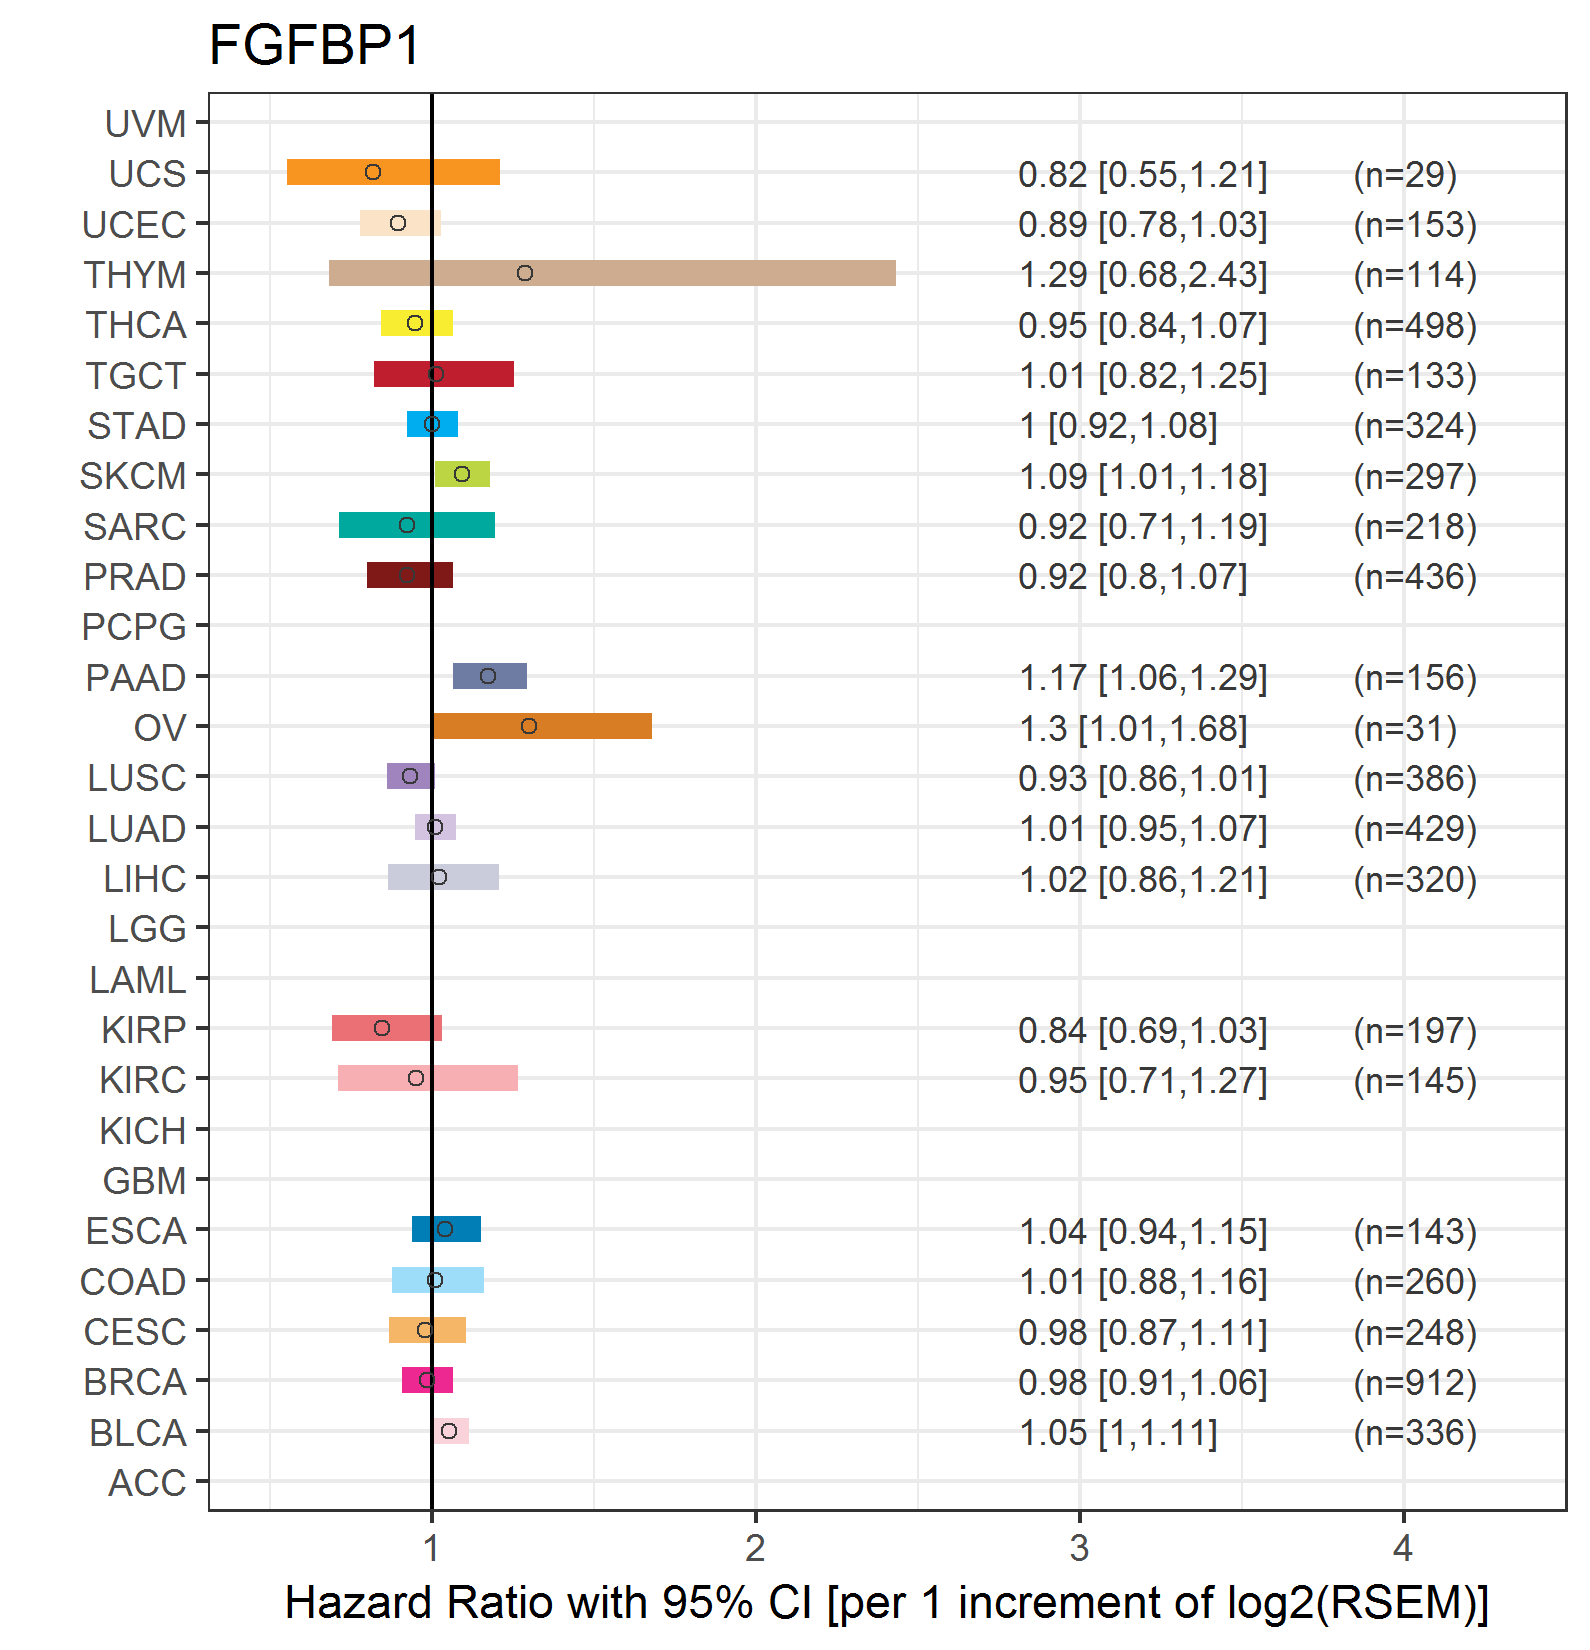
| Forest plot of Cox proportional hazard ratio (HR) and 95% CI of overall survival (OS) using 28 cancer types (TCGA IlluminaHiSeq_RNASeqV2, pan-cancer normalized log2(norm_counts+1) data, version 2016-08-16) (TCGA clinicalMatrix, phenotype data, version 2016-04-27) * Click on the image enlarge it in a new window. |
 |
| Forest plot of Cox proportional hazard ratio (HR) and 95% CI of relapse free survival (RFS) using 28 cancer types (TCGA IlluminaHiSeq_RNASeqV2, pan-cancer normalized log2(norm_counts+1) data, version 2016-08-16) (TCGA clinicalMatrix, phenotype data, version 2016-04-27) * Click on the image enlarge it in a new window. |
 |
| Top |
| TissGeneClin for FGFBP1 |
| TissGeneDrug for FGFBP1 |
| Drug information targeting TissGene (DrugBank Version 5.0.6, 2017-04-01) |
| DrugBank ID | Drug name | Drug activity | Drug type | Drug status |
| Top |
| TissGeneDisease for FGFBP1 |
| Disease information associated with TissGene (DisGeNet, 2016-06-01) |
| Disease ID | Disease name | # pubmeds | Source |
| umls:C0596263 | Carcinogenesis | 2 | BeFree |
| umls:C0006142 | Malignant neoplasm of breast | 1 | BeFree |
| umls:C0007137 | Squamous cell carcinoma | 1 | BeFree |
| umls:C0009402 | Colorectal Carcinoma | 1 | BeFree |
| umls:C0019693 | HIV Infections | 1 | BeFree |
| umls:C0020538 | Hypertensive disease | 1 | BeFree |
| umls:C0022658 | Kidney Diseases | 1 | BeFree |
| umls:C0027404 | Narcolepsy | 1 | GAD |
| umls:C0030305 | Pancreatitis | 1 | BeFree |
| umls:C0032927 | Precancerous Conditions | 1 | BeFree |
| umls:C0281361 | Adenocarcinoma of pancreas | 1 | BeFree |
| umls:C0678222 | Breast Carcinoma | 1 | BeFree |
| umls:C0699790 | Colon Carcinoma | 1 | BeFree |
| umls:C0850572 | Adenomatous polyp of colon | 1 | BeFree |
| umls:C0853879 | Invasive breast carcinoma | 1 | BeFree |
| umls:C1301034 | Pancreatic intraepithelial neoplasia | 1 | BeFree |
| umls:C1334274 | Invasive Carcinoma | 1 | BeFree |
| umls:C1527249 | Colorectal Cancer | 1 | BeFree |
|
Copyright 2016-Present - The University of Texas Health Science Center at Houston (UTHealth) Web File Viewing | How to Report, Fraud, Waste and Abuse | State of Texas | Statewide Search | Texas Homeland Security | Site Policies |