|
||||||||||||||||||||
| |
| Phenotypic Information (metabolism pathway, cancer, disease, phenome) |
| |
| |
| Gene-Gene Network Information: Co-Expression Network, Interacting Genes & KEGG |
| |
|


| Gene Summary for NME6 |
| Basic gene info. | Gene symbol | NME6 |
| Gene name | NME/NM23 nucleoside diphosphate kinase 6 | |
| Synonyms | IPIA-ALPHA|NDK 6|NM23-H6 | |
| Cytomap | UCSC genome browser: 3p21 | |
| Genomic location | chr3 :48335588-48342848 | |
| Type of gene | protein-coding | |
| RefGenes | NM_005793.3, | |
| Ensembl id | ENSG00000172113 | |
| Description | NDP kinase 6inhibitor of p53-induced apoptosis-alphanon-metastatic cells 6, protein expressed in (nucleoside-diphosphate kinase)nucleoside diphosphate kinase 6 | |
| Modification date | 20141207 | |
| dbXrefs | MIM : 608294 | |
| HGNC : HGNC | ||
| Ensembl : ENSG00000172113 | ||
| HPRD : 09219 | ||
| Vega : OTTHUMG00000133531 | ||
| Protein | UniProt: go to UniProt's Cross Reference DB Table | |
| Expression | CleanEX: HS_NME6 | |
| BioGPS: 10201 | ||
| Gene Expression Atlas: ENSG00000172113 | ||
| The Human Protein Atlas: ENSG00000172113 | ||
| Pathway | NCI Pathway Interaction Database: NME6 | |
| KEGG: NME6 | ||
| REACTOME: NME6 | ||
| ConsensusPathDB | ||
| Pathway Commons: NME6 | ||
| Metabolism | MetaCyc: NME6 | |
| HUMANCyc: NME6 | ||
| Regulation | Ensembl's Regulation: ENSG00000172113 | |
| miRBase: chr3 :48,335,588-48,342,848 | ||
| TargetScan: NM_005793 | ||
| cisRED: ENSG00000172113 | ||
| Context | iHOP: NME6 | |
| cancer metabolism search in PubMed: NME6 | ||
| UCL Cancer Institute: NME6 | ||
| Assigned class in ccmGDB | C | |
| Top |
| Phenotypic Information for NME6(metabolism pathway, cancer, disease, phenome) |
| Cancer | CGAP: NME6 |
| Familial Cancer Database: NME6 | |
| * This gene is included in those cancer gene databases. |
|
|
|
|
|
| . | ||||||||||||||
Oncogene 1 | Significant driver gene in | |||||||||||||||||||
| cf) number; DB name 1 Oncogene; http://nar.oxfordjournals.org/content/35/suppl_1/D721.long, 2 Tumor Suppressor gene; https://bioinfo.uth.edu/TSGene/, 3 Cancer Gene Census; http://www.nature.com/nrc/journal/v4/n3/abs/nrc1299.html, 4 CancerGenes; http://nar.oxfordjournals.org/content/35/suppl_1/D721.long, 5 Network of Cancer Gene; http://ncg.kcl.ac.uk/index.php, 1Therapeutic Vulnerabilities in Cancer; http://cbio.mskcc.org/cancergenomics/statius/ |
| KEGG_PURINE_METABOLISM KEGG_PYRIMIDINE_METABOLISM | |
| OMIM | |
| Orphanet | |
| Disease | KEGG Disease: NME6 |
| MedGen: NME6 (Human Medical Genetics with Condition) | |
| ClinVar: NME6 | |
| Phenotype | MGI: NME6 (International Mouse Phenotyping Consortium) |
| PhenomicDB: NME6 | |
| Mutations for NME6 |
| * Under tables are showing count per each tissue to give us broad intuition about tissue specific mutation patterns.You can go to the detailed page for each mutation database's web site. |
| There's no structural variation information in COSMIC data for this gene. |
| * From mRNA Sanger sequences, Chitars2.0 arranged chimeric transcripts. This table shows NME6 related fusion information. |
| ID | Head Gene | Tail Gene | Accession | Gene_a | qStart_a | qEnd_a | Chromosome_a | tStart_a | tEnd_a | Gene_a | qStart_a | qEnd_a | Chromosome_a | tStart_a | tEnd_a |
| Top |
| There's no copy number variation information in COSMIC data for this gene. |
| Top |
|
 |
| Top |
| Stat. for Non-Synonymous SNVs (# total SNVs=12) | (# total SNVs=2) |
 |  |
(# total SNVs=0) | (# total SNVs=0) |
| Top |
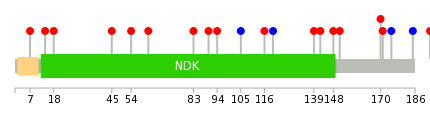
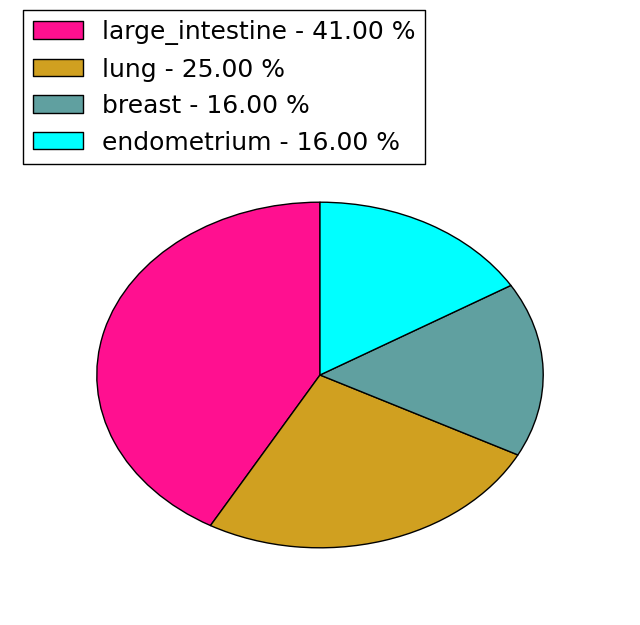
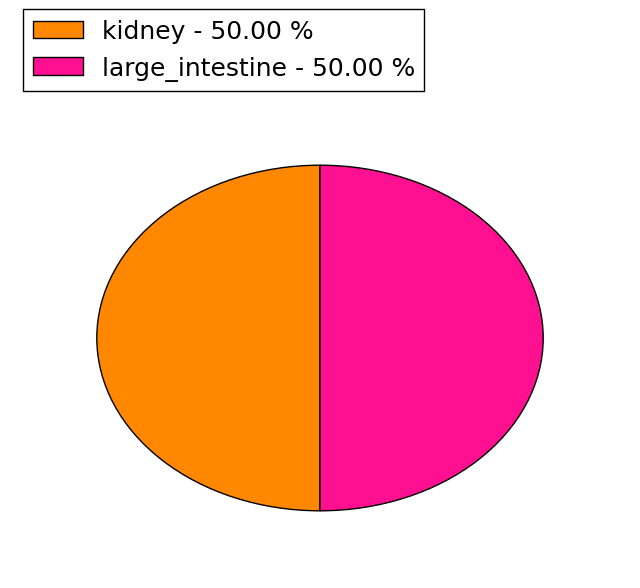
| * When you move the cursor on each content, you can see more deailed mutation information on the Tooltip. Those are primary_site,primary_histology,mutation(aa),pubmedID. |
| GRCh37 position | Mutation(aa) | Unique sampleID count |
| chr3:48336643-48336643 | p.R114* | 2 |
| chr3:48340011-48340011 | p.S7I | 1 |
| chr3:48336157-48336157 | p.V185V | 1 |
| chr3:48336668-48336668 | p.T105T | 1 |
| chr3:48336187-48336187 | p.C175C | 1 |
| chr3:48336702-48336702 | p.L94P | 1 |
| chr3:48336200-48336200 | p.C171Y | 1 |
| chr3:48336714-48336714 | p.R90Q | 1 |
| chr3:48336203-48336203 | p.R170H | 1 |
| chr3:48337618-48337618 | p.F83Y | 1 |
| Top |
|
 |
| Point Mutation/ Tissue ID | 1 | 2 | 3 | 4 | 5 | 6 | 7 | 8 | 9 | 10 | 11 | 12 | 13 | 14 | 15 | 16 | 17 | 18 | 19 | 20 |
| # sample | 1 | 5 | 1 | 2 | 3 | 4 | 1 | |||||||||||||
| # mutation | 1 | 4 | 1 | 2 | 3 | 4 | 1 | |||||||||||||
| nonsynonymous SNV | 1 | 3 | 2 | 3 | 3 | 1 | ||||||||||||||
| synonymous SNV | 1 | 1 | 1 |
| cf) Tissue ID; Tissue type (1; BLCA[Bladder Urothelial Carcinoma], 2; BRCA[Breast invasive carcinoma], 3; CESC[Cervical squamous cell carcinoma and endocervical adenocarcinoma], 4; COAD[Colon adenocarcinoma], 5; GBM[Glioblastoma multiforme], 6; Glioma Low Grade, 7; HNSC[Head and Neck squamous cell carcinoma], 8; KICH[Kidney Chromophobe], 9; KIRC[Kidney renal clear cell carcinoma], 10; KIRP[Kidney renal papillary cell carcinoma], 11; LAML[Acute Myeloid Leukemia], 12; LUAD[Lung adenocarcinoma], 13; LUSC[Lung squamous cell carcinoma], 14; OV[Ovarian serous cystadenocarcinoma ], 15; PAAD[Pancreatic adenocarcinoma], 16; PRAD[Prostate adenocarcinoma], 17; SKCM[Skin Cutaneous Melanoma], 18:STAD[Stomach adenocarcinoma], 19:THCA[Thyroid carcinoma], 20:UCEC[Uterine Corpus Endometrial Carcinoma]) |
| Top |
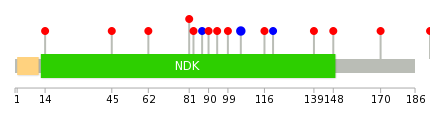
| * We represented just top 10 SNVs. When you move the cursor on each content, you can see more deailed mutation information on the Tooltip. Those are primary_site, primary_histology, mutation(aa), pubmedID. |
| Genomic Position | Mutation(aa) | Unique sampleID count |
| chr3:48336668 | p.T105T | 2 |
| chr3:48337618 | p.S139L | 1 |
| chr3:48336203 | p.P120P | 1 |
| chr3:48337625 | p.R116C | 1 |
| chr3:48336270 | p.A99V | 1 |
| chr3:48338250 | p.L94P | 1 |
| chr3:48336567 | p.R90Q | 1 |
| chr3:48338301 | p.G87G | 1 |
| chr3:48336623 | p.F83Y | 1 |
| chr3:48339990 | p.V81M | 1 |
| * Copy number data were extracted from TCGA using R package TCGA-Assembler. The URLs of all public data files on TCGA DCC data server were gathered on Jan-05-2015. Function ProcessCNAData in TCGA-Assembler package was used to obtain gene-level copy number value which is calculated as the average copy number of the genomic region of a gene. |
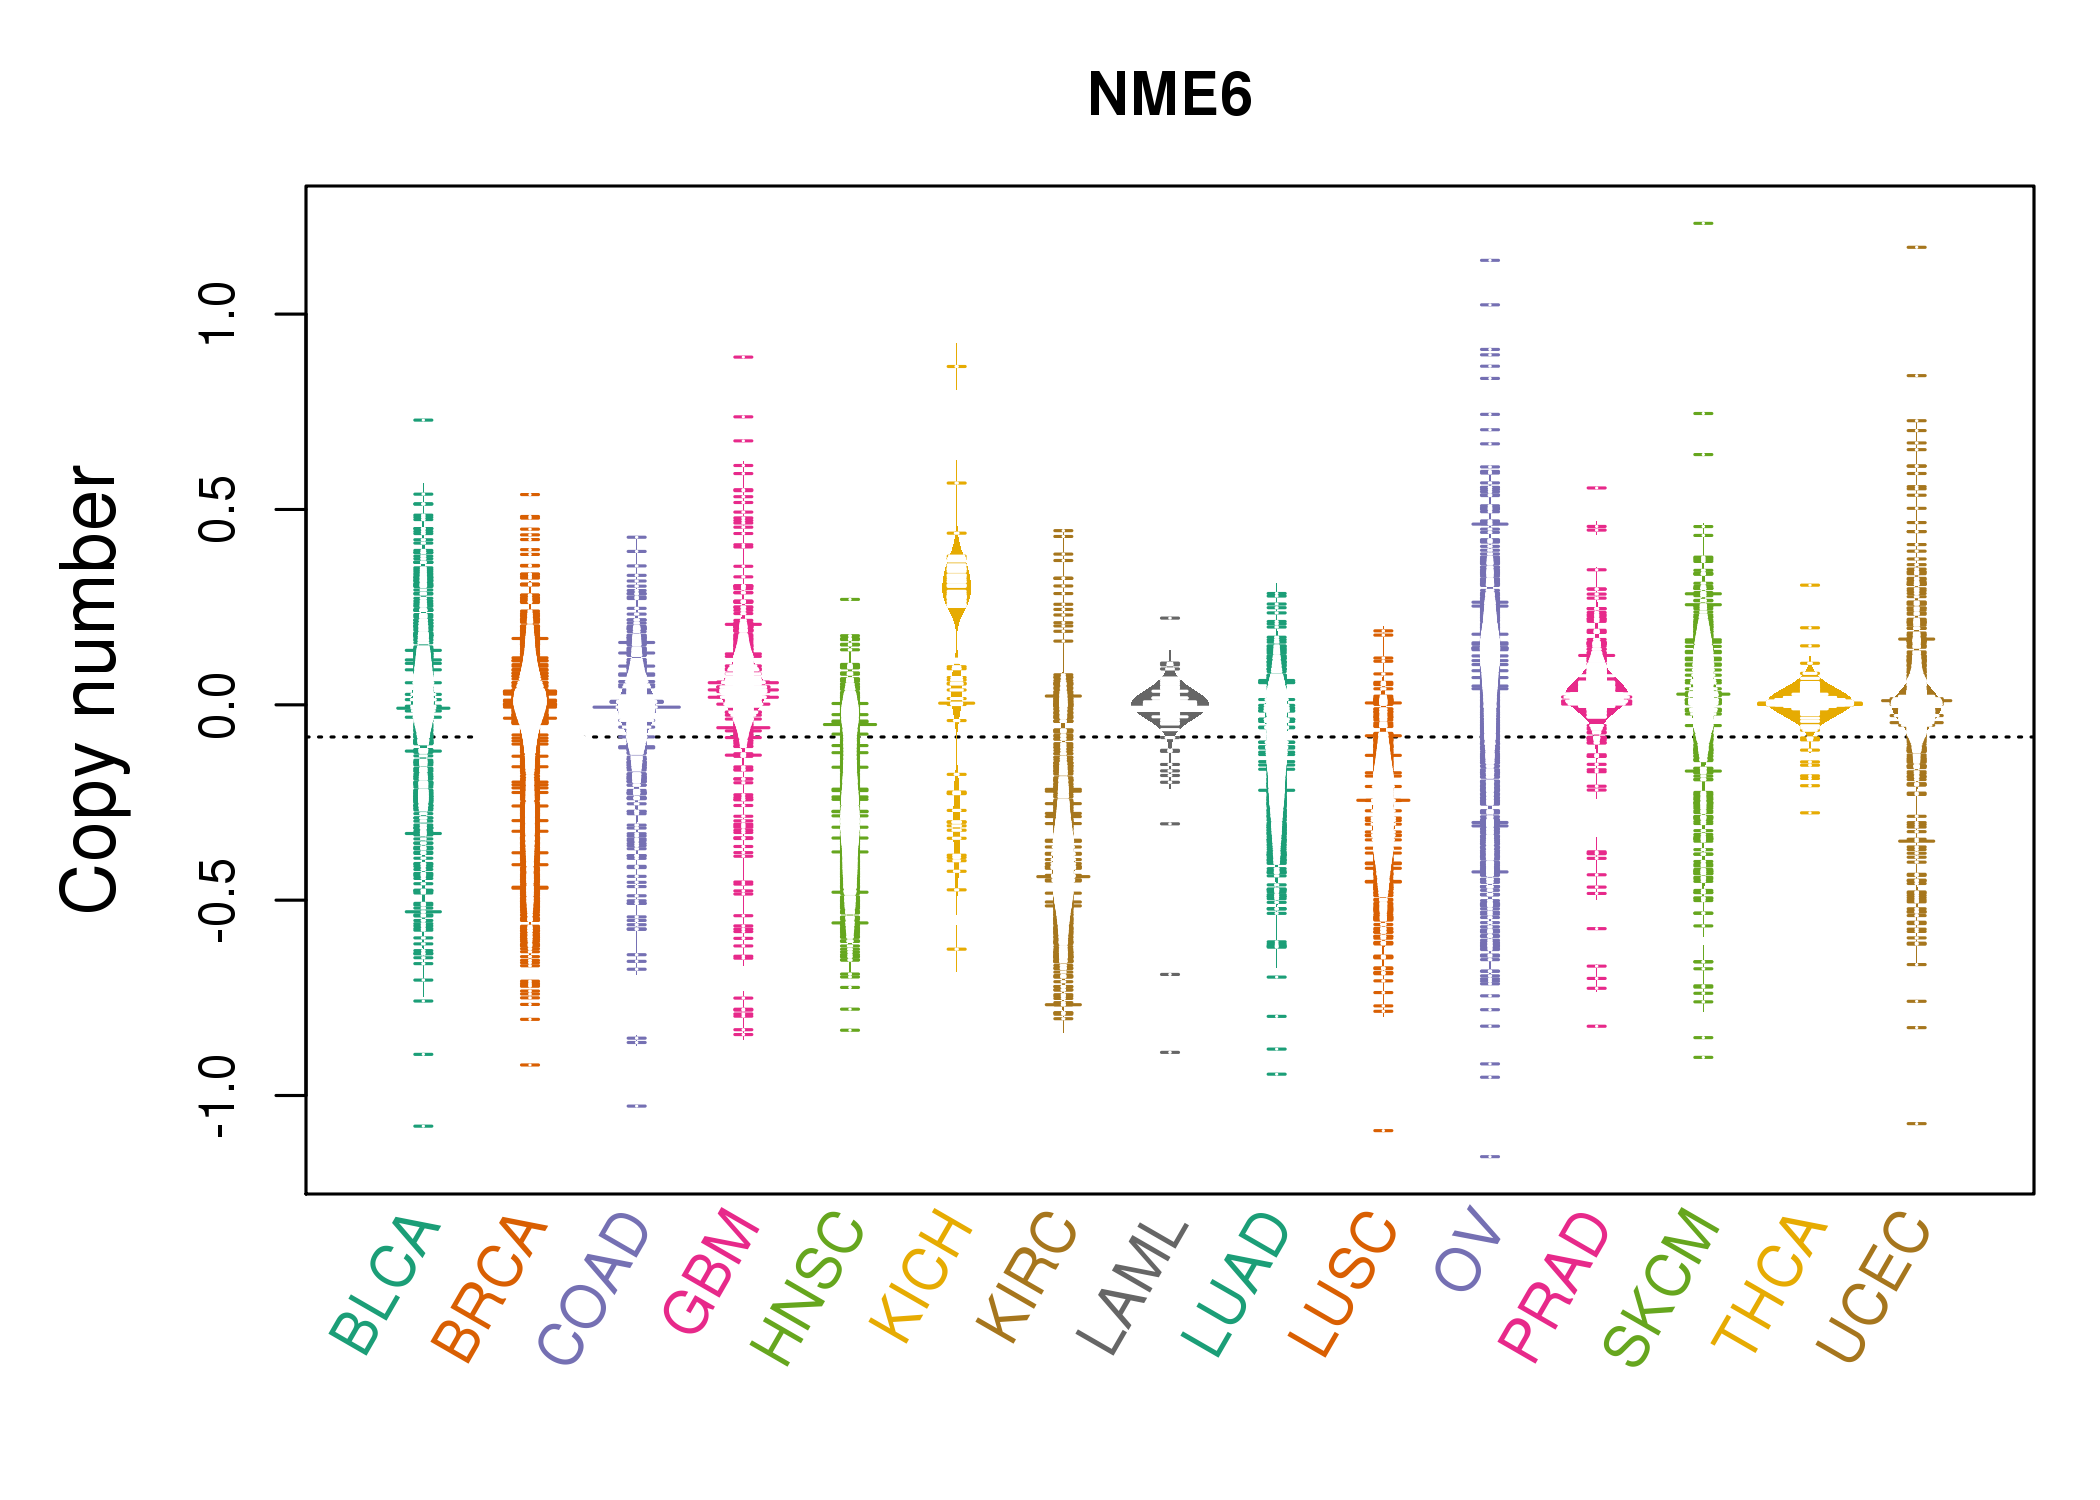 |
| cf) Tissue ID[Tissue type]: BLCA[Bladder Urothelial Carcinoma], BRCA[Breast invasive carcinoma], CESC[Cervical squamous cell carcinoma and endocervical adenocarcinoma], COAD[Colon adenocarcinoma], GBM[Glioblastoma multiforme], Glioma Low Grade, HNSC[Head and Neck squamous cell carcinoma], KICH[Kidney Chromophobe], KIRC[Kidney renal clear cell carcinoma], KIRP[Kidney renal papillary cell carcinoma], LAML[Acute Myeloid Leukemia], LUAD[Lung adenocarcinoma], LUSC[Lung squamous cell carcinoma], OV[Ovarian serous cystadenocarcinoma ], PAAD[Pancreatic adenocarcinoma], PRAD[Prostate adenocarcinoma], SKCM[Skin Cutaneous Melanoma], STAD[Stomach adenocarcinoma], THCA[Thyroid carcinoma], UCEC[Uterine Corpus Endometrial Carcinoma] |
| Top |
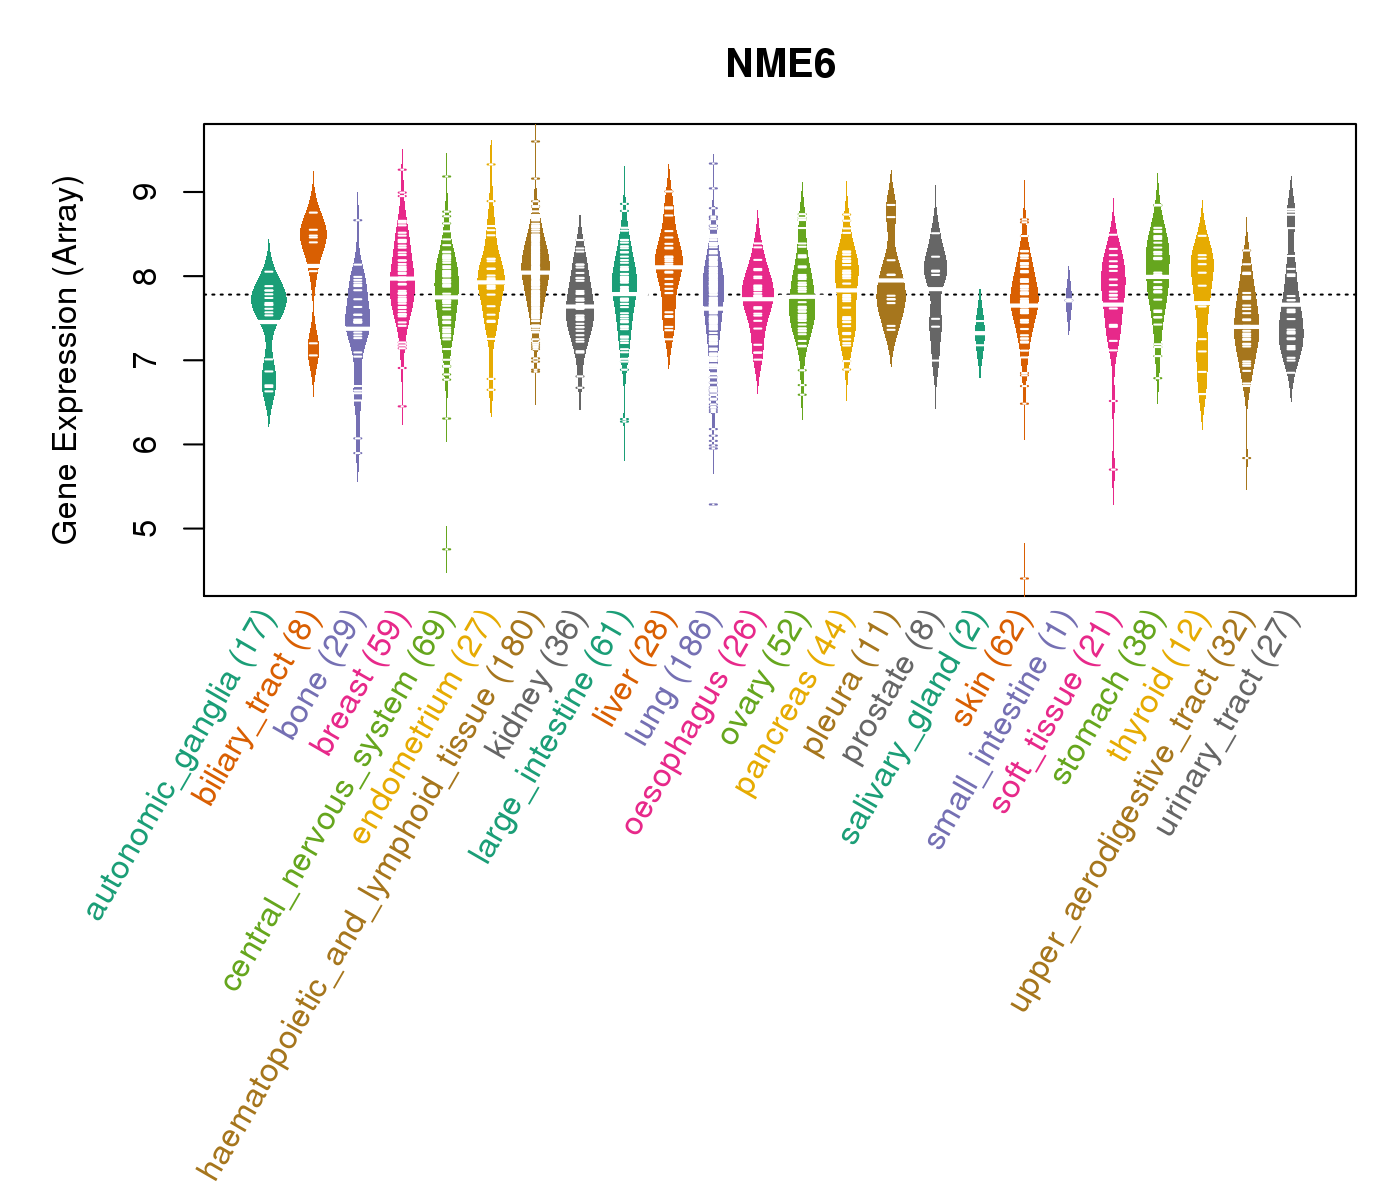
| Gene Expression for NME6 |
| * CCLE gene expression data were extracted from CCLE_Expression_Entrez_2012-10-18.res: Gene-centric RMA-normalized mRNA expression data. |
 |
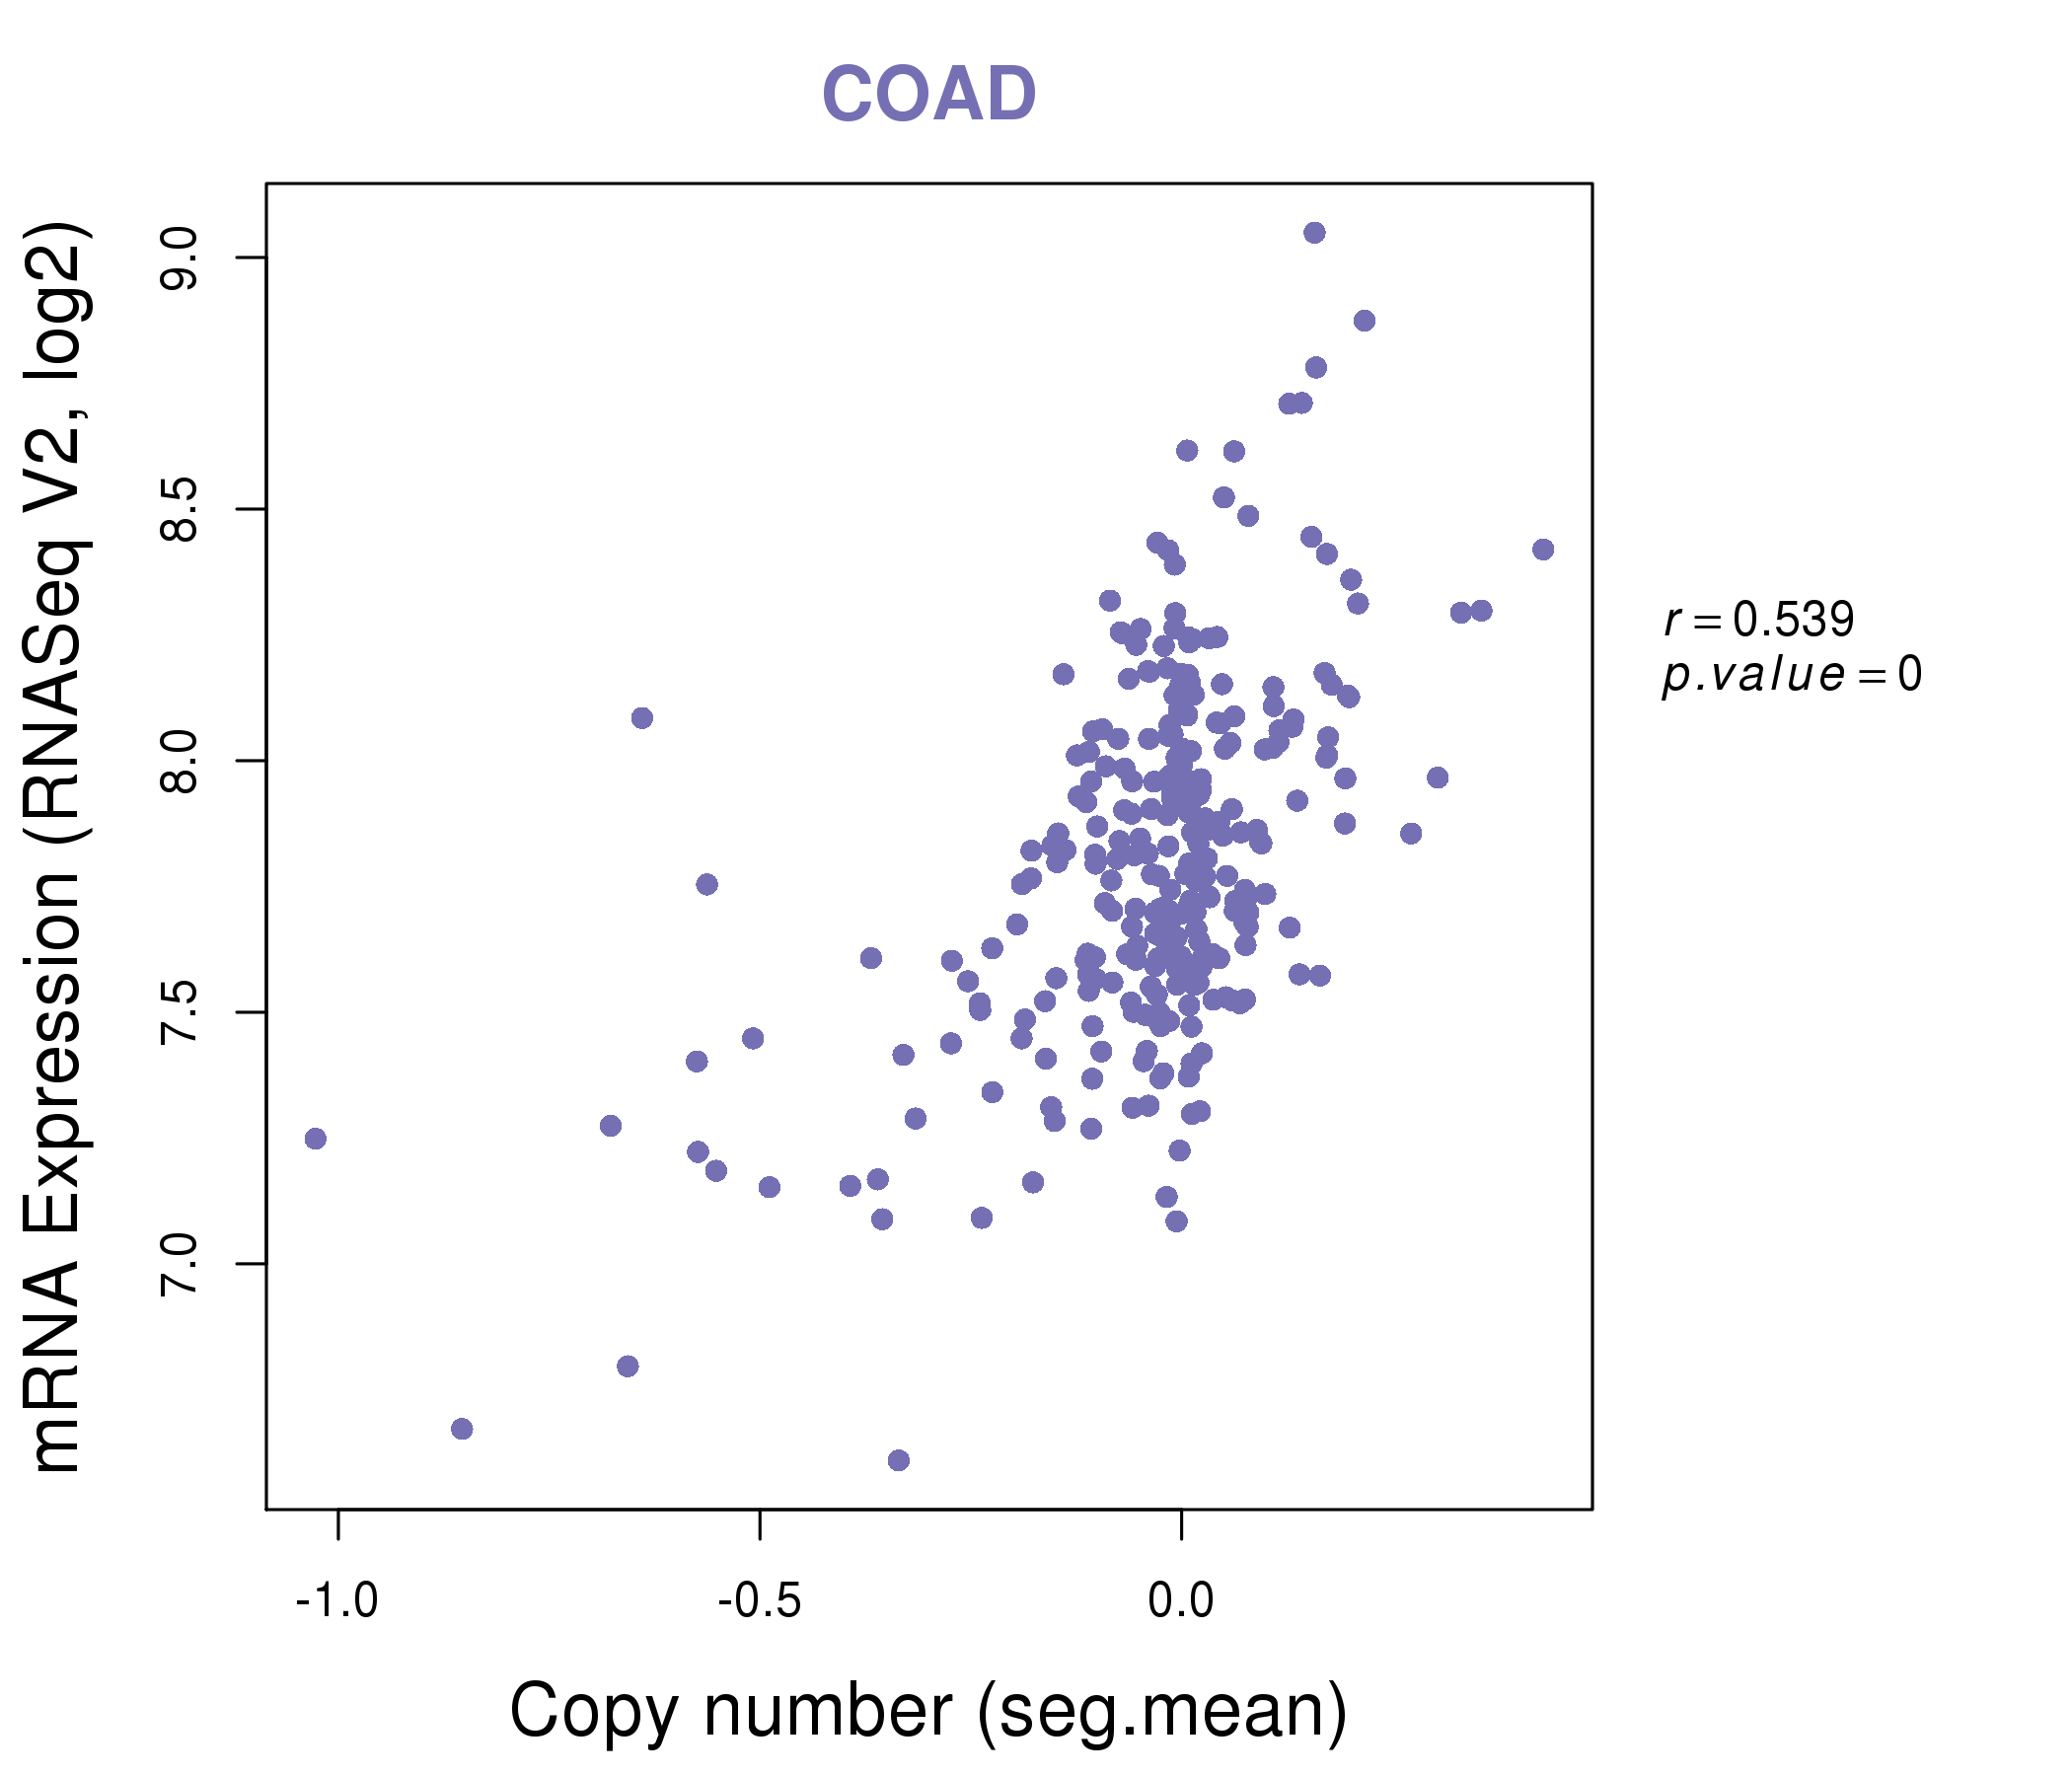
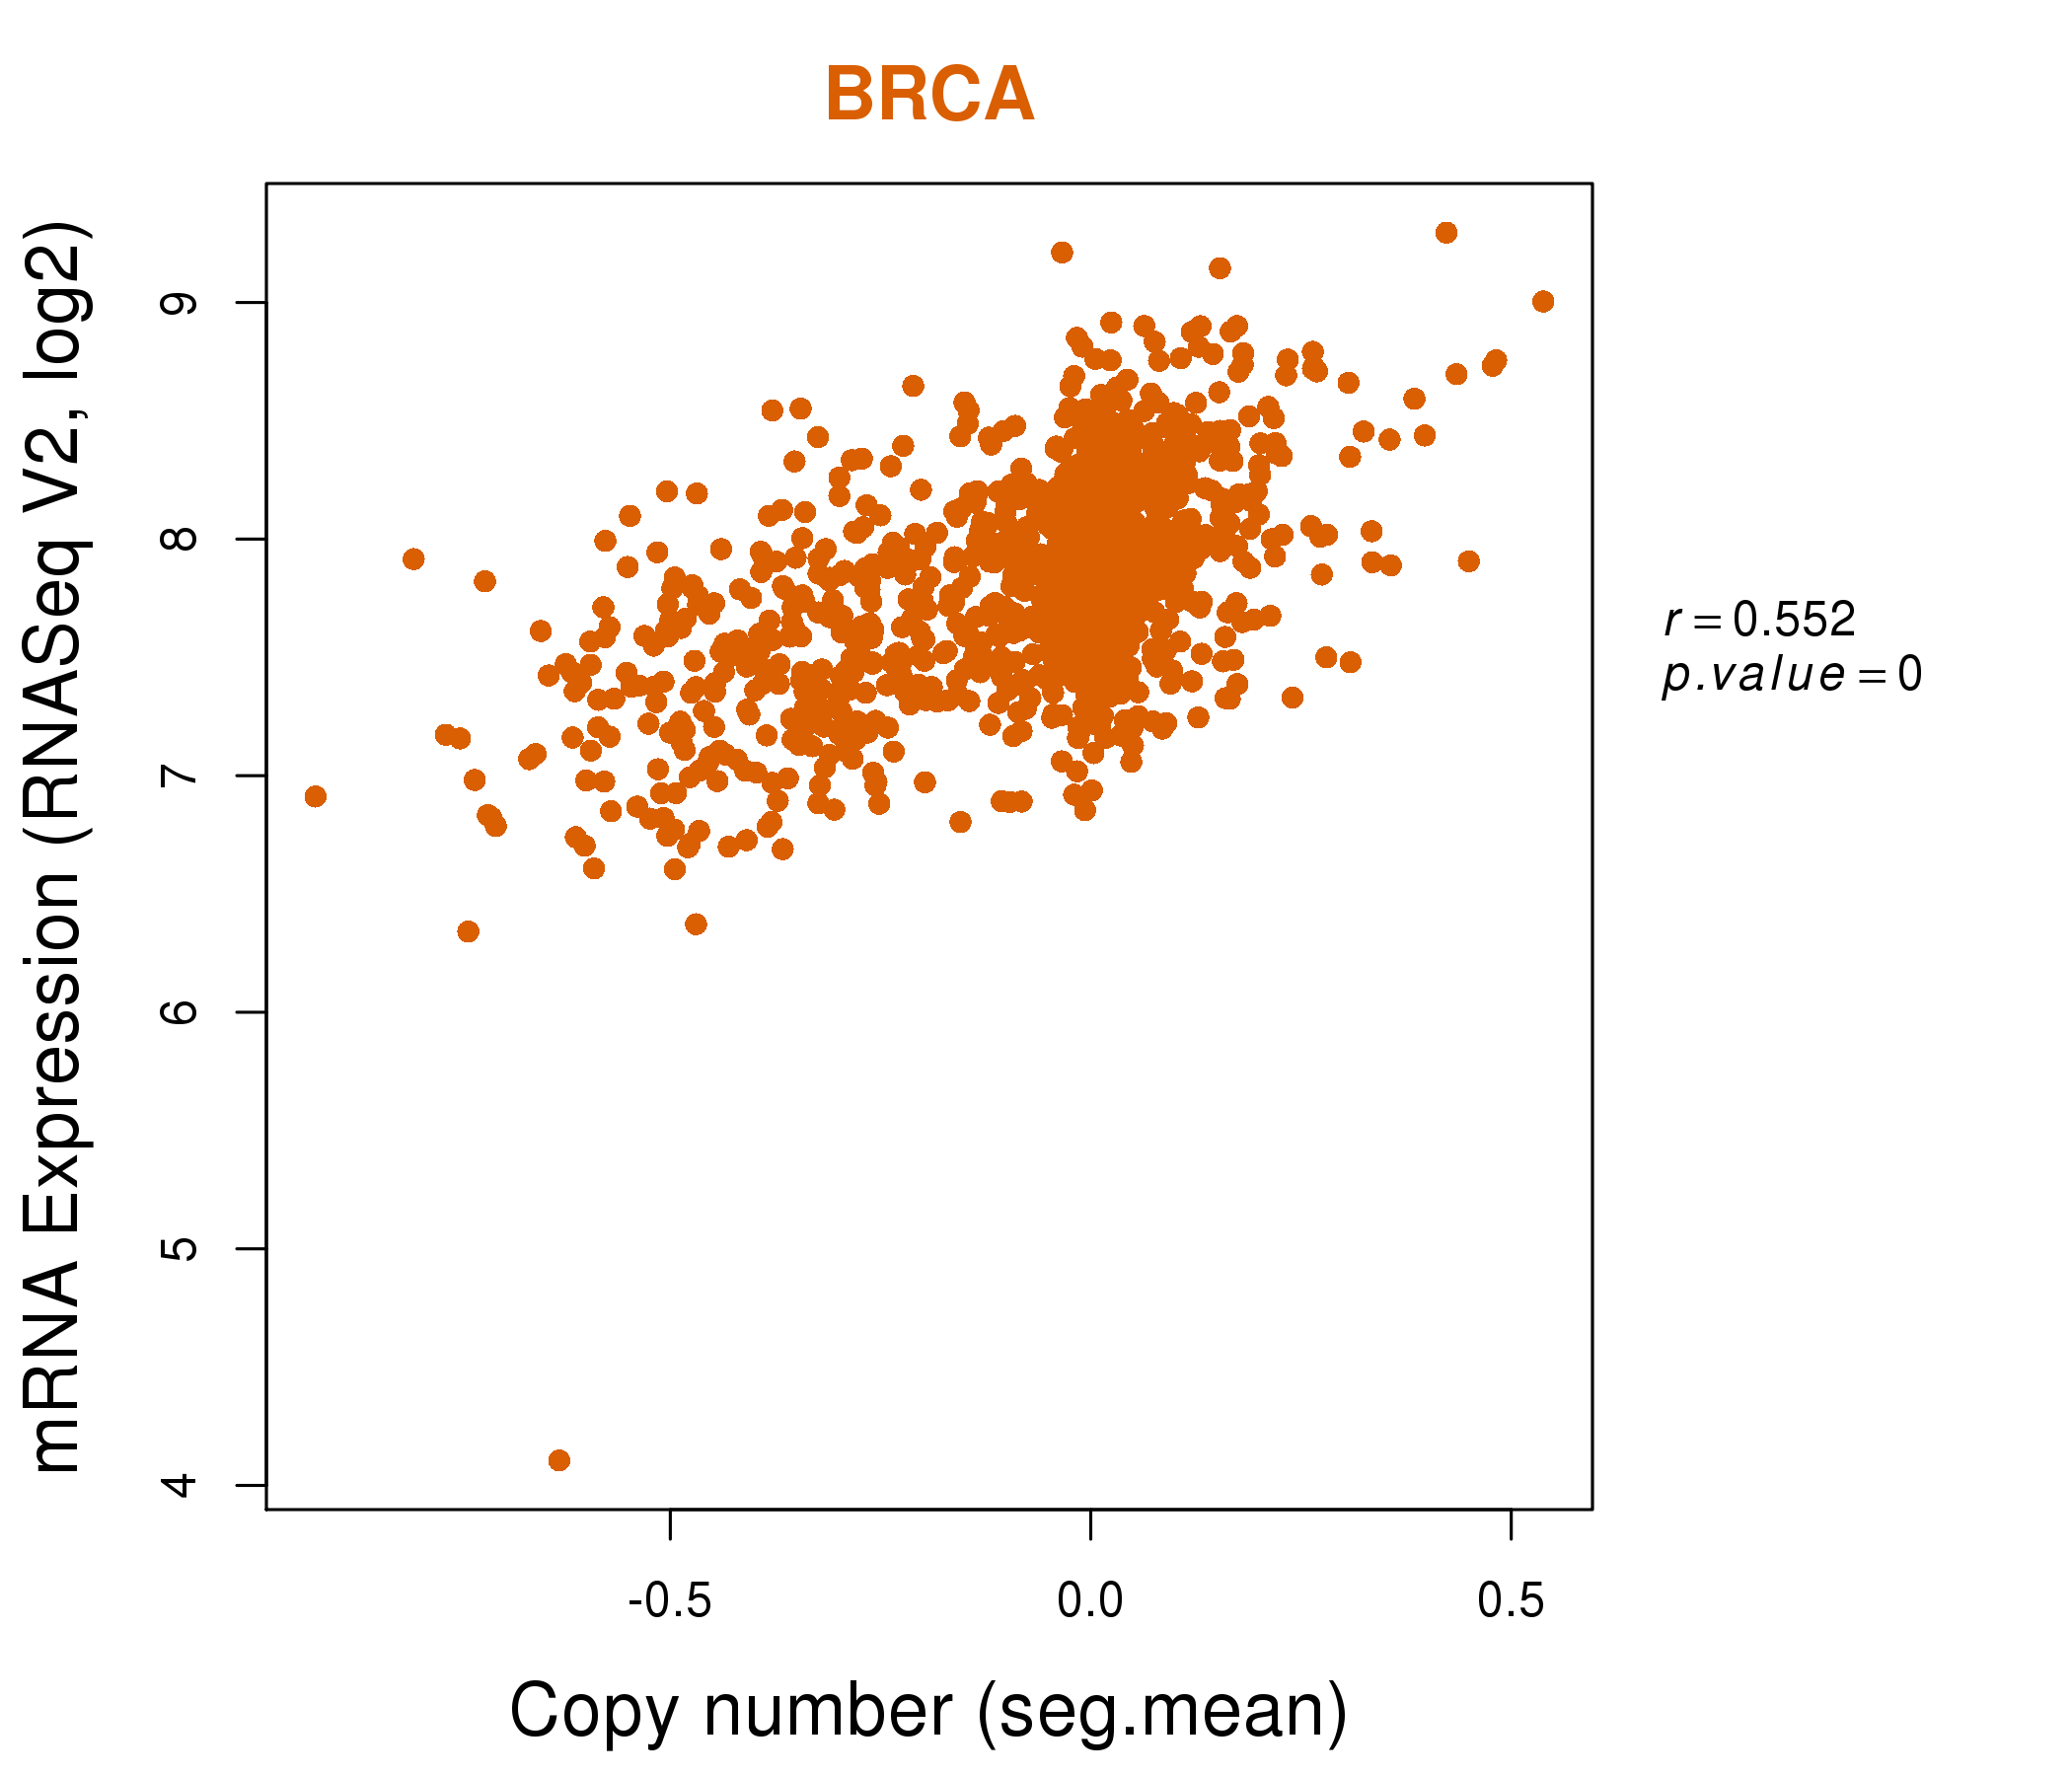
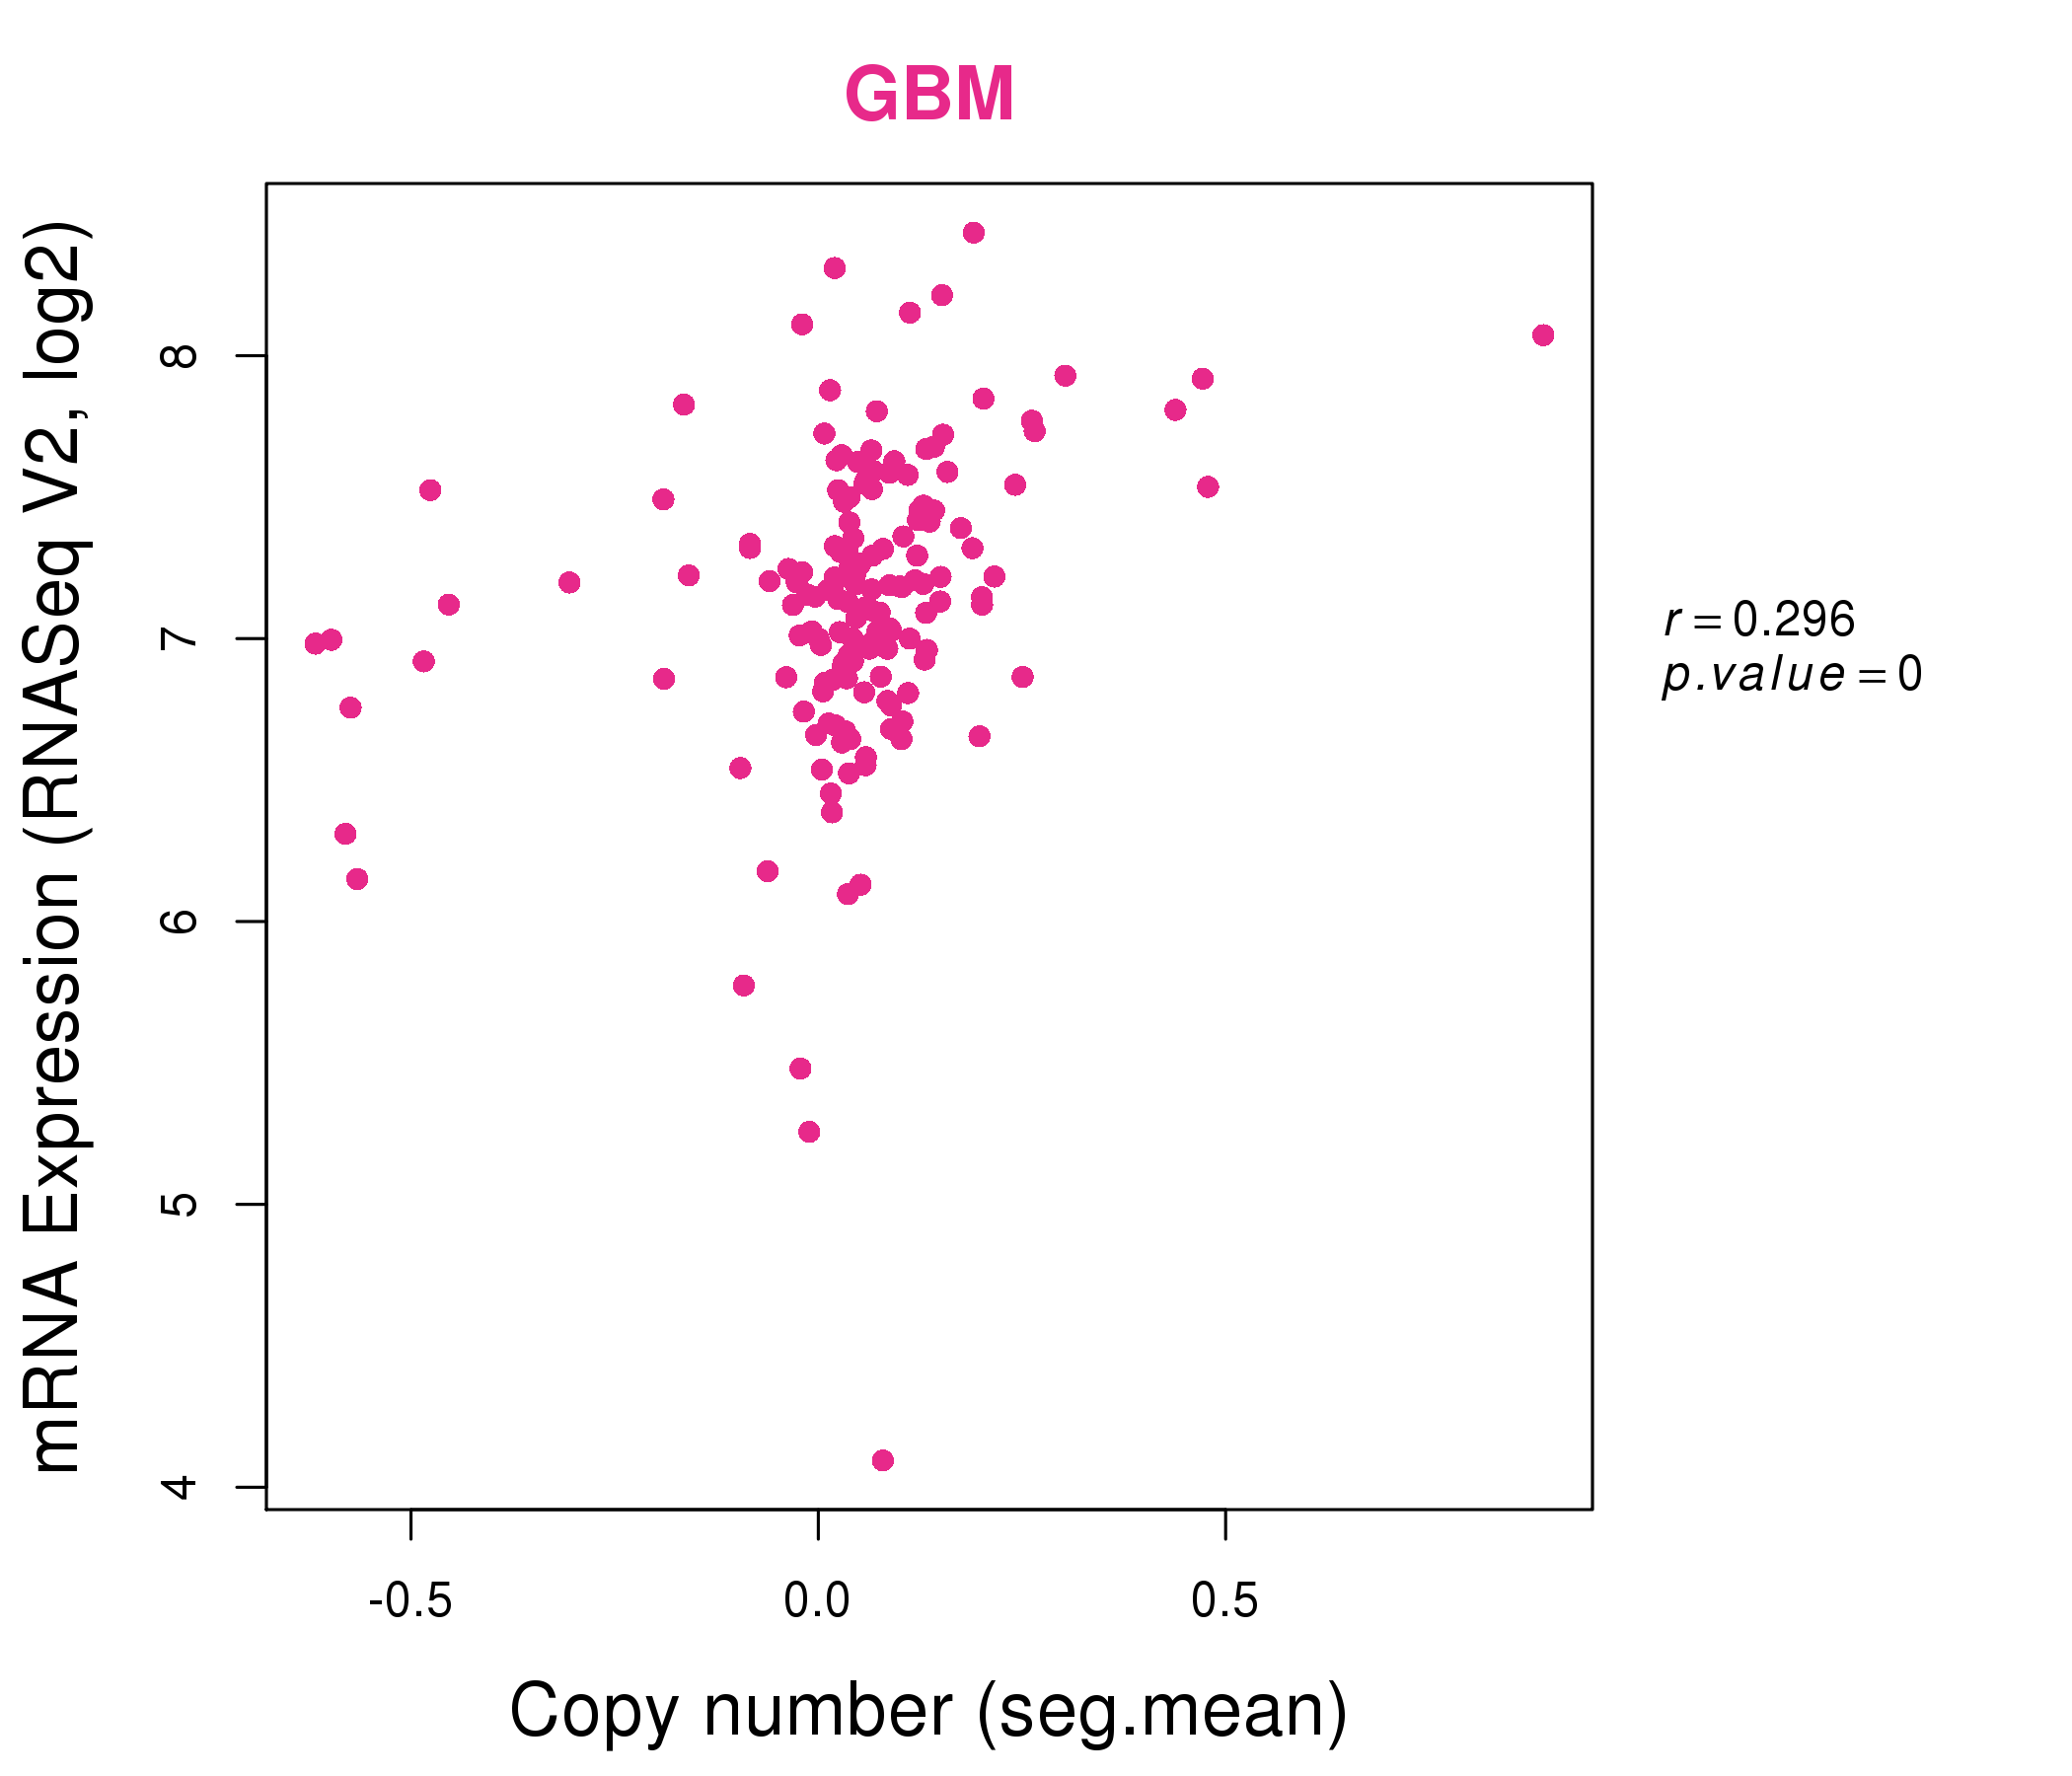
| * Normalized gene expression data of RNASeqV2 was extracted from TCGA using R package TCGA-Assembler. The URLs of all public data files on TCGA DCC data server were gathered at Jan-05-2015. Only eight cancer types have enough normal control samples for differential expression analysis. (t test, adjusted p<0.05 (using Benjamini-Hochberg FDR)) |
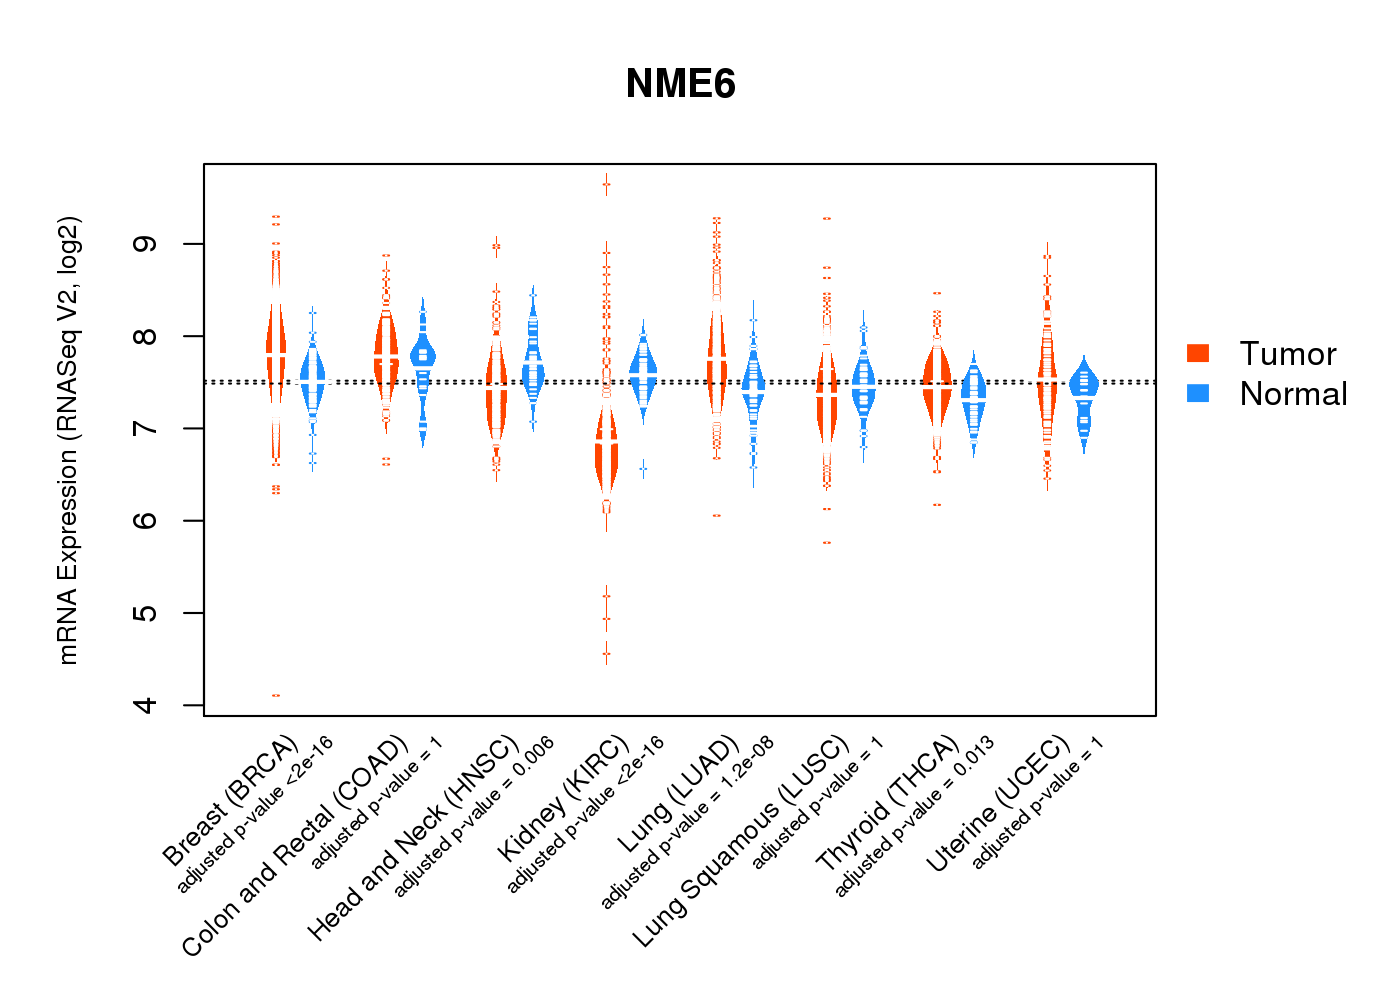 |
| Top |
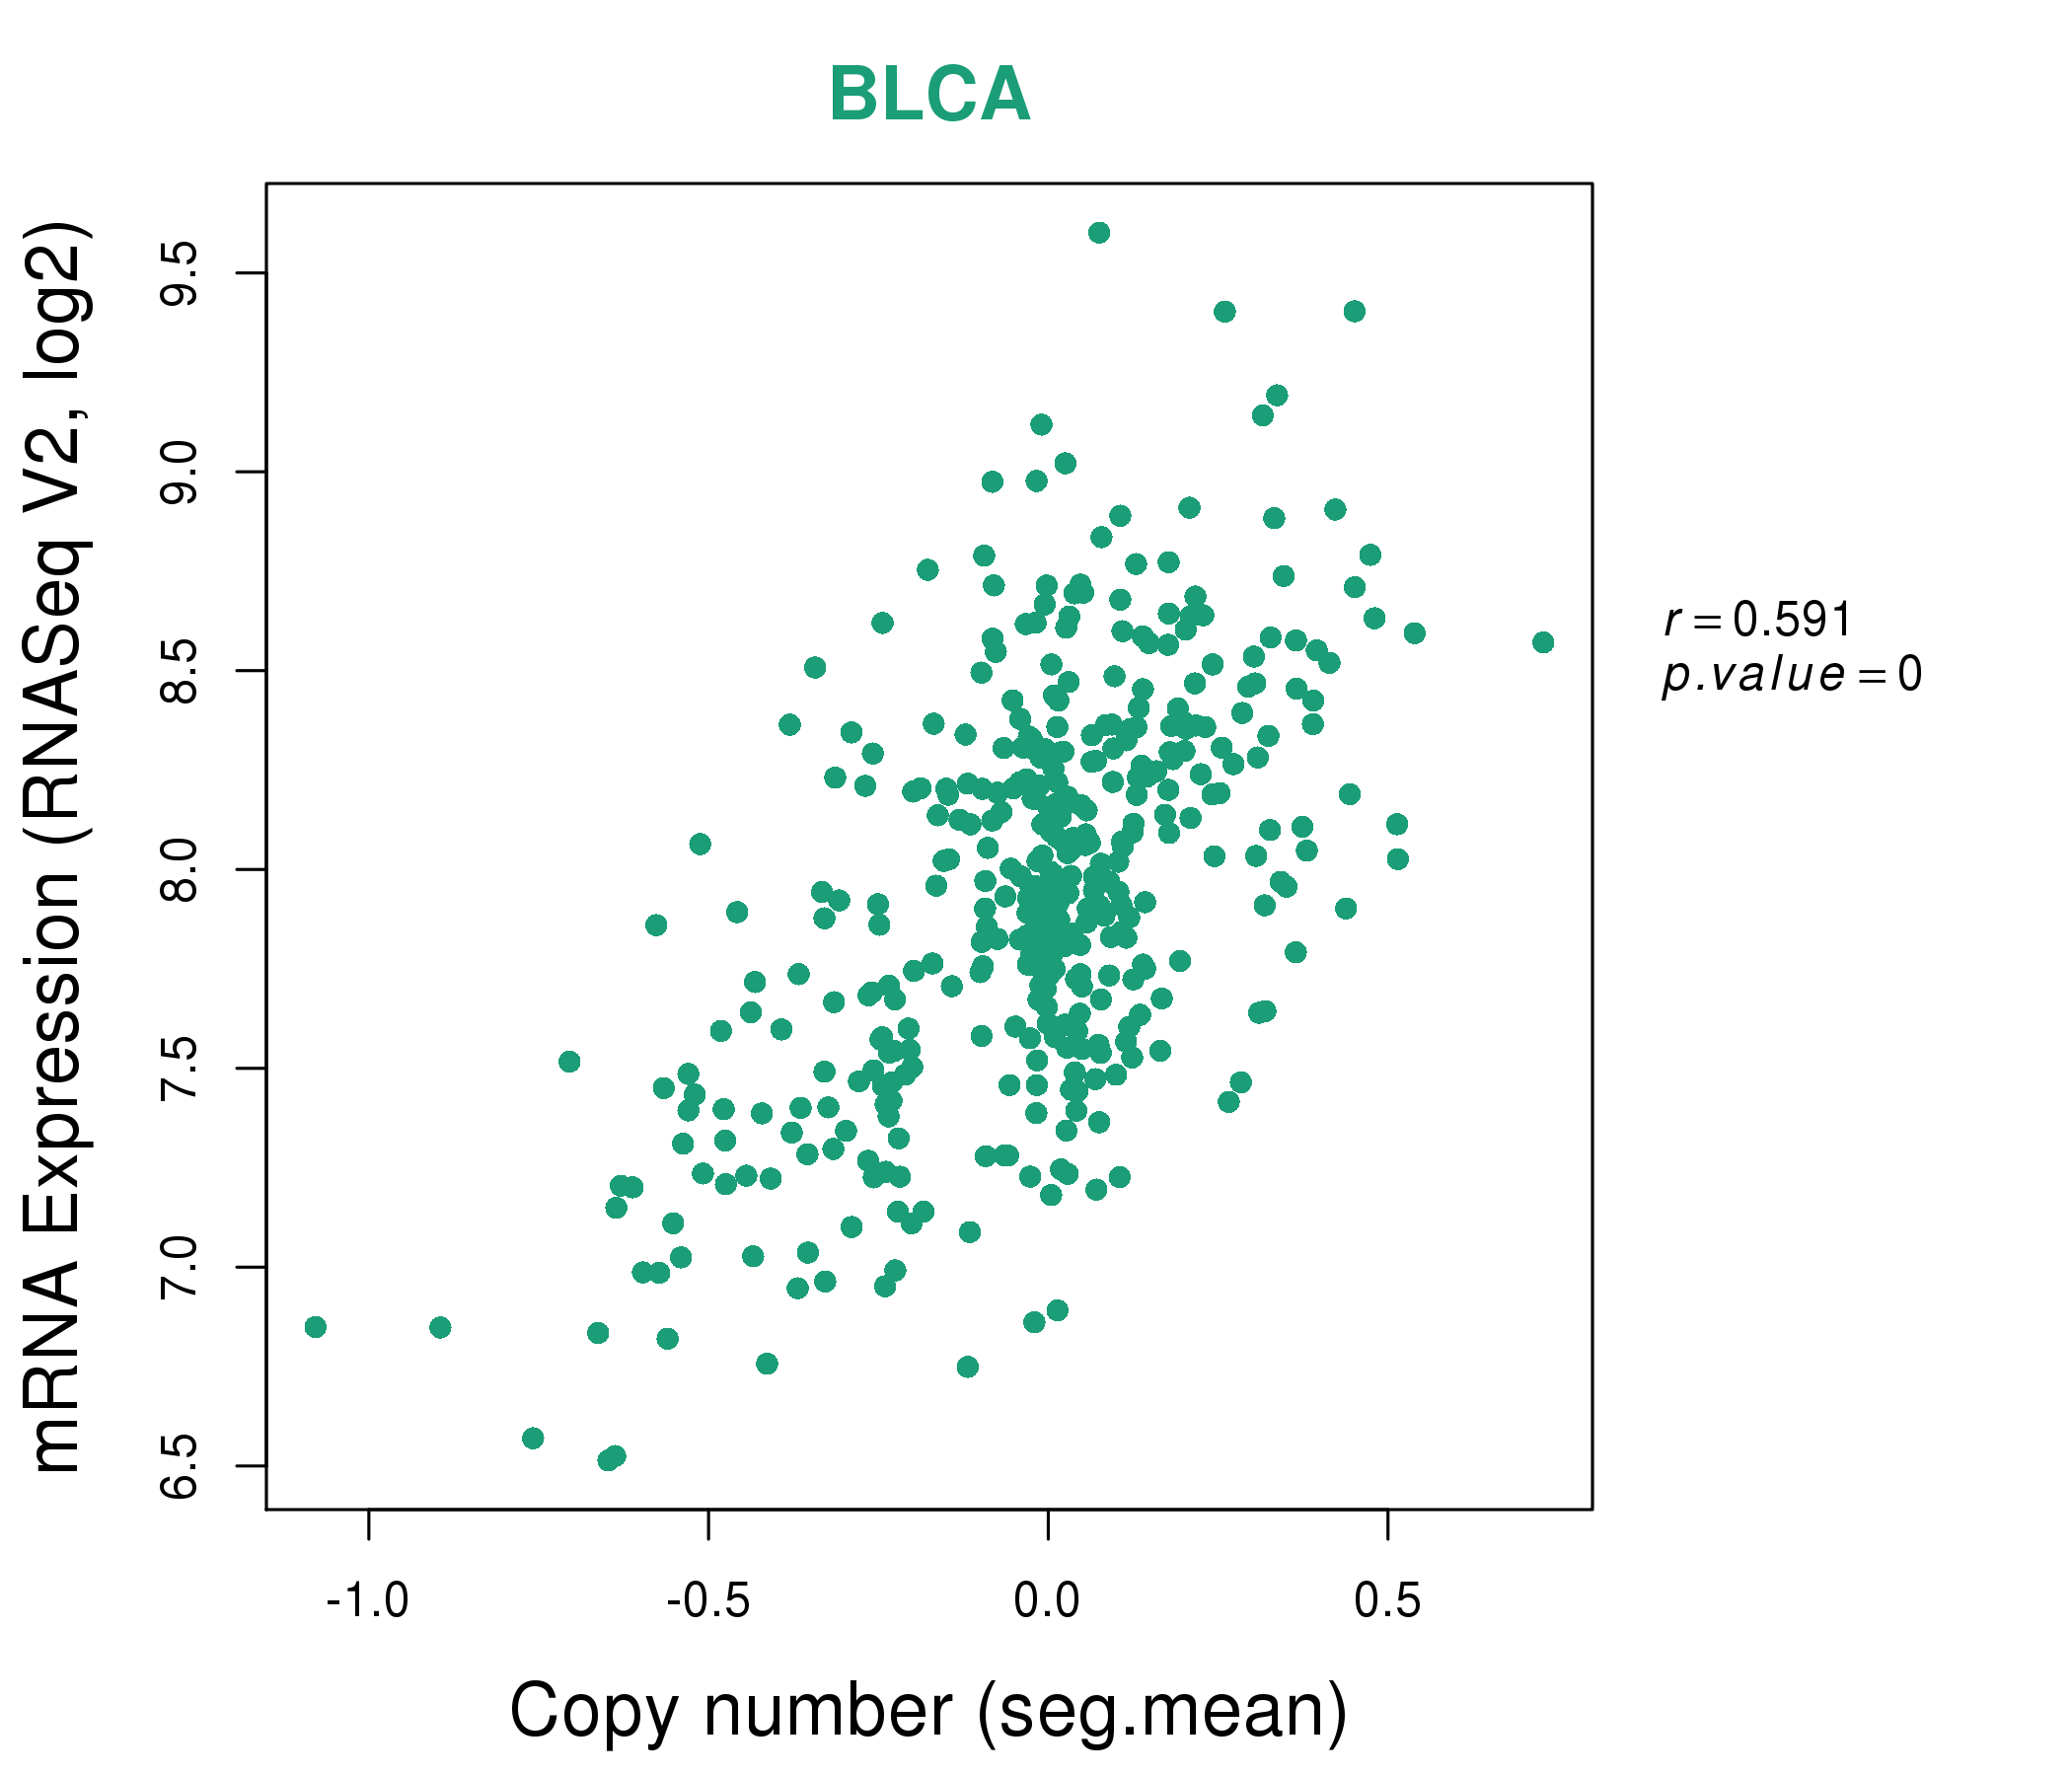
| * This plots show the correlation between CNV and gene expression. |
: Open all plots for all cancer types
 |
|
 |
|
| Top |
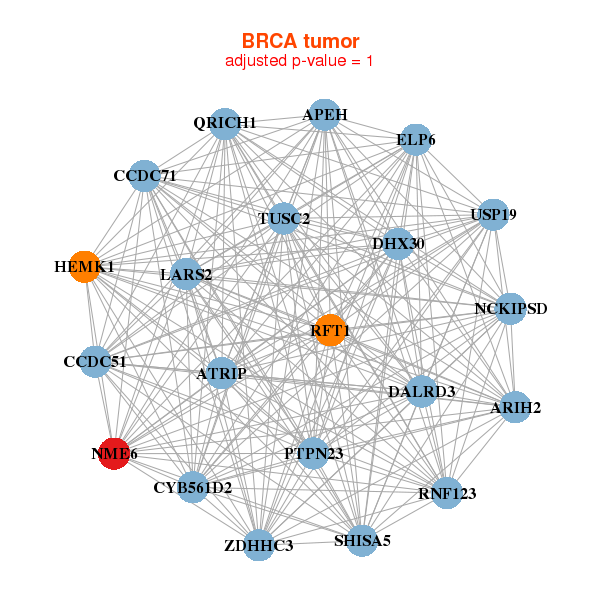
| Gene-Gene Network Information |
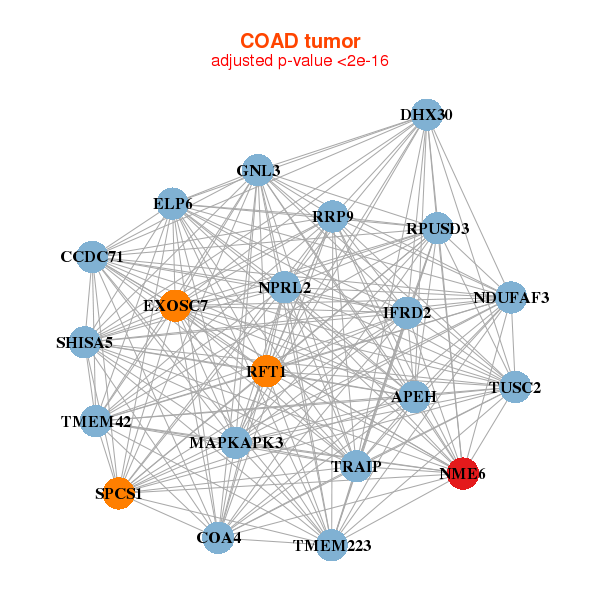
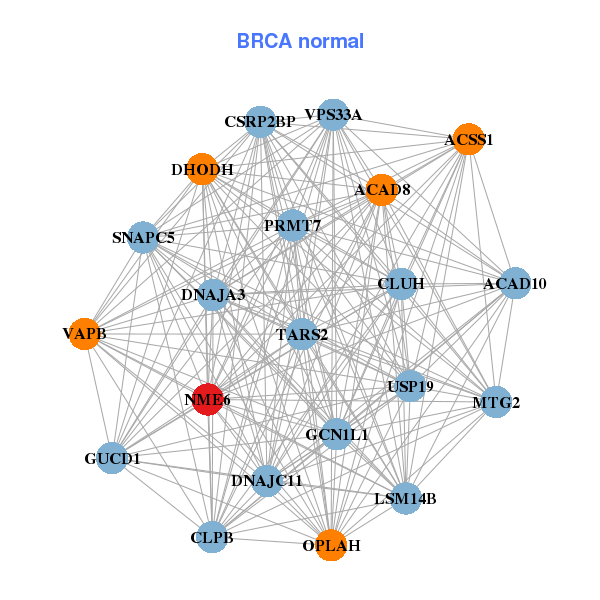
| * Co-Expression network figures were drawn using R package igraph. Only the top 20 genes with the highest correlations were shown. Red circle: input gene, orange circle: cell metabolism gene, sky circle: other gene |
: Open all plots for all cancer types
 |
|
| APEH,ARIH2,ATRIP,ELP6,CCDC51,CCDC71,CYB561D2, DALRD3,DHX30,HEMK1,LARS2,NCKIPSD,NME6,PTPN23, QRICH1,RFT1,RNF123,SHISA5,TUSC2,USP19,ZDHHC3 | ACAD10,ACAD8,ACSS1,GUCD1,CLPB,CSRP2BP,DHODH, DNAJA3,DNAJC11,GCN1L1,MTG2,CLUH,LSM14B,NME6, OPLAH,PRMT7,SNAPC5,TARS2,USP19,VAPB,VPS33A |
 |
|
| APEH,ELP6,CCDC71,COA4,DHX30,EXOSC7,GNL3, IFRD2,MAPKAPK3,NDUFAF3,NME6,NPRL2,RFT1,RPUSD3, RRP9,SHISA5,SPCS1,TMEM223,TMEM42,TRAIP,TUSC2 | ANAPC11,ASNA1,ELP6,EXOSC1,FAM58A,GPS1,MCRS1, NTMT1,MRPS26,NAA10,NCAPH2,NDUFA7,NME6,NUBP2, PSMD8,PUF60,RPS19BP1,SF3B5,URM1,YIF1A,ZNF511 |
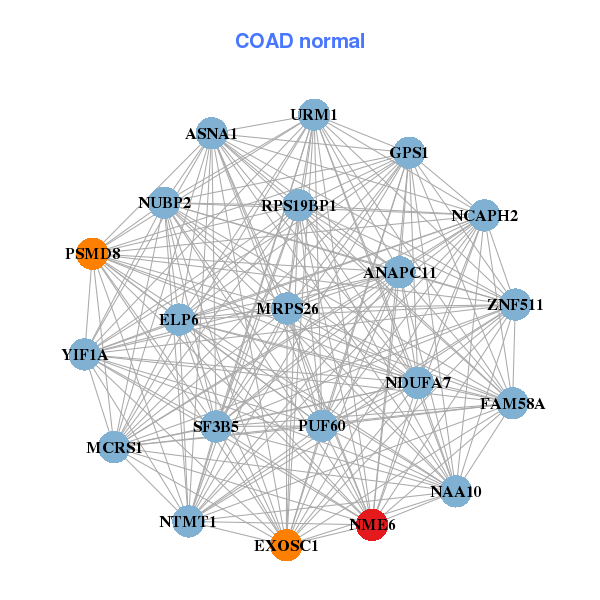
| * Co-Expression network figures were drawn using R package igraph. Only the top 20 genes with the highest correlations were shown. Red circle: input gene, orange circle: cell metabolism gene, sky circle: other gene |
: Open all plots for all cancer types
| Top |
: Open all interacting genes' information including KEGG pathway for all interacting genes from DAVID
| Top |
| Pharmacological Information for NME6 |
| There's no related Drug. |
| Top |
| Cross referenced IDs for NME6 |
| * We obtained these cross-references from Uniprot database. It covers 150 different DBs, 18 categories. http://www.uniprot.org/help/cross_references_section |
: Open all cross reference information
|
Copyright © 2016-Present - The Univsersity of Texas Health Science Center at Houston @ |