|
Cancer Cell Metabolism Gene DB |
|
|
|
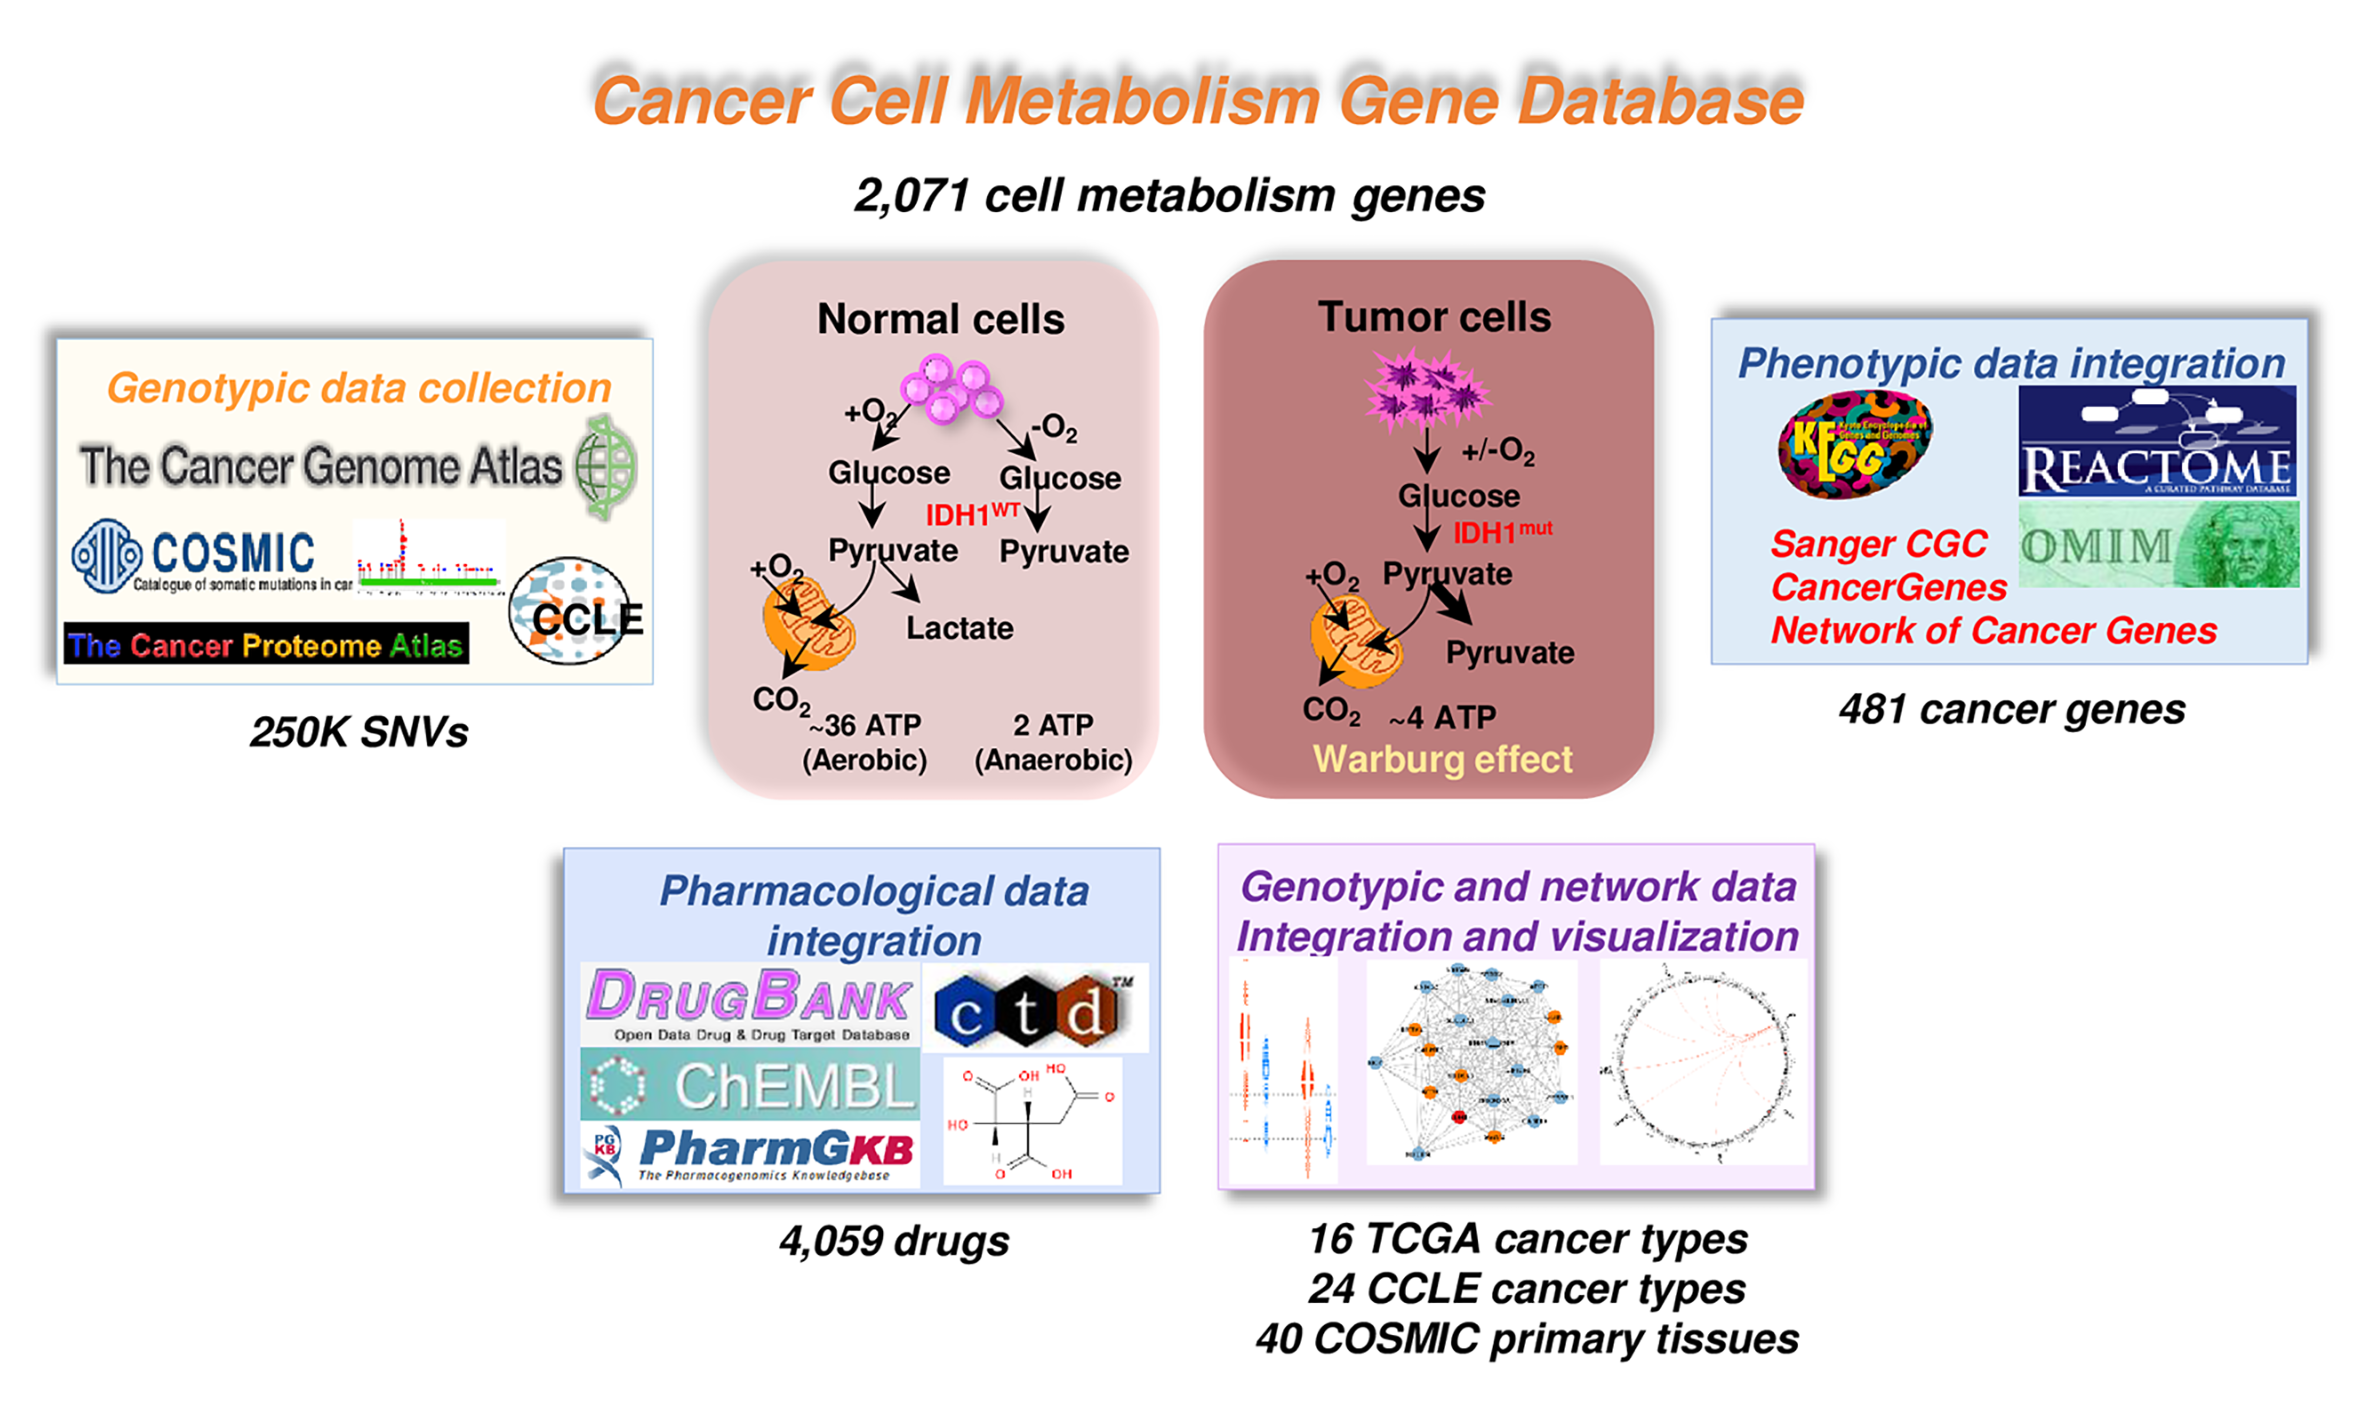
1. Data collection of ccmGDB database
|
|
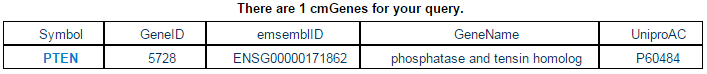
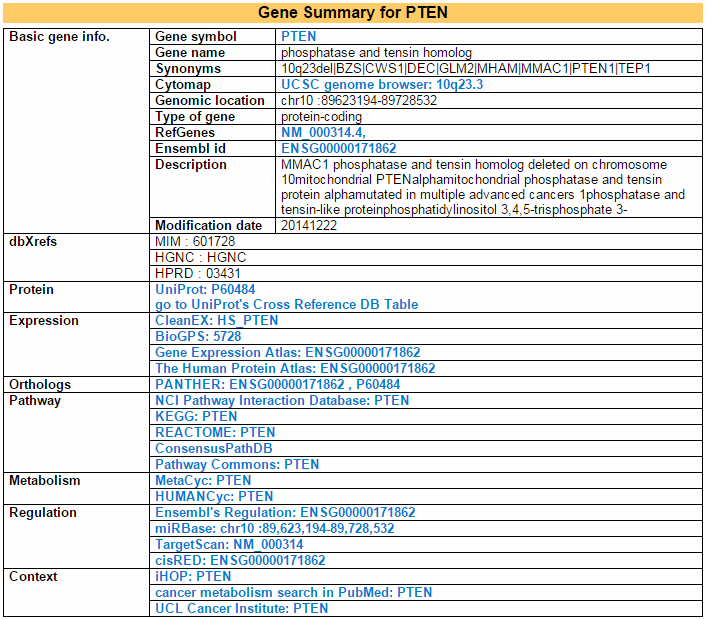
2. Understanding of ccmGDB's annotation category search page, example: PTEN
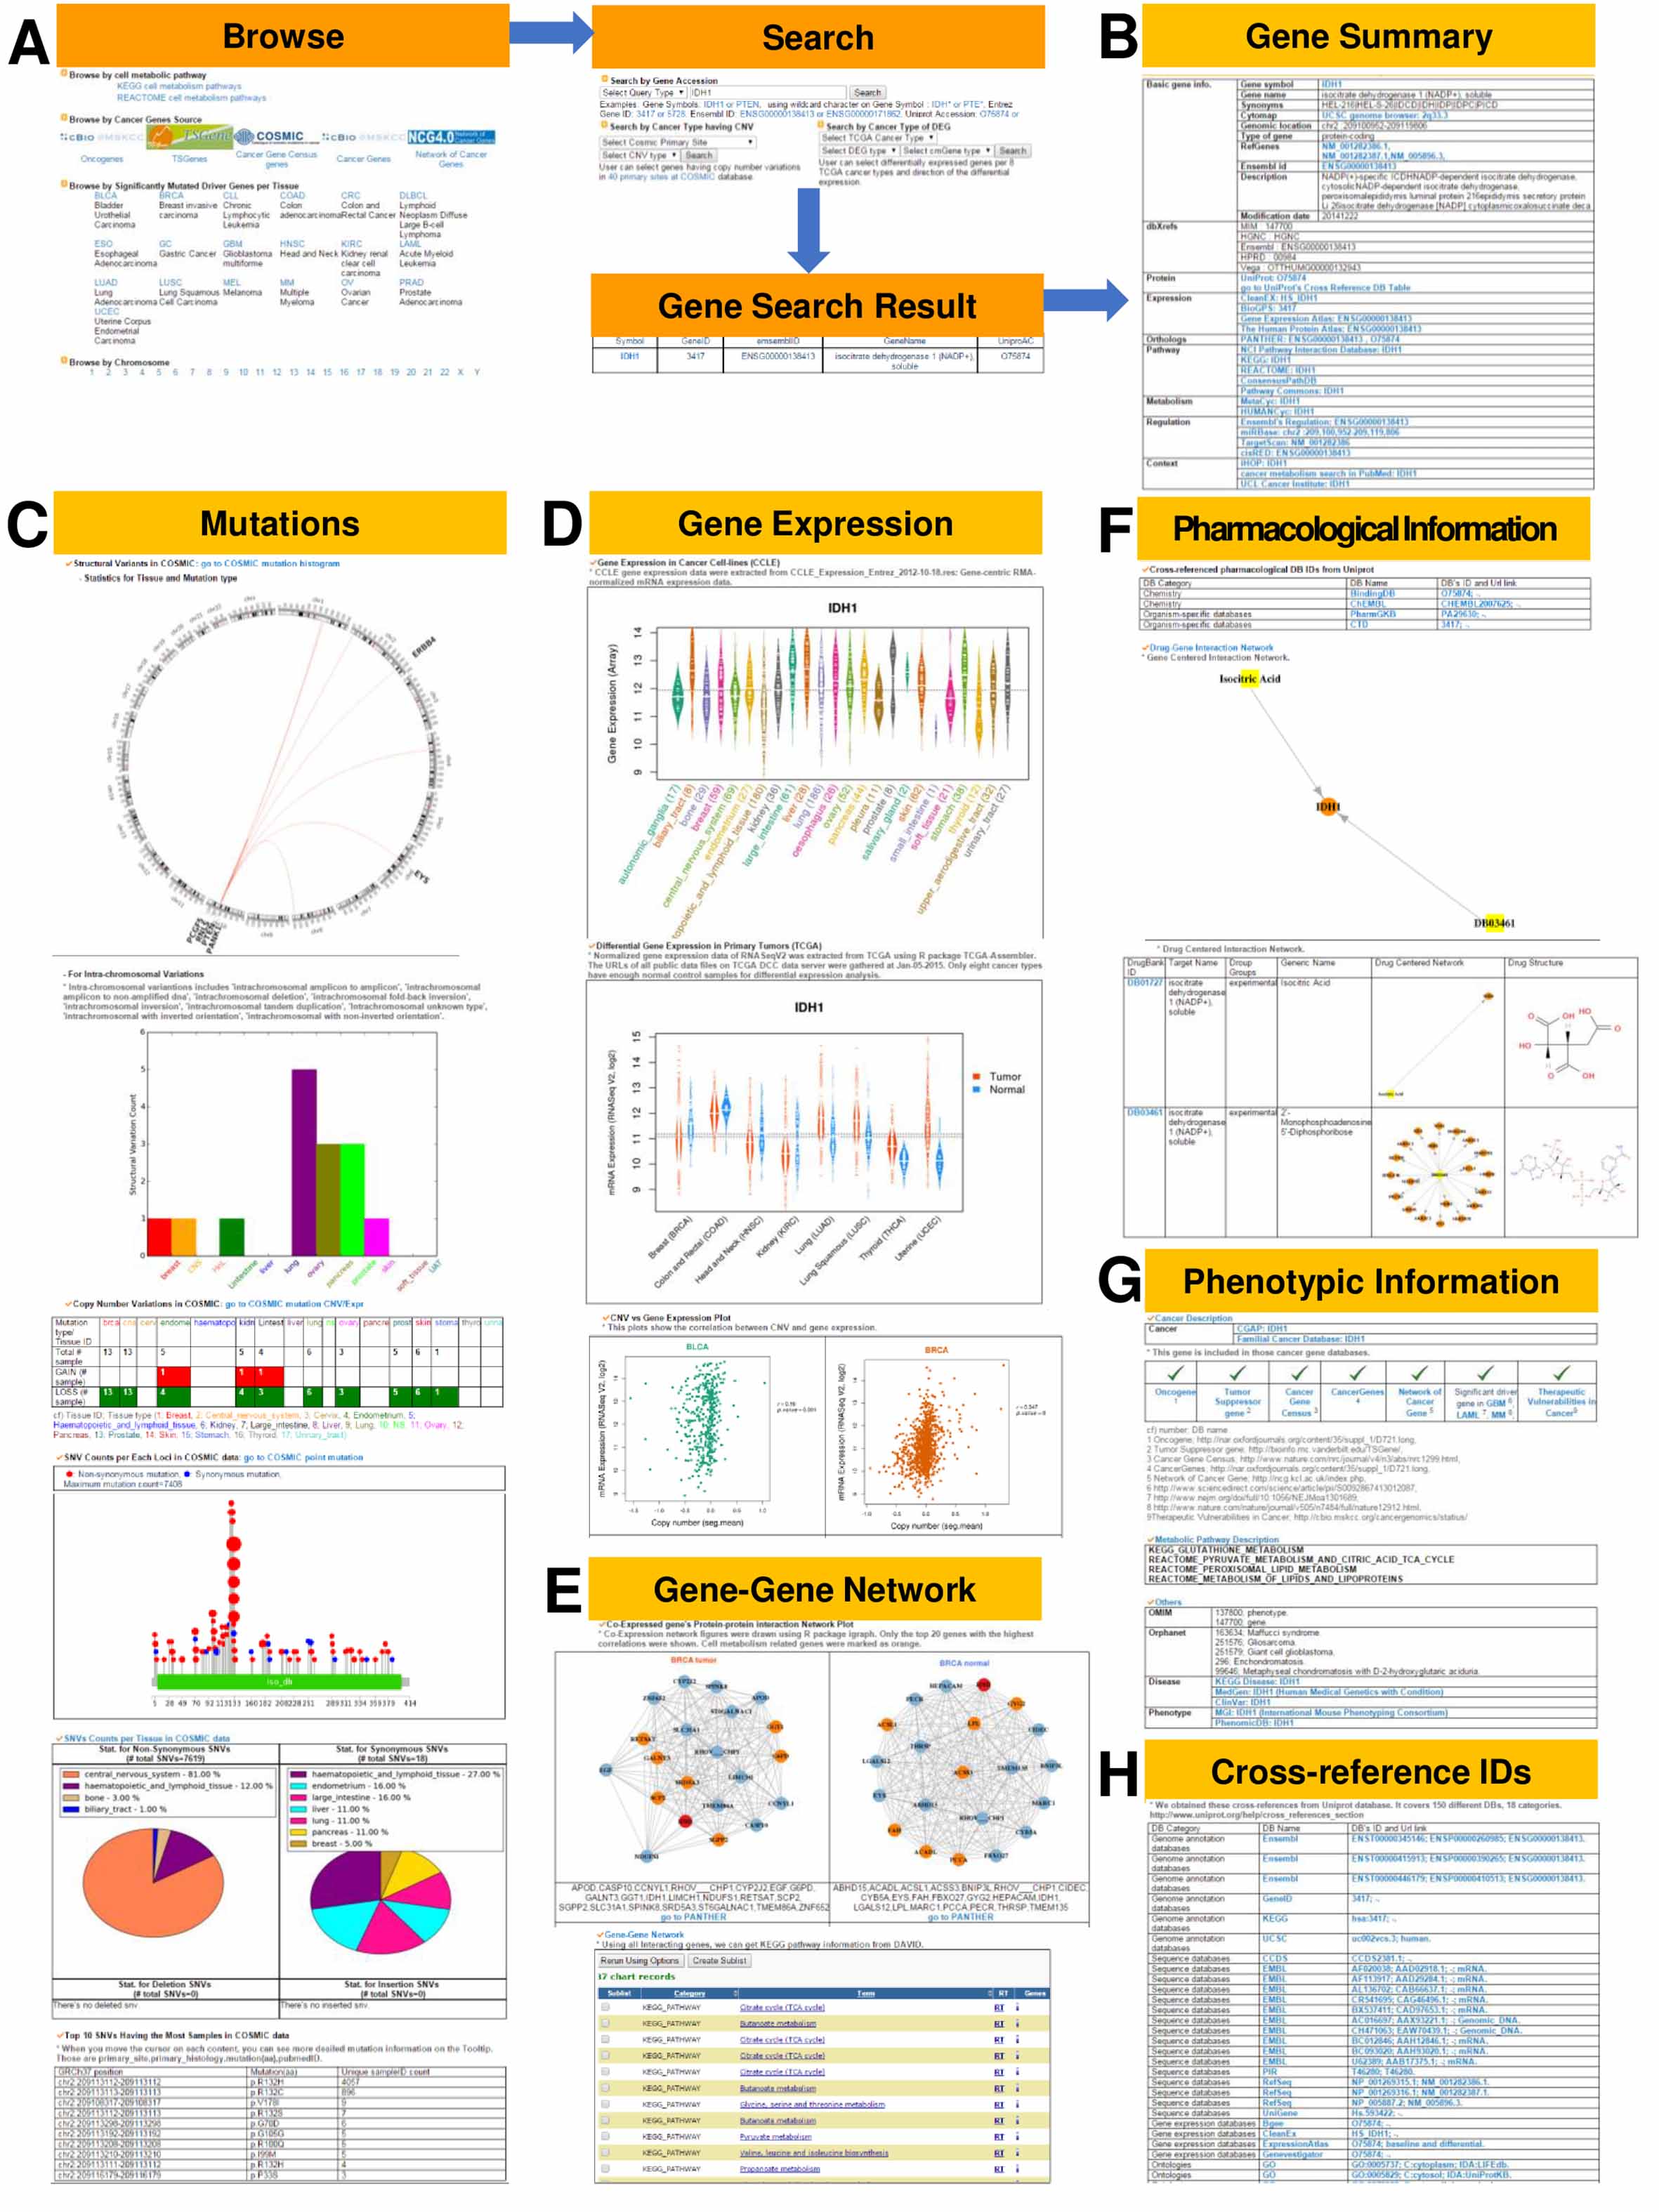
This category shows the gene's overall information from basic information such as symbol, alias, and locations to expression, pathway, regulation, and context. Blue letters are linked to each the respective database.
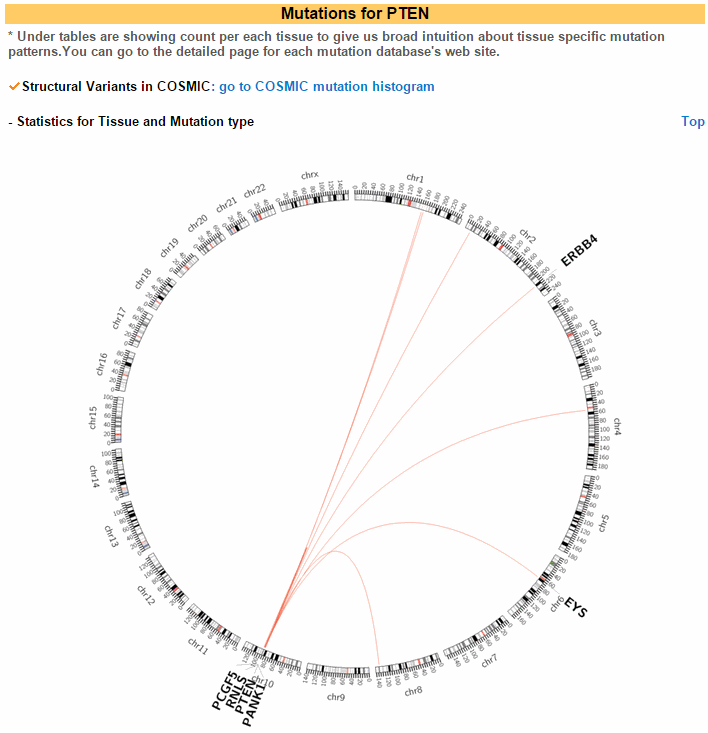
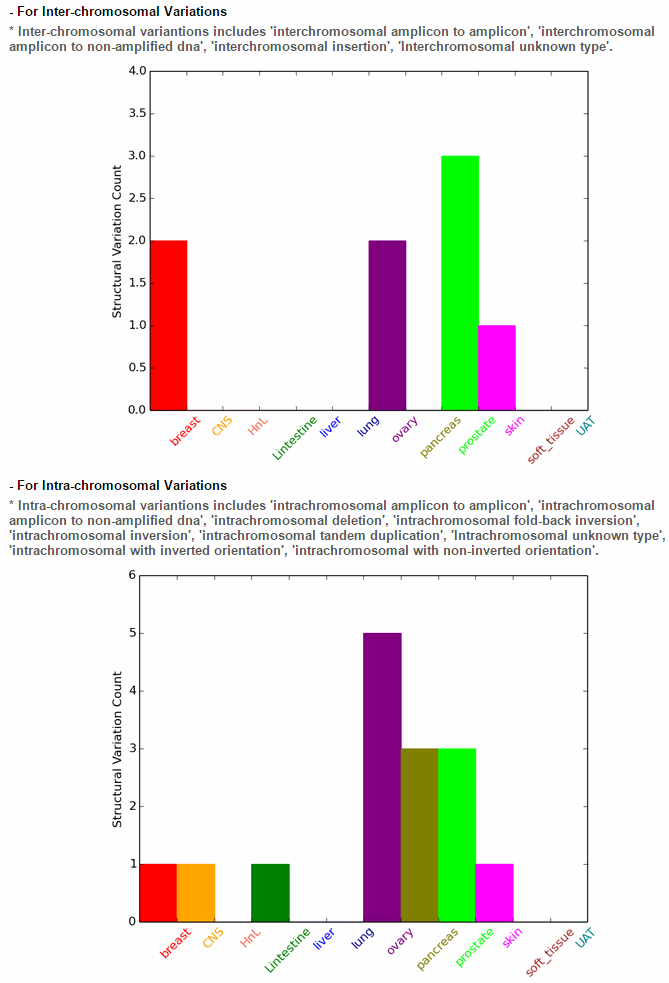
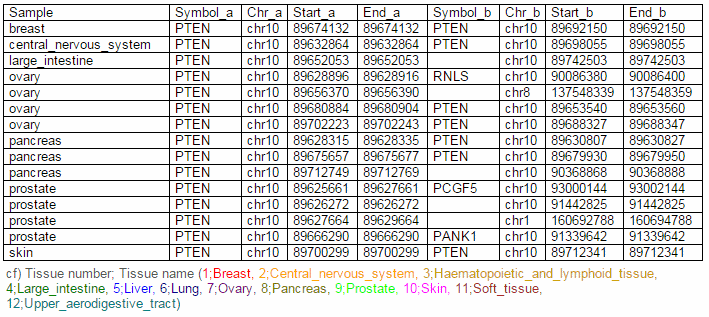
ccmGDB offers various mutation annotations. The first image shows the structural variations in a circos plot. This is for chromosomal rearrangement variations. ccmGDB shows inter-chromosomal rearrangements and intra-chromosomal rearrangements seperately. For PTEN gene, in prostate cancer type, inter-chromosomal variations is high. However, for the intra-chromosomal variations, ovary cancer type is high.
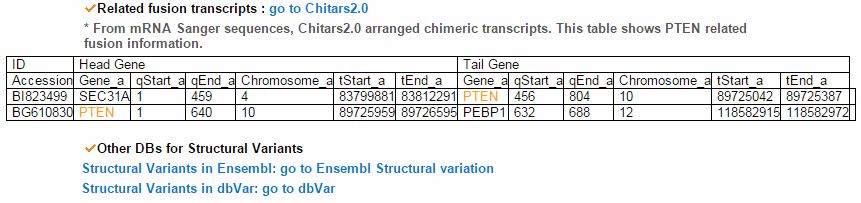
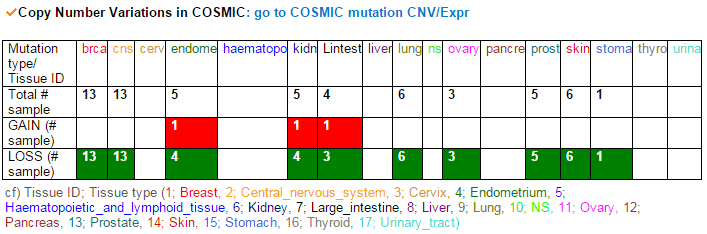
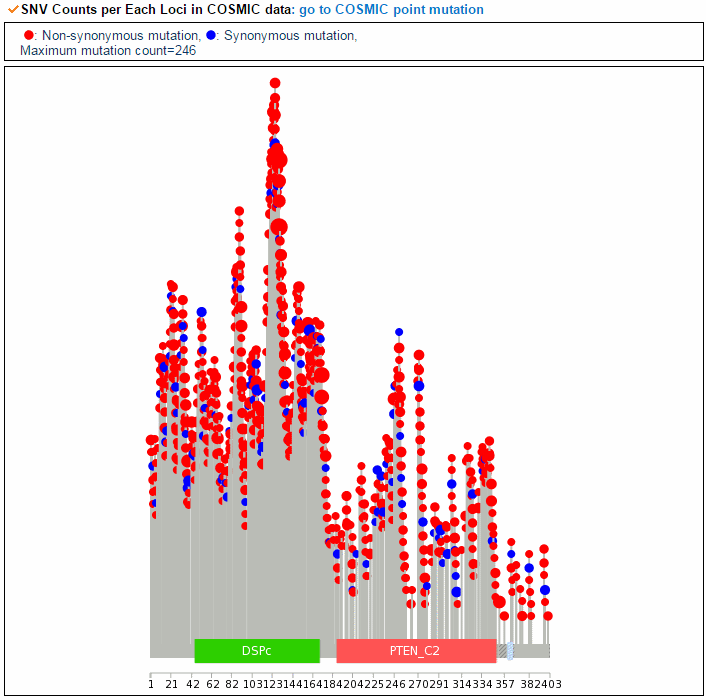
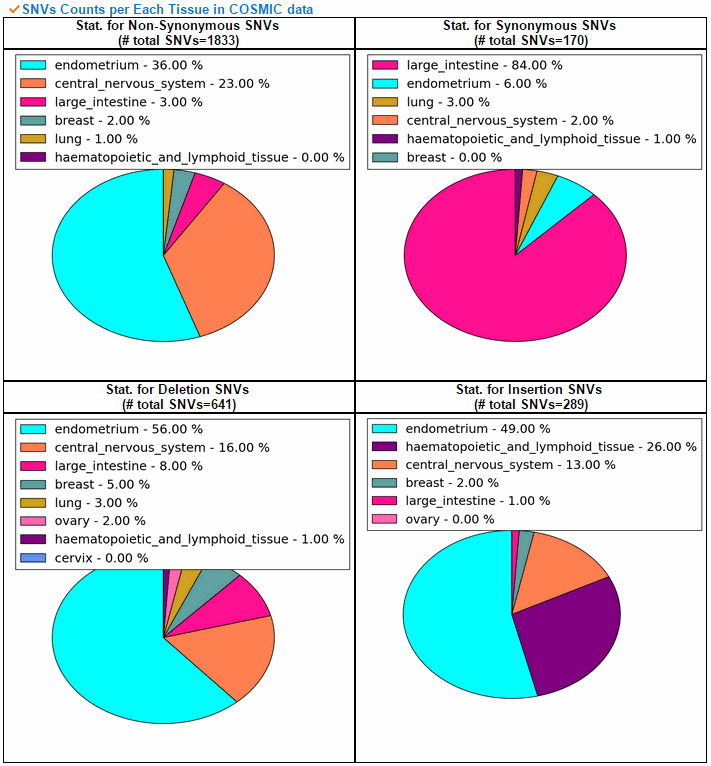
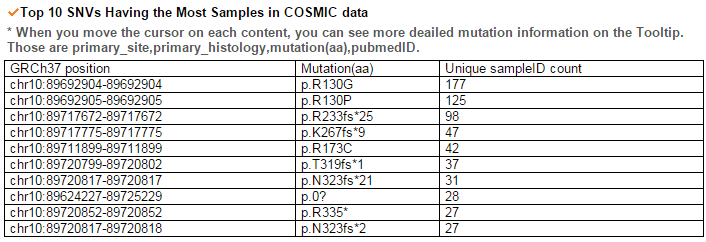
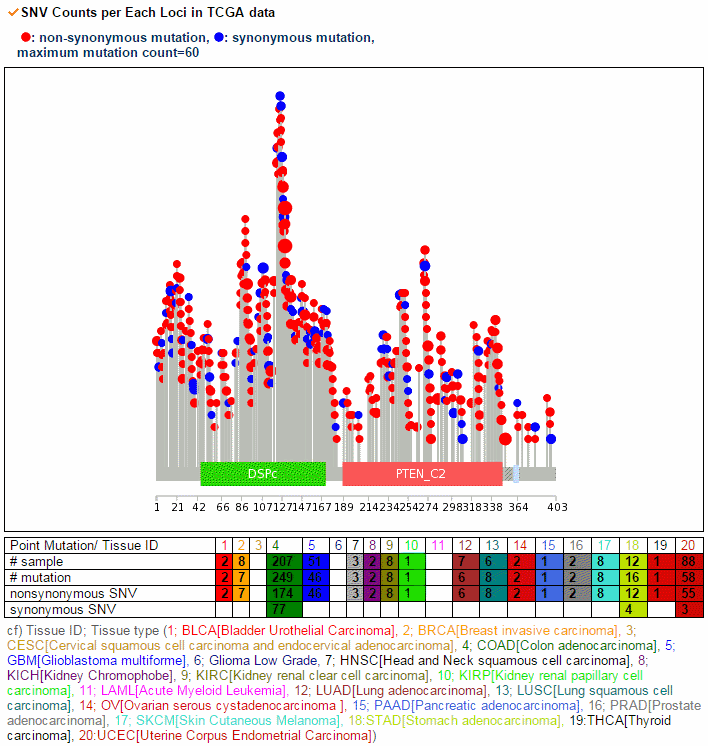
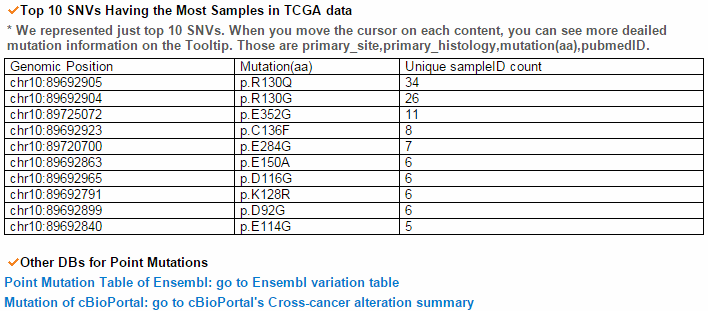
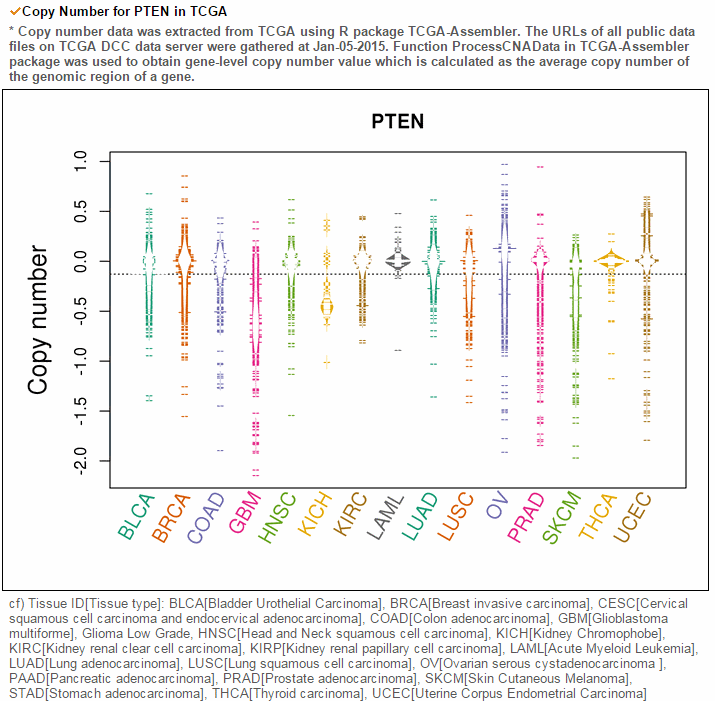
From the ChiTars2.0's human 1,400 break point information, ccmGDB shows the chimeric transcripts including PTEN as shown below. We also supply links for structural variants of other databases. From COSMIC's CNV data, ccmGDB shows the GAIN (red) or LOSS (green) information per each tissue. From COSMIC SNV data, ccmGDB shows the lollipop plot for PTEN with the non-synonymous (red circles) and synonymous (blue circles) mutations. Circle size indicateds mutaiton counts for that loci such that a larger circle indicates more mutation counts. These piecharts show the SNV ratio per tissue and mutation type of COSMIC data. This table shows the top 10 SNVs for PTEN. Sorting is based on number of recurrent samples. This lollipop image is for SNV data from TCGA. This table shows the top 10 SNVs for TCGA data. And ccmGDB offers other database links. This copy number plot shows the differential copy number for 15 TCGA cancer types.
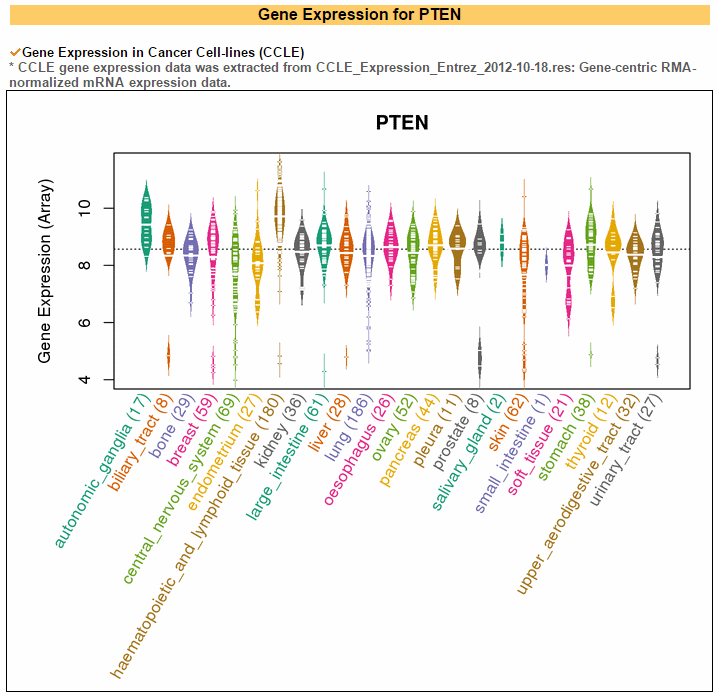
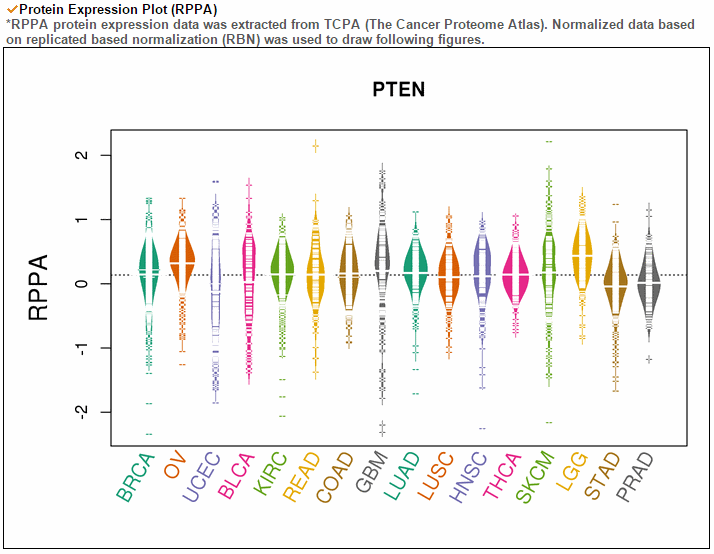
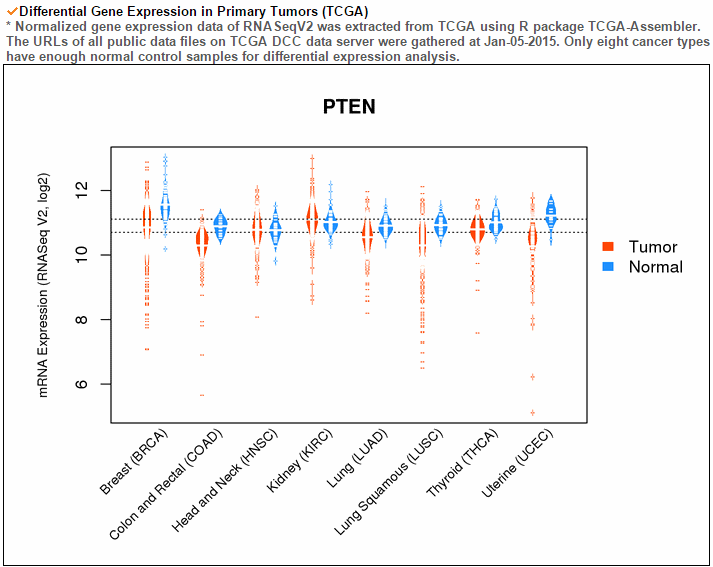
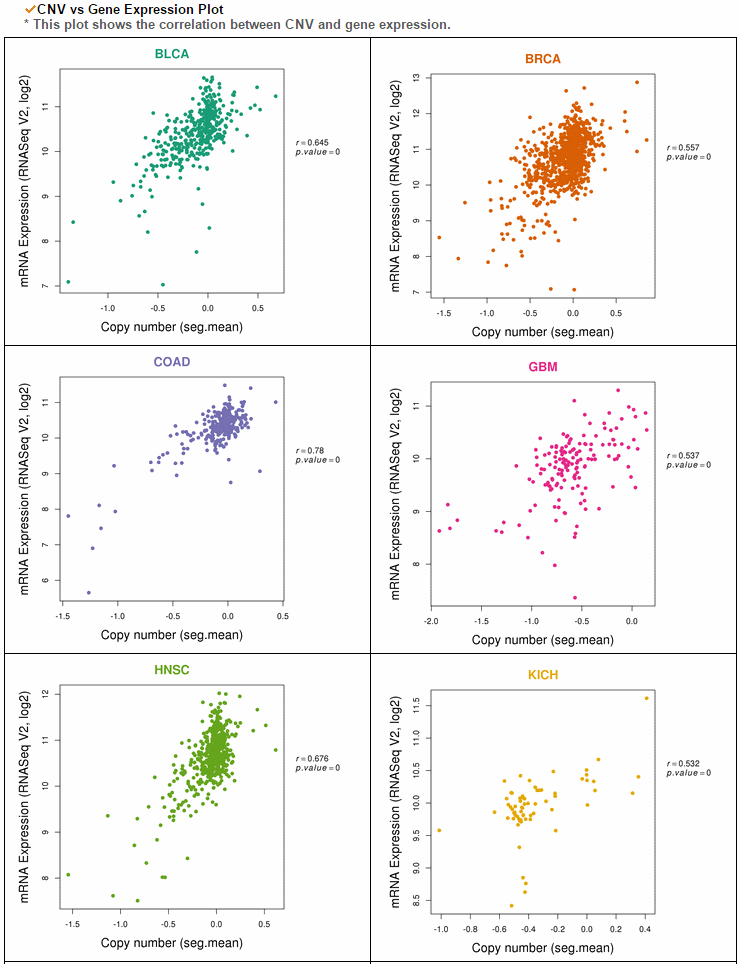
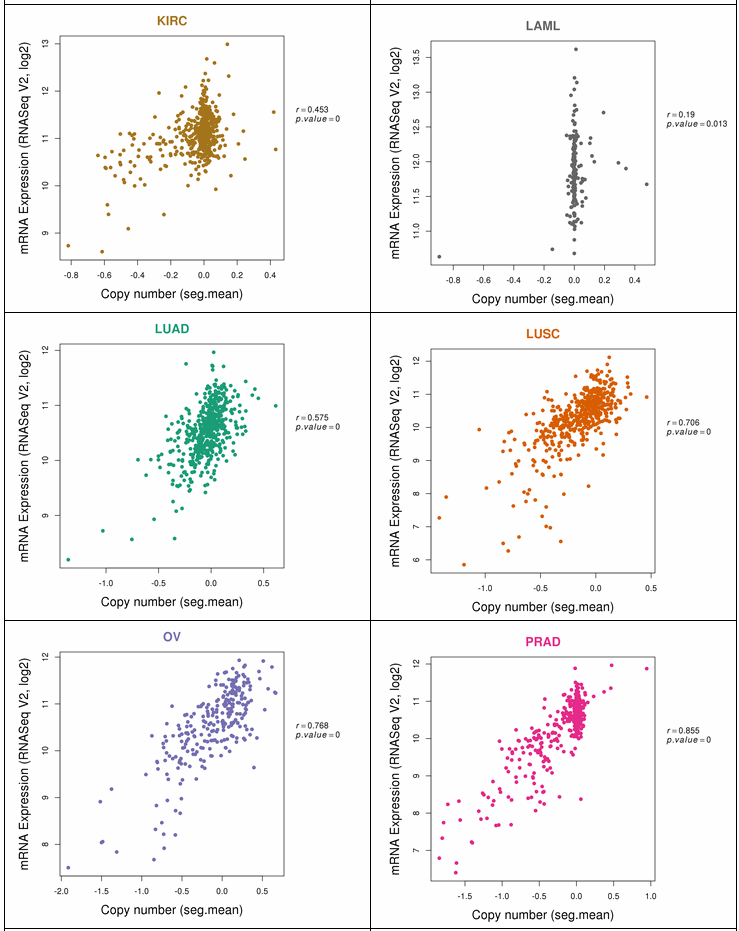
The gene expression category covers various expression from 3 different databases. The image below shows gene expression for 20 CCLE cancer types. ccmGDB provides protein expression plots. Only 24 genes were included among over 2,00 cmGenes. From 8 TCGA cancer types' RNA-seq expression values, ccmGDB provide differential gene expression between tumor and matched normal samples. From 15 TCGA cancer types, we drew the correlation plots between CNV and gene expression. In the LAML cancer type, there's no copy number variation. However, in the LUSC cancer type, we can see the positive correlation.
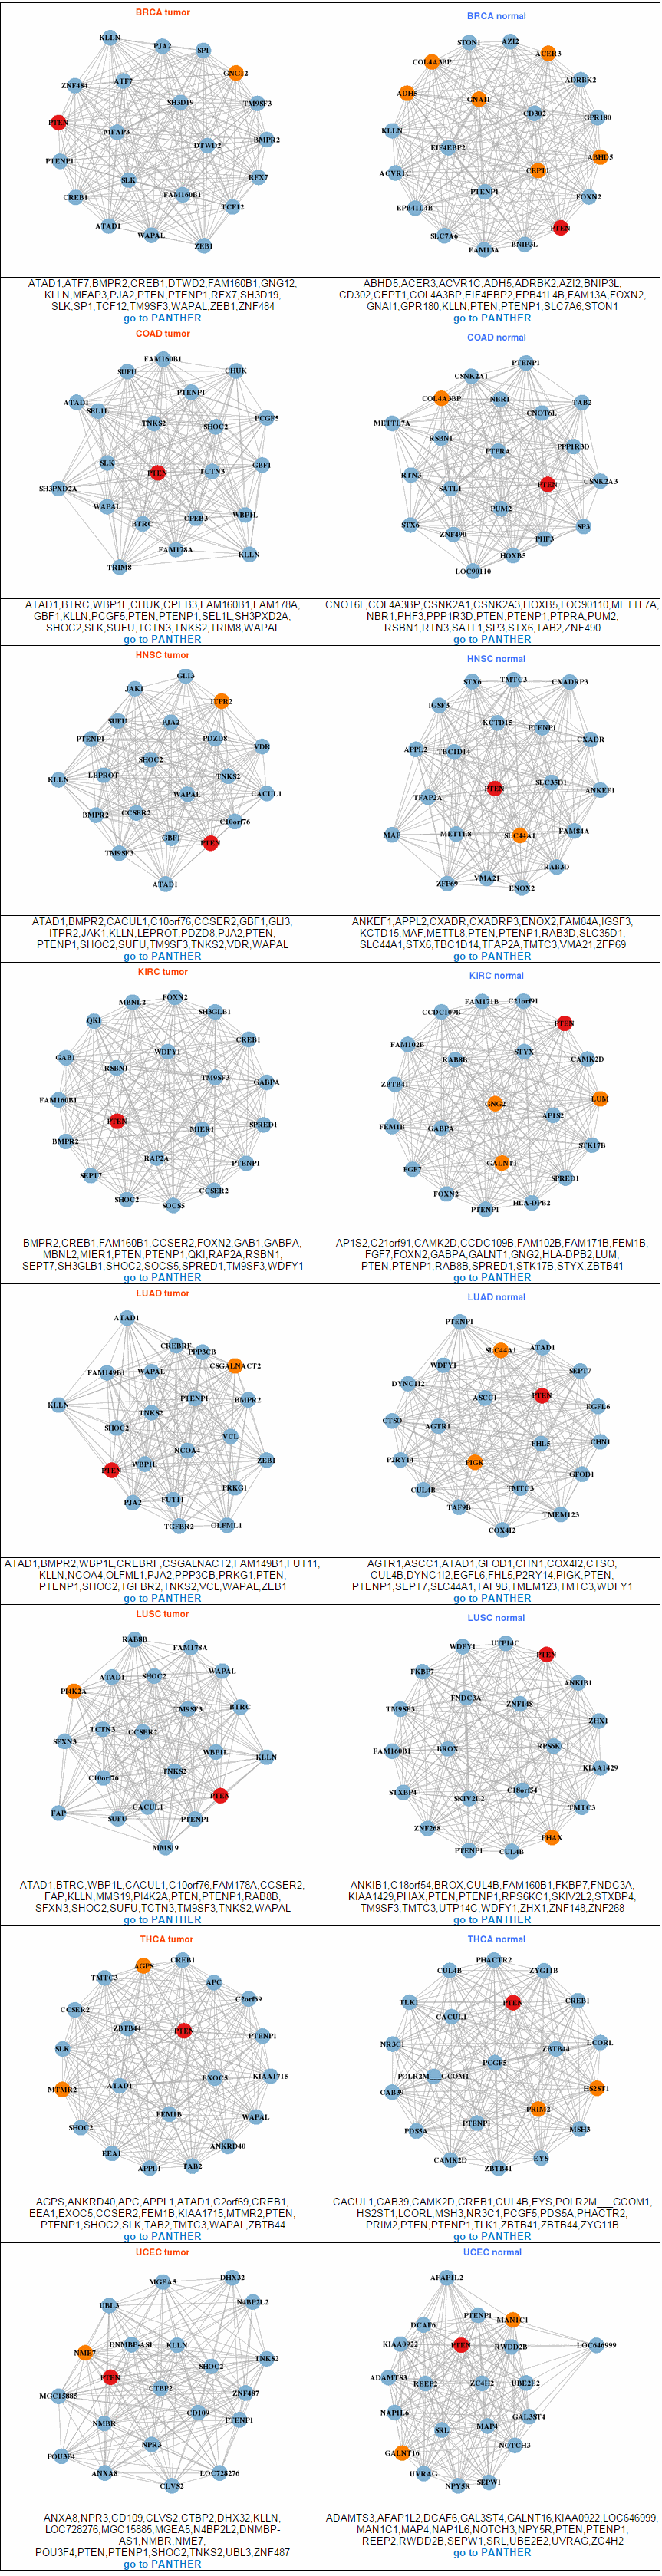
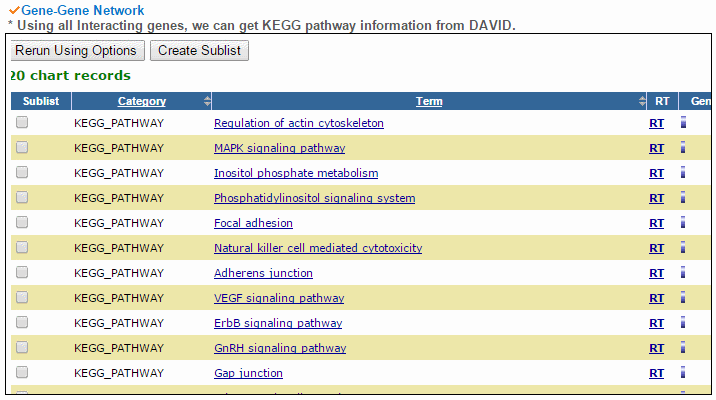
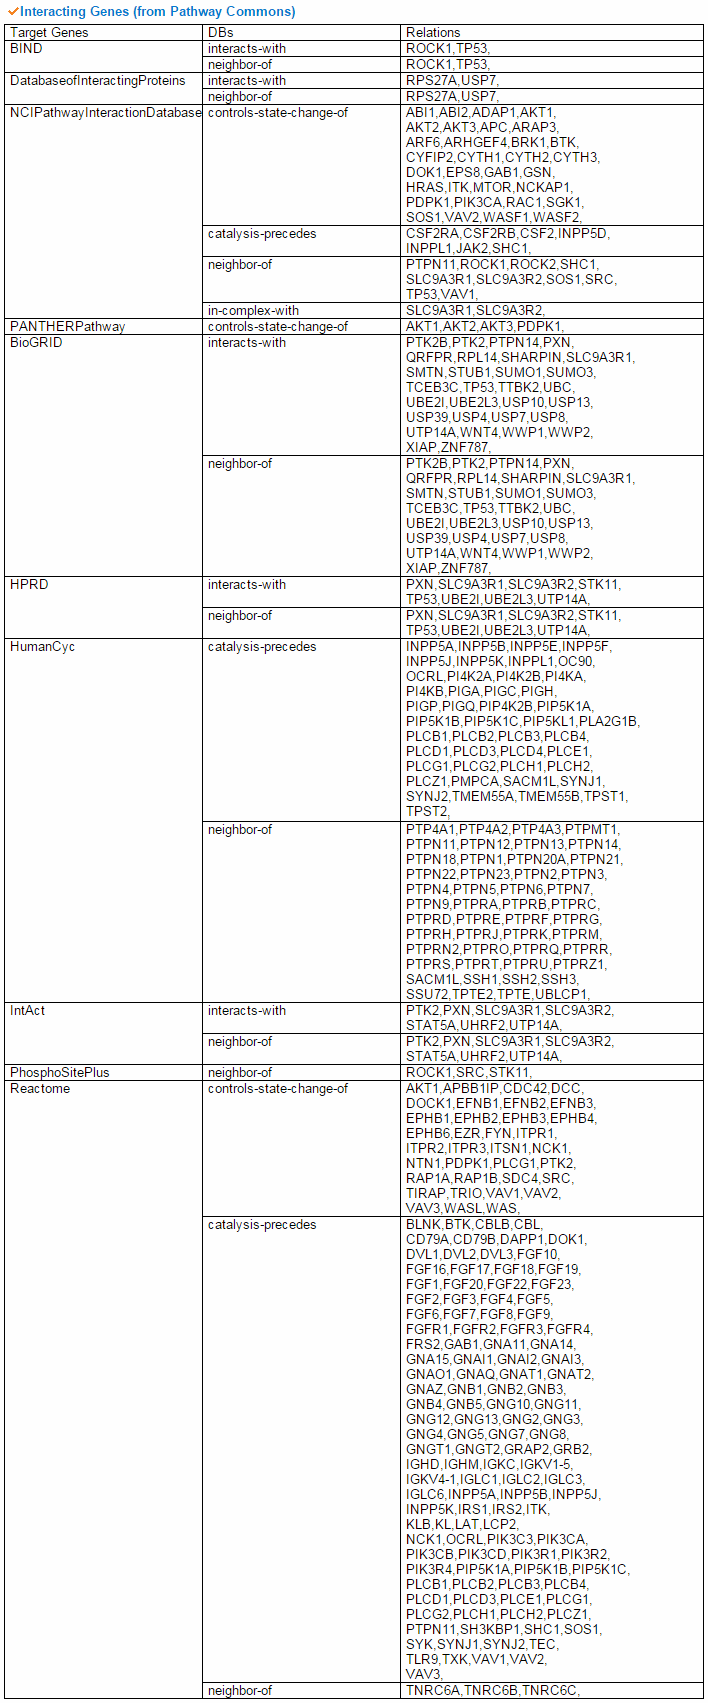
To compare the active genes between tumor and matched normal samples, we analyzed expression using the top 20 co-expressed genes' expression with PPI and we made a network. Using gene elements under the network, we can do the pathway enrichment test. From all interacting genes, ccmGDB shows the most related KEGG pathway using DAVID web site links. This table shows all interacting genes which are from PathwayCommons database.
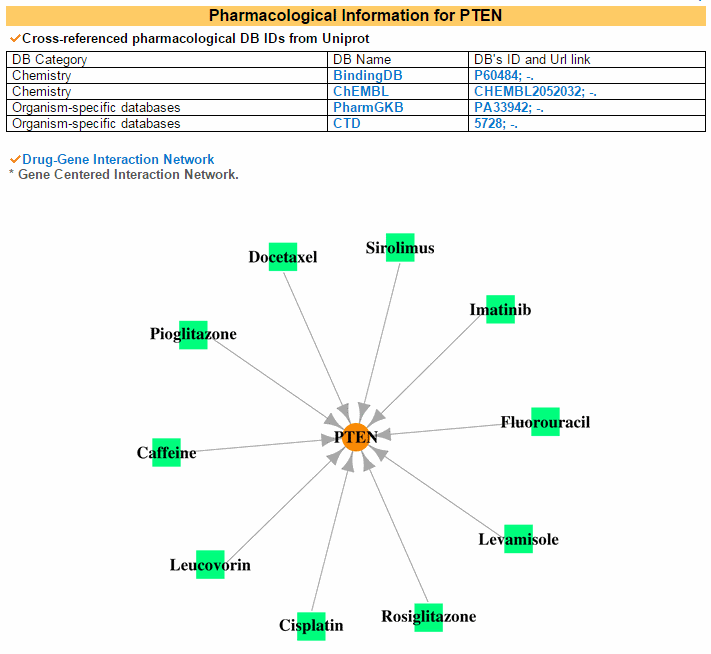
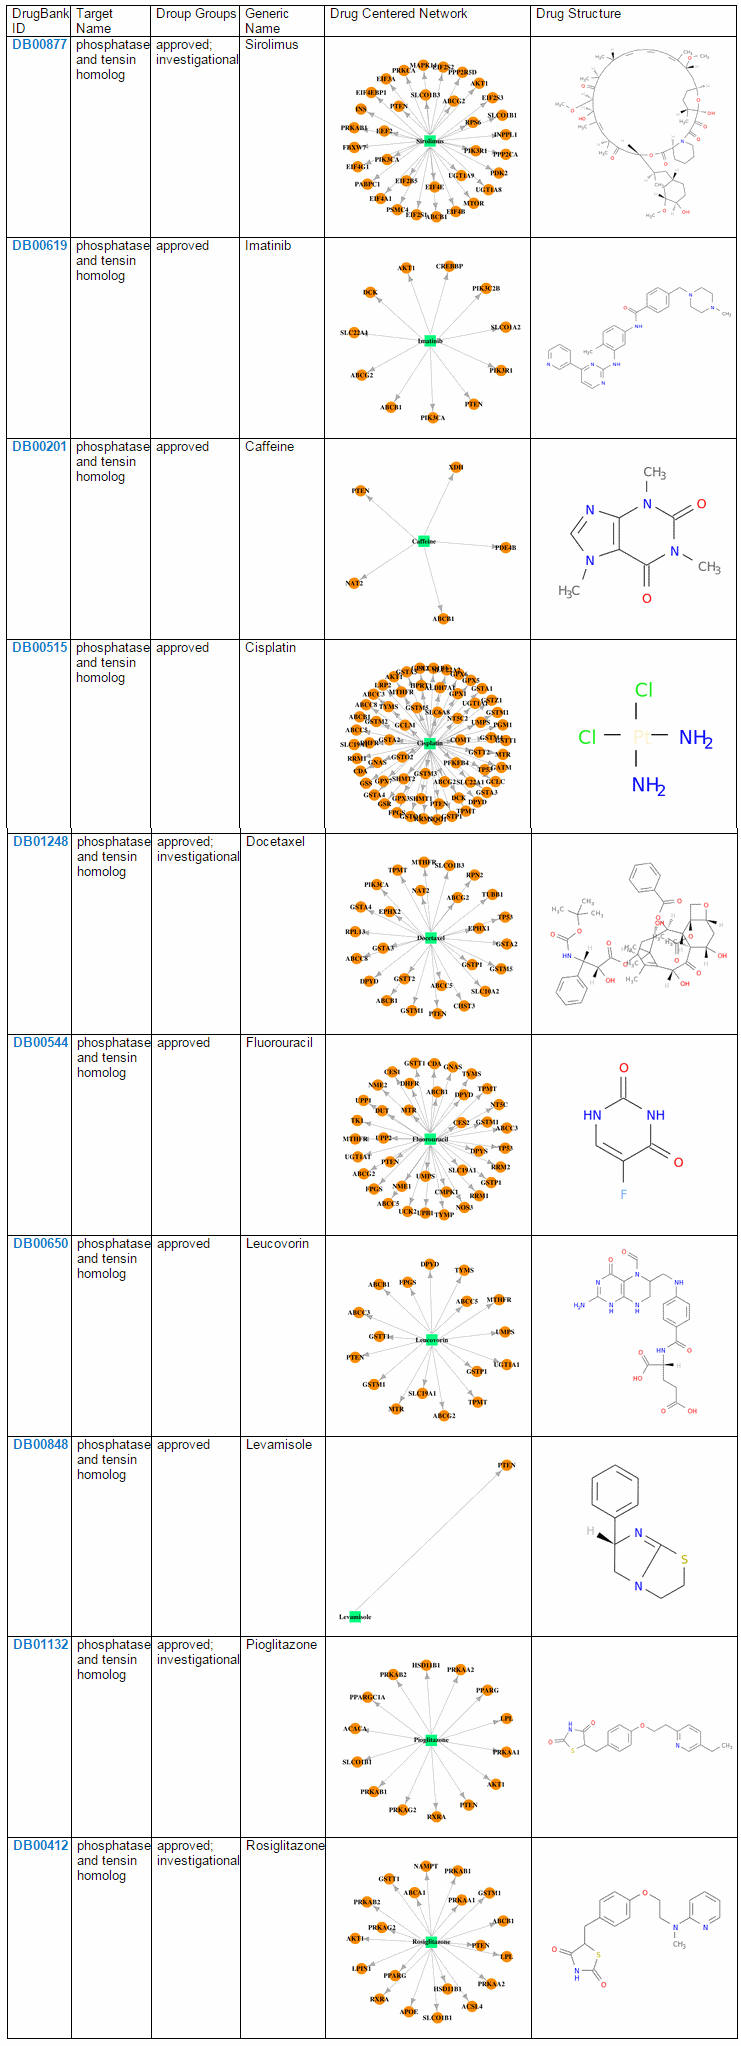
5) Pharmacological Information Category Pharmarcological information category shows drug related cross references. Drug-Gene Interaction Network image shows gene-centered network and drug-centered netwrok Under network is for drug-centered network. And user also can see the drug structure.
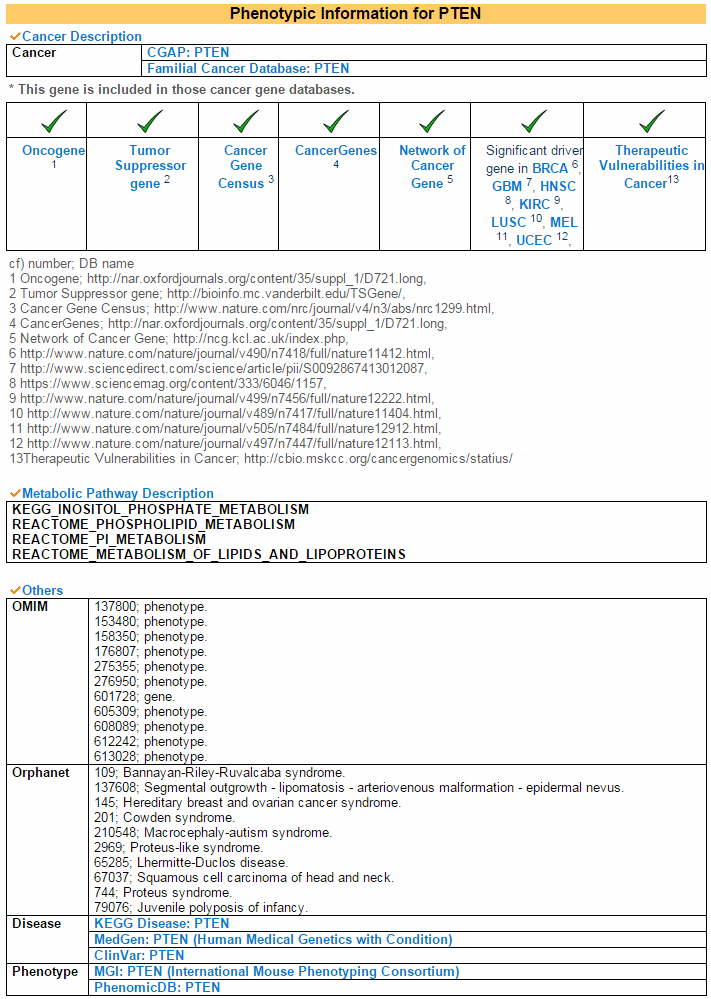
6) Phenotypic Information Category This cagegory shows information related phenotypes of this gene. The major phenotype is cancer. The second is OMIM's supporting disease information. And Orphanet also supports related syndromes. Lastly mouse phenotype link is provided to see the phenotype.
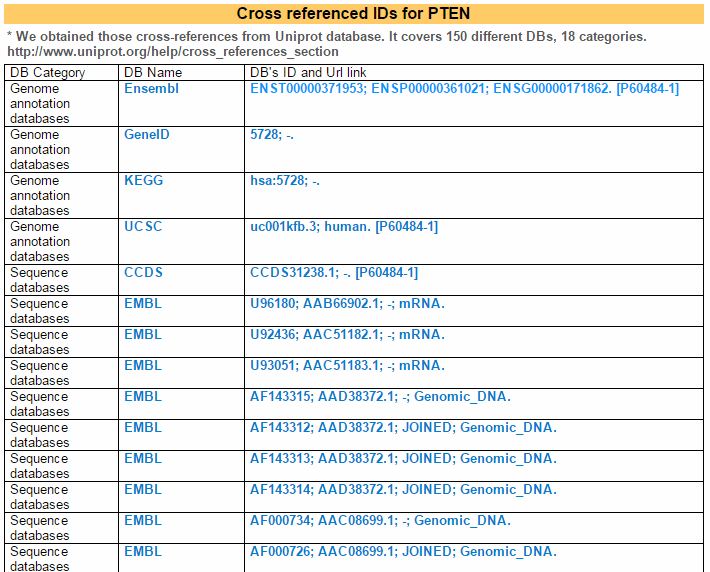
This table shows cross reference information from parsing Uniprot data.
|
|
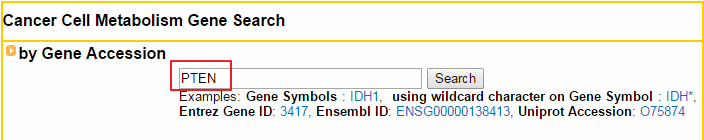
This search system suports input as an official HUTO gene symbol including wildcard character, Entrez Gene ID, Ensembl ID, and Uniprot Accession. Cell Metabolism Pathway Search This search system supports input as a cell metabolism pathway from KEGG and REACTOME pathway databases. Copy Number Variation Related Gene Search This search system suports input as a copy number variation type per each tissue from COSMIC data sets. This search system suports input as a cancer gene set from 5 cancer gene databases. Significantly Mutated Genes per Cancer Type Search This search system suports input as a significantly mutated gene set for each cancer type. This search system suports input as a status of the drug related with cmGenes.
EXAMPLE - Cell Metabolism Pathway Search Let's search using 'Cell Metabolism Pathway Searh' system with 'KEGG_GALACTOSE_METABOLISM' pathway. Then, the gene search result page will show all gene list of 'GALACTOSE METABOLISM' of KEGG database. You can go to each gene's annotation page when you click the blue colored gene symbol.
|
|
Copyright 2008-Present - The University of Texas Health Science Center at Houston (UTHealth) Web File Viewing |
How to Report, Fraud, Waste and Abuse |
State of Texas |