|
||||||||||||||||||||
| |
| Phenotypic Information (metabolism pathway, cancer, disease, phenome) |
| |
| |
| Gene-Gene Network Information: Co-Expression Network, Interacting Genes & KEGG |
| |
|


| Gene Summary for ANKRD1 |
| Basic gene info. | Gene symbol | ANKRD1 |
| Gene name | ankyrin repeat domain 1 (cardiac muscle) | |
| Synonyms | ALRP|C-193|CARP|CVARP|MCARP|bA320F15.2 | |
| Cytomap | UCSC genome browser: 10q23.31 | |
| Genomic location | chr10 :92671856-92681032 | |
| Type of gene | protein-coding | |
| RefGenes | NM_014391.2, | |
| Ensembl id | ENSG00000148677 | |
| Description | ankyrin repeat domain-containing protein 1cardiac ankyrin repeat proteincytokine-inducible gene C-193 proteincytokine-inducible nuclear proteinliver ankyrin repeat domain 1 | |
| Modification date | 20141219 | |
| dbXrefs | MIM : 609599 | |
| HGNC : HGNC | ||
| Ensembl : ENSG00000148677 | ||
| HPRD : 10647 | ||
| Vega : OTTHUMG00000018734 | ||
| Protein | UniProt: go to UniProt's Cross Reference DB Table | |
| Expression | CleanEX: HS_ANKRD1 | |
| BioGPS: 27063 | ||
| Gene Expression Atlas: ENSG00000148677 | ||
| The Human Protein Atlas: ENSG00000148677 | ||
| Pathway | NCI Pathway Interaction Database: ANKRD1 | |
| KEGG: ANKRD1 | ||
| REACTOME: ANKRD1 | ||
| ConsensusPathDB | ||
| Pathway Commons: ANKRD1 | ||
| Metabolism | MetaCyc: ANKRD1 | |
| HUMANCyc: ANKRD1 | ||
| Regulation | Ensembl's Regulation: ENSG00000148677 | |
| miRBase: chr10 :92,671,856-92,681,032 | ||
| TargetScan: NM_014391 | ||
| cisRED: ENSG00000148677 | ||
| Context | iHOP: ANKRD1 | |
| cancer metabolism search in PubMed: ANKRD1 | ||
| UCL Cancer Institute: ANKRD1 | ||
| Assigned class in ccmGDB | C | |
| Top |
| Phenotypic Information for ANKRD1(metabolism pathway, cancer, disease, phenome) |
| Cancer | CGAP: ANKRD1 |
| Familial Cancer Database: ANKRD1 | |
| * This gene is included in those cancer gene databases. |
|
|
|
|
|
| . | ||||||||||||||
Oncogene 1 | Significant driver gene in | |||||||||||||||||||
| cf) number; DB name 1 Oncogene; http://nar.oxfordjournals.org/content/35/suppl_1/D721.long, 2 Tumor Suppressor gene; https://bioinfo.uth.edu/TSGene/, 3 Cancer Gene Census; http://www.nature.com/nrc/journal/v4/n3/abs/nrc1299.html, 4 CancerGenes; http://nar.oxfordjournals.org/content/35/suppl_1/D721.long, 5 Network of Cancer Gene; http://ncg.kcl.ac.uk/index.php, 1Therapeutic Vulnerabilities in Cancer; http://cbio.mskcc.org/cancergenomics/statius/ |
| REACTOME_METABOLISM_OF_LIPIDS_AND_LIPOPROTEINS | |
| OMIM | |
| Orphanet | |
| Disease | KEGG Disease: ANKRD1 |
| MedGen: ANKRD1 (Human Medical Genetics with Condition) | |
| ClinVar: ANKRD1 | |
| Phenotype | MGI: ANKRD1 (International Mouse Phenotyping Consortium) |
| PhenomicDB: ANKRD1 | |
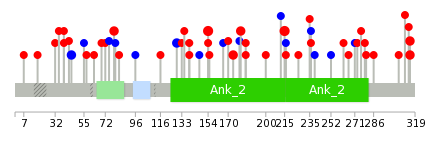
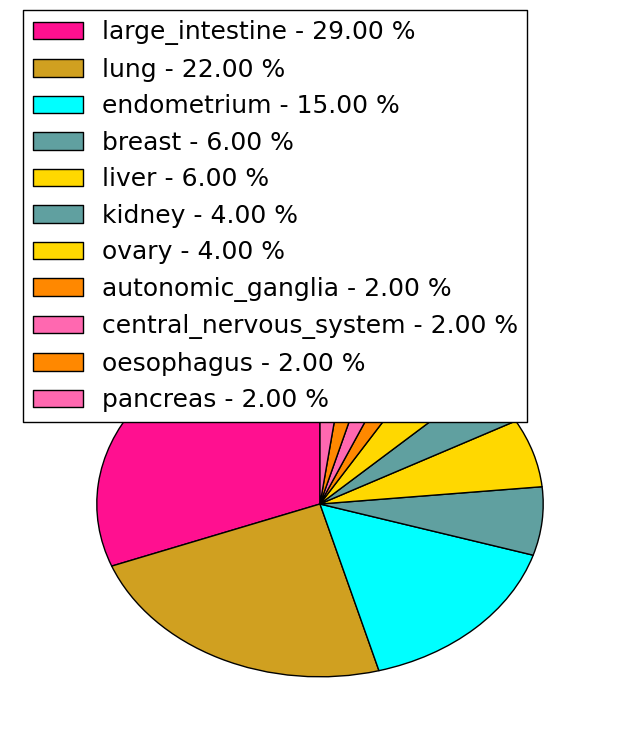
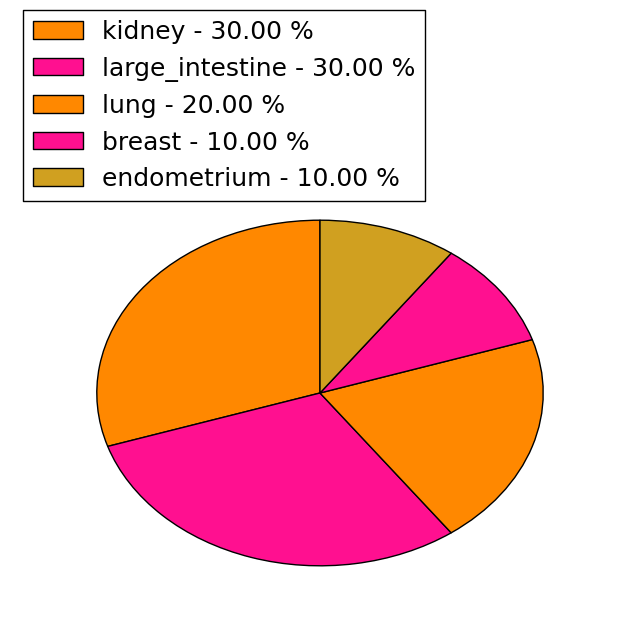
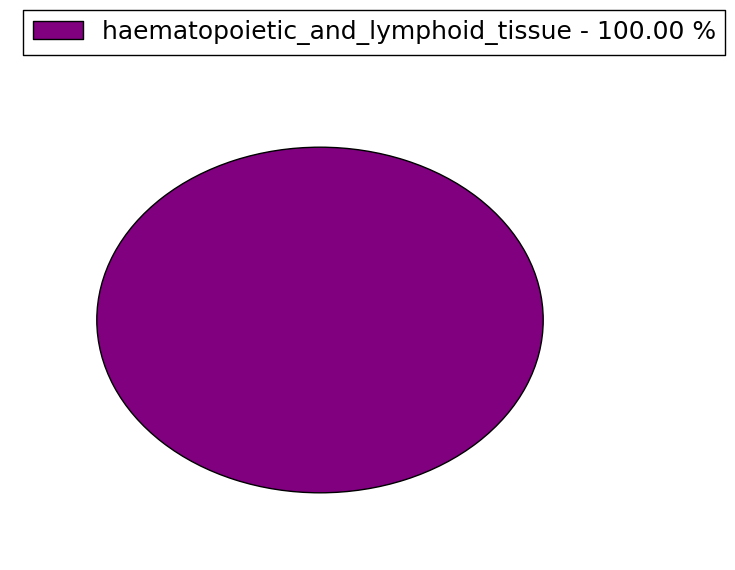
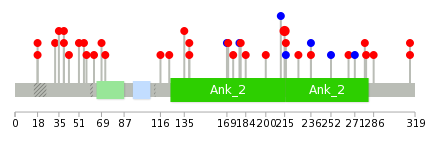
| Mutations for ANKRD1 |
| * Under tables are showing count per each tissue to give us broad intuition about tissue specific mutation patterns.You can go to the detailed page for each mutation database's web site. |
| There's no structural variation information in COSMIC data for this gene. |
| * From mRNA Sanger sequences, Chitars2.0 arranged chimeric transcripts. This table shows ANKRD1 related fusion information. |
| ID | Head Gene | Tail Gene | Accession | Gene_a | qStart_a | qEnd_a | Chromosome_a | tStart_a | tEnd_a | Gene_a | qStart_a | qEnd_a | Chromosome_a | tStart_a | tEnd_a |
| BP260187 | ANKRD1 | 1 | 397 | 10 | 92678893 | 92680843 | CAV1 | 398 | 584 | 7 | 116165090 | 116166708 | |
| BP259299 | ANKRD1 | 1 | 263 | 10 | 92679932 | 92680847 | ATP8B5P | 259 | 579 | 9 | 35406896 | 35407216 | |
| Top |
| There's no copy number variation information in COSMIC data for this gene. |
| Top |
|
 |
| Top |
| Stat. for Non-Synonymous SNVs (# total SNVs=44) | (# total SNVs=10) |
 |  |
(# total SNVs=0) | (# total SNVs=1) |
 |
| Top |
| * When you move the cursor on each content, you can see more deailed mutation information on the Tooltip. Those are primary_site,primary_histology,mutation(aa),pubmedID. |
| GRCh37 position | Mutation(aa) | Unique sampleID count |
| chr10:92677580-92677580 | p.R154P | 4 |
| chr10:92675935-92675935 | p.R215Q | 3 |
| chr10:92677521-92677521 | p.E174K | 2 |
| chr10:92672639-92672639 | p.R315H | 2 |
| chr10:92679998-92679998 | p.L45L | 2 |
| chr10:92672640-92672640 | p.R315C | 2 |
| chr10:92678998-92678998 | p.S79P | 2 |
| chr10:92677503-92677503 | p.E180K | 2 |
| chr10:92675581-92675581 | p.E236E | 2 |
| chr10:92677504-92677504 | p.I179I | 1 |
| Top |
|
 |
| Point Mutation/ Tissue ID | 1 | 2 | 3 | 4 | 5 | 6 | 7 | 8 | 9 | 10 | 11 | 12 | 13 | 14 | 15 | 16 | 17 | 18 | 19 | 20 |
| # sample | 1 | 9 | 1 | 3 | 8 | 2 | 2 | 3 | 3 | 5 | ||||||||||
| # mutation | 1 | 10 | 1 | 3 | 8 | 2 | 2 | 3 | 3 | 6 | ||||||||||
| nonsynonymous SNV | 1 | 9 | 1 | 2 | 7 | 1 | 2 | 1 | 3 | 6 | ||||||||||
| synonymous SNV | 1 | 1 | 1 | 1 | 2 | 1 |
| cf) Tissue ID; Tissue type (1; BLCA[Bladder Urothelial Carcinoma], 2; BRCA[Breast invasive carcinoma], 3; CESC[Cervical squamous cell carcinoma and endocervical adenocarcinoma], 4; COAD[Colon adenocarcinoma], 5; GBM[Glioblastoma multiforme], 6; Glioma Low Grade, 7; HNSC[Head and Neck squamous cell carcinoma], 8; KICH[Kidney Chromophobe], 9; KIRC[Kidney renal clear cell carcinoma], 10; KIRP[Kidney renal papillary cell carcinoma], 11; LAML[Acute Myeloid Leukemia], 12; LUAD[Lung adenocarcinoma], 13; LUSC[Lung squamous cell carcinoma], 14; OV[Ovarian serous cystadenocarcinoma ], 15; PAAD[Pancreatic adenocarcinoma], 16; PRAD[Prostate adenocarcinoma], 17; SKCM[Skin Cutaneous Melanoma], 18:STAD[Stomach adenocarcinoma], 19:THCA[Thyroid carcinoma], 20:UCEC[Uterine Corpus Endometrial Carcinoma]) |
| Top |
| * We represented just top 10 SNVs. When you move the cursor on each content, you can see more deailed mutation information on the Tooltip. Those are primary_site, primary_histology, mutation(aa), pubmedID. |
| Genomic Position | Mutation(aa) | Unique sampleID count |
| chr10:92675935 | p.R215Q | 3 |
| chr10:92675581 | p.G18W | 2 |
| chr10:92680081 | p.E236E | 2 |
| chr10:92679928 | p.A226V | 1 |
| chr10:92675353 | p.T116K | 1 |
| chr10:92677504 | p.D216D | 1 |
| chr10:92679944 | p.K72N | 1 |
| chr10:92675393 | p.D216Y | 1 |
| chr10:92677521 | p.E69K | 1 |
| chr10:92679963 | p.E63D | 1 |
| * Copy number data were extracted from TCGA using R package TCGA-Assembler. The URLs of all public data files on TCGA DCC data server were gathered on Jan-05-2015. Function ProcessCNAData in TCGA-Assembler package was used to obtain gene-level copy number value which is calculated as the average copy number of the genomic region of a gene. |
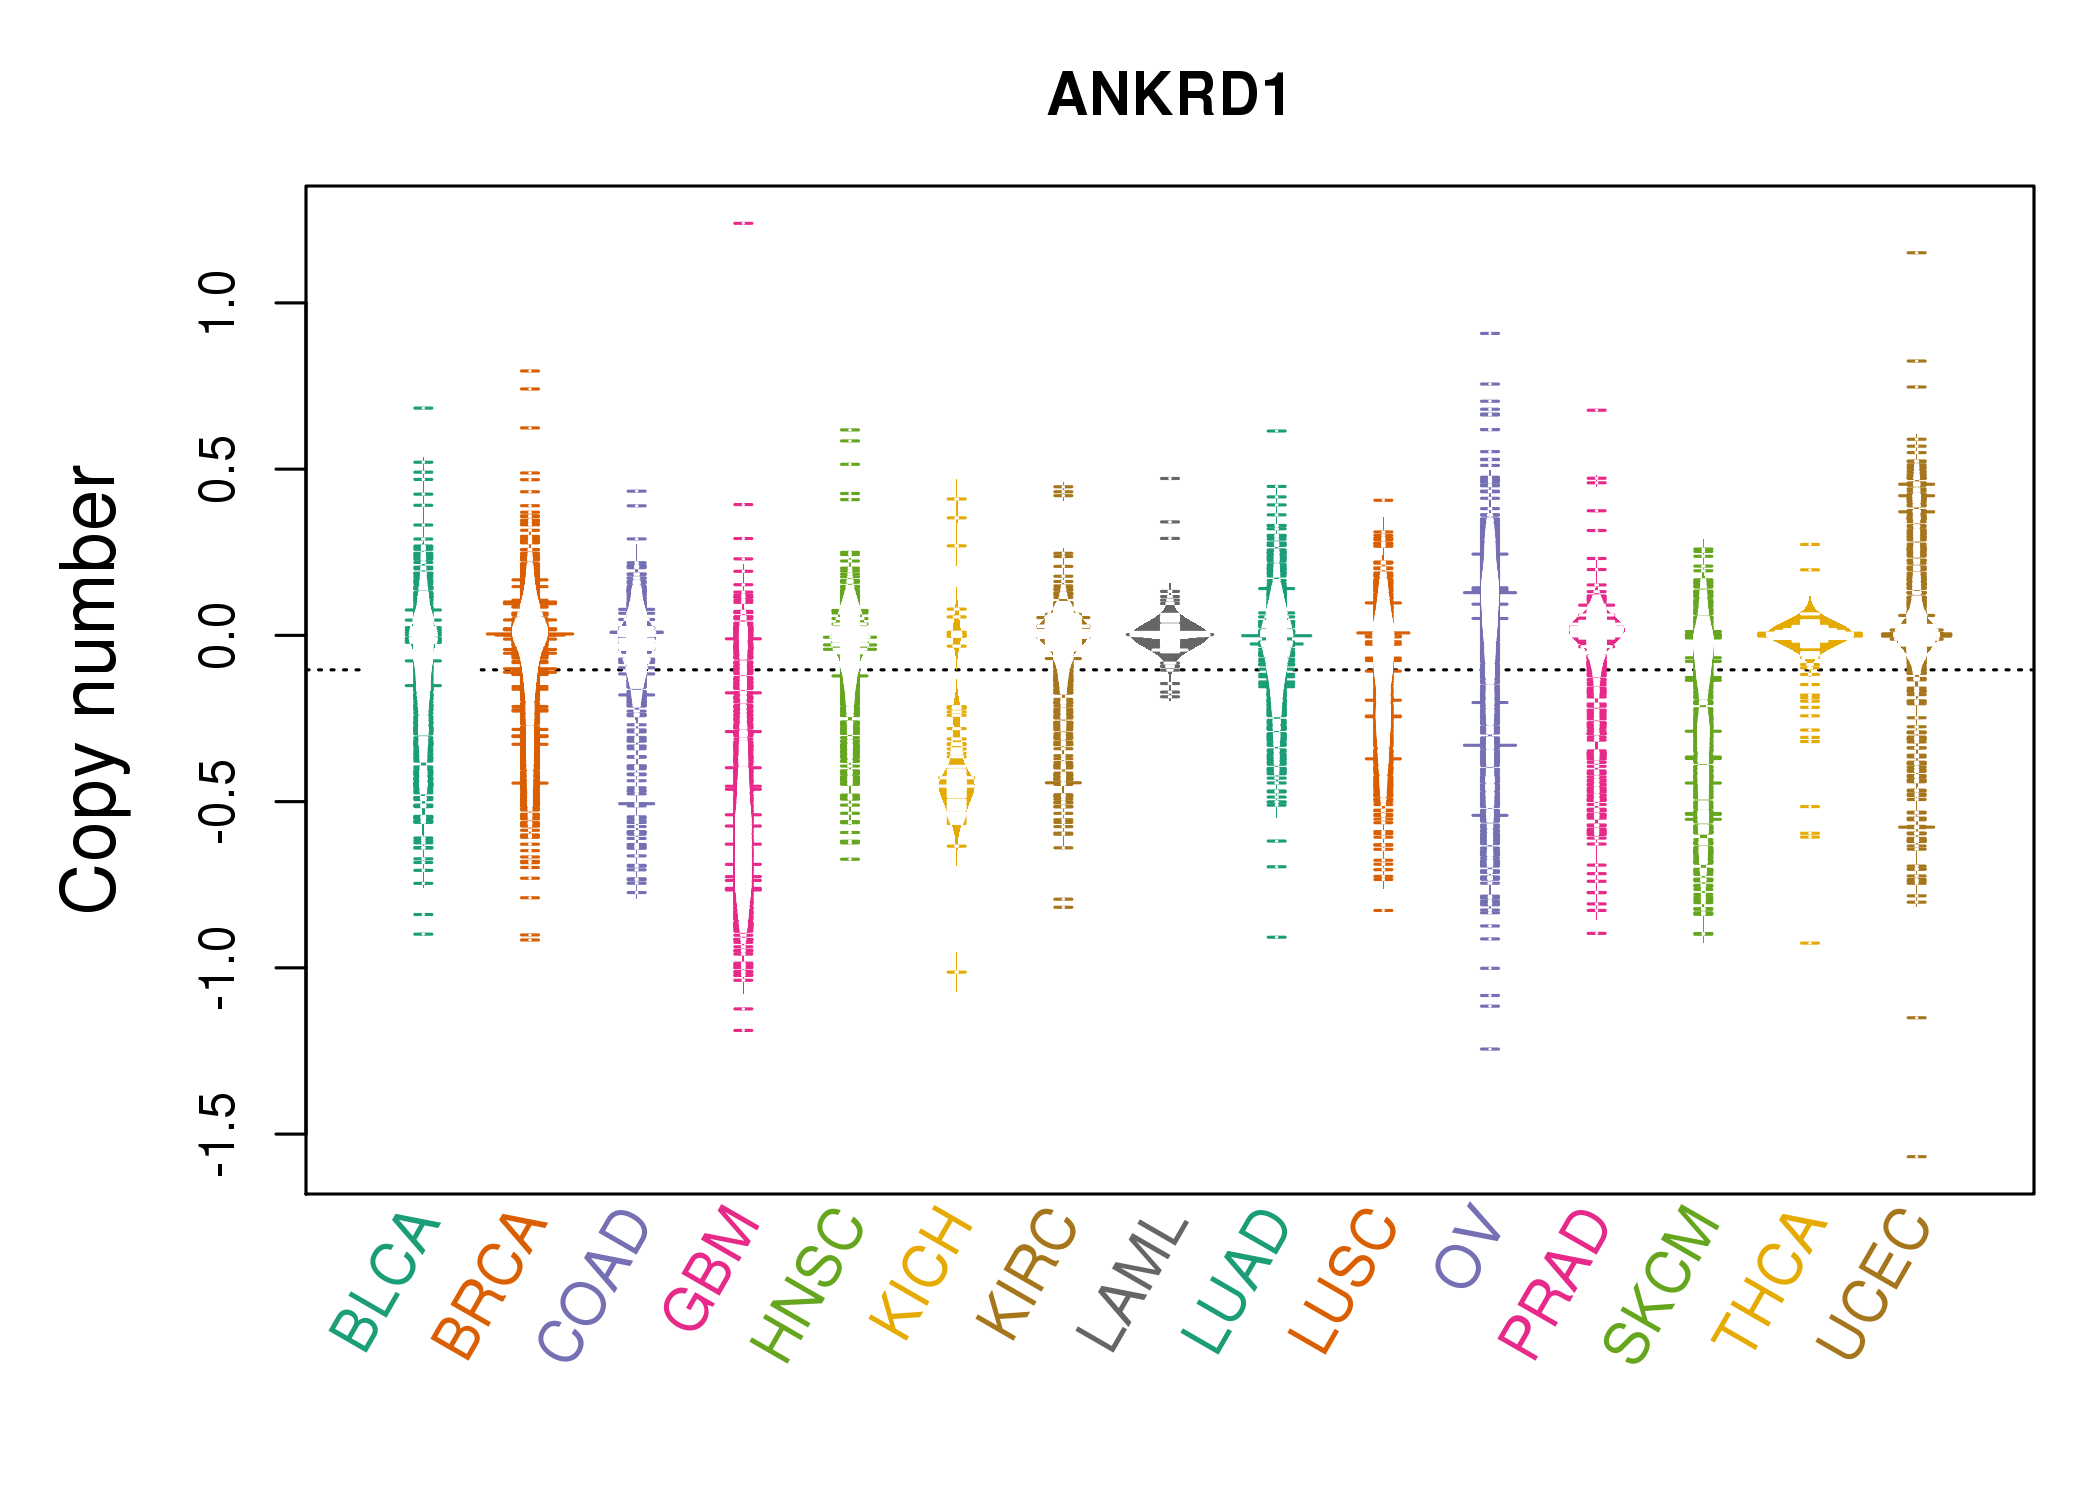 |
| cf) Tissue ID[Tissue type]: BLCA[Bladder Urothelial Carcinoma], BRCA[Breast invasive carcinoma], CESC[Cervical squamous cell carcinoma and endocervical adenocarcinoma], COAD[Colon adenocarcinoma], GBM[Glioblastoma multiforme], Glioma Low Grade, HNSC[Head and Neck squamous cell carcinoma], KICH[Kidney Chromophobe], KIRC[Kidney renal clear cell carcinoma], KIRP[Kidney renal papillary cell carcinoma], LAML[Acute Myeloid Leukemia], LUAD[Lung adenocarcinoma], LUSC[Lung squamous cell carcinoma], OV[Ovarian serous cystadenocarcinoma ], PAAD[Pancreatic adenocarcinoma], PRAD[Prostate adenocarcinoma], SKCM[Skin Cutaneous Melanoma], STAD[Stomach adenocarcinoma], THCA[Thyroid carcinoma], UCEC[Uterine Corpus Endometrial Carcinoma] |
| Top |
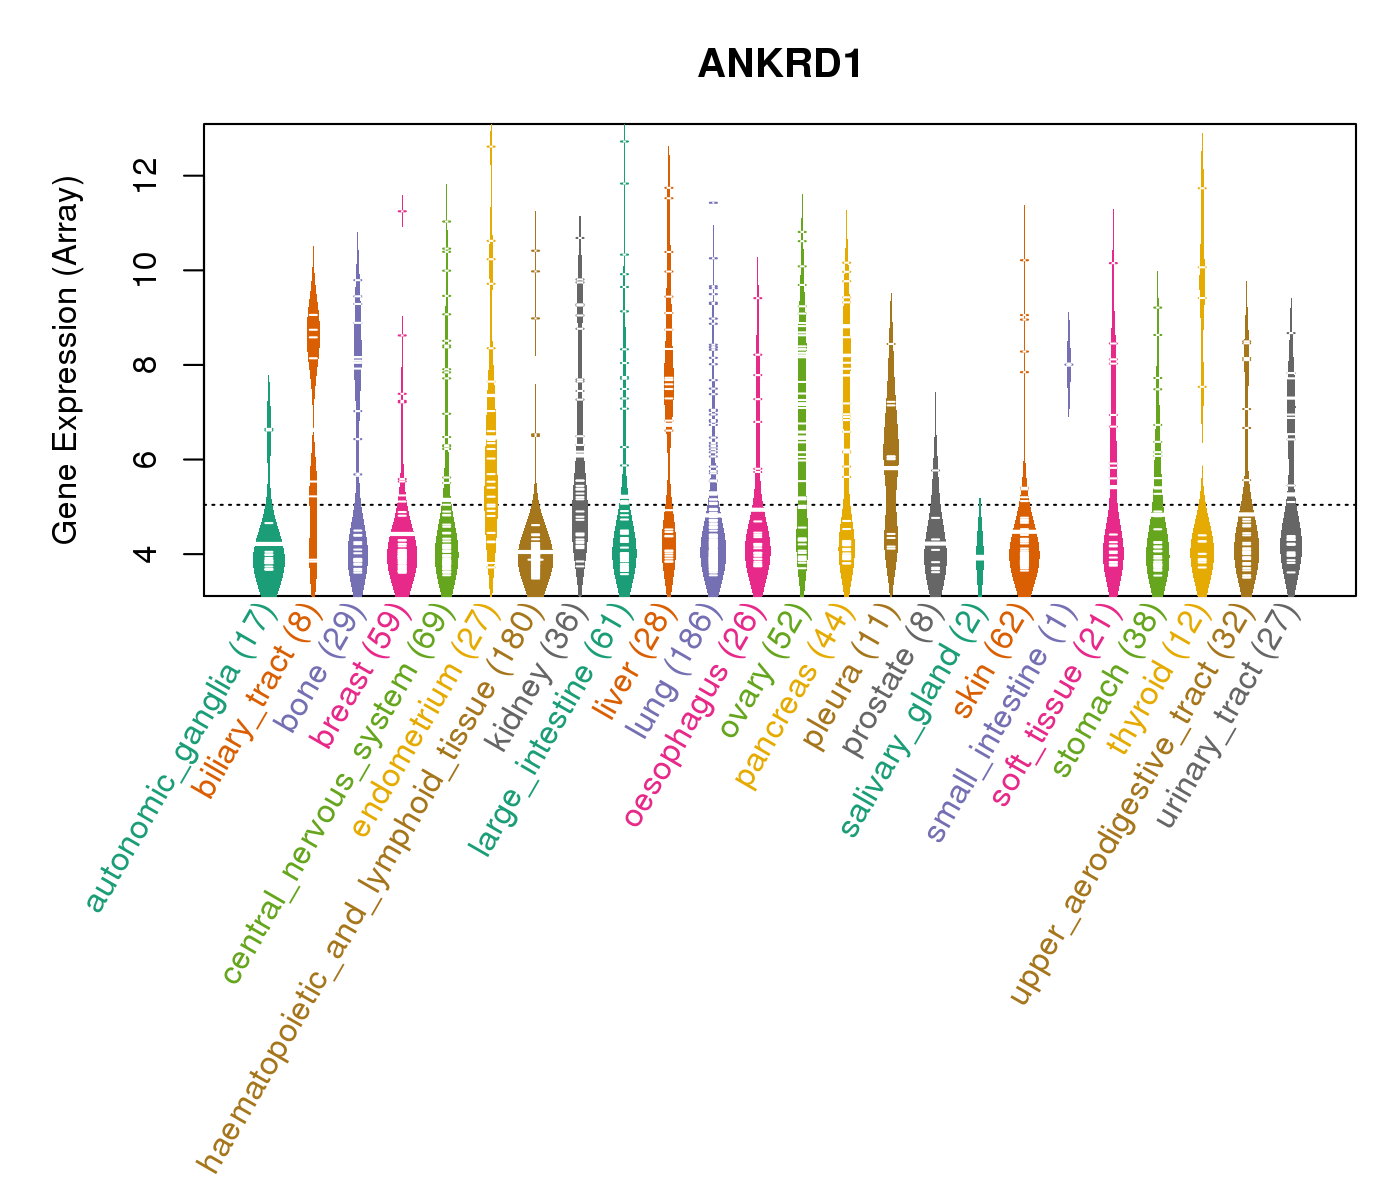
| Gene Expression for ANKRD1 |
| * CCLE gene expression data were extracted from CCLE_Expression_Entrez_2012-10-18.res: Gene-centric RMA-normalized mRNA expression data. |
 |
| * Normalized gene expression data of RNASeqV2 was extracted from TCGA using R package TCGA-Assembler. The URLs of all public data files on TCGA DCC data server were gathered at Jan-05-2015. Only eight cancer types have enough normal control samples for differential expression analysis. (t test, adjusted p<0.05 (using Benjamini-Hochberg FDR)) |
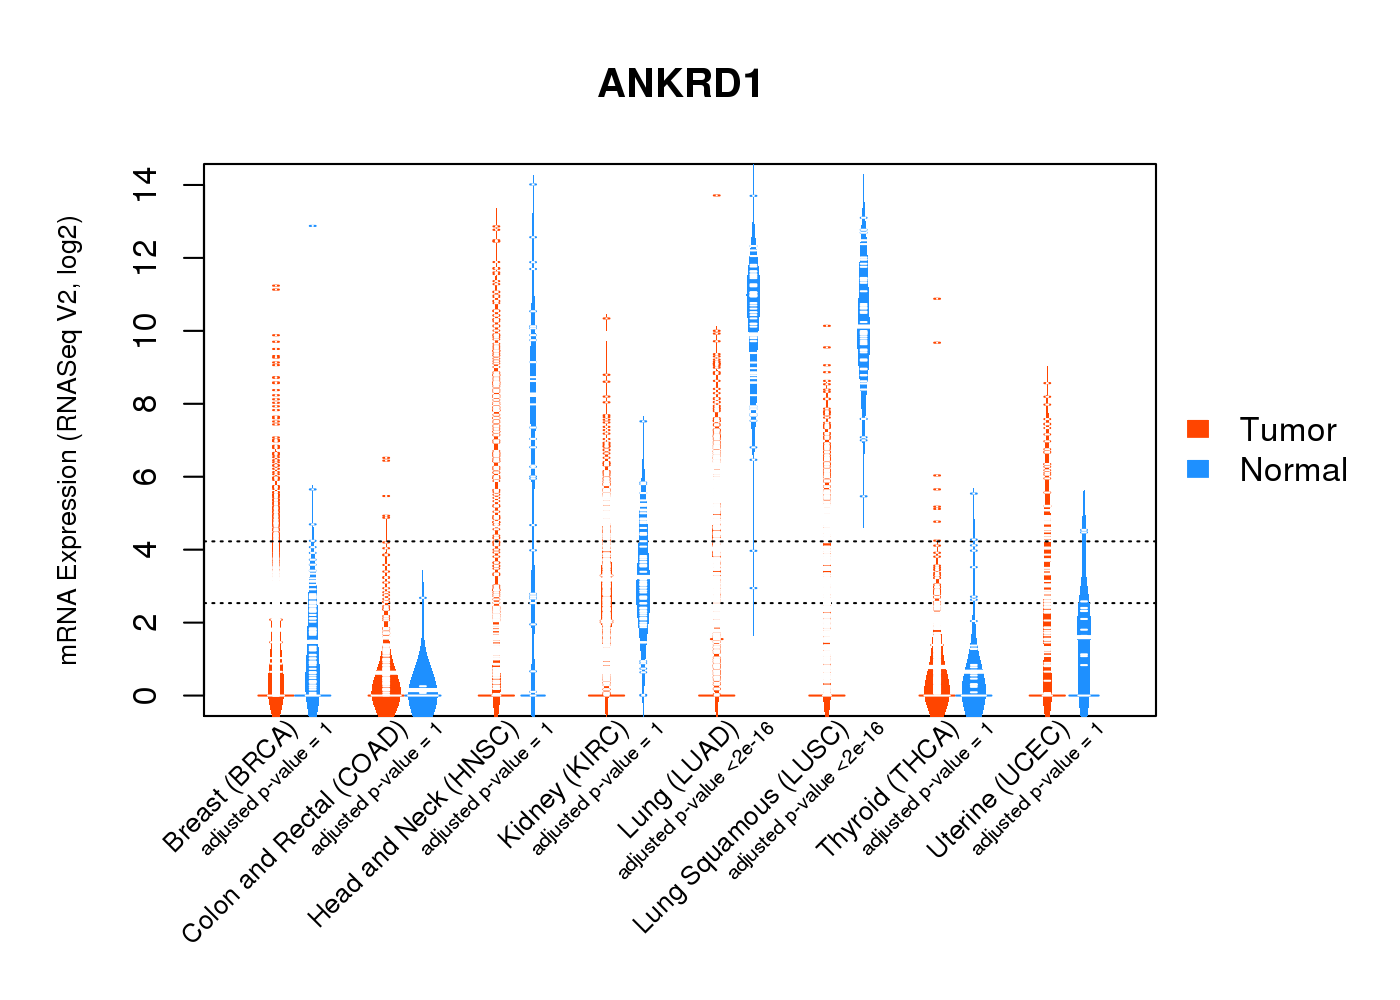 |
| Top |
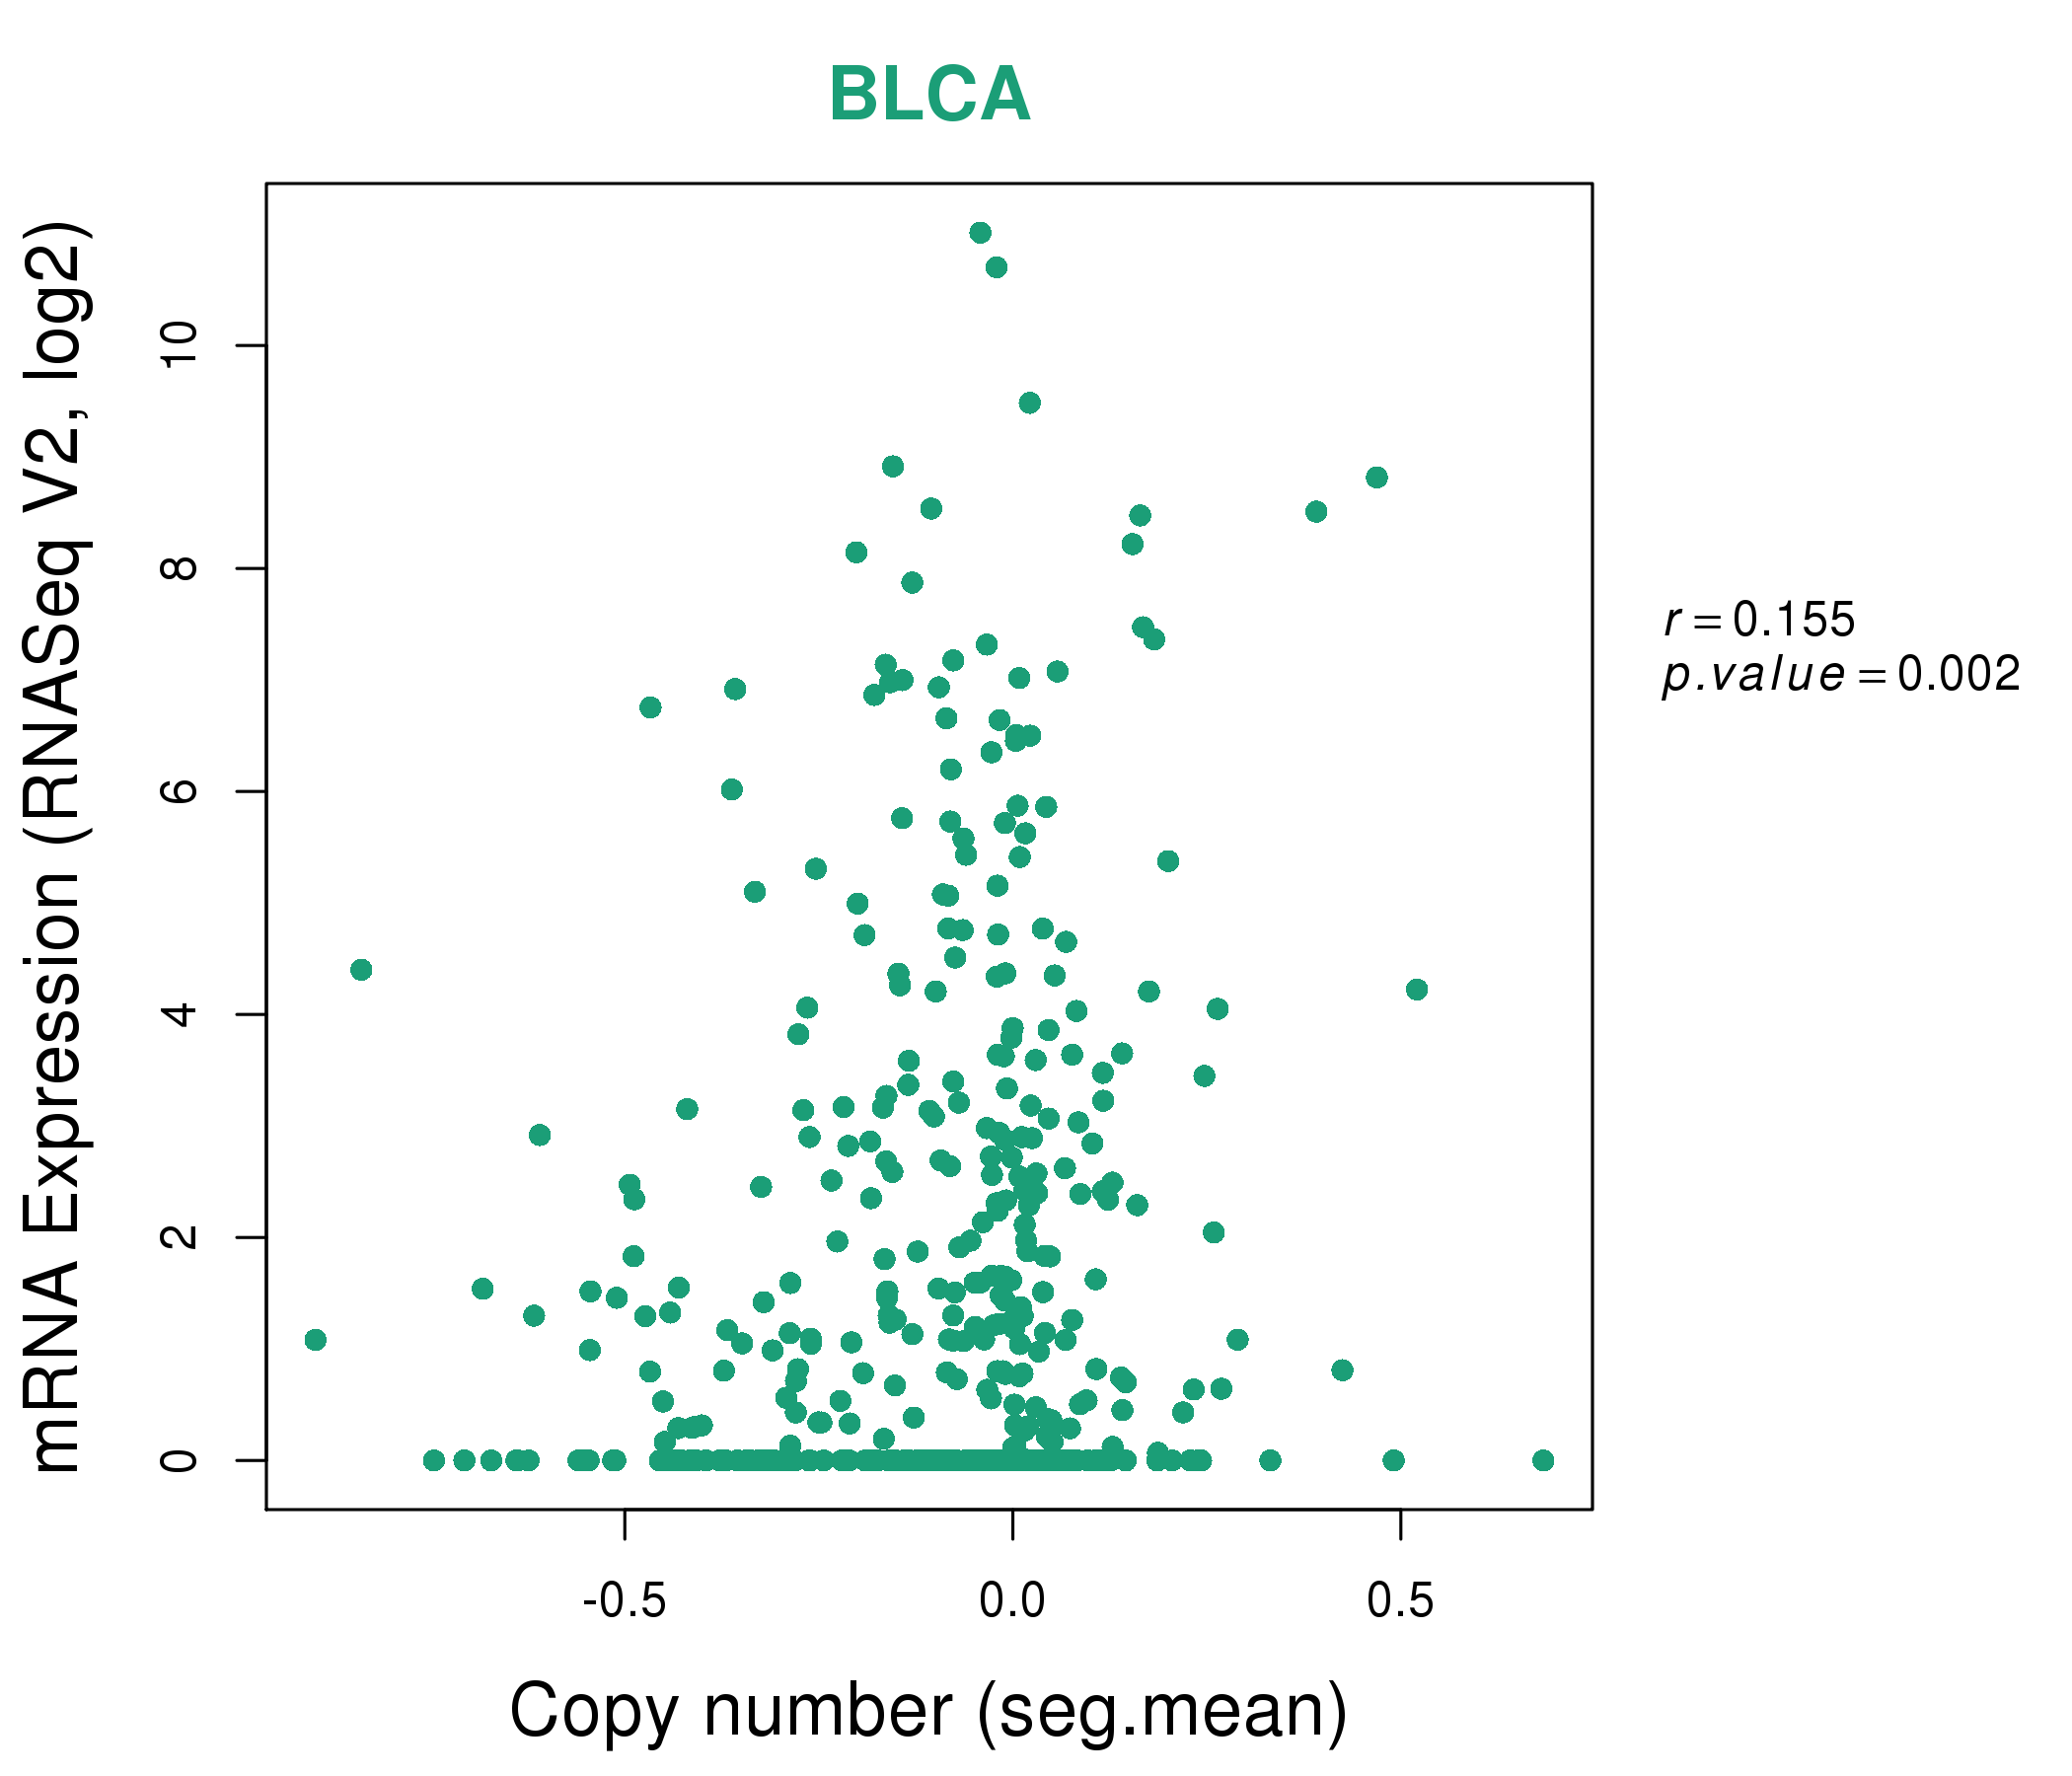
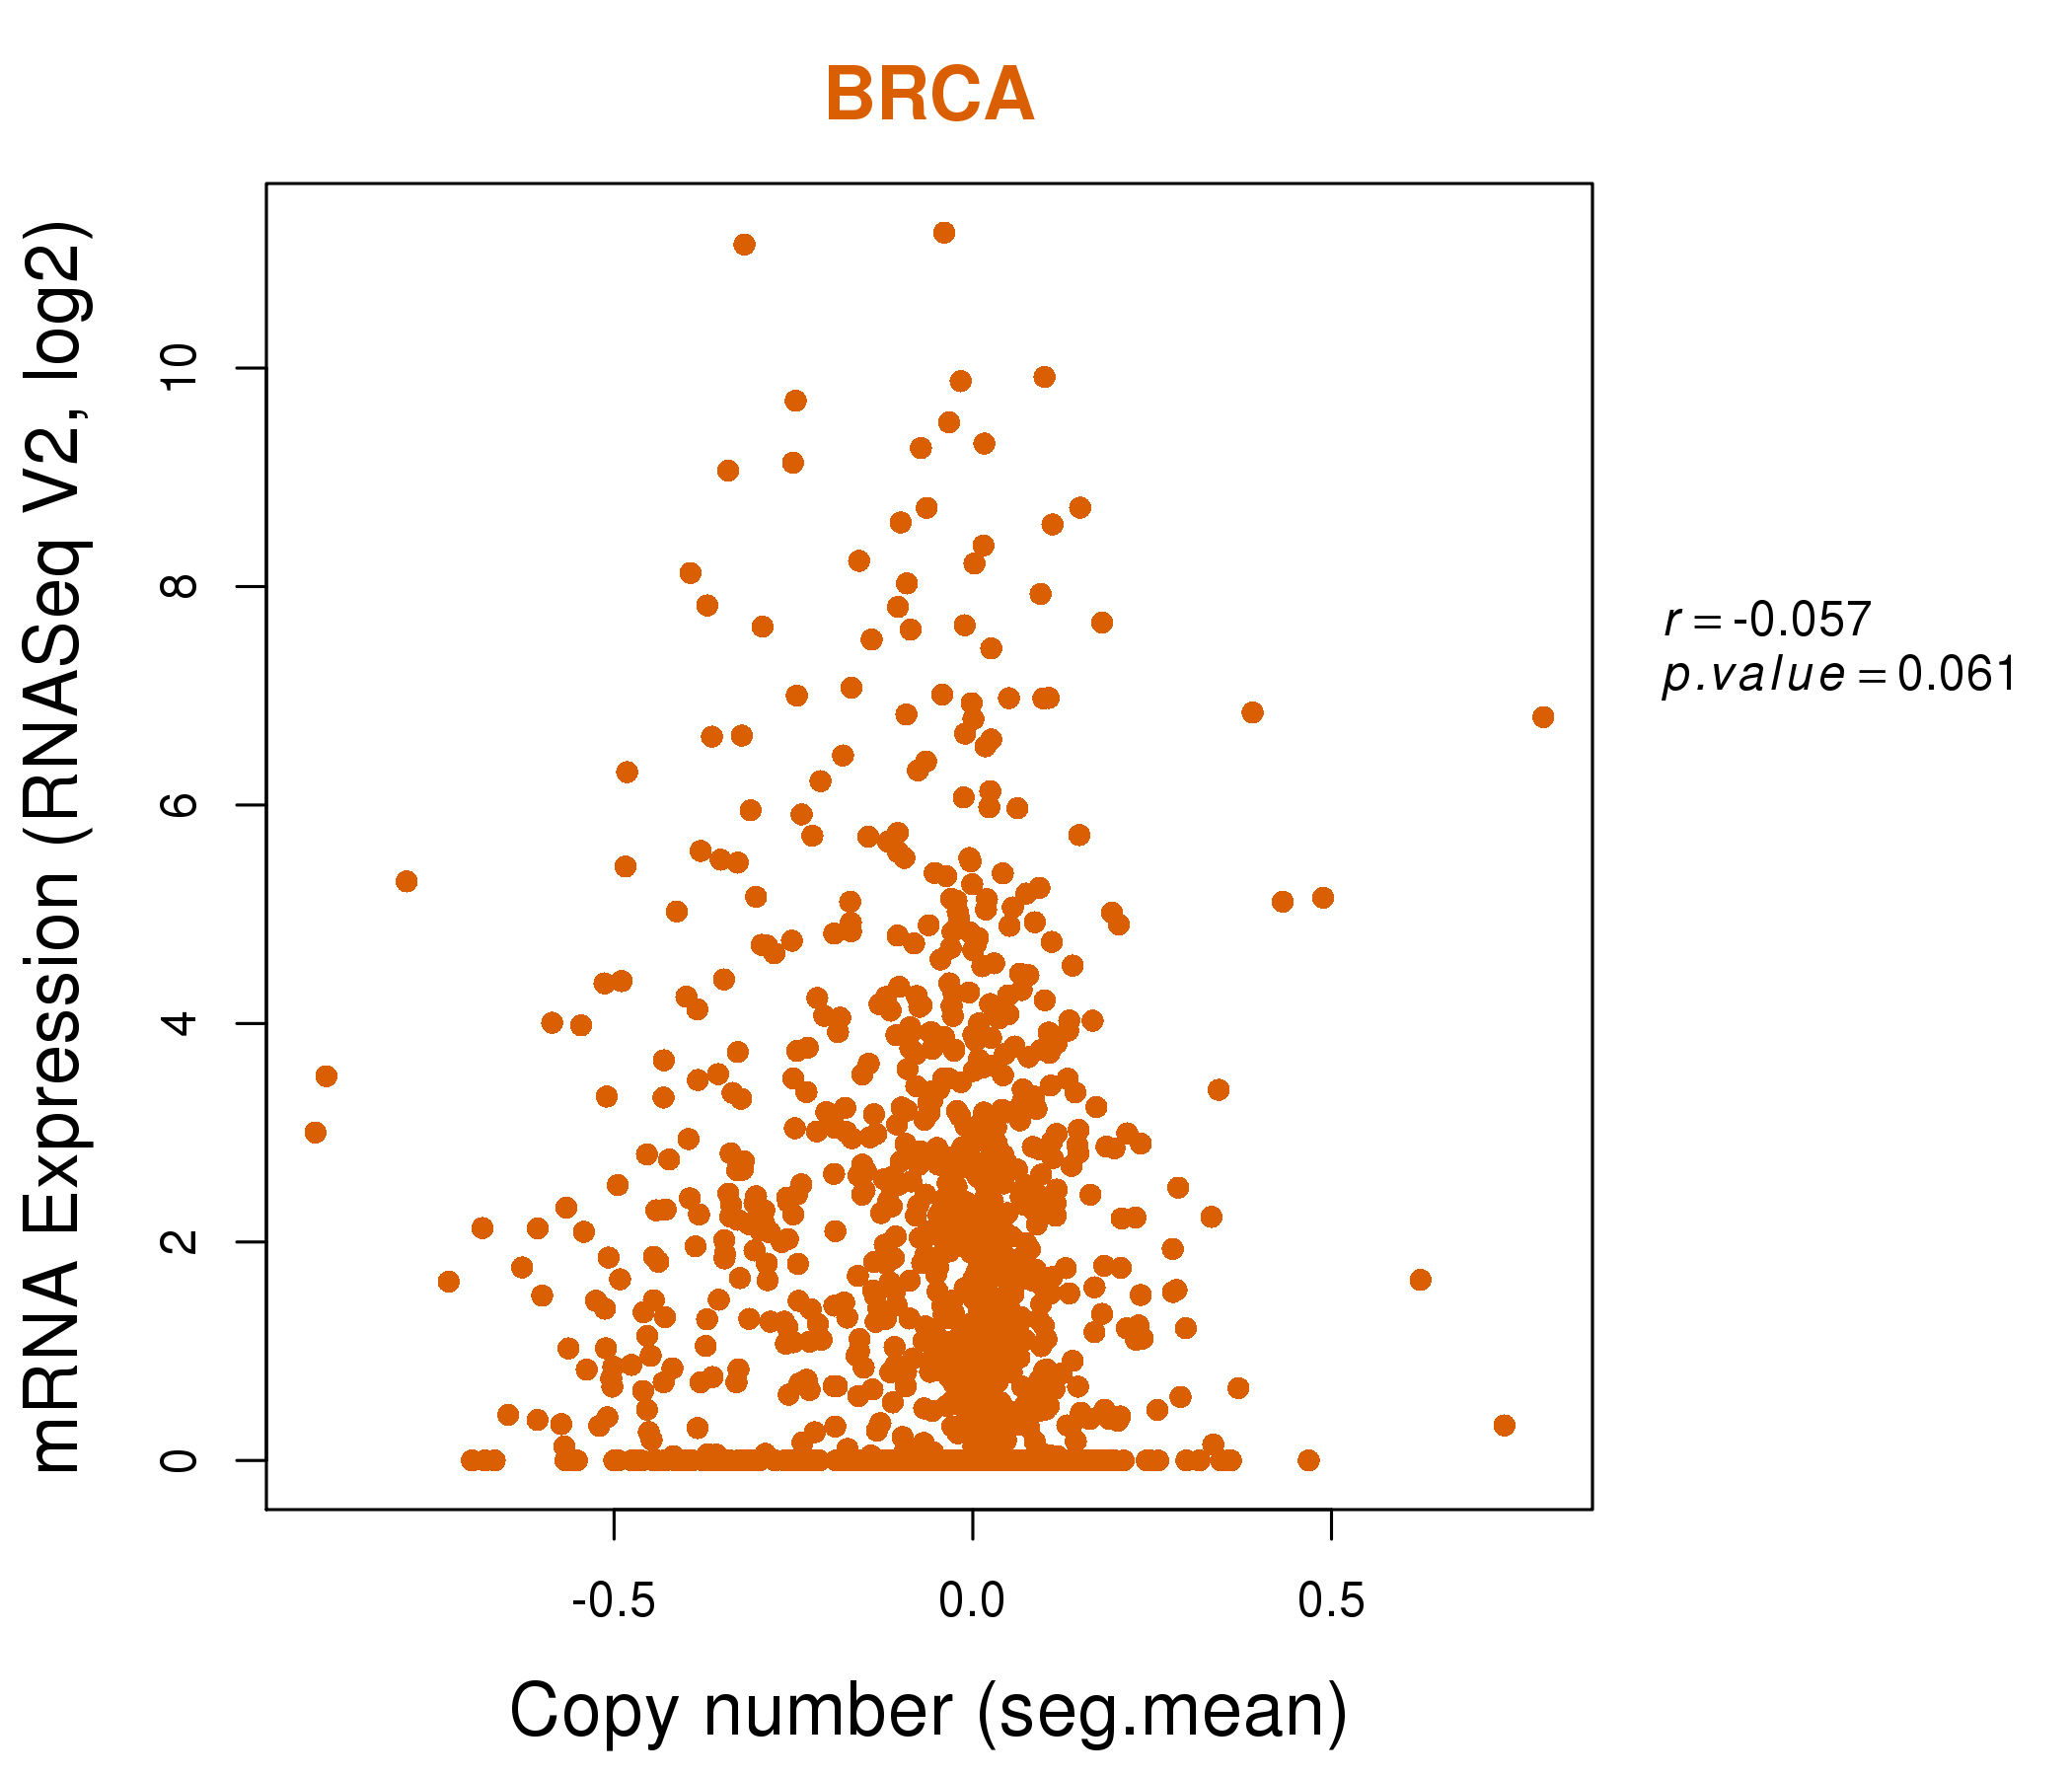
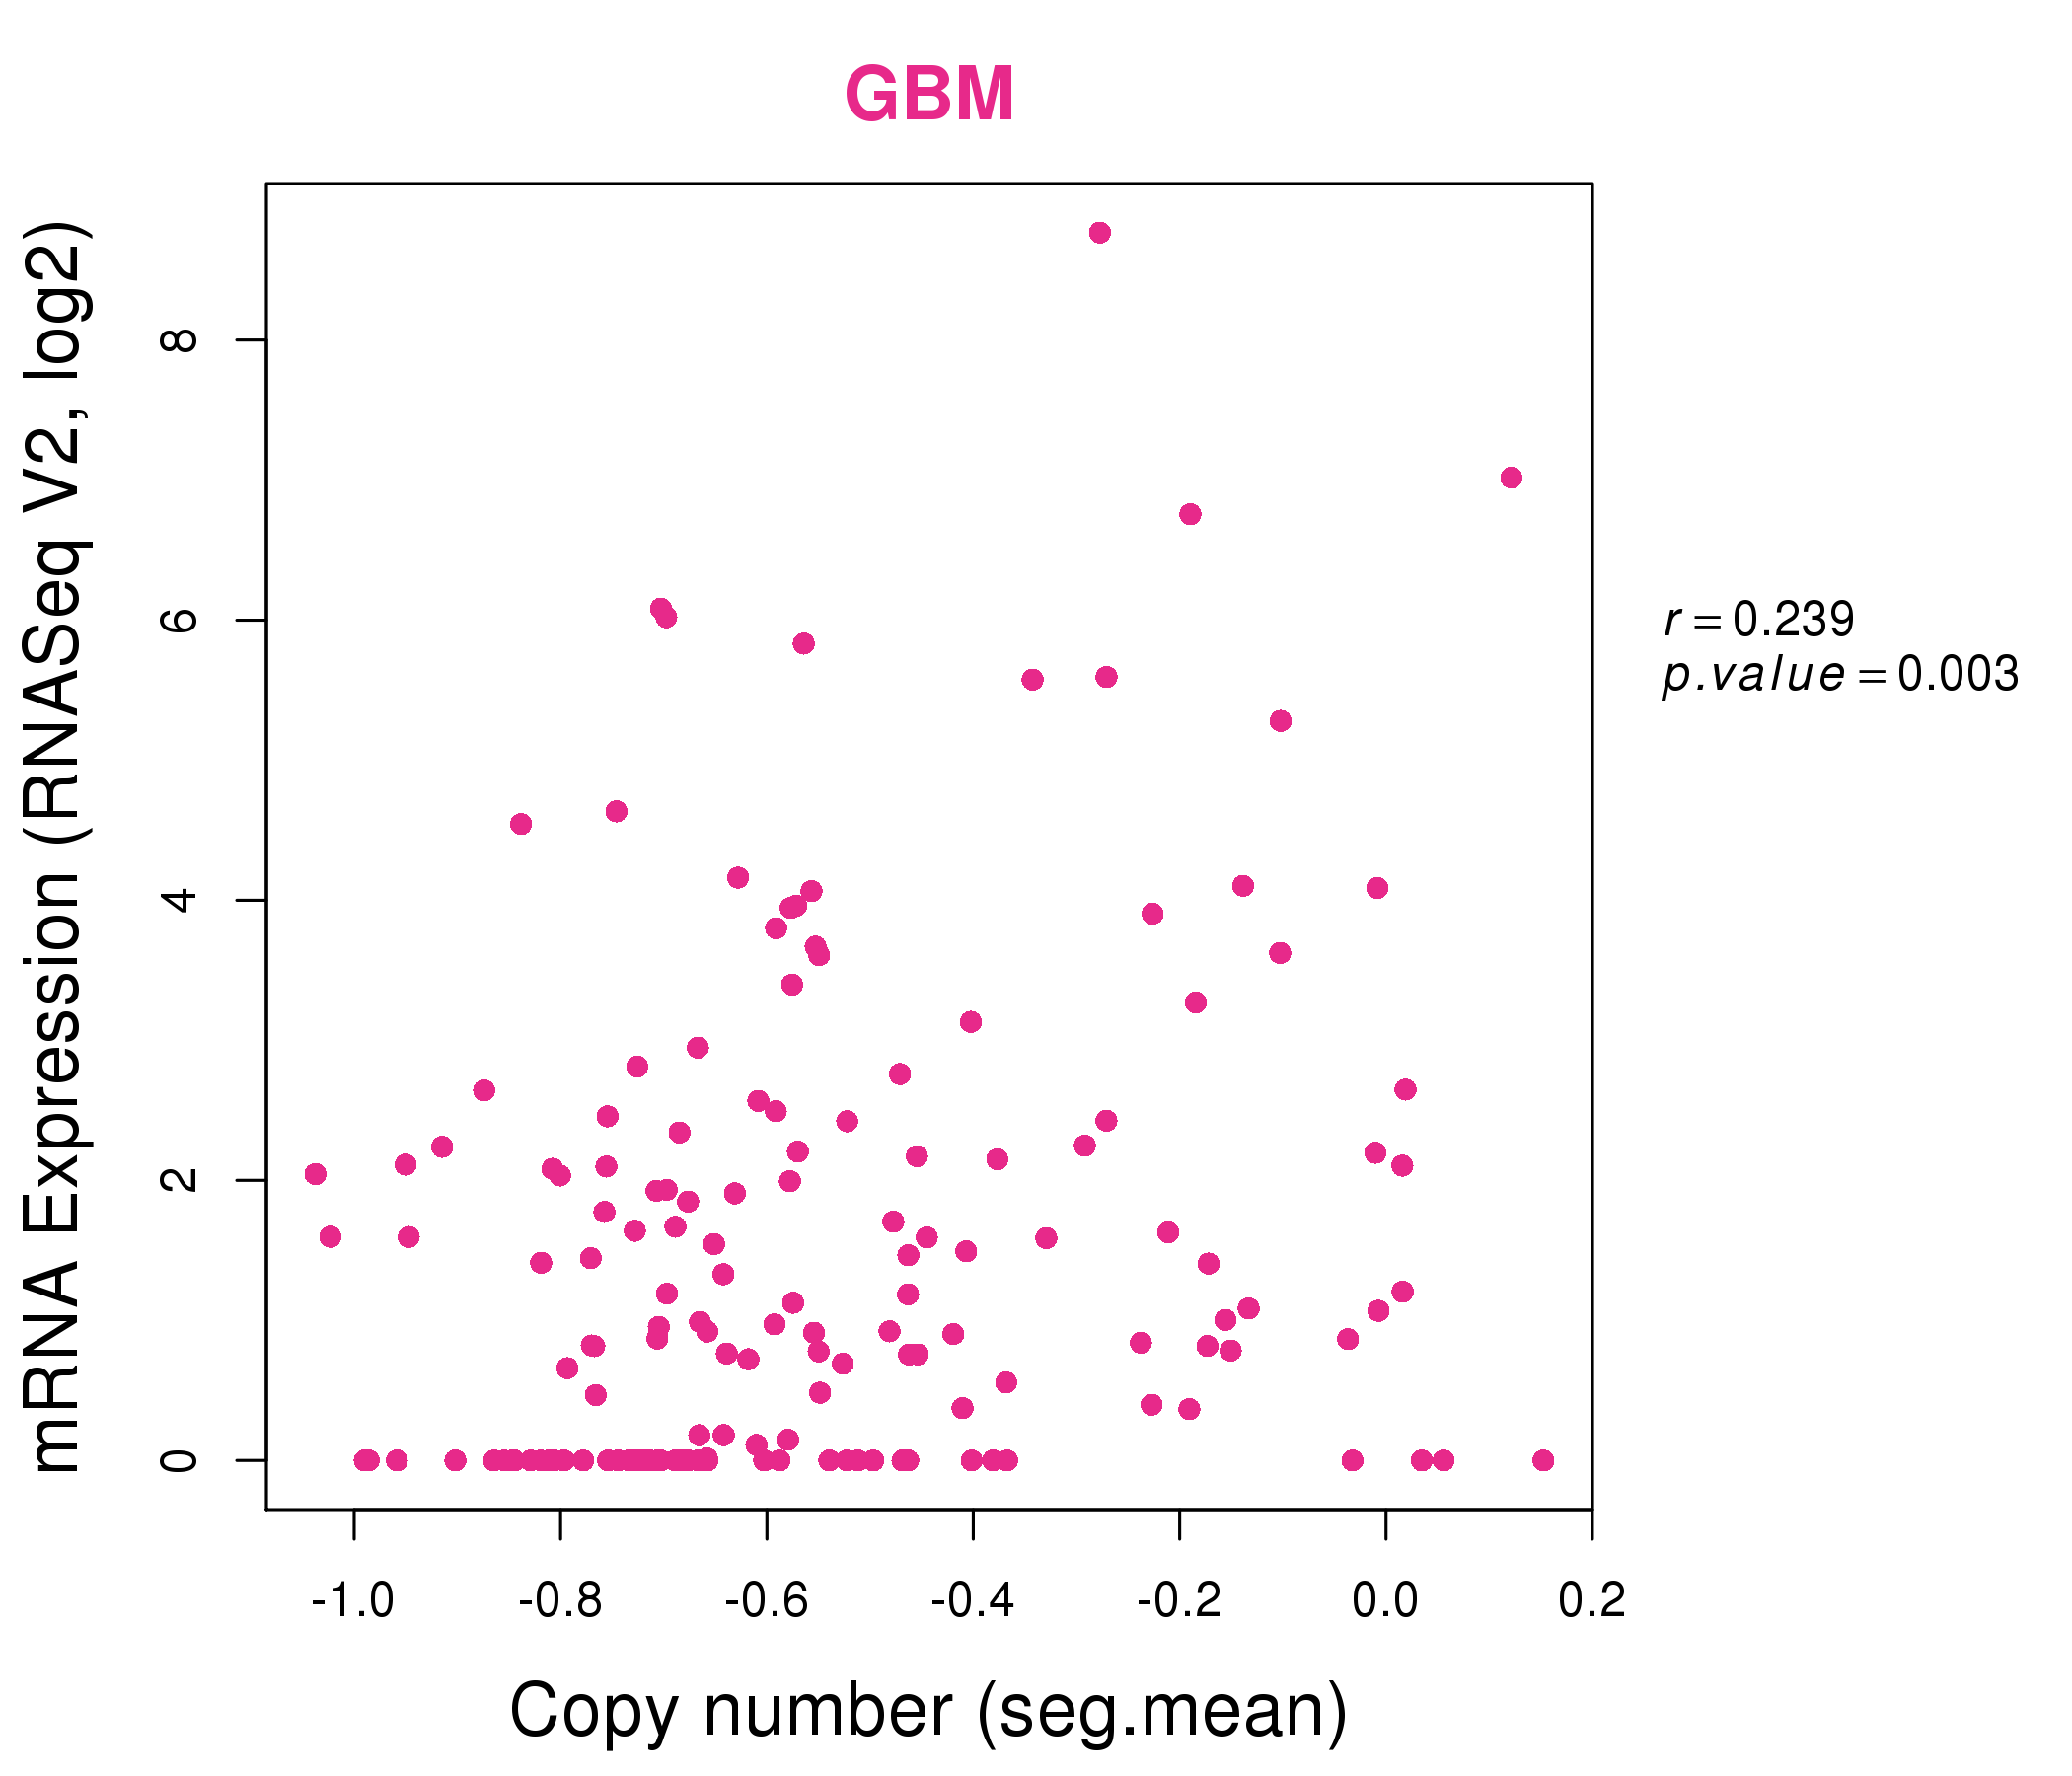
| * This plots show the correlation between CNV and gene expression. |
: Open all plots for all cancer types
 |
|
 |
|
| Top |
| Gene-Gene Network Information |
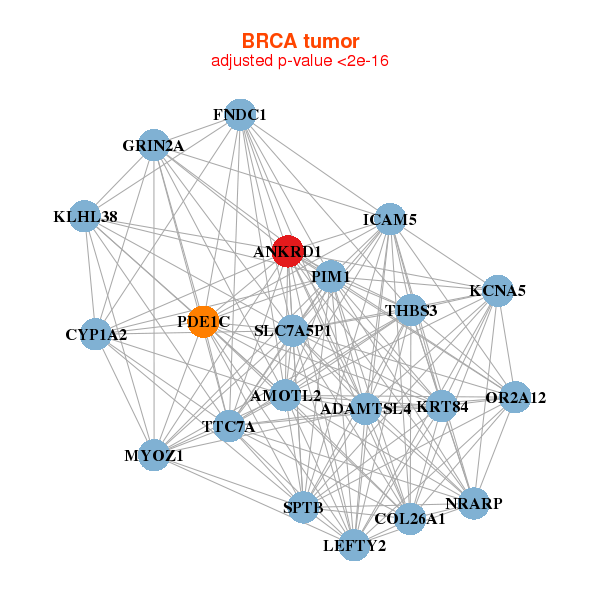
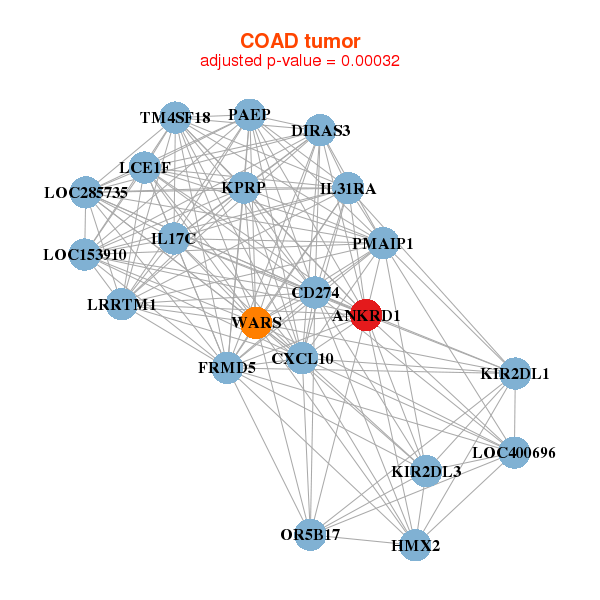
| * Co-Expression network figures were drawn using R package igraph. Only the top 20 genes with the highest correlations were shown. Red circle: input gene, orange circle: cell metabolism gene, sky circle: other gene |
: Open all plots for all cancer types
 |
|
| ADAMTSL4,AMOTL2,ANKRD1,CYP1A2,COL26A1,FNDC1,GRIN2A, ICAM5,KCNA5,KLHL38,KRT84,LEFTY2,MYOZ1,NRARP, OR2A12,PDE1C,PIM1,SLC7A5P1,SPTB,THBS3,TTC7A | ACTA1,ACTN2,ANKRD1,ASB10,MIR1-1HG,SMCO1,CASQ1, PPP1R27,KLHL41,KLHL40,LMOD2,LMOD3,LOC151300,MYH2, MYH6,NEB,OR5H15,P2RX6P,PPP1R3A,SLN,SMPX |
 |
|
| ANKRD1,CD274,CXCL10,DIRAS3,FRMD5,HMX2,IL17C, IL31RA,KIR2DL1,KIR2DL3,KPRP,LCE1F,LOC153910,LOC285735, LOC400696,LRRTM1,OR5B17,PAEP,PMAIP1,TM4SF18,WARS | ANKRD1,CCIN,CELA3A,DRD5,DUSP21,FGF5,HSPA6, IAPP,LOC645166,LINC00152,NEUROD4,PAK1IP1,PCCB,PKD2L1, PSG1,SLC14A2,SLC37A2,SSX8,TMEM211,VCY,XKR3 |
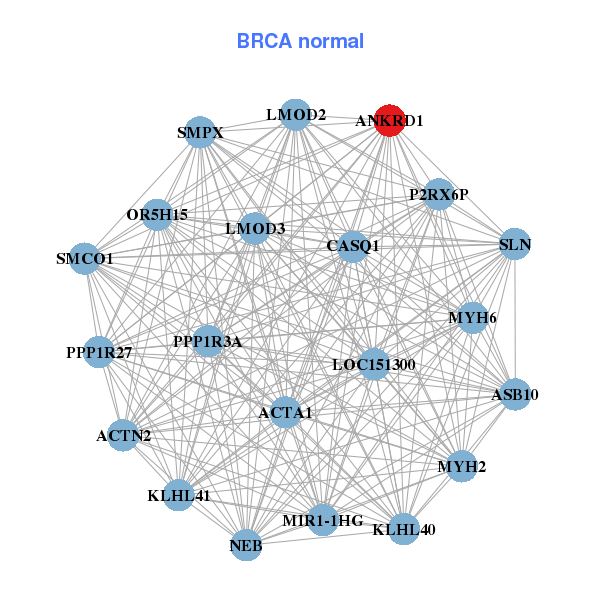

| * Co-Expression network figures were drawn using R package igraph. Only the top 20 genes with the highest correlations were shown. Red circle: input gene, orange circle: cell metabolism gene, sky circle: other gene |
: Open all plots for all cancer types
| Top |
: Open all interacting genes' information including KEGG pathway for all interacting genes from DAVID
| Top |
| Pharmacological Information for ANKRD1 |
| There's no related Drug. |
| Top |
| Cross referenced IDs for ANKRD1 |
| * We obtained these cross-references from Uniprot database. It covers 150 different DBs, 18 categories. http://www.uniprot.org/help/cross_references_section |
: Open all cross reference information
|
Copyright © 2016-Present - The Univsersity of Texas Health Science Center at Houston @ |