|
||||||||||||||||||||
| |
| Phenotypic Information (metabolism pathway, cancer, disease, phenome) |
| |
| |
| Gene-Gene Network Information: Co-Expression Network, Interacting Genes & KEGG |
| |
|


| Gene Summary for PLA2G2E |
| Basic gene info. | Gene symbol | PLA2G2E |
| Gene name | phospholipase A2, group IIE | |
| Synonyms | GIIE sPLA2|sPLA2-IIE | |
| Cytomap | UCSC genome browser: 1p36.13 | |
| Genomic location | chr1 :20246799-20250110 | |
| Type of gene | protein-coding | |
| RefGenes | NM_014589.2, | |
| Ensembl id | ENSG00000188784 | |
| Description | group IIE secretory phospholipase A2phosphatidylcholine 2-acylhydrolase 2E | |
| Modification date | 20141207 | |
| dbXrefs | HGNC : HGNC | |
| HPRD : 07143 | ||
| Protein | UniProt: go to UniProt's Cross Reference DB Table | |
| Expression | CleanEX: HS_PLA2G2E | |
| BioGPS: 30814 | ||
| Gene Expression Atlas: ENSG00000188784 | ||
| The Human Protein Atlas: ENSG00000188784 | ||
| Pathway | NCI Pathway Interaction Database: PLA2G2E | |
| KEGG: PLA2G2E | ||
| REACTOME: PLA2G2E | ||
| ConsensusPathDB | ||
| Pathway Commons: PLA2G2E | ||
| Metabolism | MetaCyc: PLA2G2E | |
| HUMANCyc: PLA2G2E | ||
| Regulation | Ensembl's Regulation: ENSG00000188784 | |
| miRBase: chr1 :20,246,799-20,250,110 | ||
| TargetScan: NM_014589 | ||
| cisRED: ENSG00000188784 | ||
| Context | iHOP: PLA2G2E | |
| cancer metabolism search in PubMed: PLA2G2E | ||
| UCL Cancer Institute: PLA2G2E | ||
| Assigned class in ccmGDB | C | |
| Top |
| Phenotypic Information for PLA2G2E(metabolism pathway, cancer, disease, phenome) |
| Cancer | CGAP: PLA2G2E |
| Familial Cancer Database: PLA2G2E | |
| * This gene is included in those cancer gene databases. |
|
|
|
|
|
| . | ||||||||||||||
Oncogene 1 | Significant driver gene in | |||||||||||||||||||
| cf) number; DB name 1 Oncogene; http://nar.oxfordjournals.org/content/35/suppl_1/D721.long, 2 Tumor Suppressor gene; https://bioinfo.uth.edu/TSGene/, 3 Cancer Gene Census; http://www.nature.com/nrc/journal/v4/n3/abs/nrc1299.html, 4 CancerGenes; http://nar.oxfordjournals.org/content/35/suppl_1/D721.long, 5 Network of Cancer Gene; http://ncg.kcl.ac.uk/index.php, 1Therapeutic Vulnerabilities in Cancer; http://cbio.mskcc.org/cancergenomics/statius/ |
| KEGG_GLYCEROPHOSPHOLIPID_METABOLISM KEGG_ARACHIDONIC_ACID_METABOLISM KEGG_LINOLEIC_ACID_METABOLISM KEGG_ALPHA_LINOLENIC_ACID_METABOLISM REACTOME_PHOSPHOLIPID_METABOLISM REACTOME_METABOLISM_OF_LIPIDS_AND_LIPOPROTEINS | |
| Mutations for PLA2G2E |
| * Under tables are showing count per each tissue to give us broad intuition about tissue specific mutation patterns.You can go to the detailed page for each mutation database's web site. |
| There's no structural variation information in COSMIC data for this gene. |
| * From mRNA Sanger sequences, Chitars2.0 arranged chimeric transcripts. This table shows PLA2G2E related fusion information. |
| ID | Head Gene | Tail Gene | Accession | Gene_a | qStart_a | qEnd_a | Chromosome_a | tStart_a | tEnd_a | Gene_a | qStart_a | qEnd_a | Chromosome_a | tStart_a | tEnd_a |
| Top |
| There's no copy number variation information in COSMIC data for this gene. |
| Top |
|
 |
| Top |
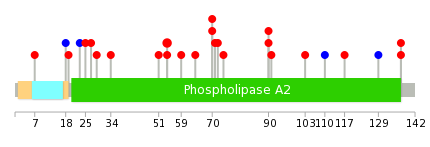
| Stat. for Non-Synonymous SNVs (# total SNVs=14) | (# total SNVs=4) |
 |  |
(# total SNVs=0) | (# total SNVs=0) |
| Top |
| * When you move the cursor on each content, you can see more deailed mutation information on the Tooltip. Those are primary_site,primary_histology,mutation(aa),pubmedID. |
| GRCh37 position | Mutation(aa) | Unique sampleID count |
| chr1:20249129-20249129 | p.P54S | 3 |
| chr1:20248809-20248809 | p.E90Q | 2 |
| chr1:20246820-20246820 | p.G137W | 2 |
| chr1:20248789-20248789 | p.? | 2 |
| chr1:20249177-20249177 | p.Q38* | 1 |
| chr1:20249189-20249189 | p.K34Q | 1 |
| chr1:20248856-20248856 | p.K74R | 1 |
| chr1:20249202-20249202 | p.E29D | 1 |
| chr1:20248863-20248863 | p.L72M | 1 |
| chr1:20249204-20249204 | p.E29* | 1 |
| Top |
|
 |
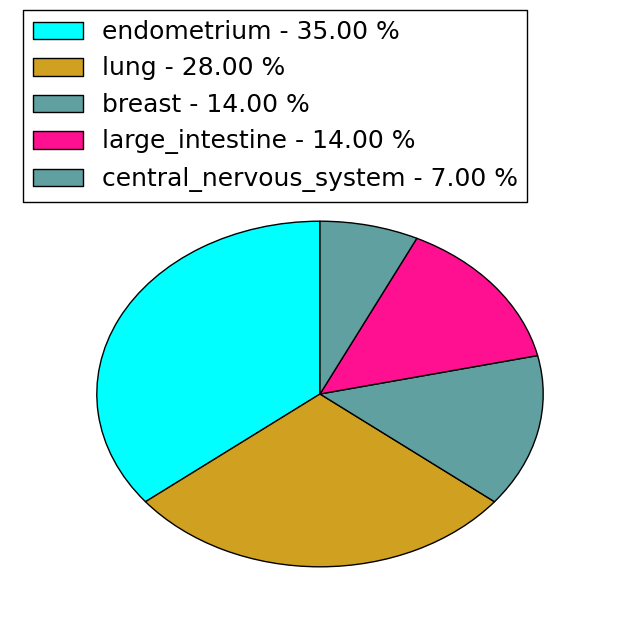
| Point Mutation/ Tissue ID | 1 | 2 | 3 | 4 | 5 | 6 | 7 | 8 | 9 | 10 | 11 | 12 | 13 | 14 | 15 | 16 | 17 | 18 | 19 | 20 |
| # sample | 3 | 1 | 4 | 1 | 2 | 1 | 4 | 4 | 4 | |||||||||||
| # mutation | 3 | 1 | 4 | 1 | 2 | 1 | 4 | 4 | 4 | |||||||||||
| nonsynonymous SNV | 3 | 1 | 2 | 1 | 1 | 4 | 4 | 4 | ||||||||||||
| synonymous SNV | 2 | 1 | 1 |
| cf) Tissue ID; Tissue type (1; BLCA[Bladder Urothelial Carcinoma], 2; BRCA[Breast invasive carcinoma], 3; CESC[Cervical squamous cell carcinoma and endocervical adenocarcinoma], 4; COAD[Colon adenocarcinoma], 5; GBM[Glioblastoma multiforme], 6; Glioma Low Grade, 7; HNSC[Head and Neck squamous cell carcinoma], 8; KICH[Kidney Chromophobe], 9; KIRC[Kidney renal clear cell carcinoma], 10; KIRP[Kidney renal papillary cell carcinoma], 11; LAML[Acute Myeloid Leukemia], 12; LUAD[Lung adenocarcinoma], 13; LUSC[Lung squamous cell carcinoma], 14; OV[Ovarian serous cystadenocarcinoma ], 15; PAAD[Pancreatic adenocarcinoma], 16; PRAD[Prostate adenocarcinoma], 17; SKCM[Skin Cutaneous Melanoma], 18:STAD[Stomach adenocarcinoma], 19:THCA[Thyroid carcinoma], 20:UCEC[Uterine Corpus Endometrial Carcinoma]) |
| Top |
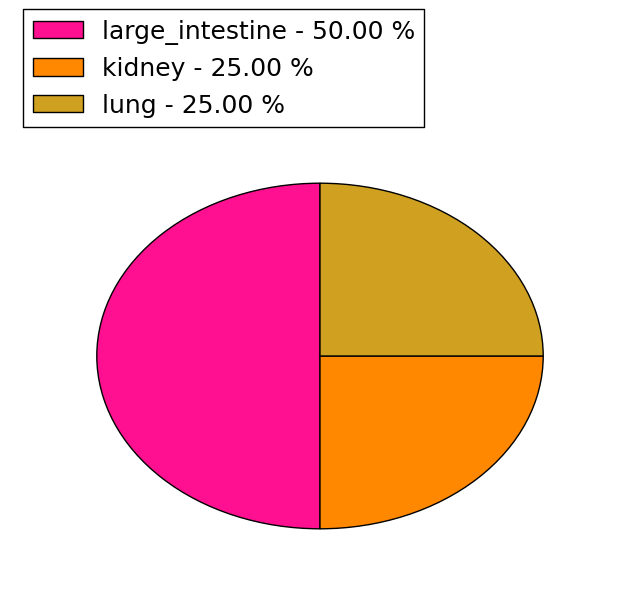
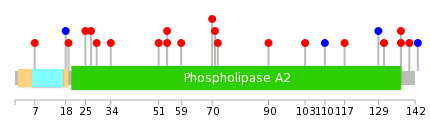
| * We represented just top 10 SNVs. When you move the cursor on each content, you can see more deailed mutation information on the Tooltip. Those are primary_site, primary_histology, mutation(aa), pubmedID. |
| Genomic Position | Mutation(aa) | Unique sampleID count |
| chr1:20246820 | p.P54T | 2 |
| chr1:20249129 | p.G137R | 2 |
| chr1:20249208 | p.R71S | 1 |
| chr1:20246922 | p.G70R | 1 |
| chr1:20249215 | p.D59Y | 1 |
| chr1:20248809 | p.S51C | 1 |
| chr1:20249233 | p.K34E | 1 |
| chr1:20248863 | p.X143X | 1 |
| chr1:20249235 | p.E29D | 1 |
| chr1:20248866 | p.P140T | 1 |
| * Copy number data were extracted from TCGA using R package TCGA-Assembler. The URLs of all public data files on TCGA DCC data server were gathered on Jan-05-2015. Function ProcessCNAData in TCGA-Assembler package was used to obtain gene-level copy number value which is calculated as the average copy number of the genomic region of a gene. |
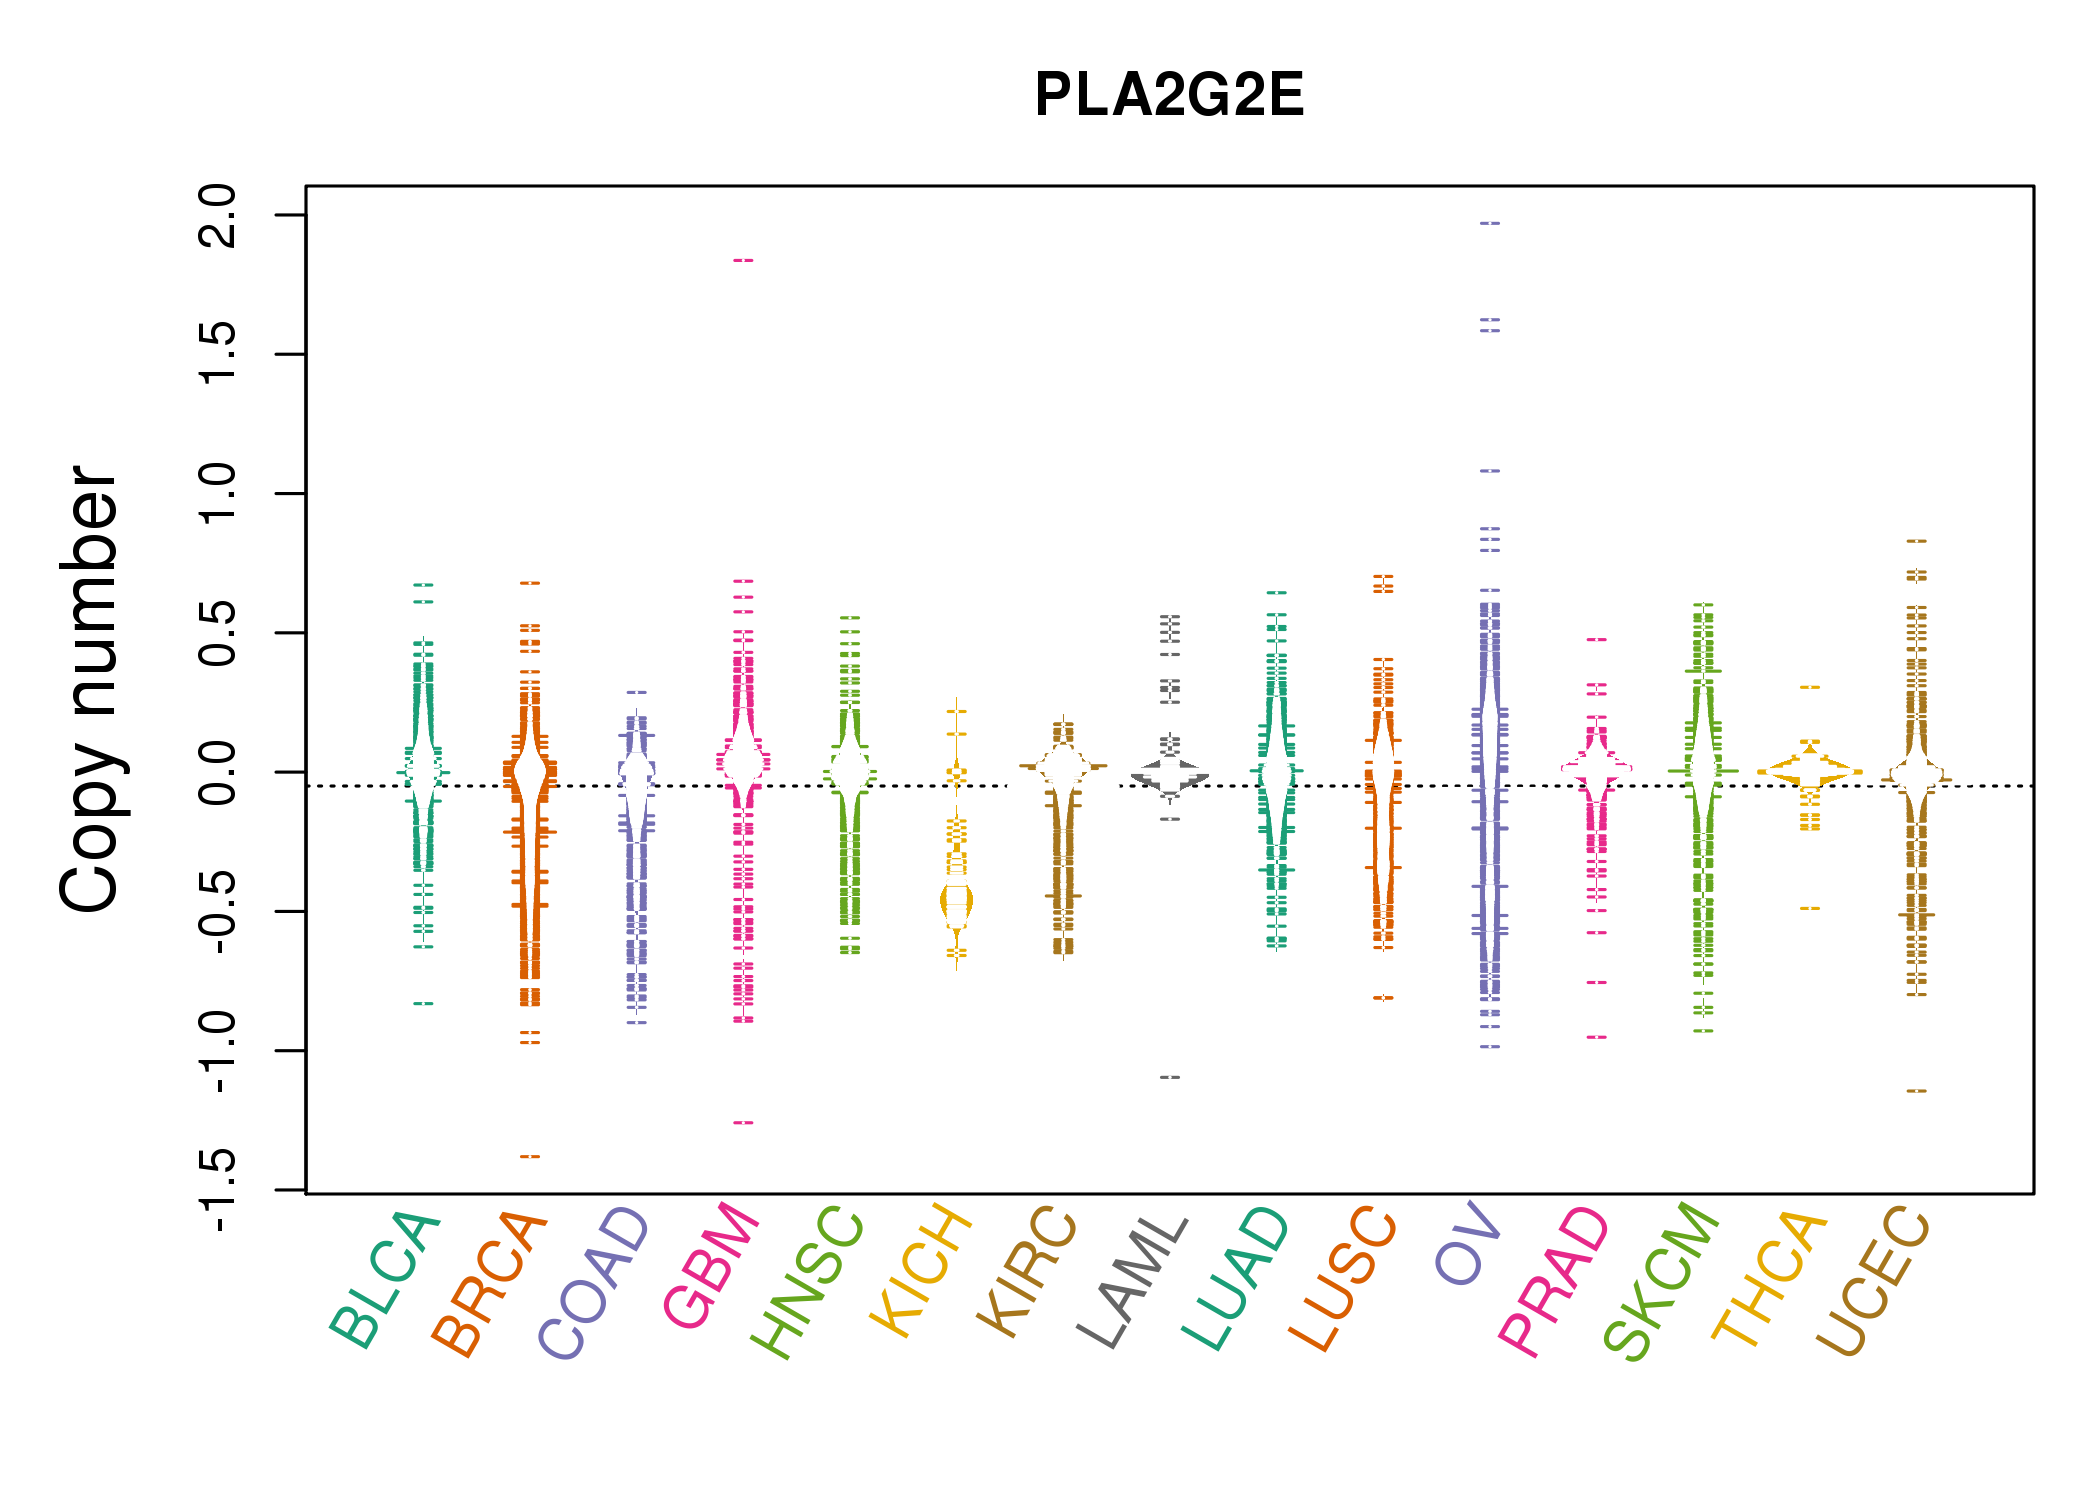 |
| cf) Tissue ID[Tissue type]: BLCA[Bladder Urothelial Carcinoma], BRCA[Breast invasive carcinoma], CESC[Cervical squamous cell carcinoma and endocervical adenocarcinoma], COAD[Colon adenocarcinoma], GBM[Glioblastoma multiforme], Glioma Low Grade, HNSC[Head and Neck squamous cell carcinoma], KICH[Kidney Chromophobe], KIRC[Kidney renal clear cell carcinoma], KIRP[Kidney renal papillary cell carcinoma], LAML[Acute Myeloid Leukemia], LUAD[Lung adenocarcinoma], LUSC[Lung squamous cell carcinoma], OV[Ovarian serous cystadenocarcinoma ], PAAD[Pancreatic adenocarcinoma], PRAD[Prostate adenocarcinoma], SKCM[Skin Cutaneous Melanoma], STAD[Stomach adenocarcinoma], THCA[Thyroid carcinoma], UCEC[Uterine Corpus Endometrial Carcinoma] |
| Top |
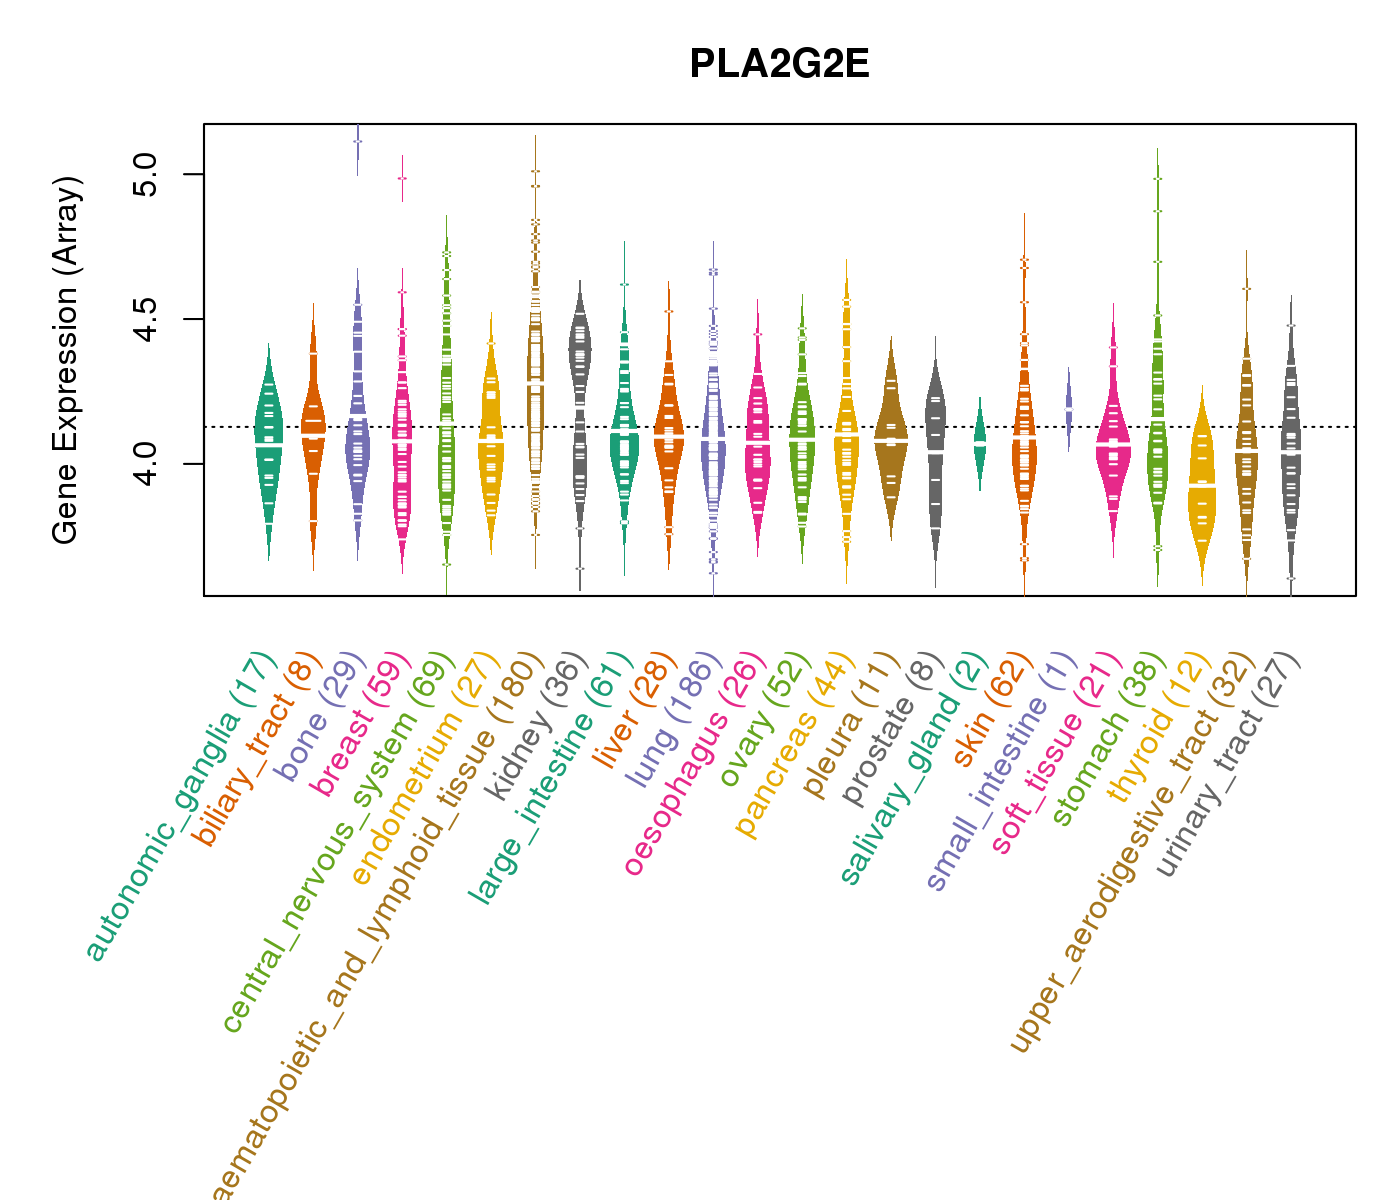
| Gene Expression for PLA2G2E |
| * CCLE gene expression data were extracted from CCLE_Expression_Entrez_2012-10-18.res: Gene-centric RMA-normalized mRNA expression data. |
 |
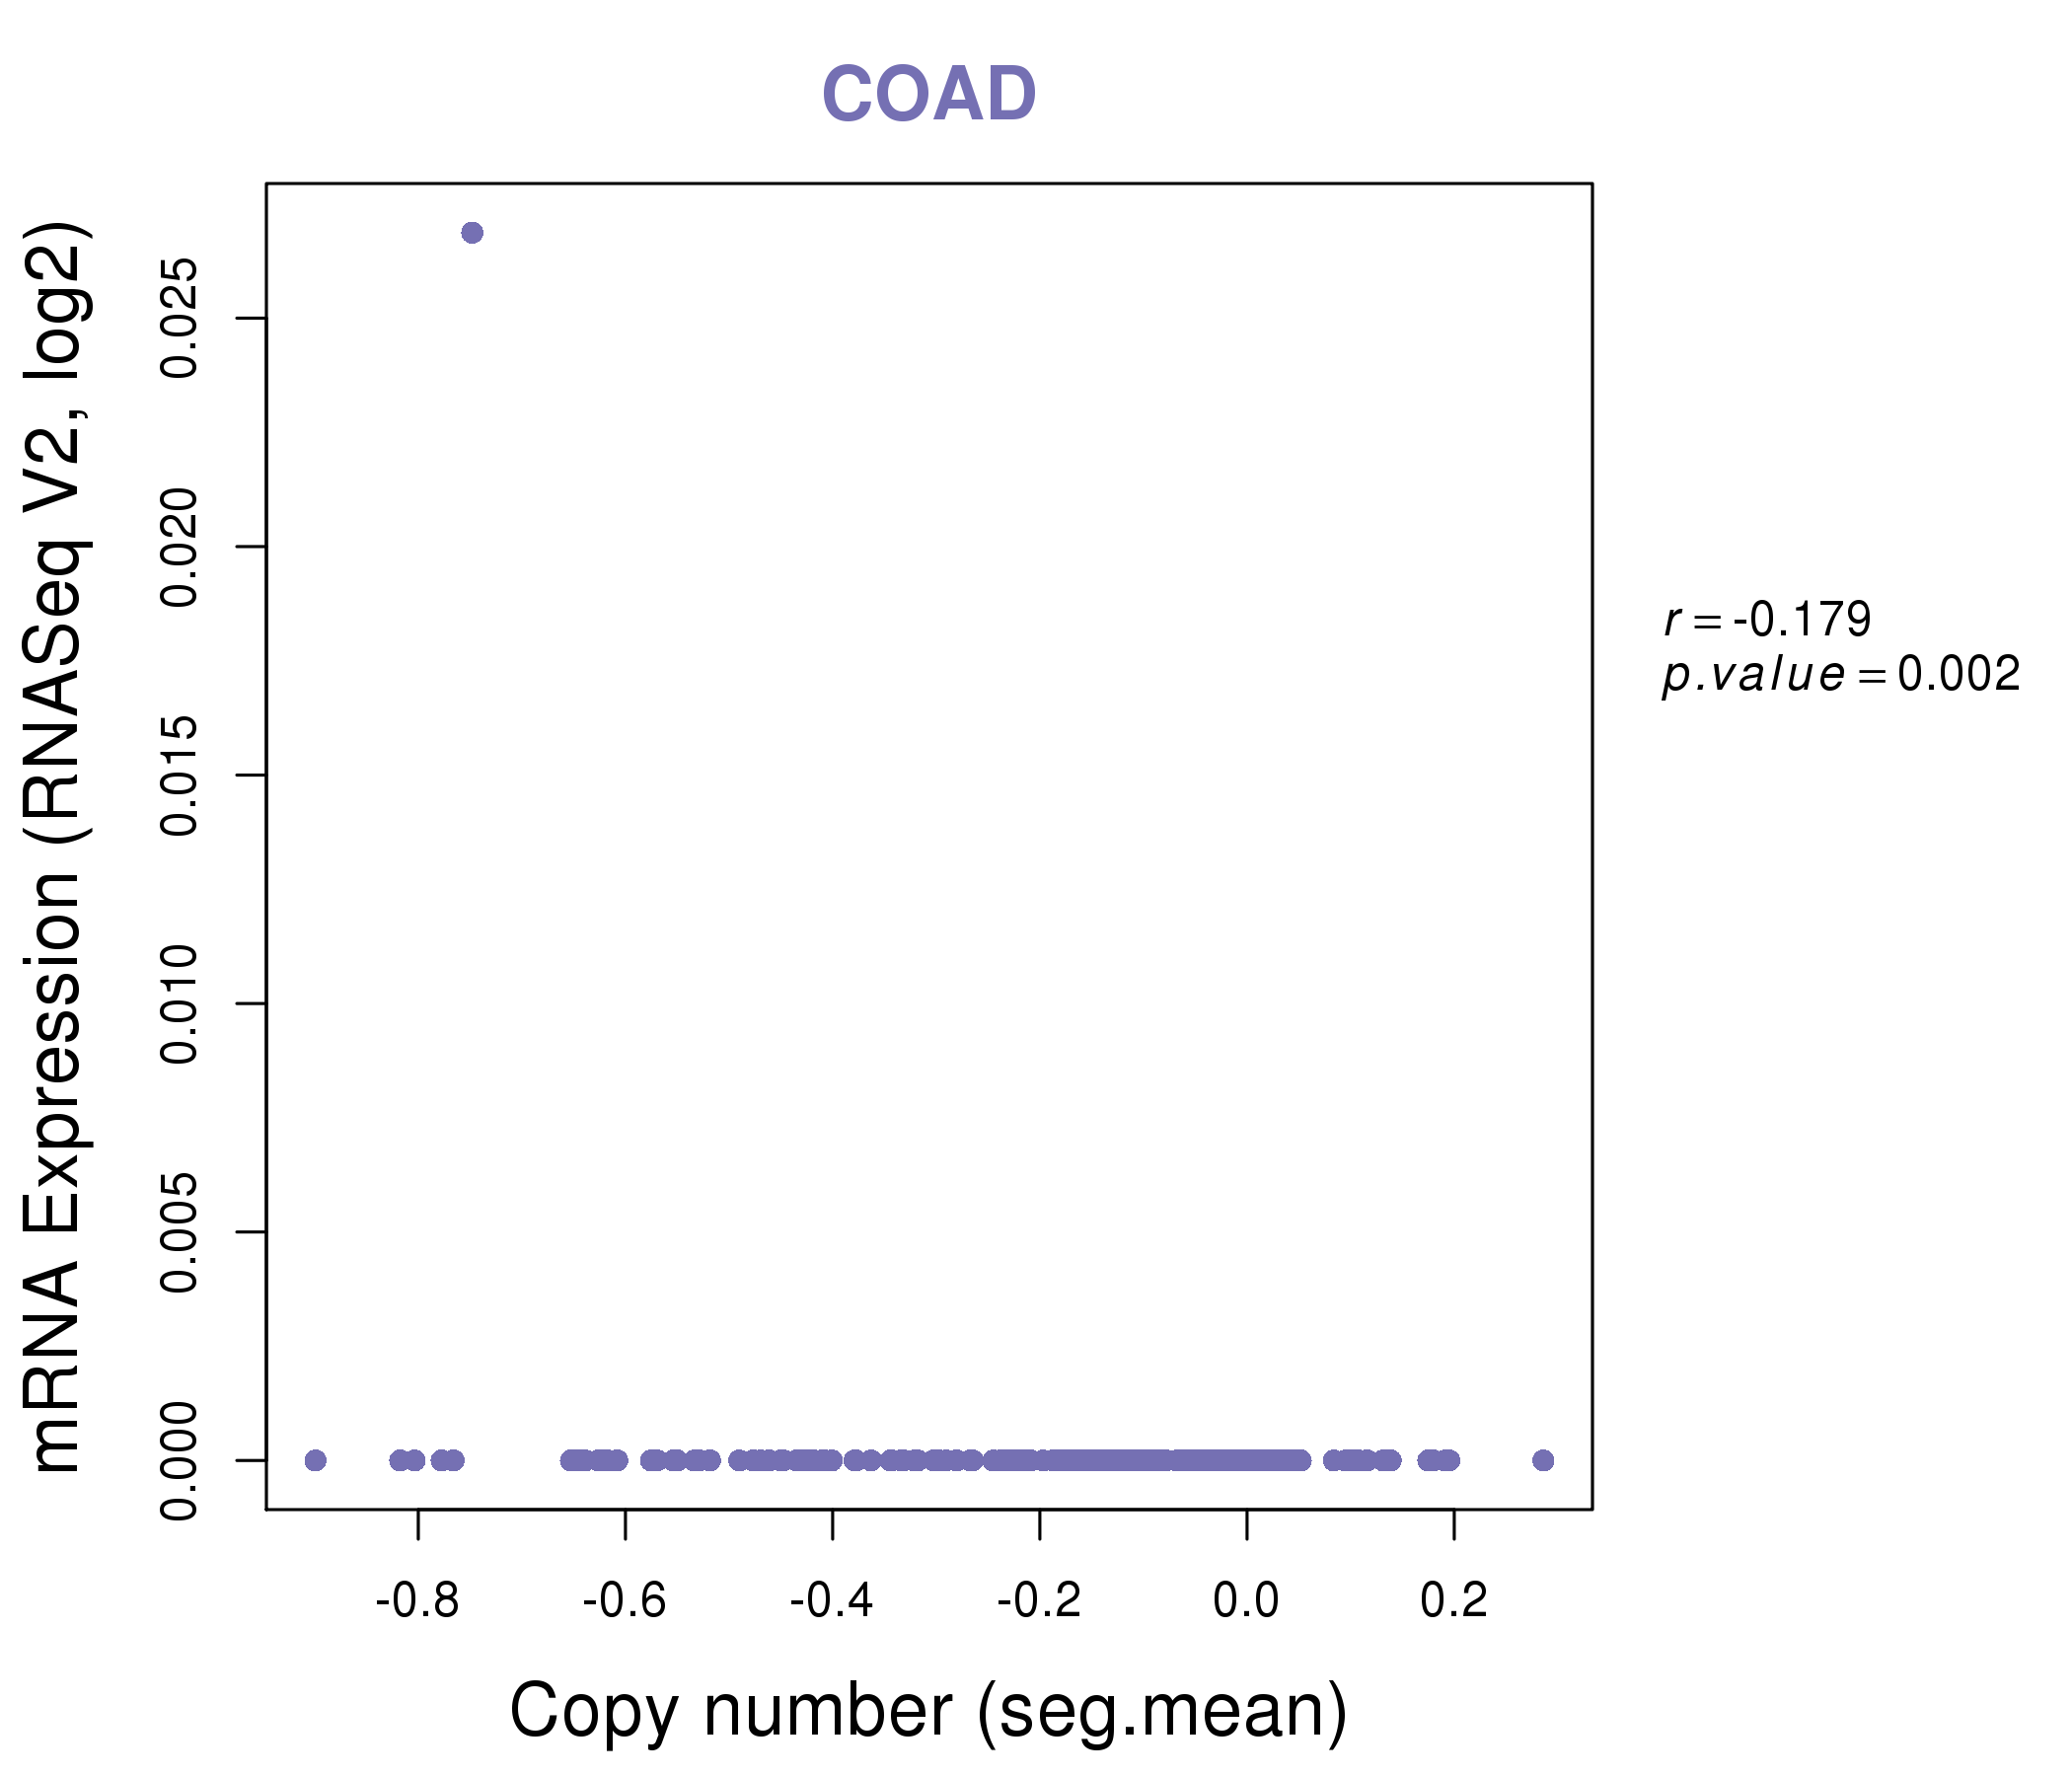
| * Normalized gene expression data of RNASeqV2 was extracted from TCGA using R package TCGA-Assembler. The URLs of all public data files on TCGA DCC data server were gathered at Jan-05-2015. Only eight cancer types have enough normal control samples for differential expression analysis. (t test, adjusted p<0.05 (using Benjamini-Hochberg FDR)) |
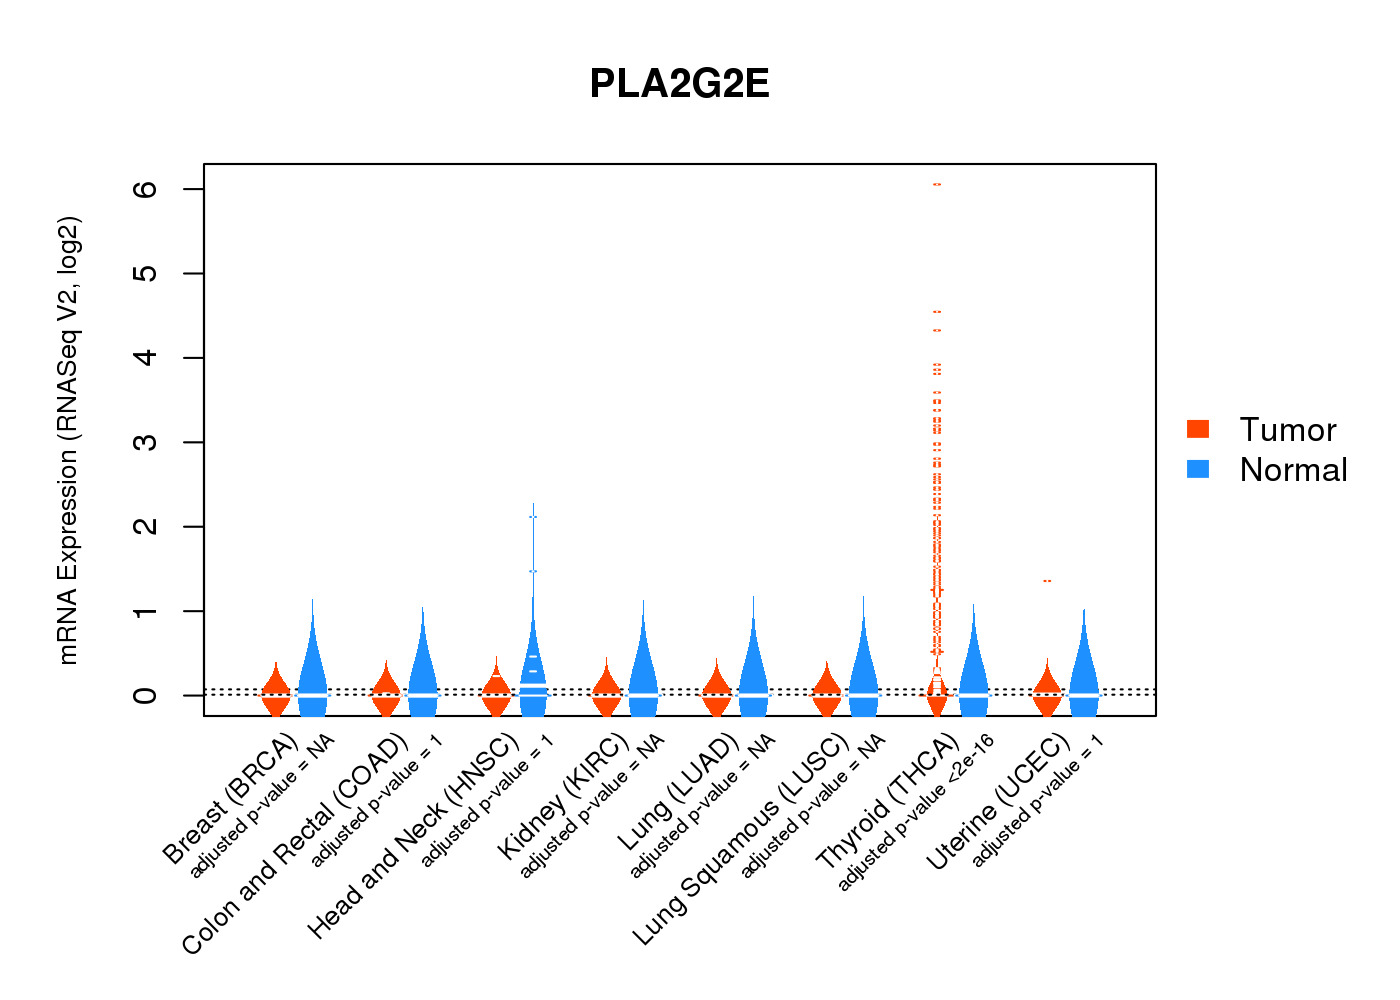 |
| Top |
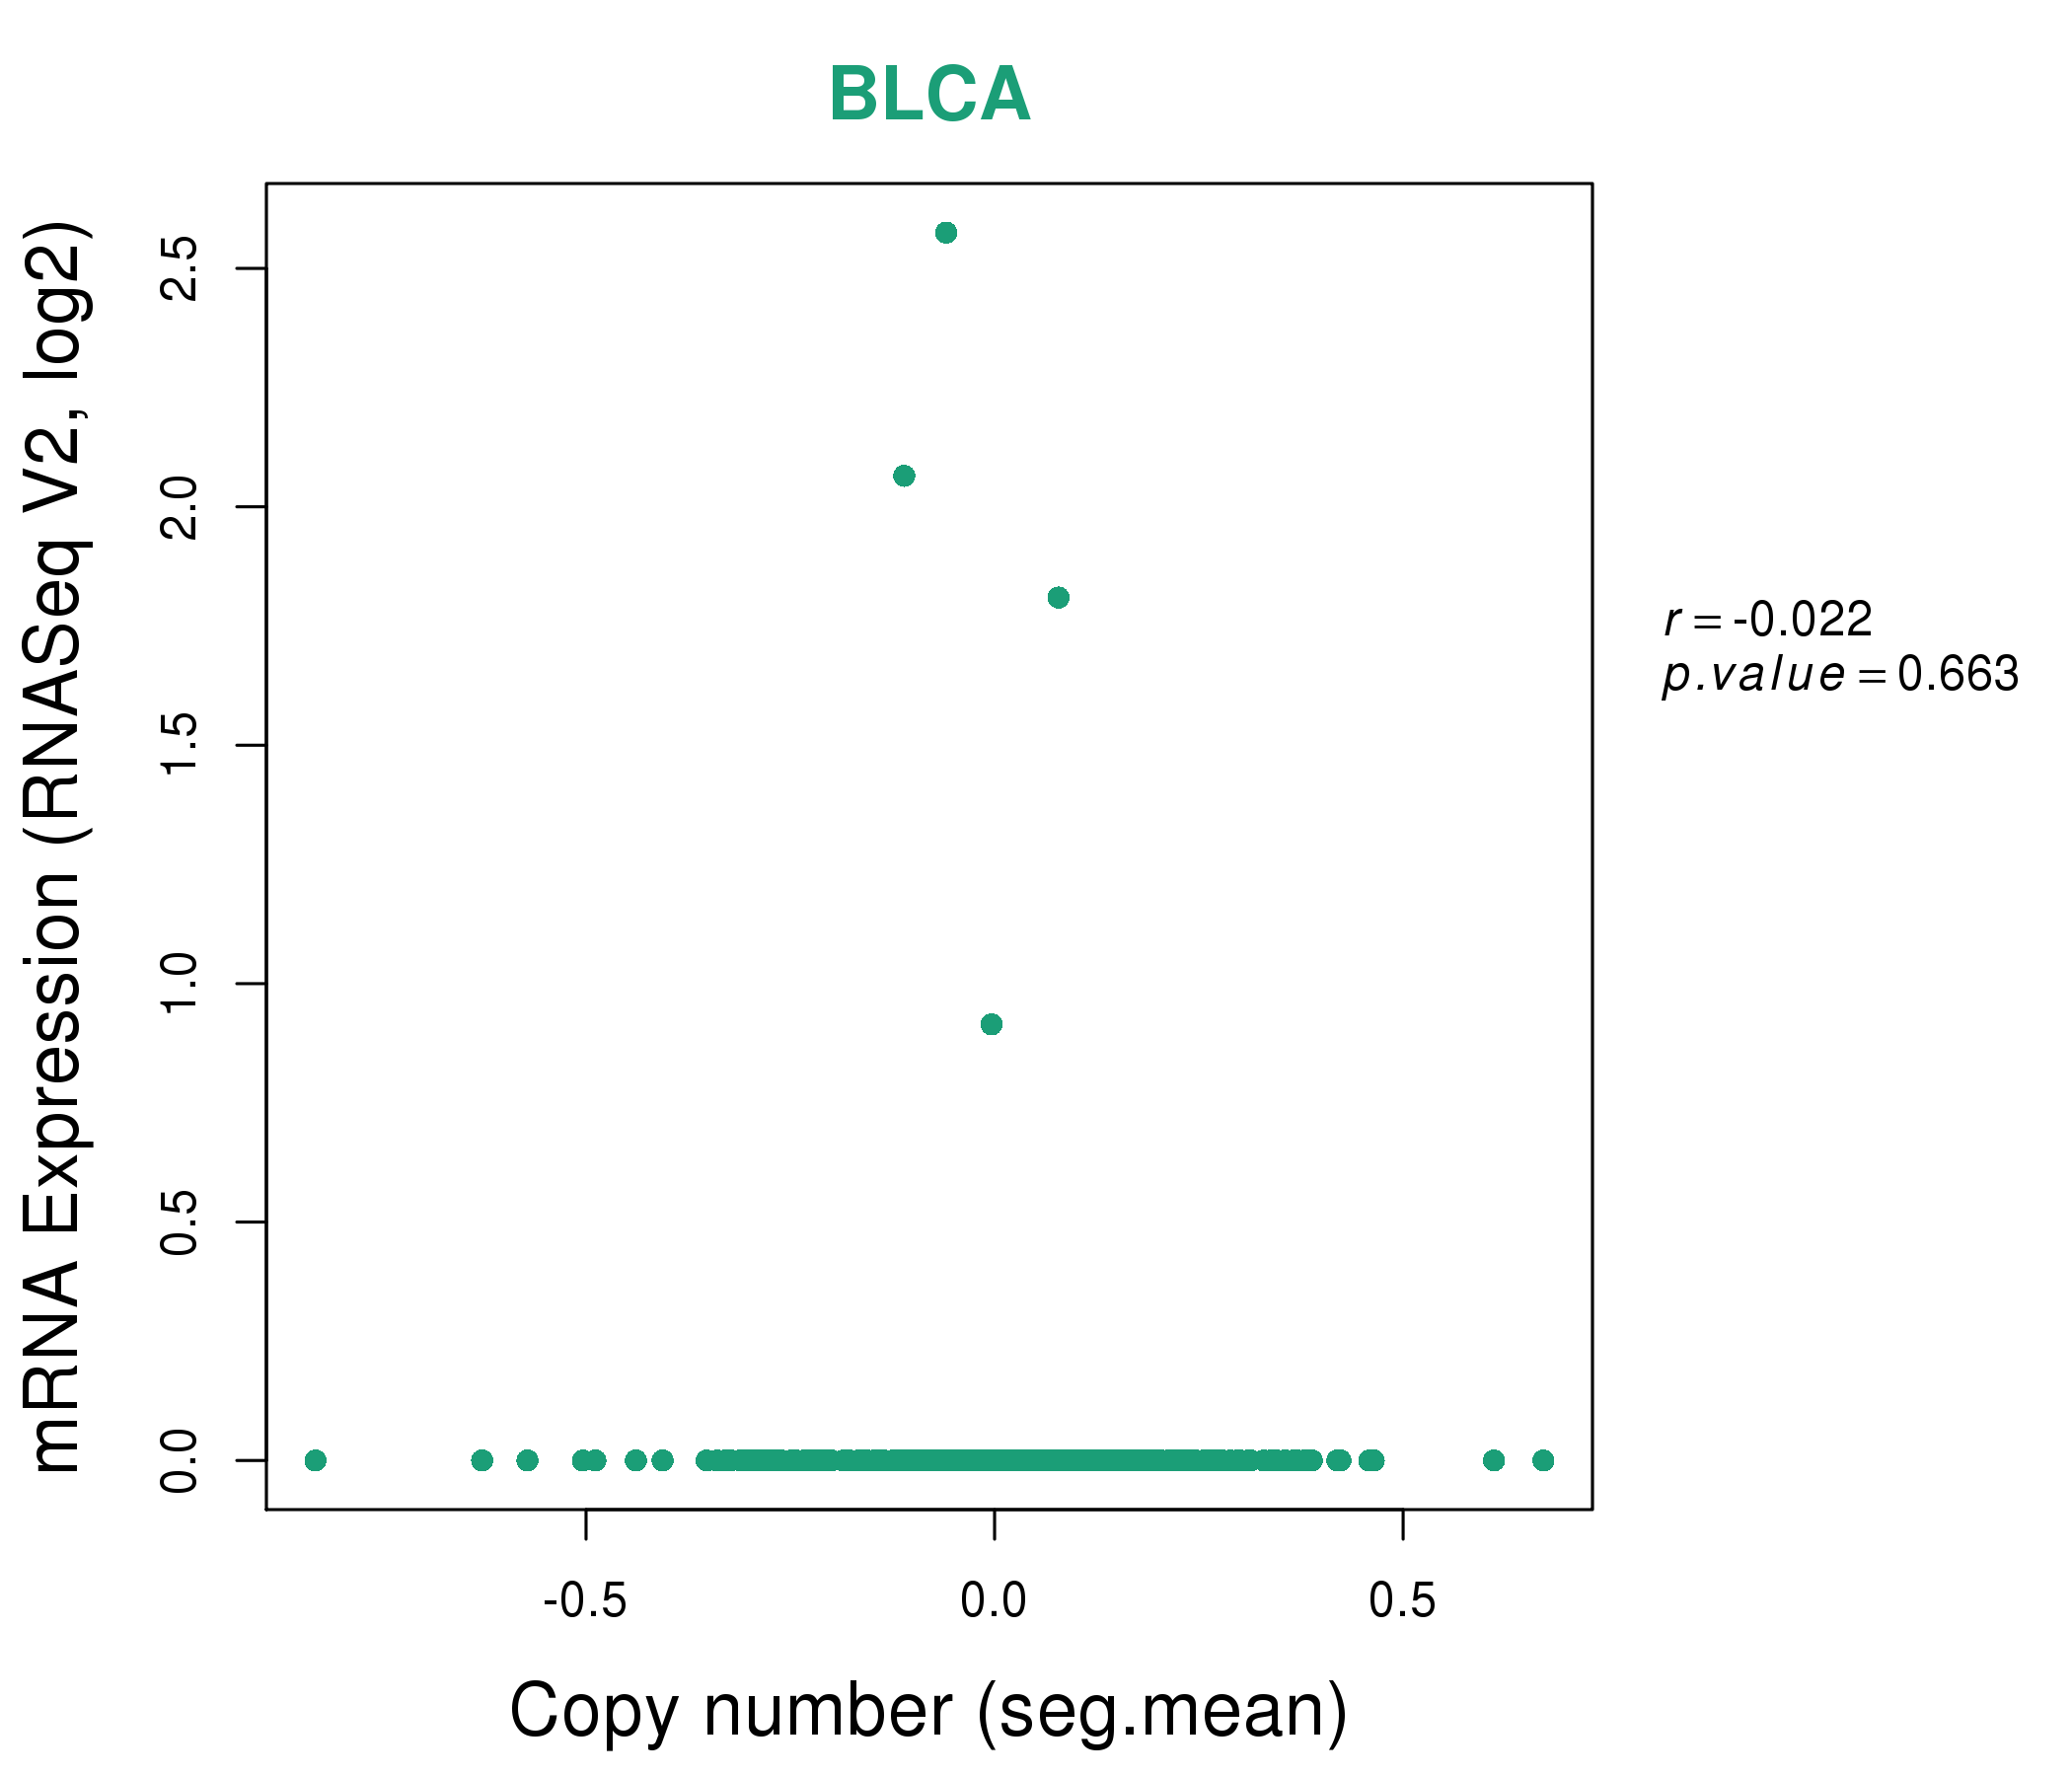
| * This plots show the correlation between CNV and gene expression. |
: Open all plots for all cancer types
 |
|
 |
|


| Top |
| Gene-Gene Network Information |
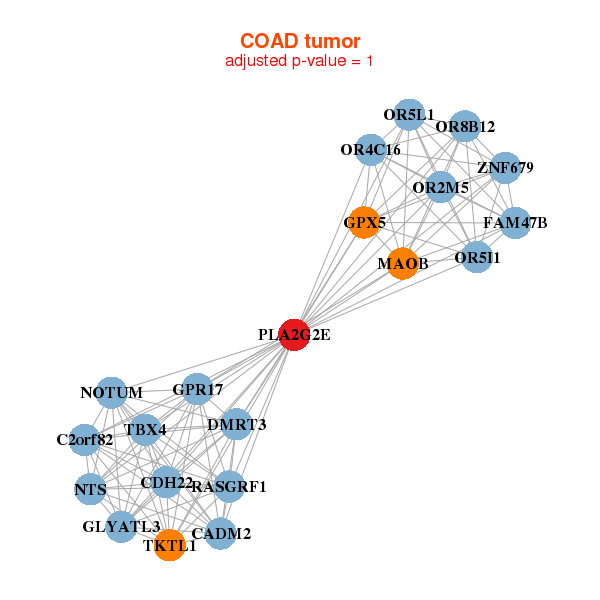
| * Co-Expression network figures were drawn using R package igraph. Only the top 20 genes with the highest correlations were shown. Red circle: input gene, orange circle: cell metabolism gene, sky circle: other gene |
: Open all plots for all cancer types
 |
| ||||
| NA,NA,NA,NA,NA,NA,NA, NA,NA,NA,NA,NA,NA,NA, NA,NA,NA,NA,NA,NA,NA | NA,NA,NA,NA,NA,NA,NA, NA,NA,NA,NA,NA,NA,NA, NA,NA,NA,NA,NA,NA,NA | ||||
 |
| ||||
| C2orf82,CADM2,CDH22,DMRT3,FAM47B,GLYATL3,GPR17, GPX5,MAOB,NOTUM,NTS,OR2M5,OR4C16,OR5I1, OR5L1,OR8B12,PLA2G2E,RASGRF1,TBX4,TKTL1,ZNF679 | NA,NA,NA,NA,NA,NA,NA, NA,NA,NA,NA,NA,NA,NA, NA,NA,NA,NA,NA,NA,NA |

| * Co-Expression network figures were drawn using R package igraph. Only the top 20 genes with the highest correlations were shown. Red circle: input gene, orange circle: cell metabolism gene, sky circle: other gene |
: Open all plots for all cancer types
| Top |
: Open all interacting genes' information including KEGG pathway for all interacting genes from DAVID
| Top |
| Pharmacological Information for PLA2G2E |
| DB Category | DB Name | DB's ID and Url link |
| * Gene Centered Interaction Network. |
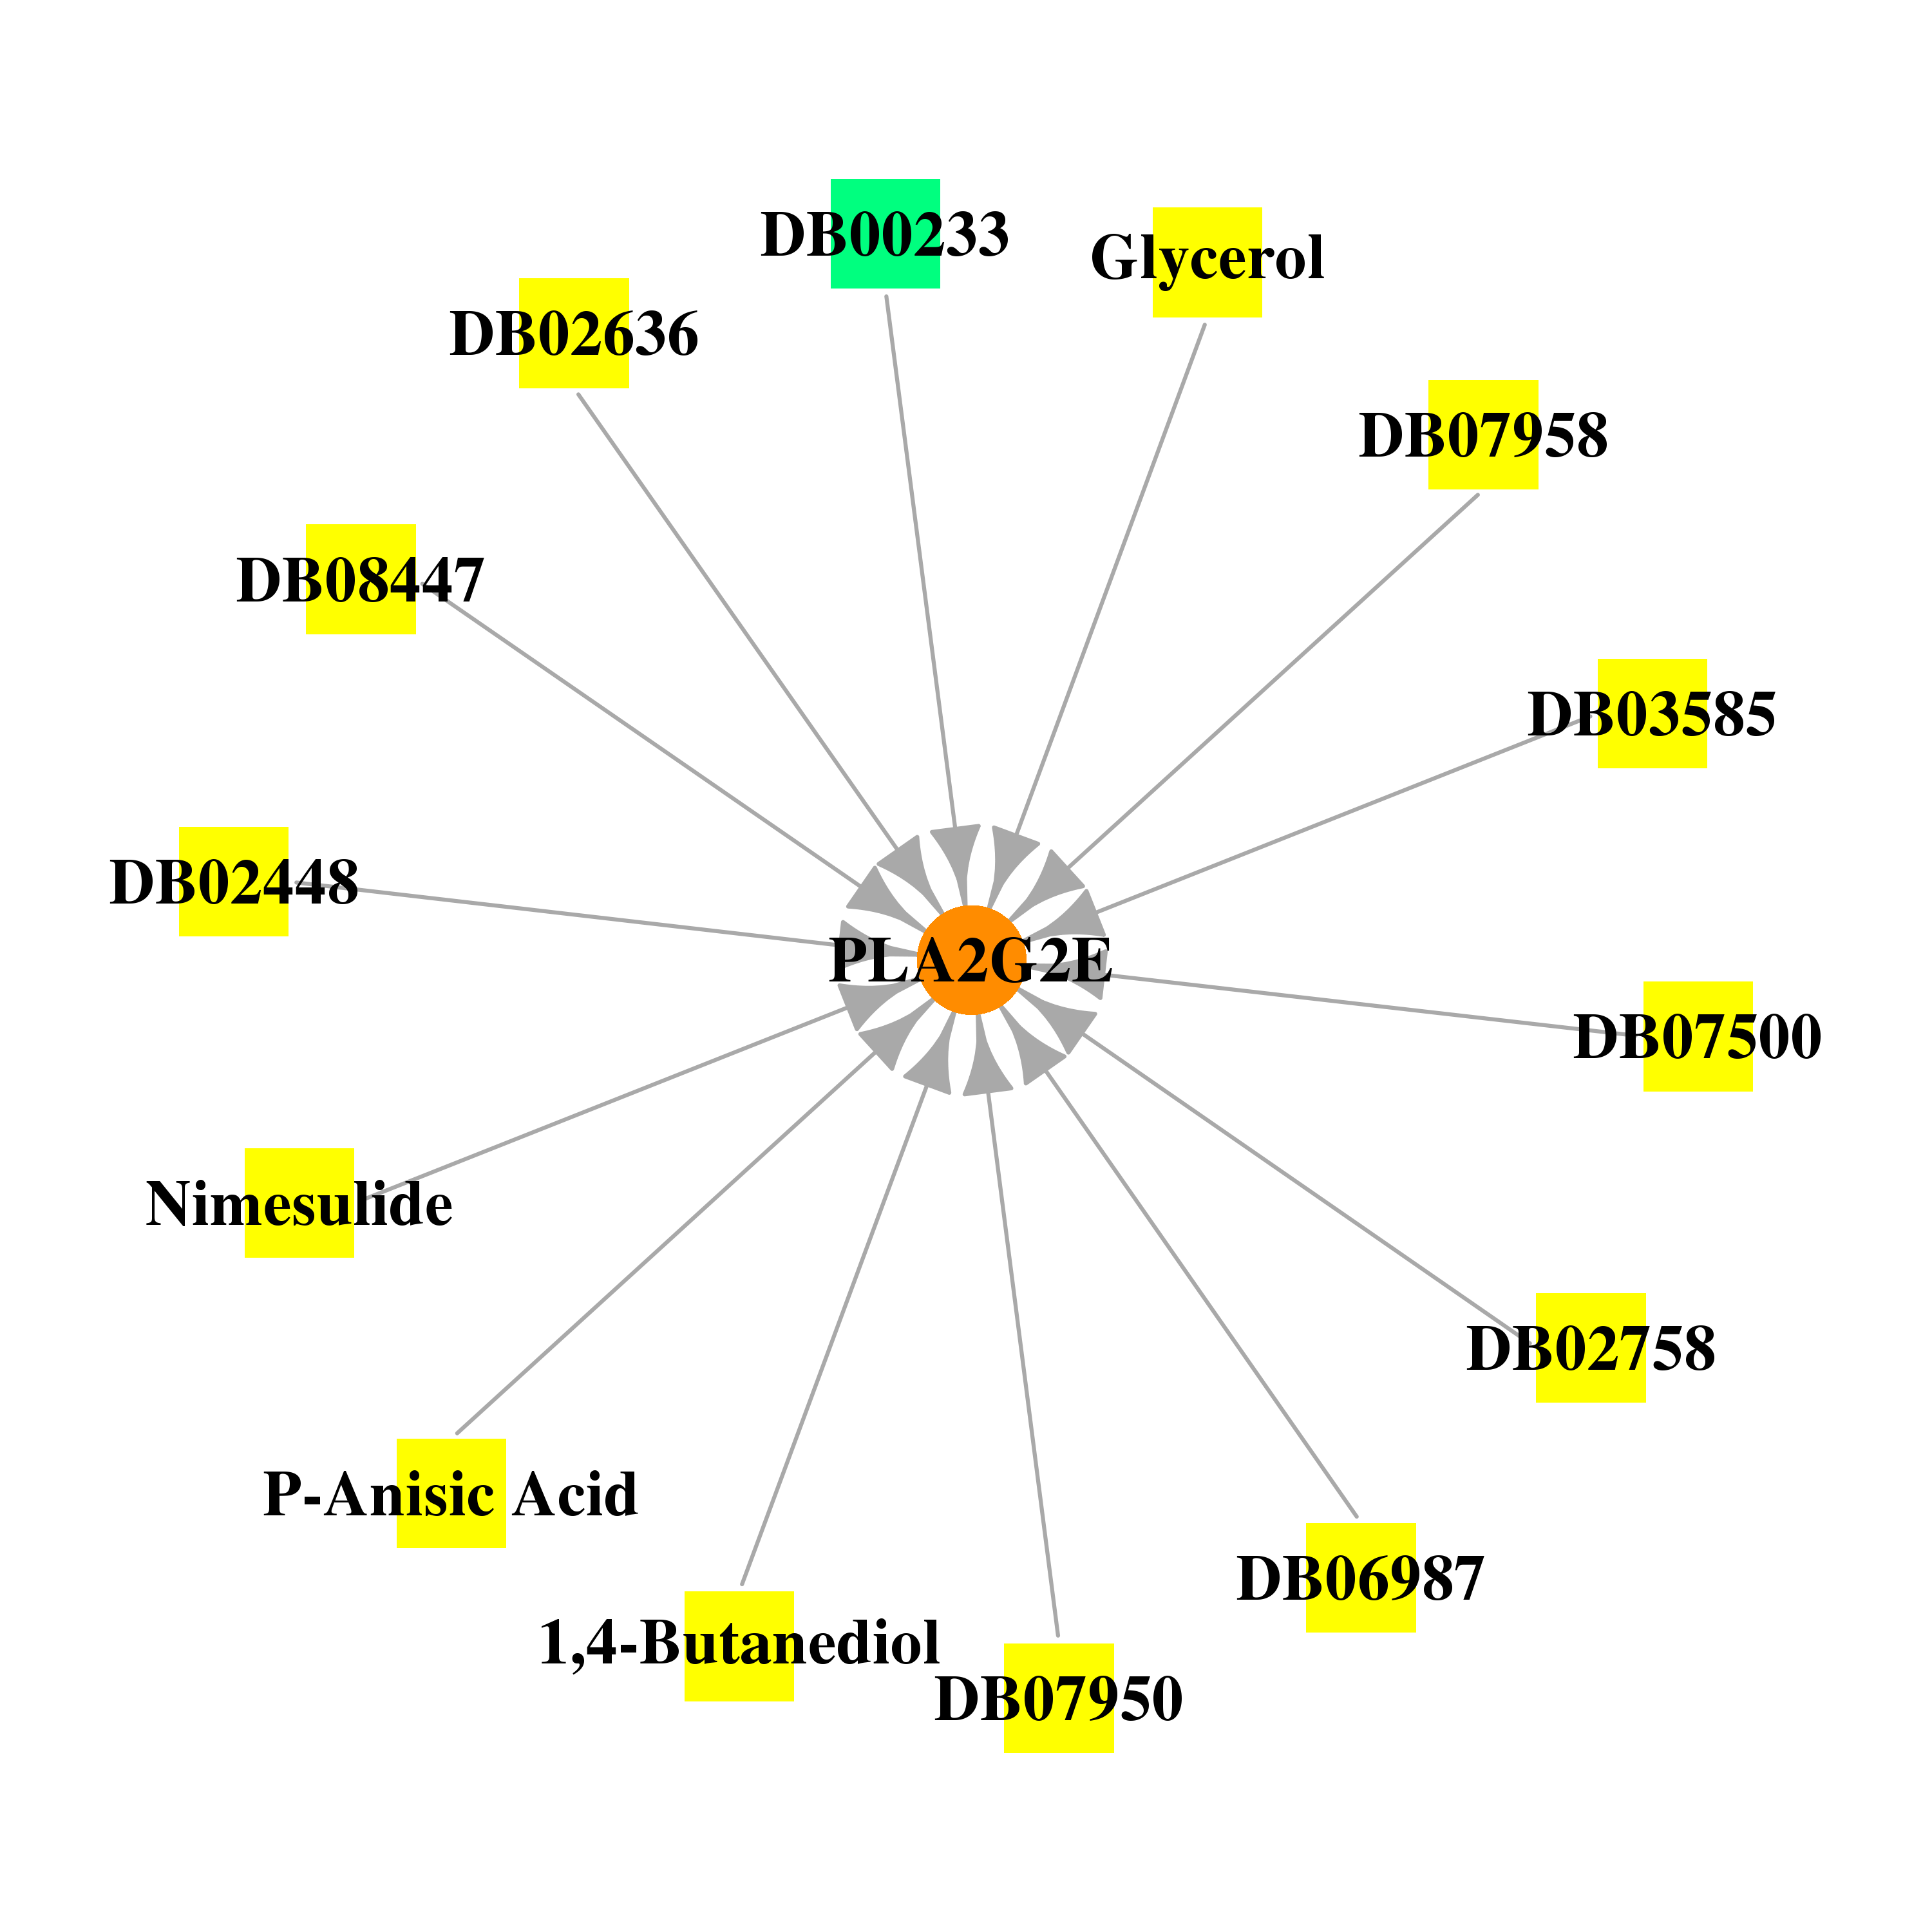 |
| * Drug Centered Interaction Network. |
| DrugBank ID | Target Name | Drug Groups | Generic Name | Drug Centered Network | Drug Structure |
| DB00233 | phospholipase A2, group IIE | approved | Aminosalicylic Acid |  |  |
| DB01955 | phospholipase A2, group IIE | experimental | 1,4-Butanediol | 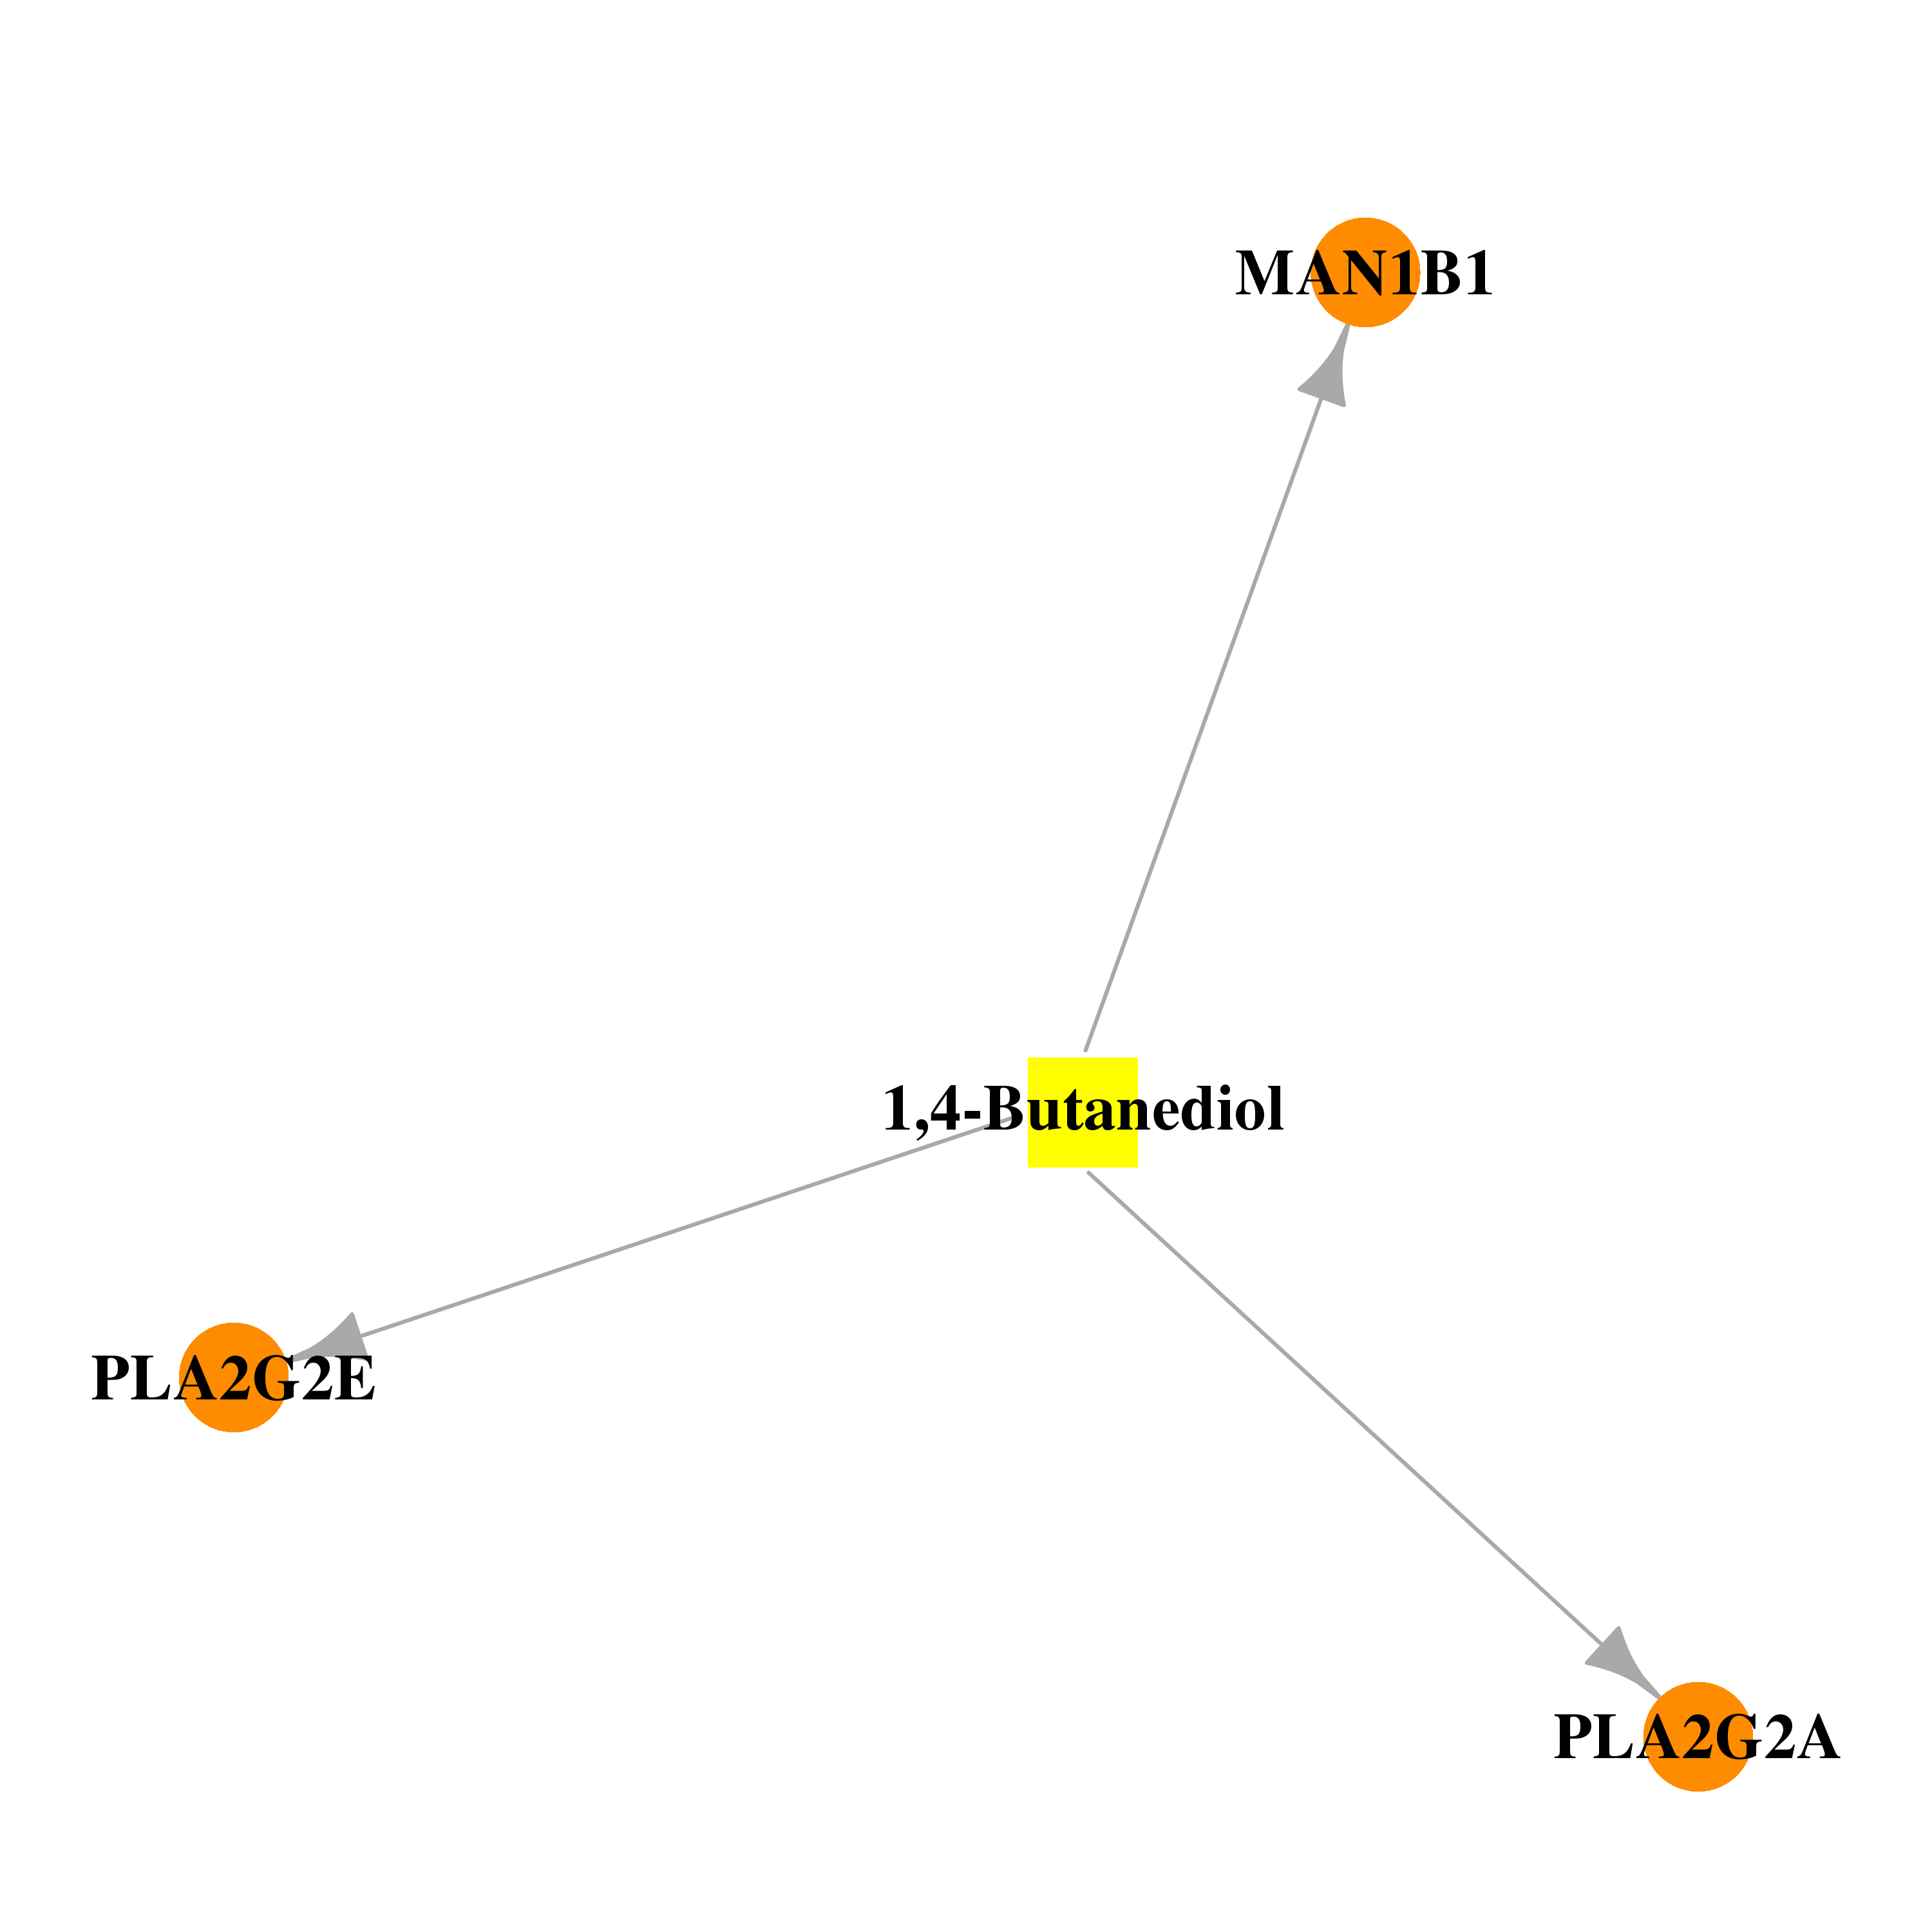 |  |
| DB02448 | phospholipase A2, group IIE | experimental | N-Tridecanoic Acid | 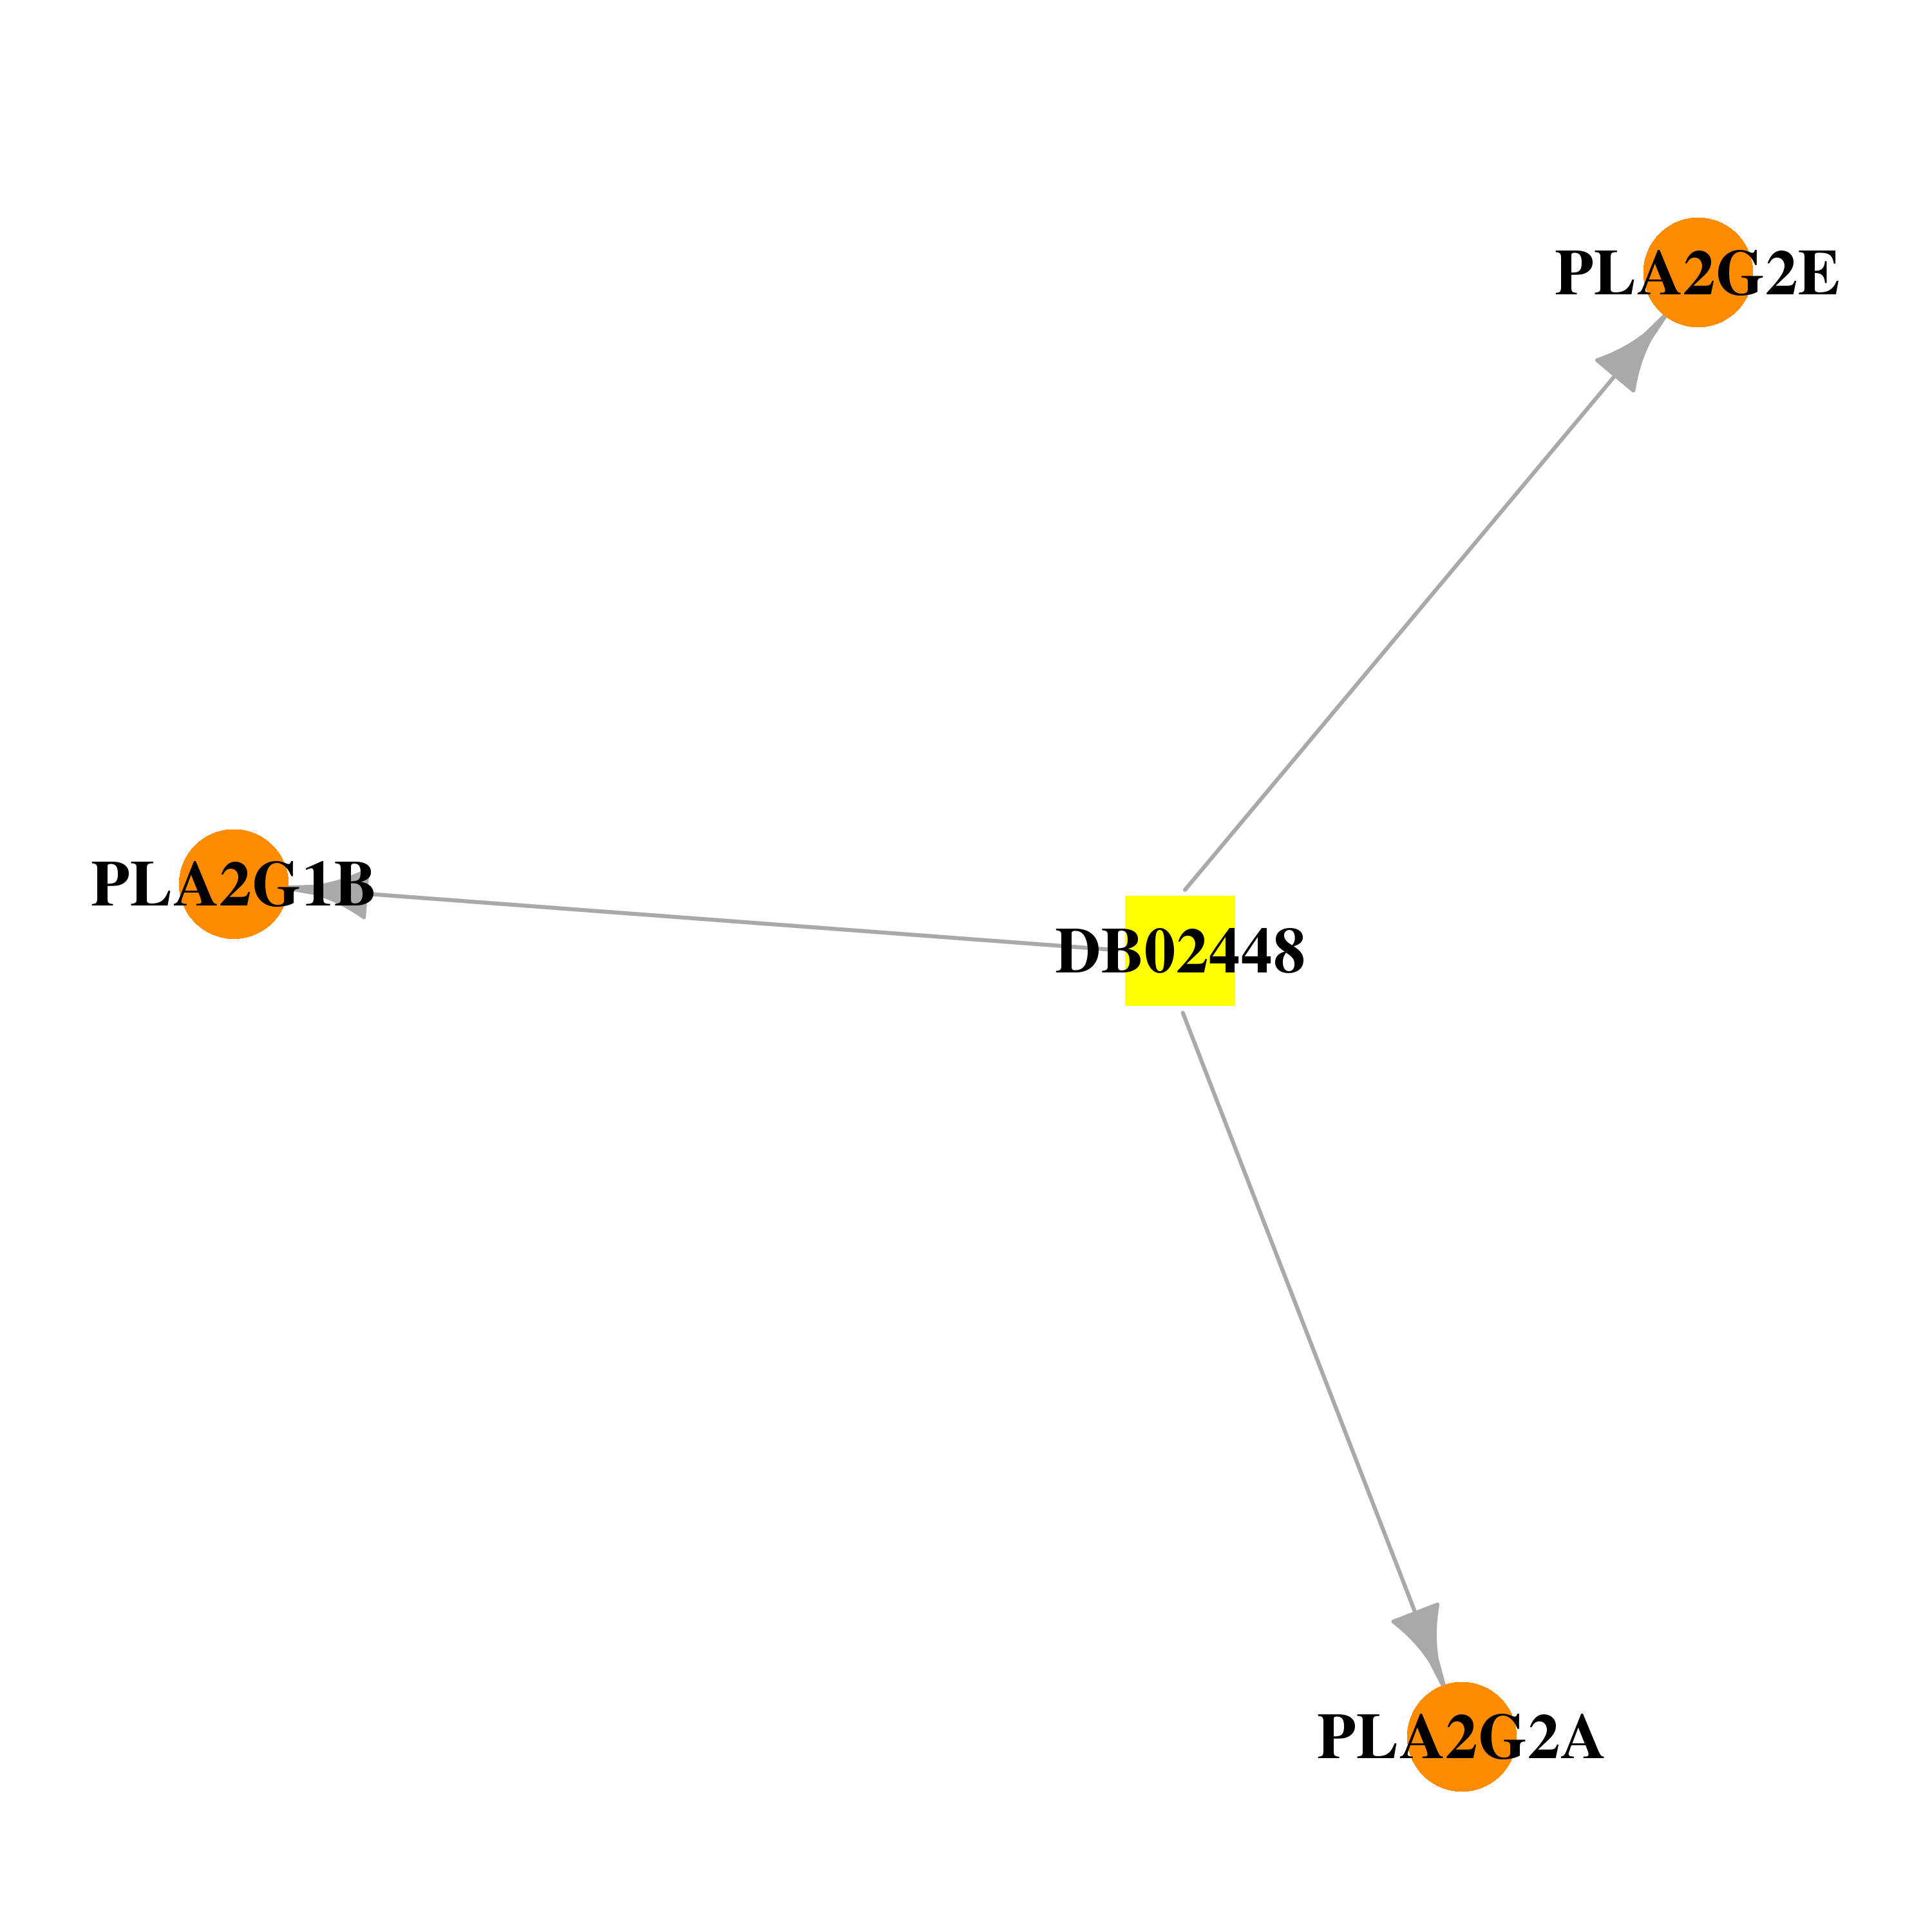 |  |
| DB02636 | phospholipase A2, group IIE | experimental | 9-Hydroxy-8-Methoxy-6-Nitro-Phenanthrol[3,4-D][1,3]Dioxole-5-Carboxylic Acid | 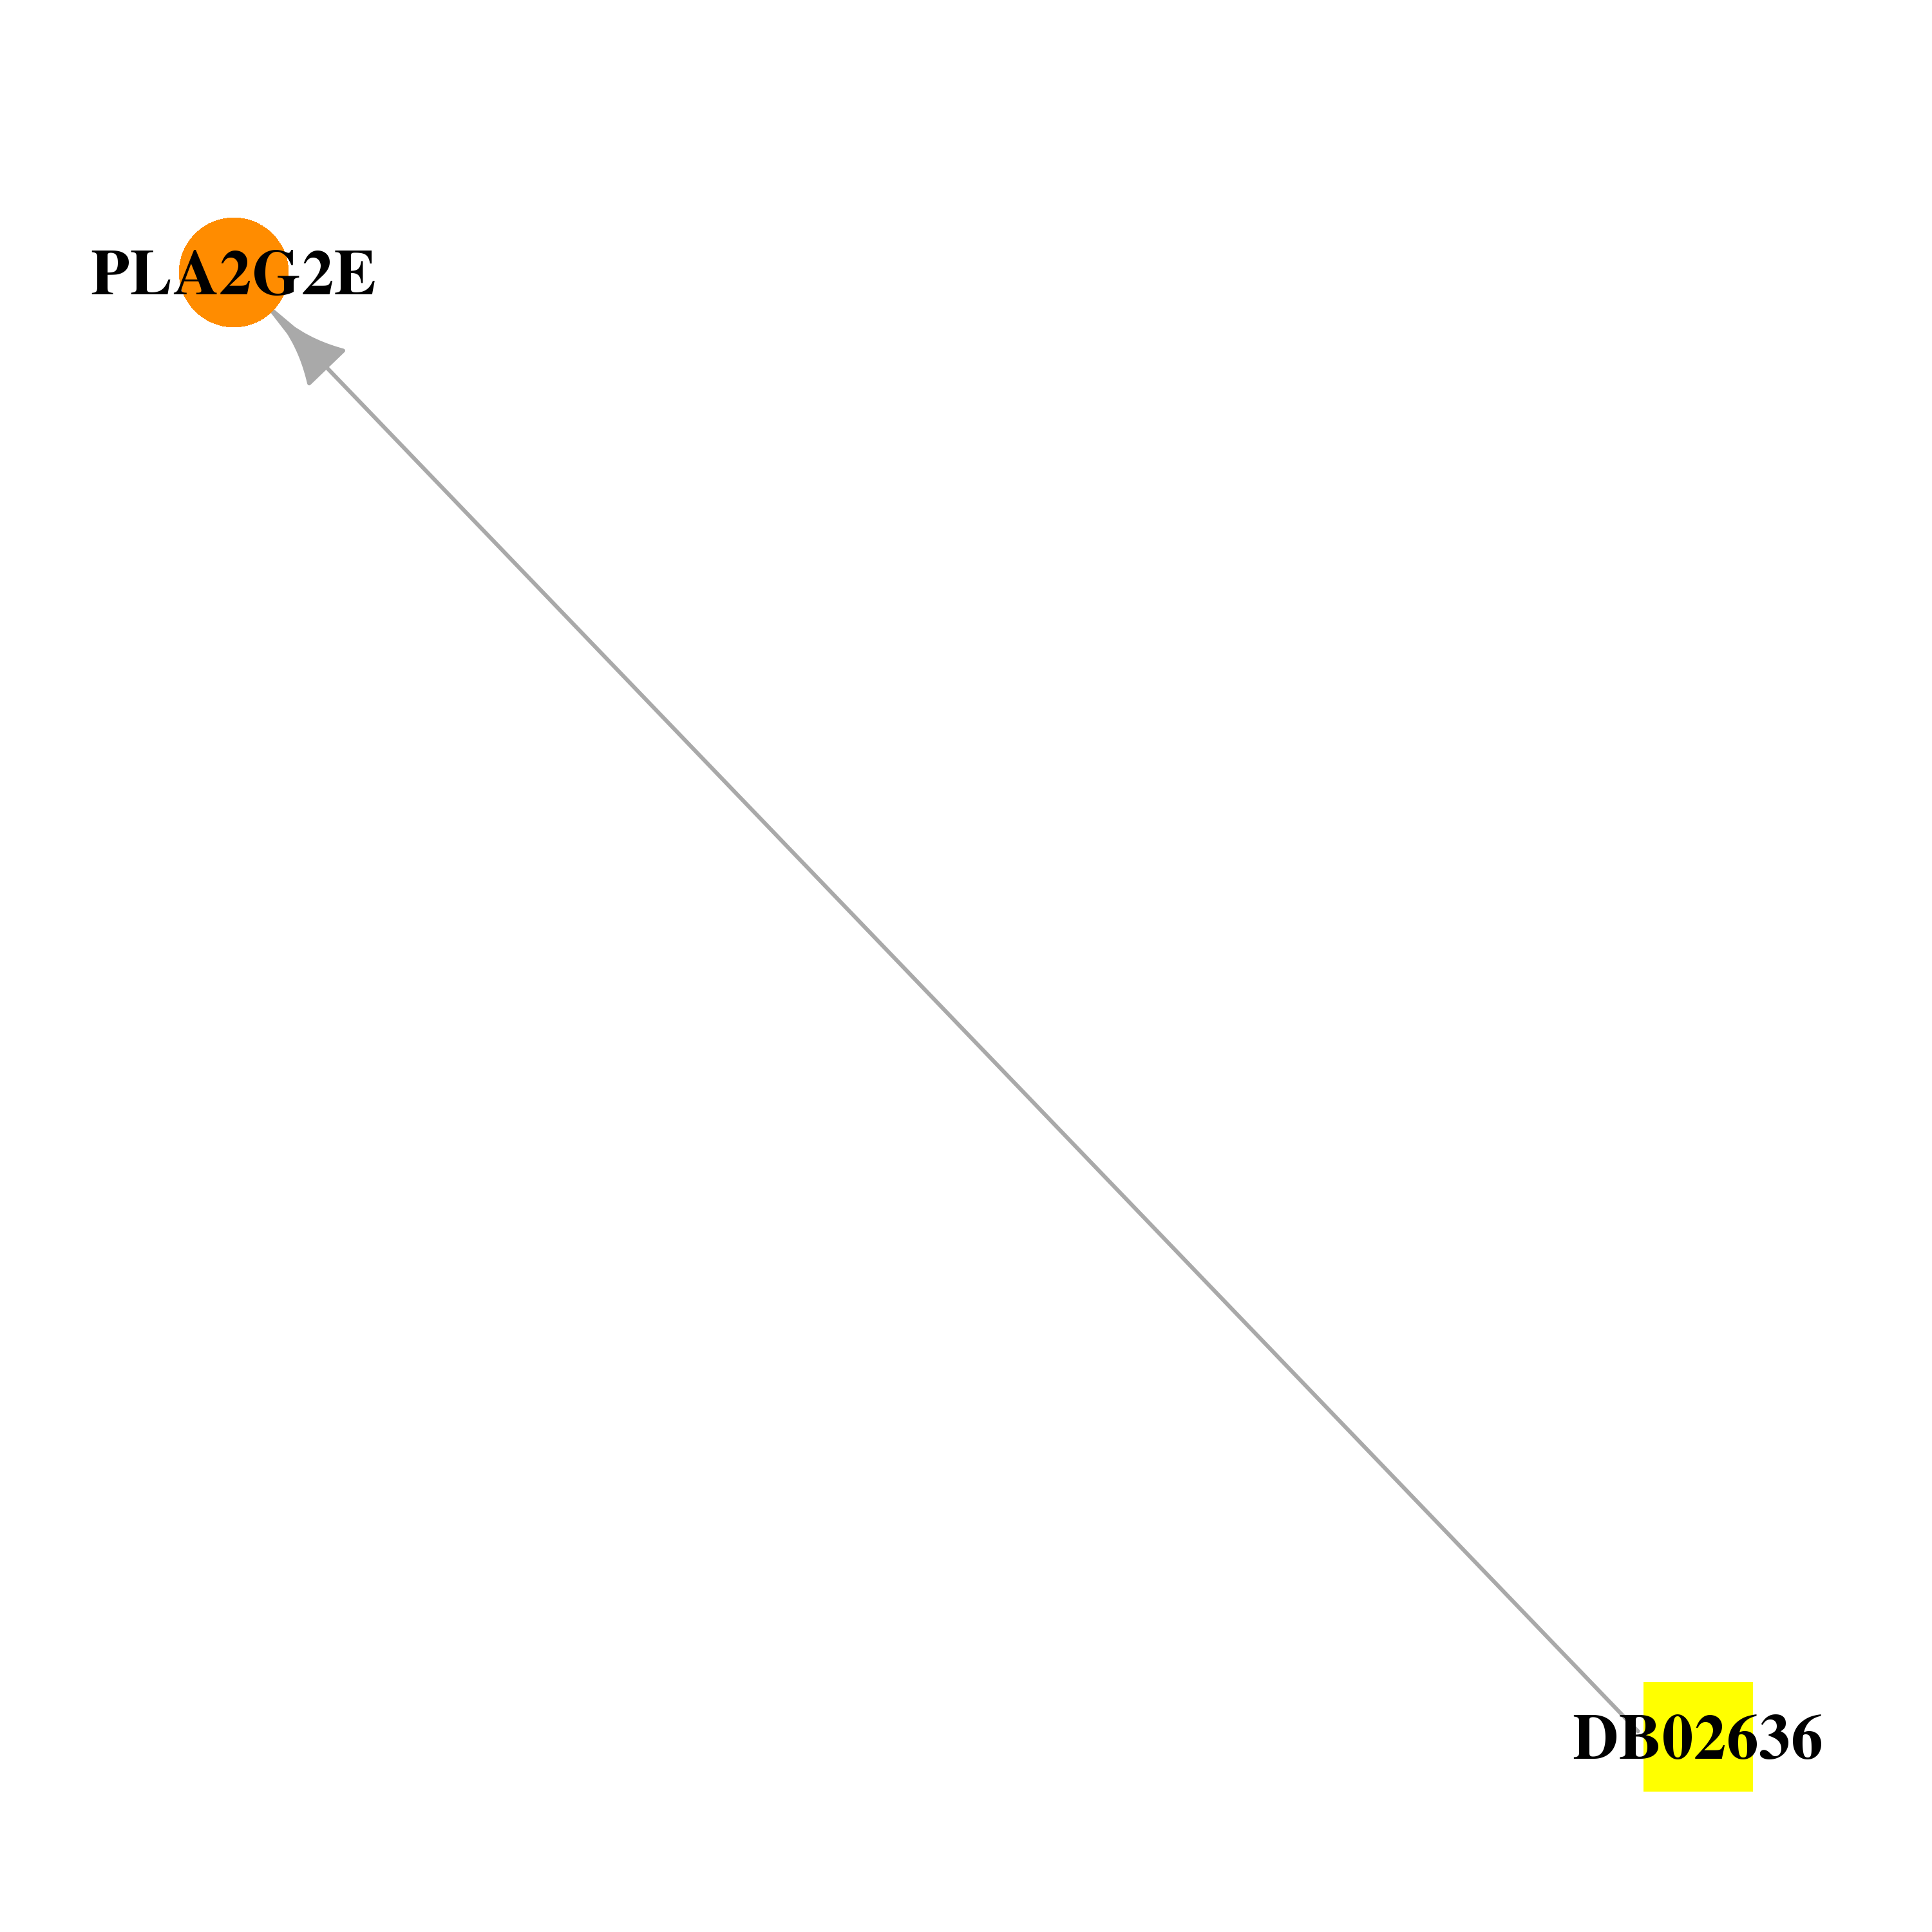 |  |
| DB02758 | phospholipase A2, group IIE | experimental | Indolylpropionic Acid | 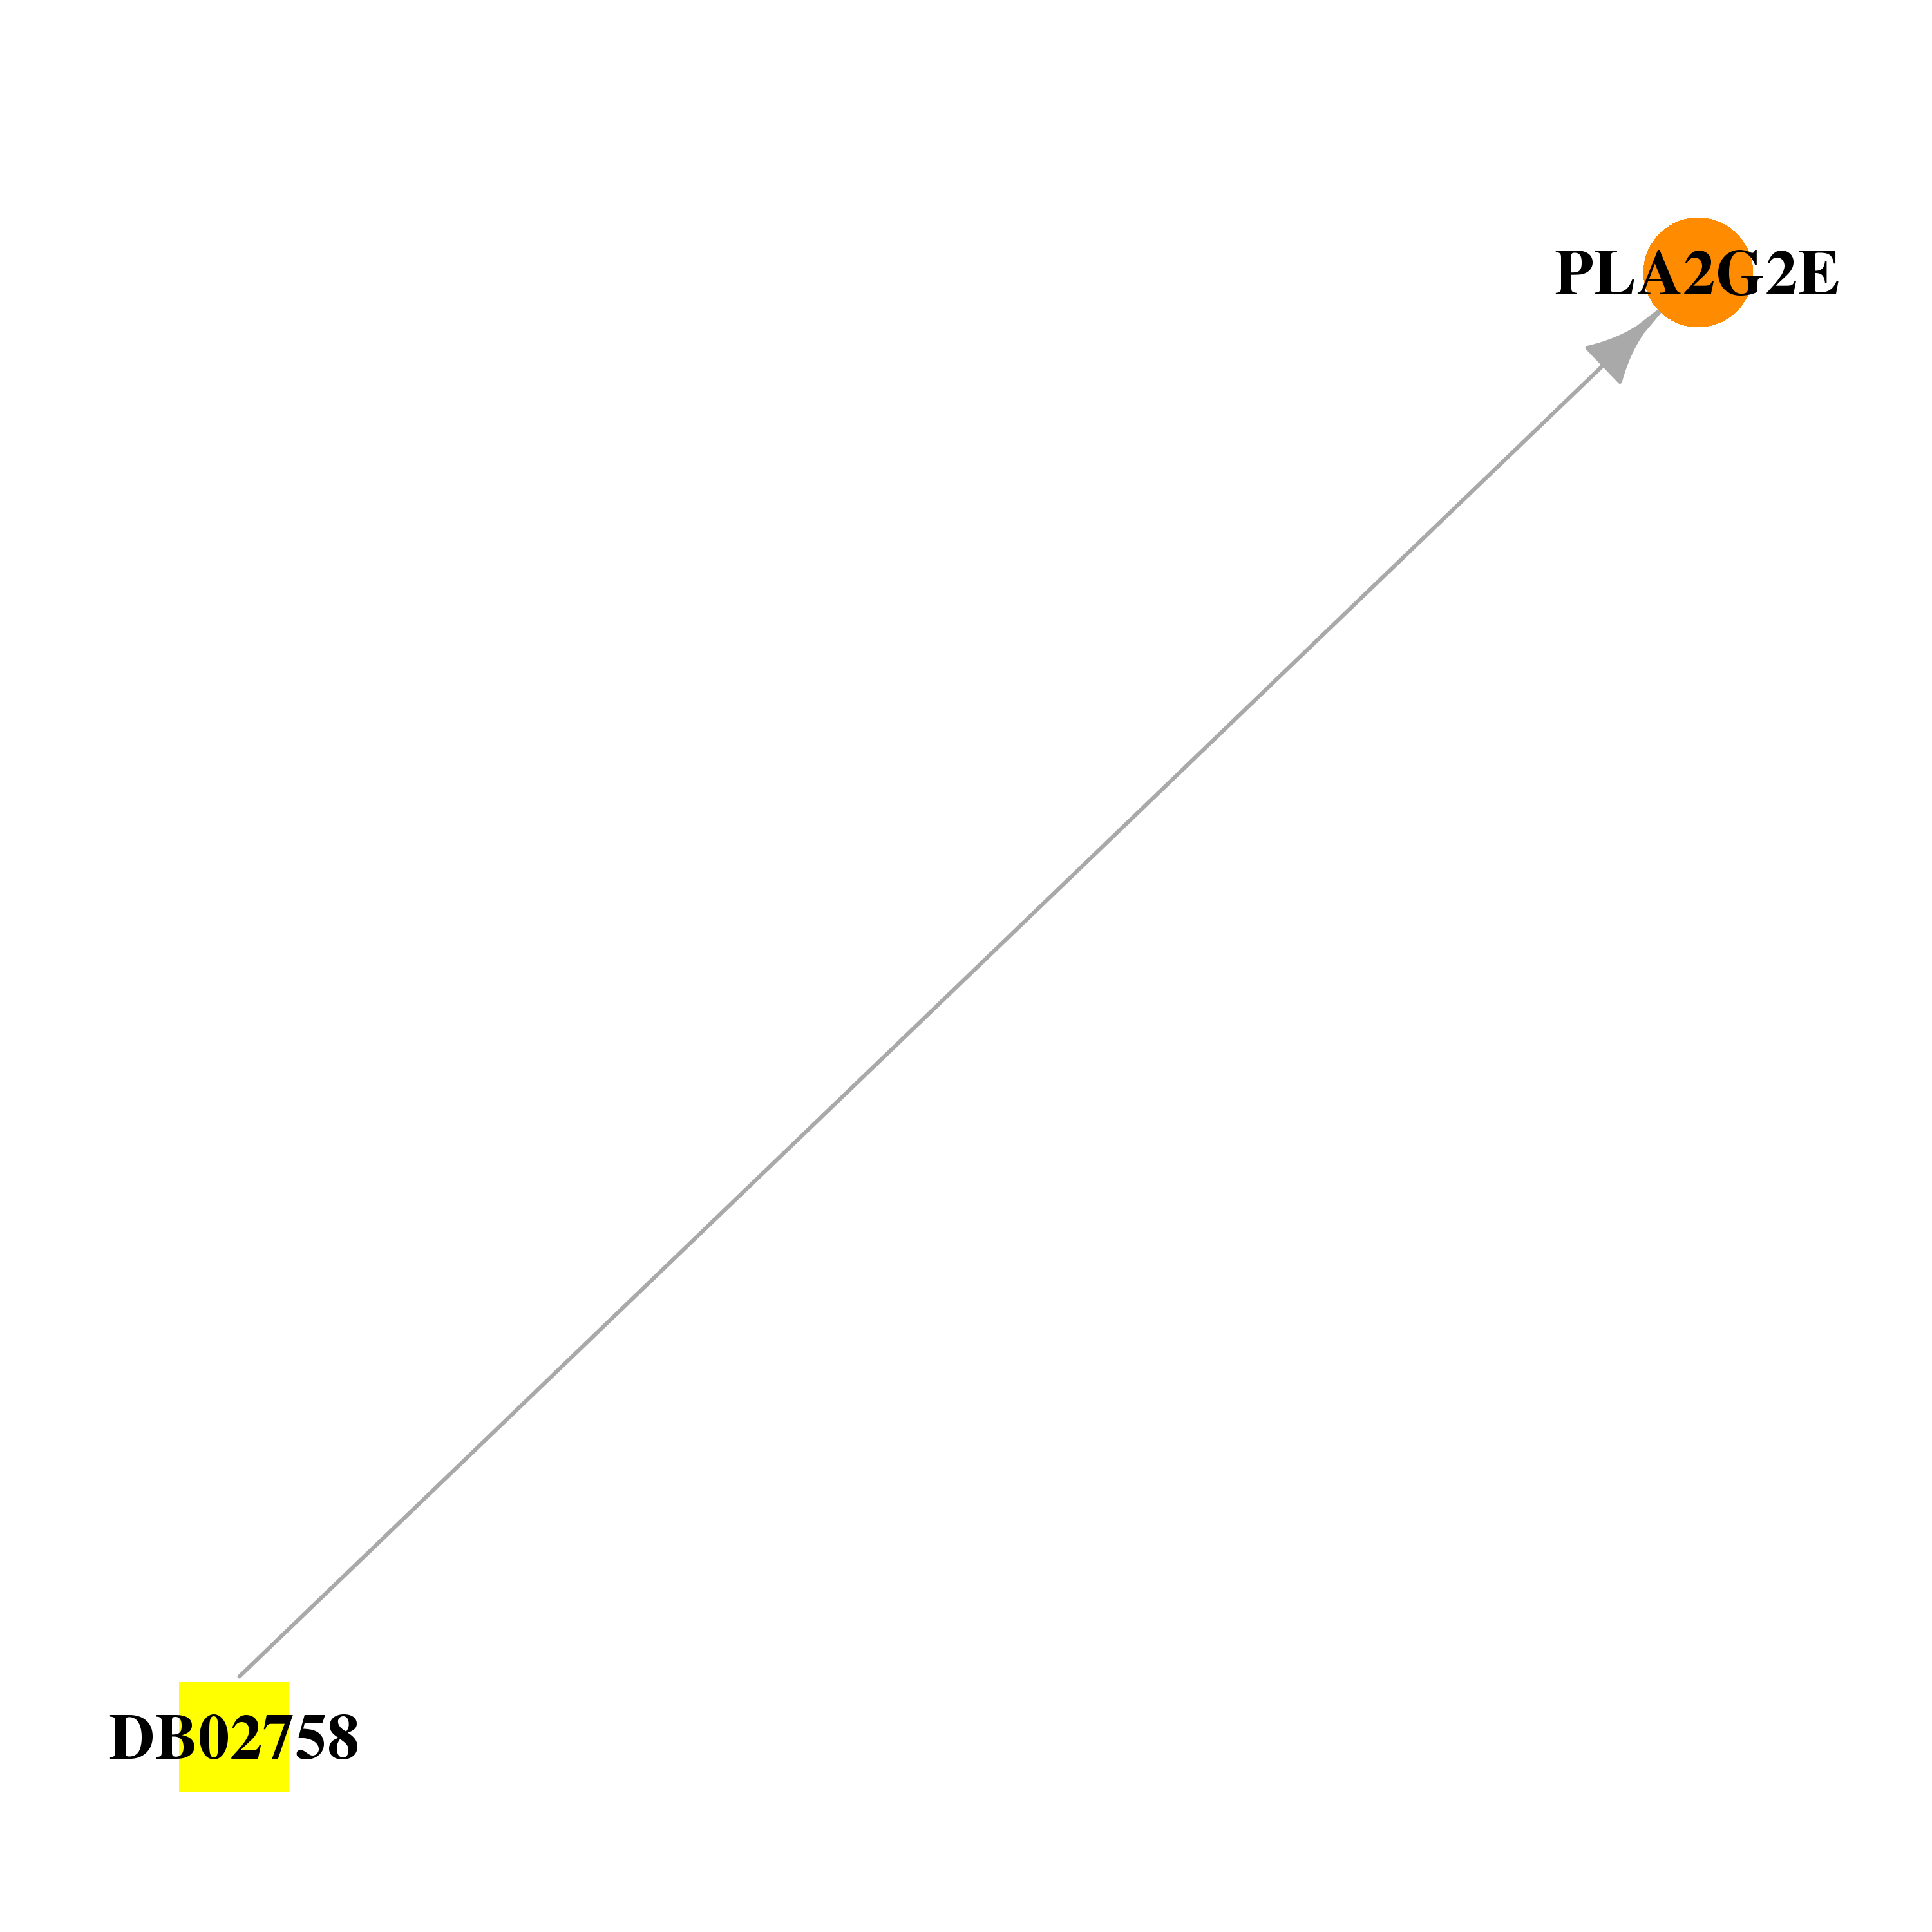 |  |
| DB02795 | phospholipase A2, group IIE | experimental | P-Anisic Acid |  |  |
| DB03585 | phospholipase A2, group IIE | experimental; withdrawn | Oxyphenbutazone |  |  |
| DB04077 | phospholipase A2, group IIE | experimental | Glycerol | 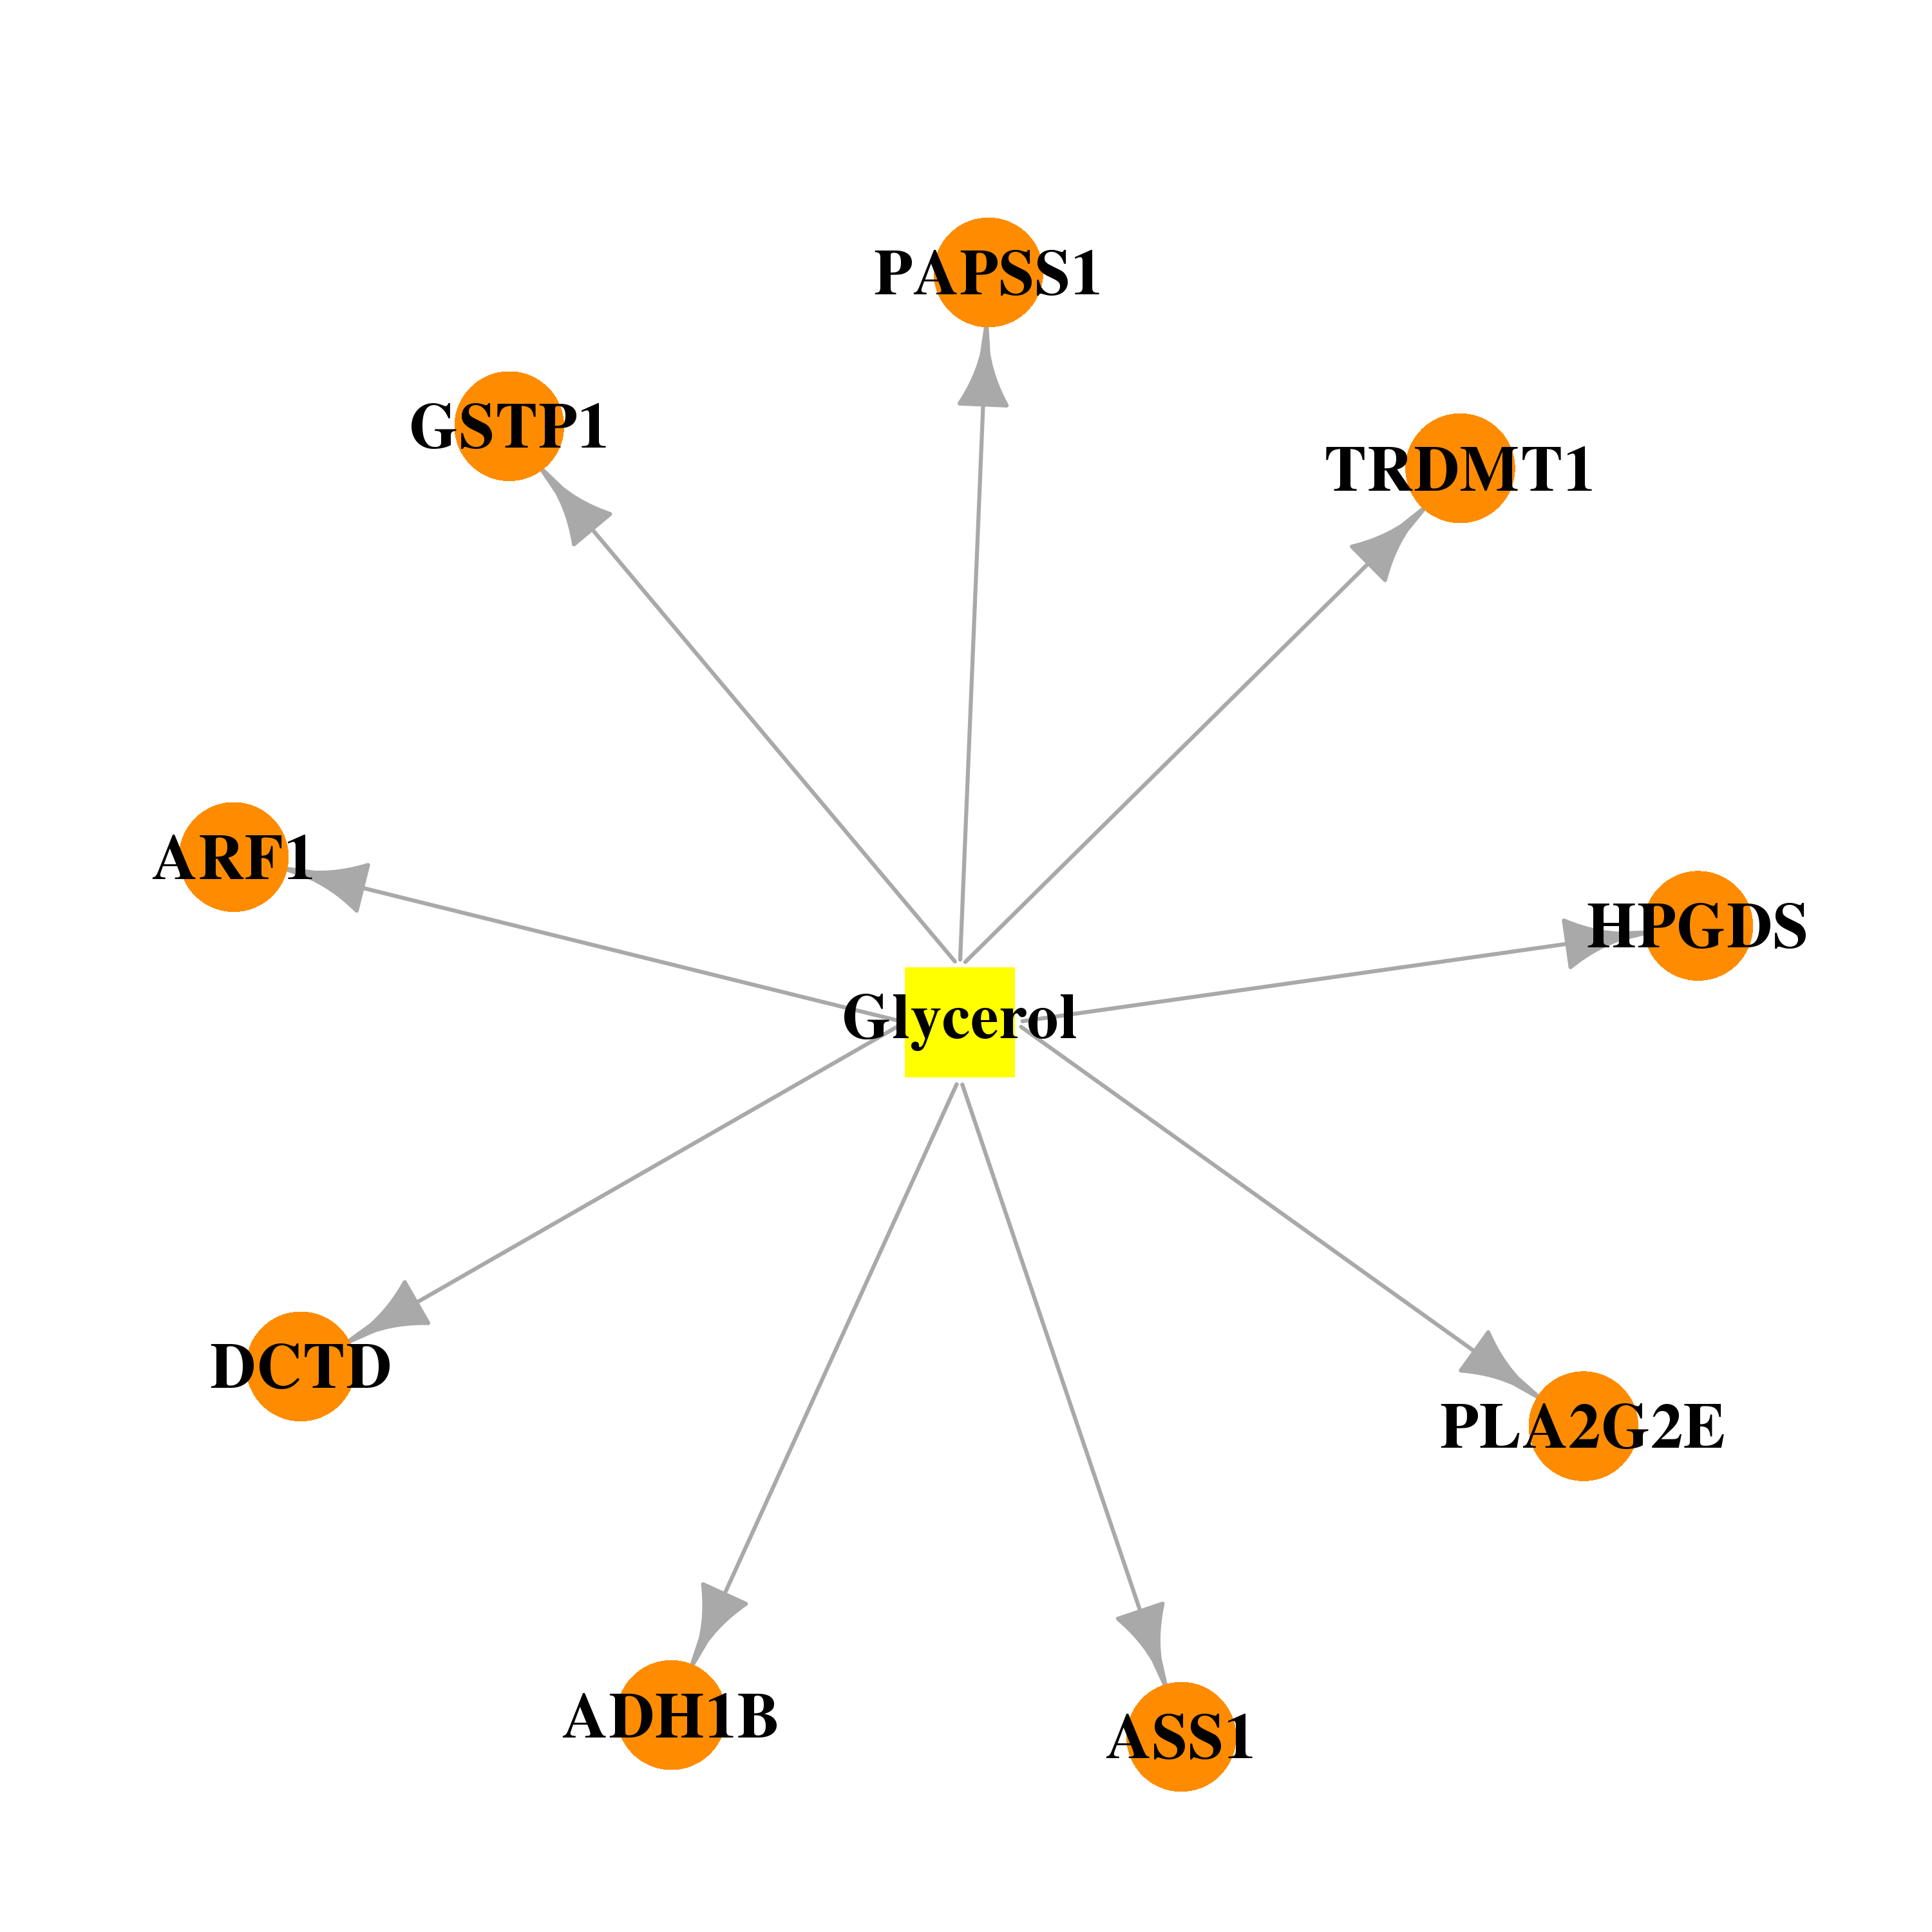 | 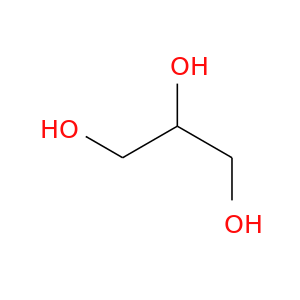 |
| DB04743 | phospholipase A2, group IIE | experimental | Nimesulide | 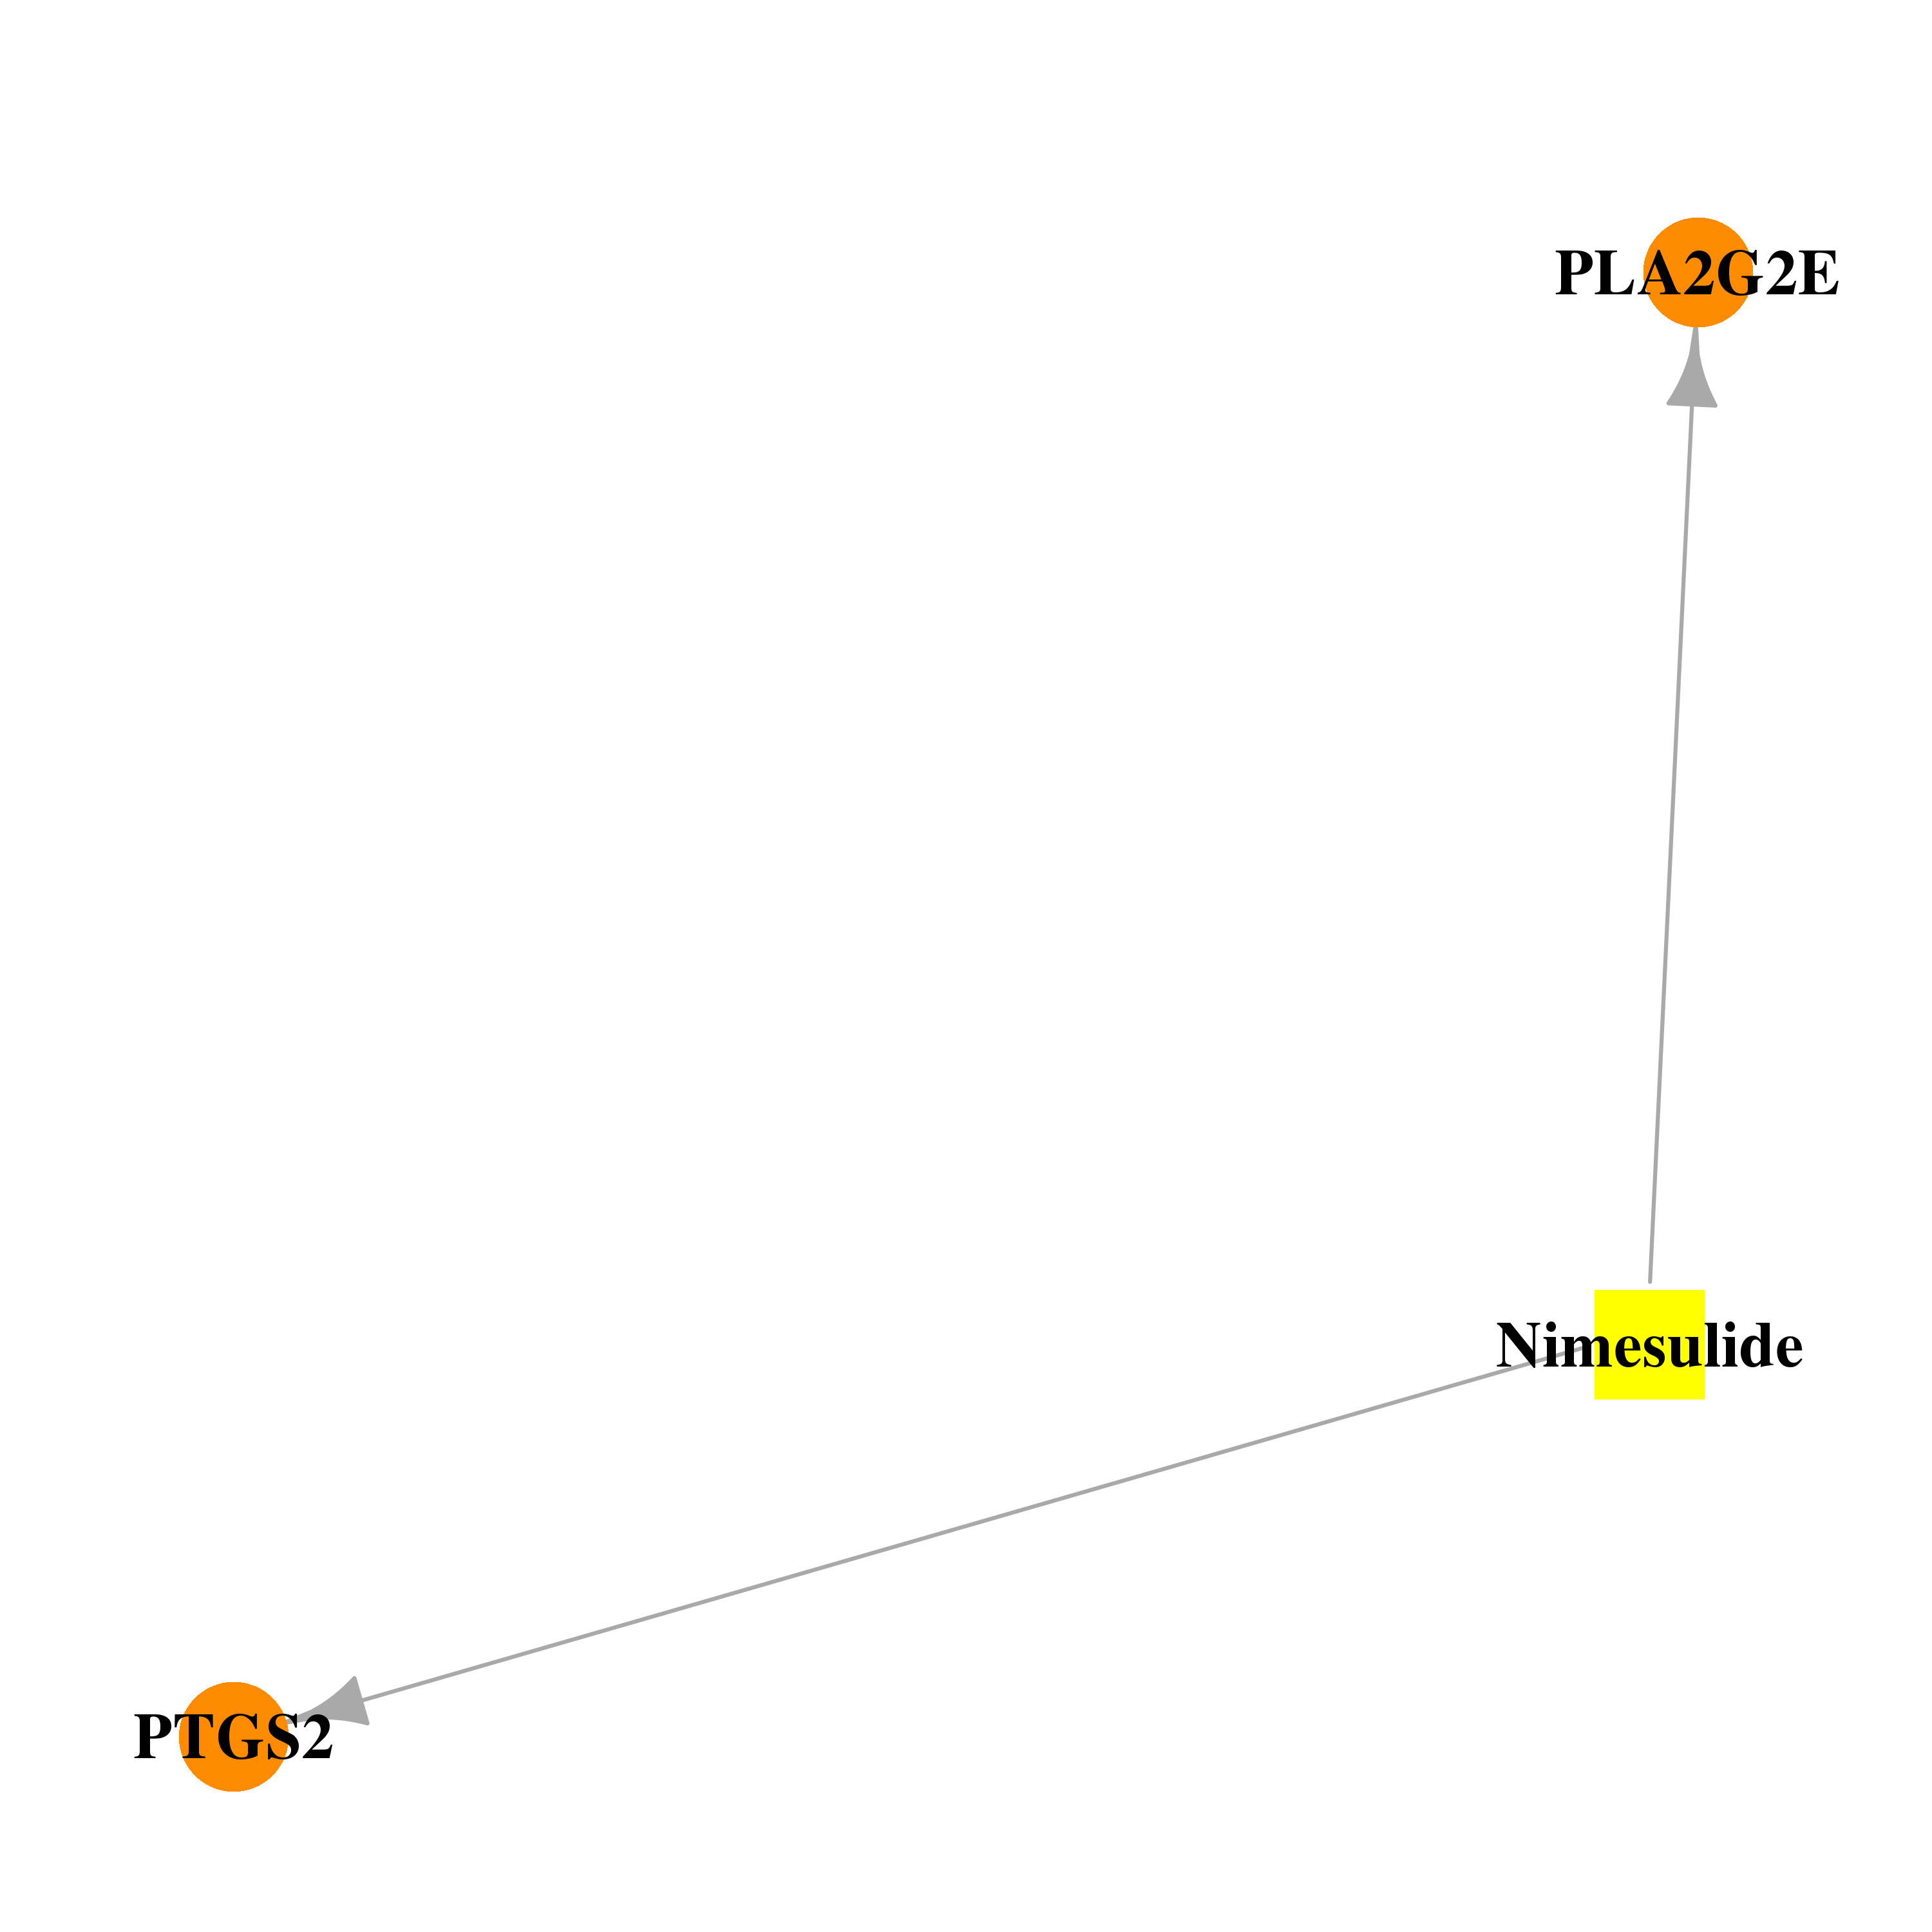 |  |
| DB06987 | phospholipase A2, group IIE | experimental | 2-(4-(2-HYDROXY-3-(ISOPROPYLAMINO)PROPOXY)PHENYL)ETHANAMIDE | 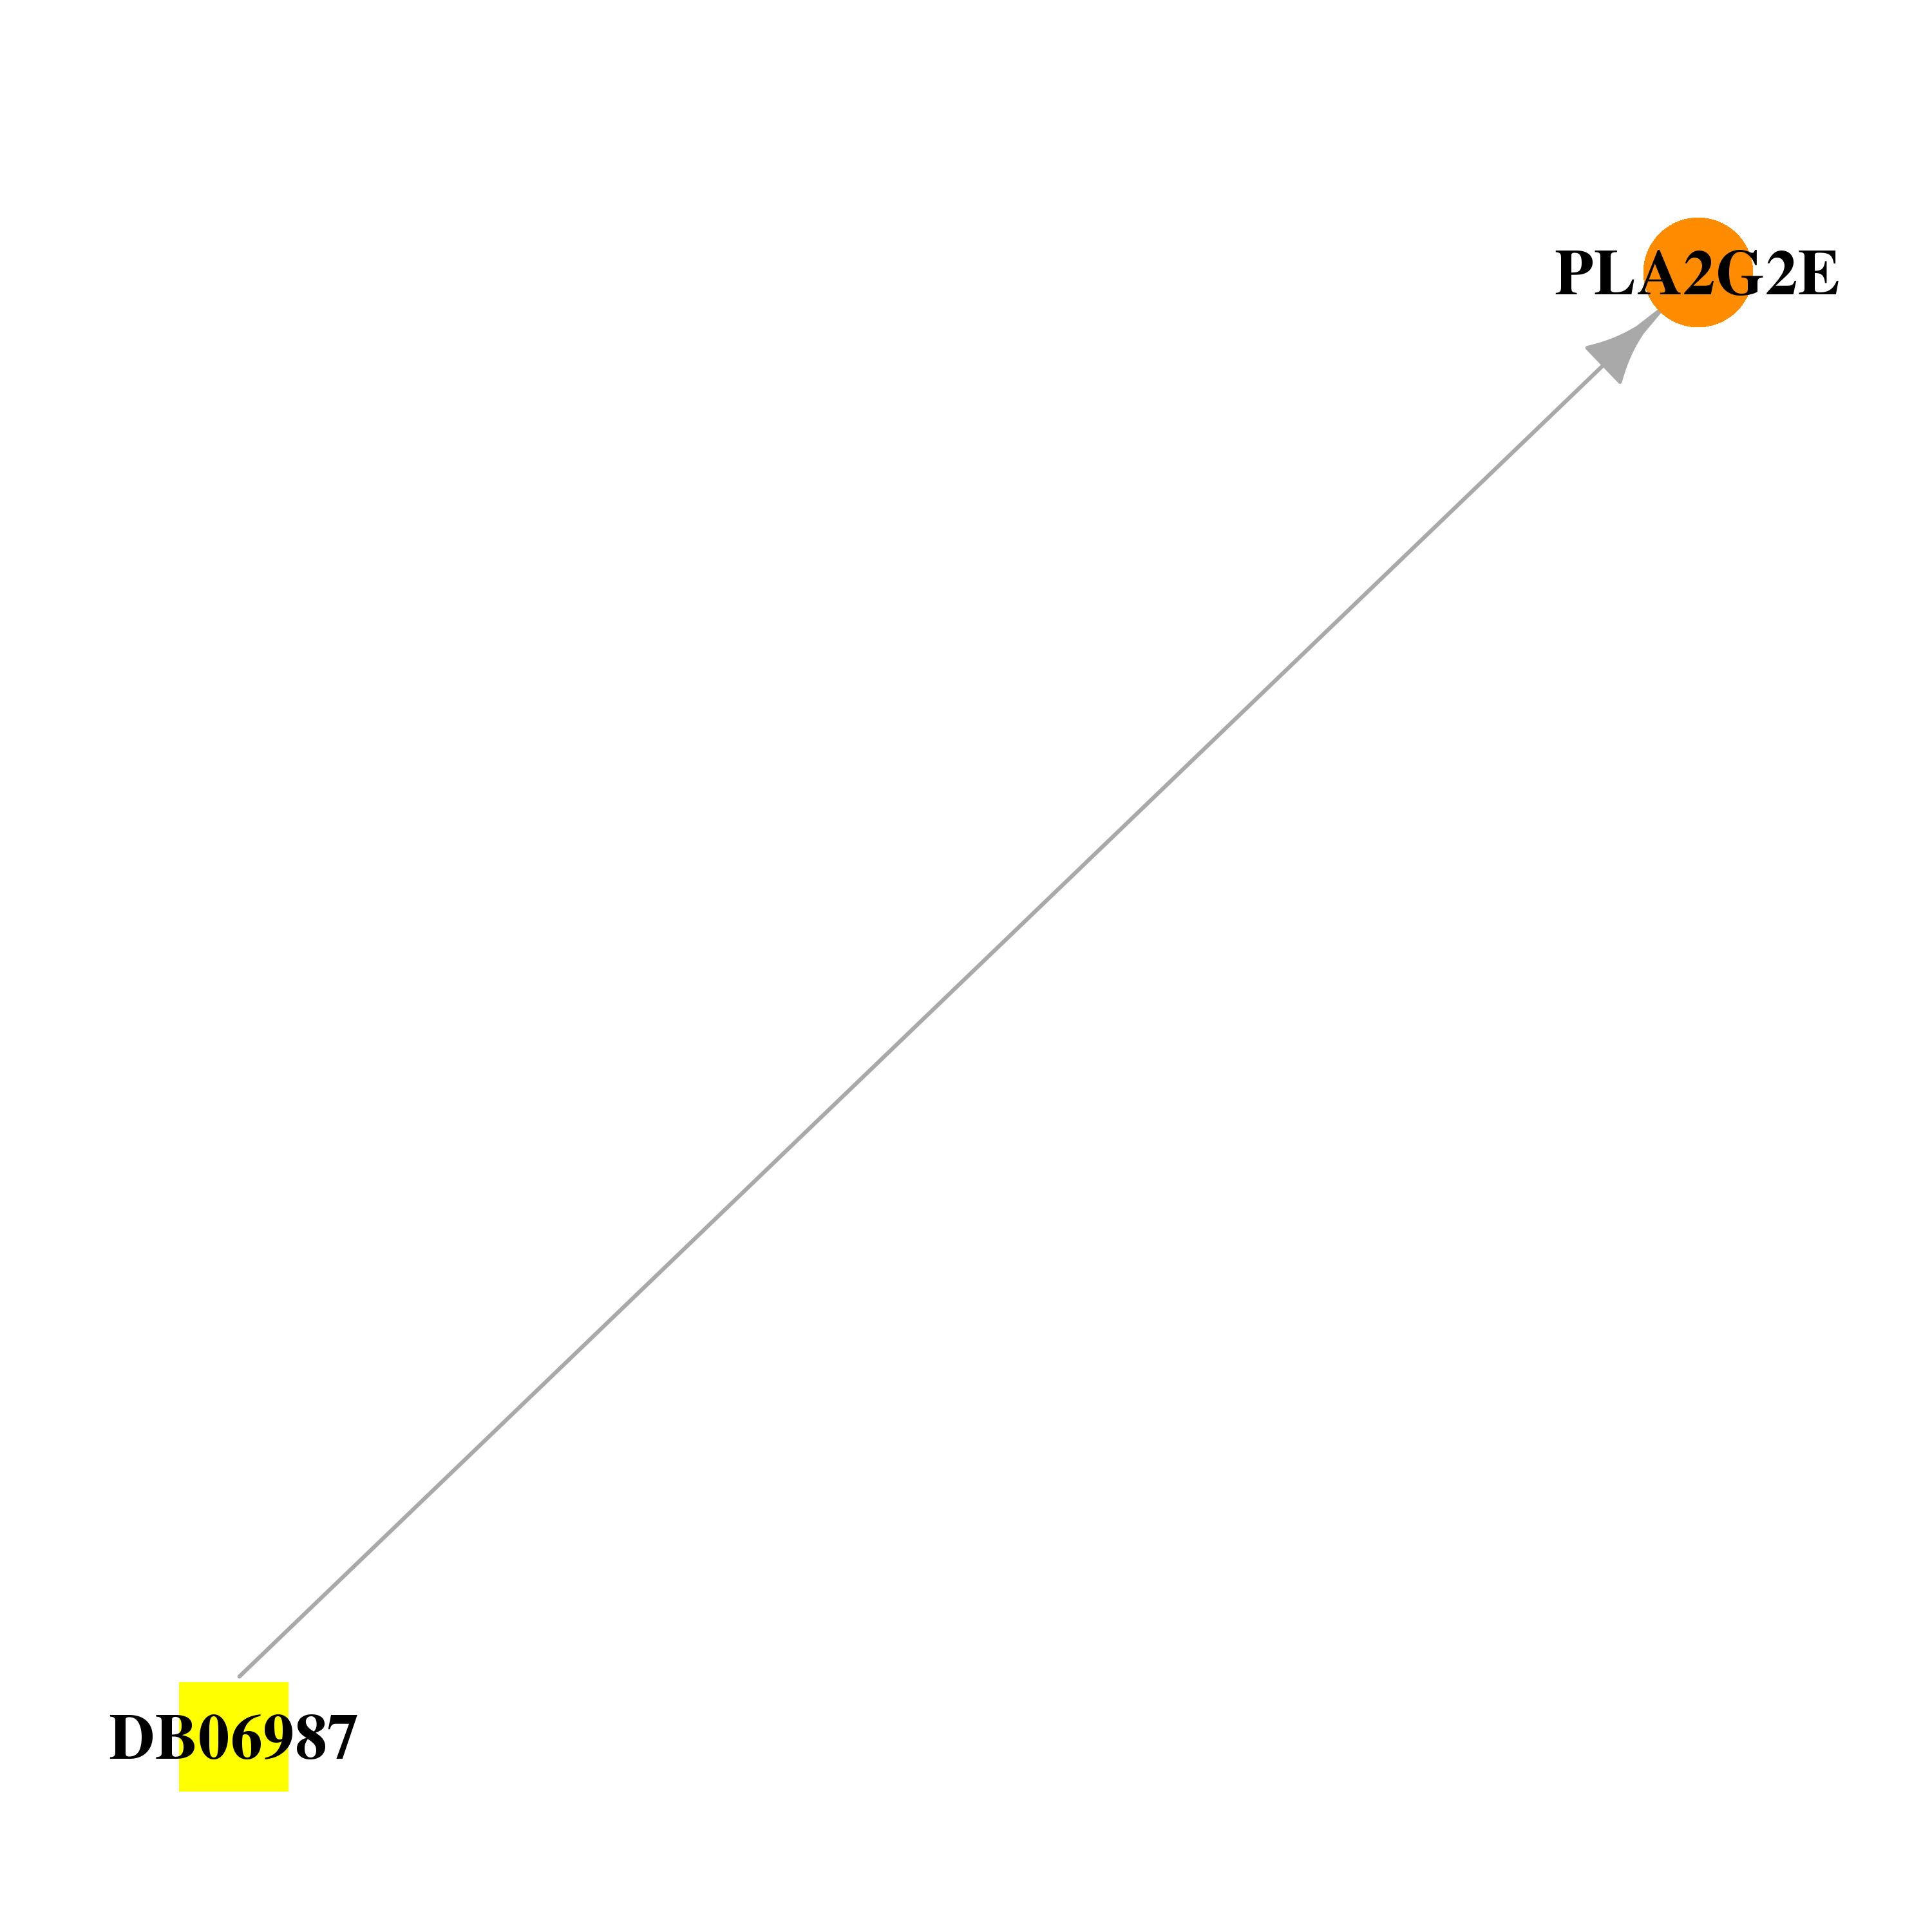 |  |
| DB07500 | phospholipase A2, group IIE | experimental | (2E)-1-[2-hydroxy-4-methoxy-5-(3-methylbut-2-en-1-yl)phenyl]-3-(4-hydroxyphenyl)prop-2-en-1-one |  |  |
| DB07950 | phospholipase A2, group IIE | experimental | 1H-INDOL-3-YLACETIC ACID | 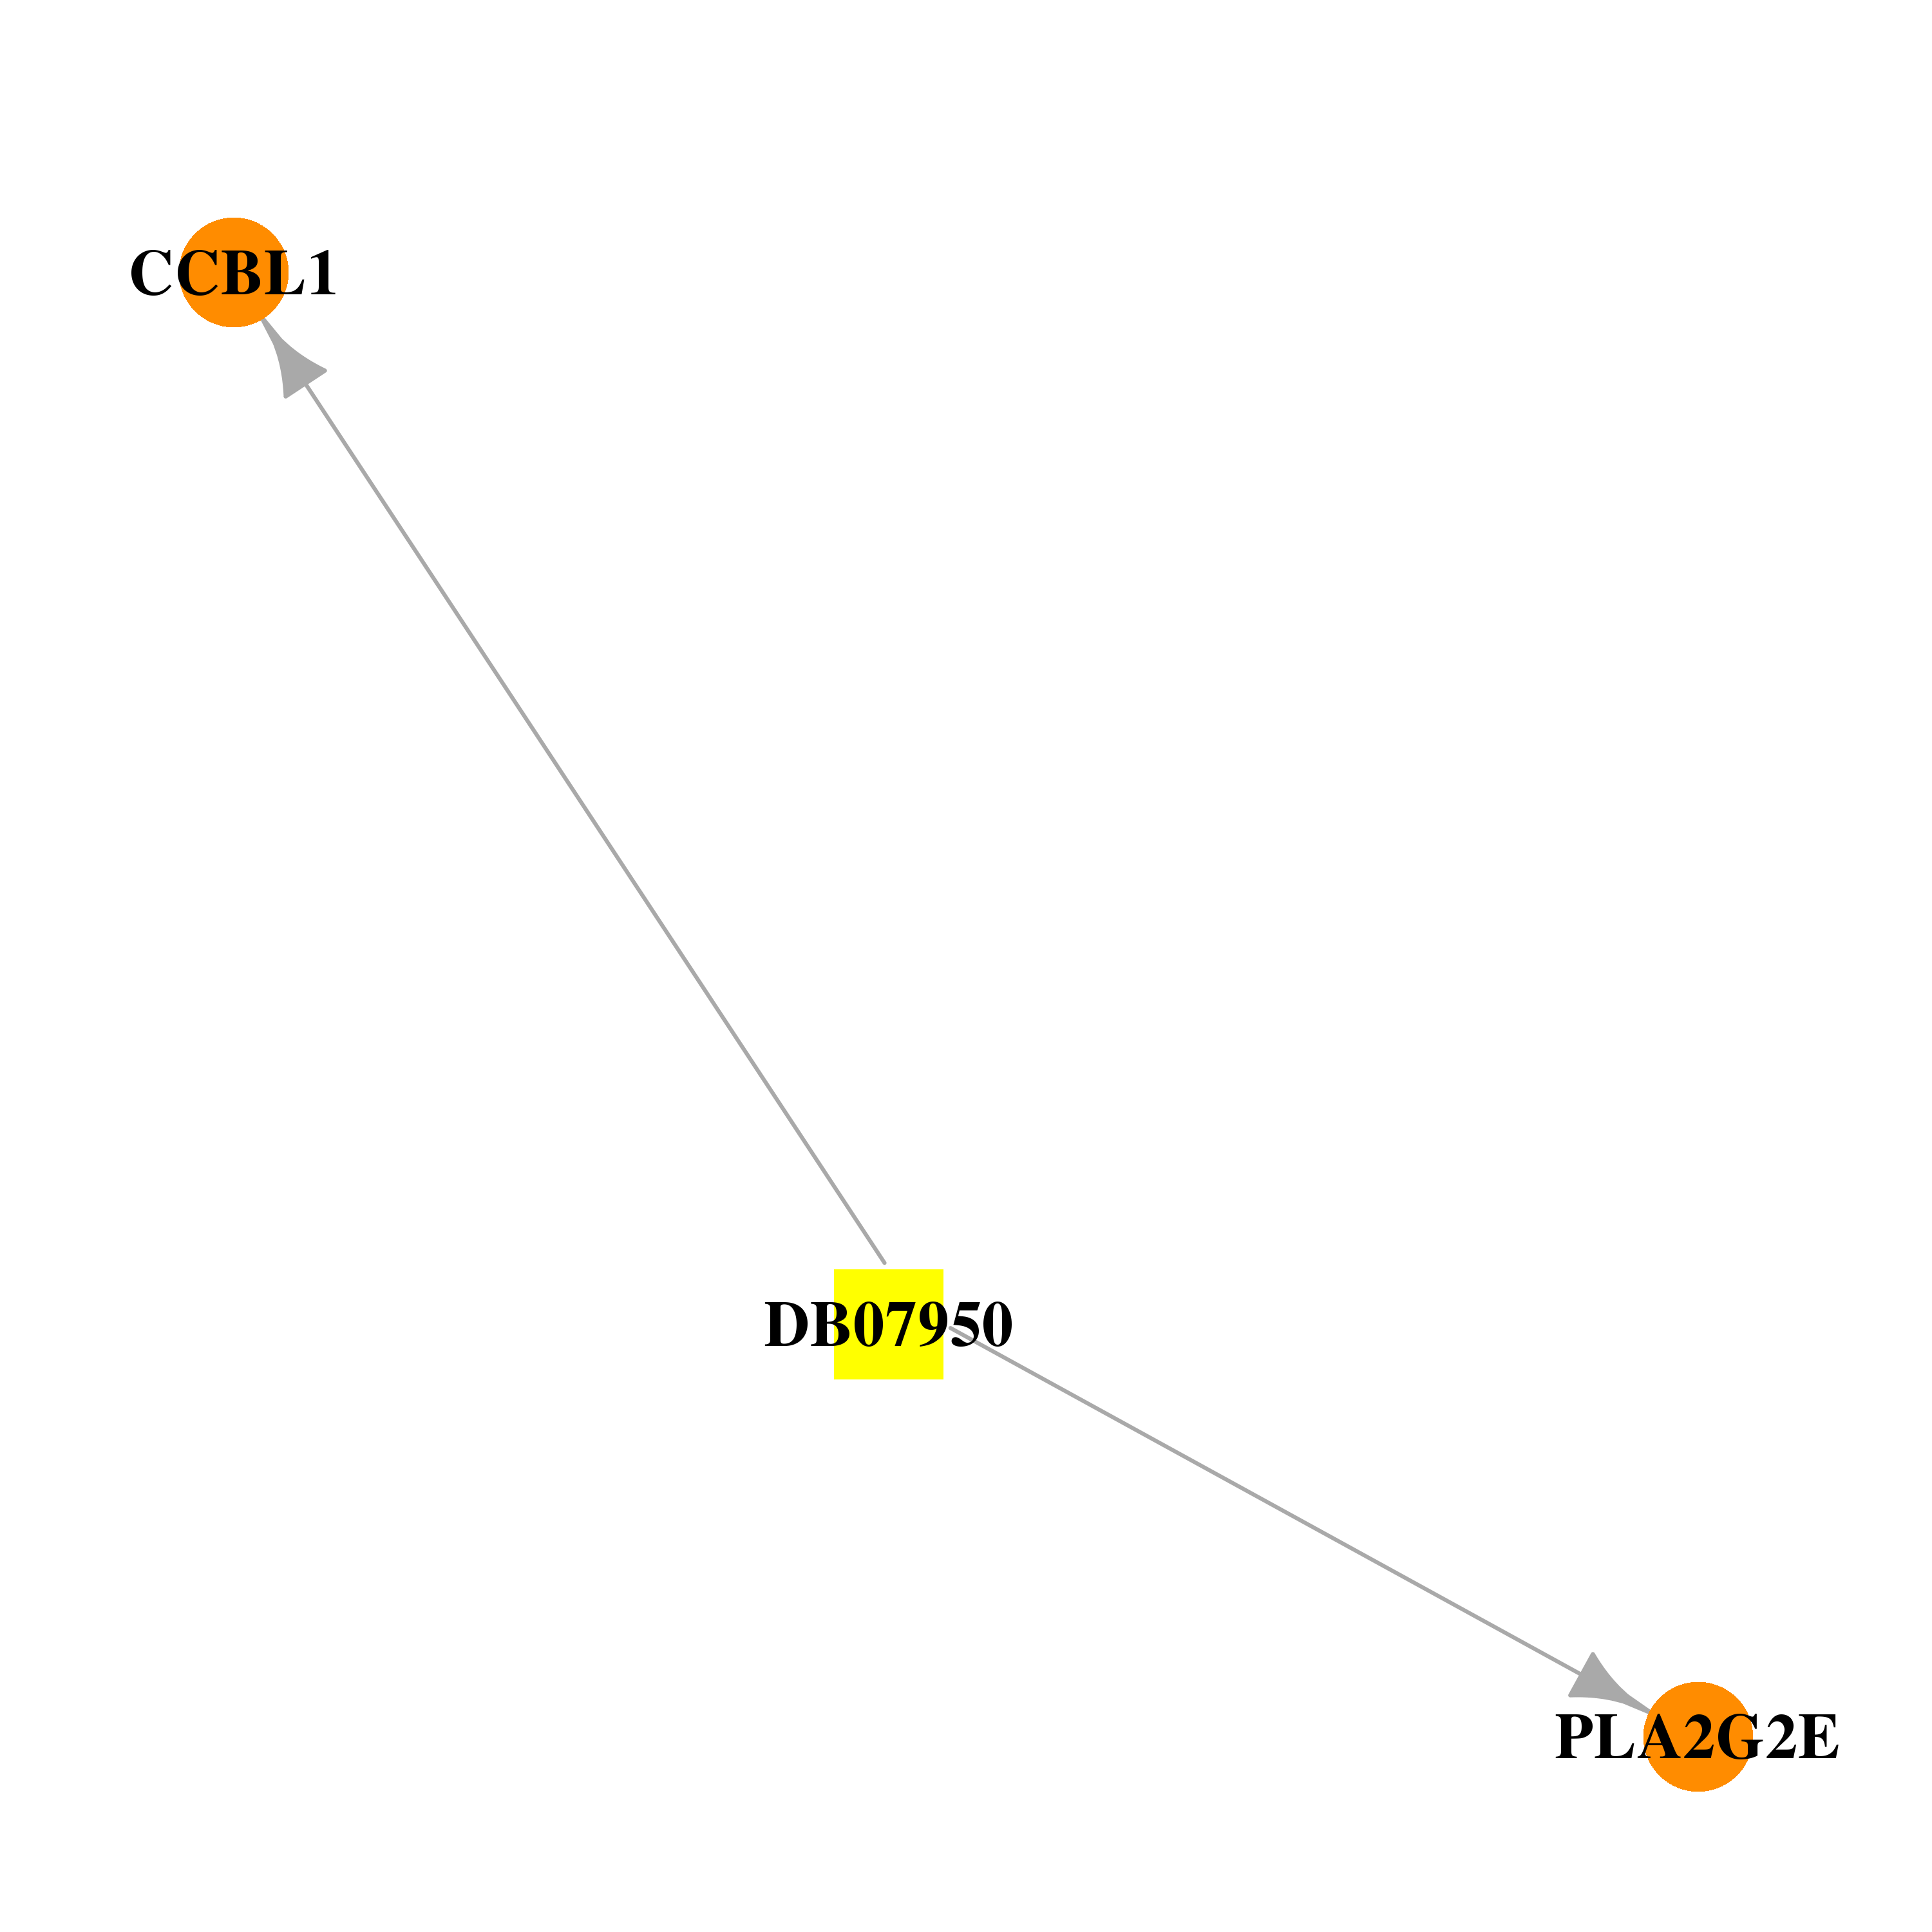 |  |
| DB07958 | phospholipase A2, group IIE | experimental | (2-CARBAMOYLMETHYL-5-PROPYL-OCTAHYDRO-INDOL-7-YL)ACETIC ACID | 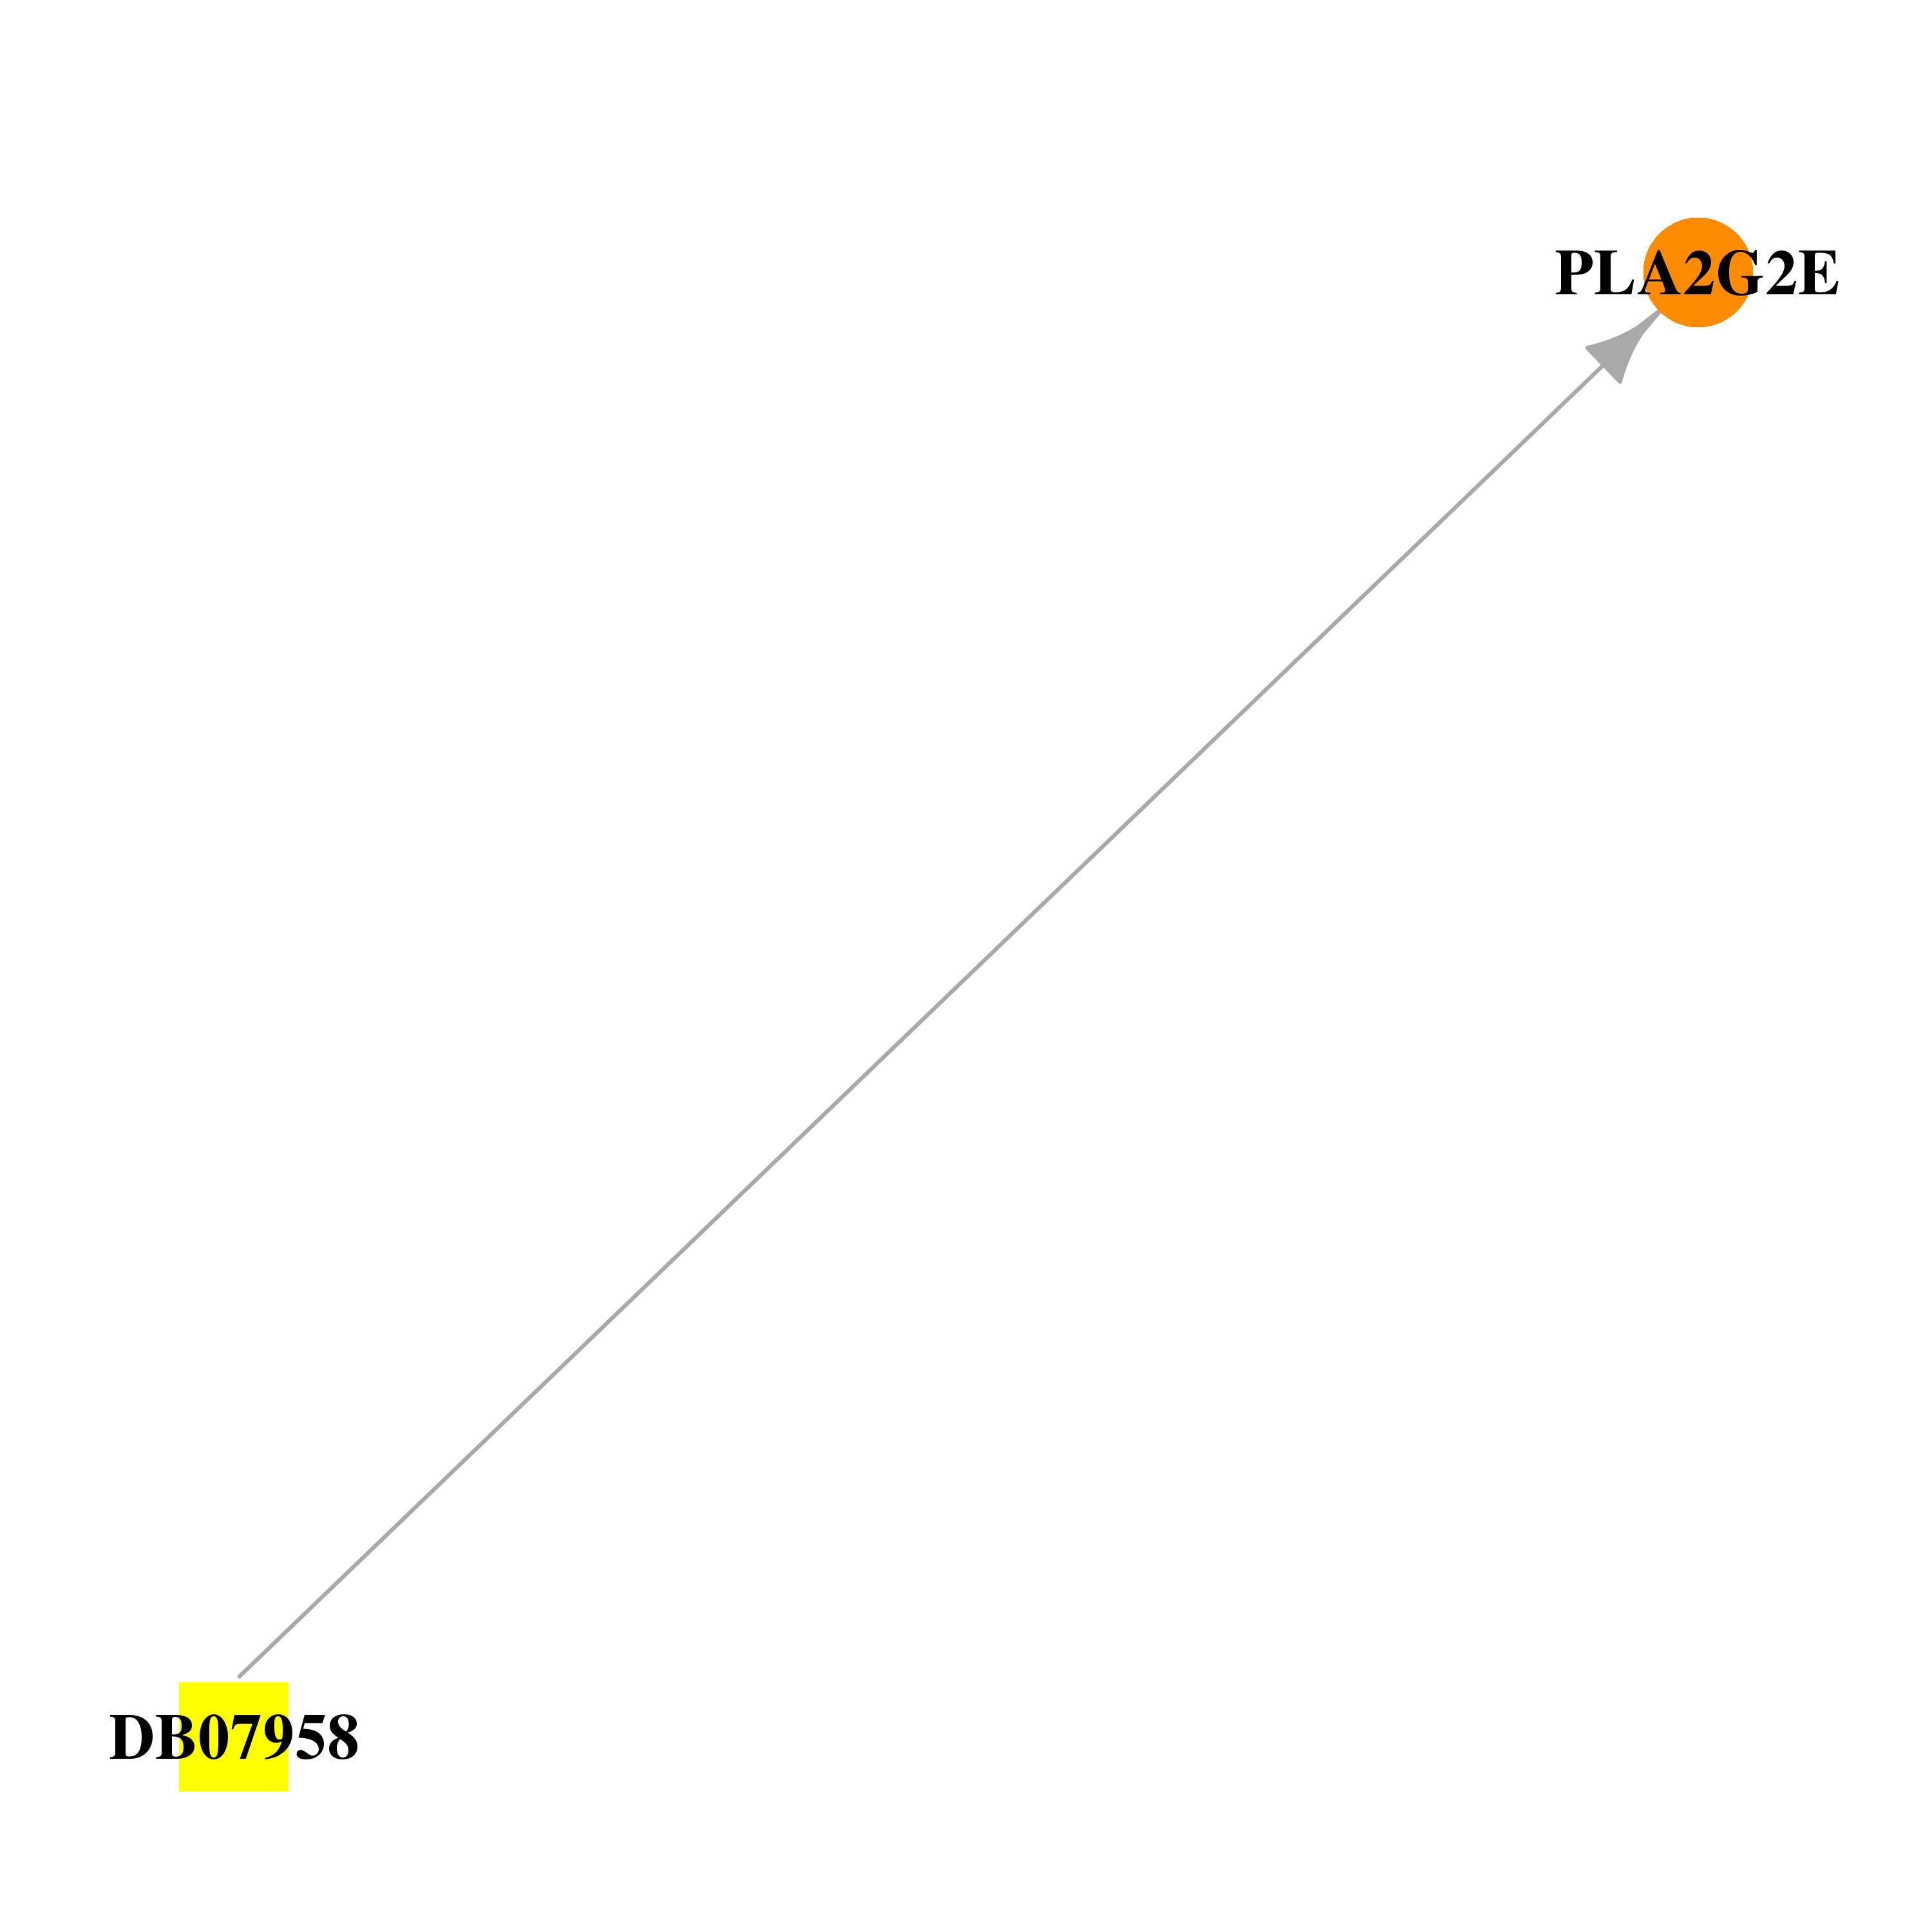 |  |
| DB08447 | phospholipase A2, group IIE | experimental | 3-{3-[(DIMETHYLAMINO)METHYL]-1H-INDOL-7-YL}PROPAN-1-OL |  |  |
| Top |
| Cross referenced IDs for PLA2G2E |
| * We obtained these cross-references from Uniprot database. It covers 150 different DBs, 18 categories. http://www.uniprot.org/help/cross_references_section |
: Open all cross reference information
|
Copyright © 2016-Present - The Univsersity of Texas Health Science Center at Houston @ |