|
||||||||||||||||||||||||||||||||||||||||||||||||||||||||||||||||||||||||||||||||||||||||||||||||||||||||||||||||||||||||||||||||||||||||||||||||||||||||||||||||||||||||||||||||||||||||||||||||||||||||||||||||||||||||||||||||||||||||||||||||||||||||||||||||||||||||||||||||||||||||||||||||||||||||||||||||||||||||||
| |
| Phenotypic Information (metabolism pathway, cancer, disease, phenome) |
| |
| |
| Gene-Gene Network Information: Co-Expression Network, Interacting Genes & KEGG |
| |
|


| Gene Summary for HSPD1 |
| Basic gene info. | Gene symbol | HSPD1 |
| Gene name | heat shock 60kDa protein 1 (chaperonin) | |
| Synonyms | CPN60|GROEL|HLD4|HSP-60|HSP60|HSP65|HuCHA60|SPG13 | |
| Cytomap | UCSC genome browser: 2q33.1 | |
| Genomic location | chr2 :198351307-198364998 | |
| Type of gene | protein-coding | |
| RefGenes | NM_002156.4, NM_199440.1, | |
| Ensembl id | ENSG00000144381 | |
| Description | 60 kDa chaperonin60 kDa heat shock protein, mitochondrialP60 lymphocyte proteinchaperonin 60heat shock protein 65mitochondrial matrix protein P1short heat shock protein 60 Hsp60s1 | |
| Modification date | 20141207 | |
| dbXrefs | MIM : 118190 | |
| HGNC : HGNC | ||
| Ensembl : ENSG00000144381 | ||
| HPRD : 00318 | ||
| Vega : OTTHUMG00000154463 | ||
| Protein | UniProt: go to UniProt's Cross Reference DB Table | |
| Expression | CleanEX: HS_HSPD1 | |
| BioGPS: 3329 | ||
| Gene Expression Atlas: ENSG00000144381 | ||
| The Human Protein Atlas: ENSG00000144381 | ||
| Pathway | NCI Pathway Interaction Database: HSPD1 | |
| KEGG: HSPD1 | ||
| REACTOME: HSPD1 | ||
| ConsensusPathDB | ||
| Pathway Commons: HSPD1 | ||
| Metabolism | MetaCyc: HSPD1 | |
| HUMANCyc: HSPD1 | ||
| Regulation | Ensembl's Regulation: ENSG00000144381 | |
| miRBase: chr2 :198,351,307-198,364,998 | ||
| TargetScan: NM_002156 | ||
| cisRED: ENSG00000144381 | ||
| Context | iHOP: HSPD1 | |
| cancer metabolism search in PubMed: HSPD1 | ||
| UCL Cancer Institute: HSPD1 | ||
| Assigned class in ccmGDB | C | |
| Top |
| Phenotypic Information for HSPD1(metabolism pathway, cancer, disease, phenome) |
| Cancer | CGAP: HSPD1 |
| Familial Cancer Database: HSPD1 | |
| * This gene is included in those cancer gene databases. |
|
|
|
|
|
| . | ||||||||||||||||||||||||||||||||||||||||||||||||||||||||||||||||||||||||||||||||||||||||||||||||||||||||||||||||||||||||||||||||||||||||||||||||||||||||||||||||||||||||||||||||||||||||||||||||||||||||||||||||||||||||||||||||||||||||||||||||||||||||||||||||||||||||||||||||||||||||||||||||||||||||||||||||||||
Oncogene 1 | Significant driver gene in | |||||||||||||||||||||||||||||||||||||||||||||||||||||||||||||||||||||||||||||||||||||||||||||||||||||||||||||||||||||||||||||||||||||||||||||||||||||||||||||||||||||||||||||||||||||||||||||||||||||||||||||||||||||||||||||||||||||||||||||||||||||||||||||||||||||||||||||||||||||||||||||||||||||||||||||||||||||||||
| cf) number; DB name 1 Oncogene; http://nar.oxfordjournals.org/content/35/suppl_1/D721.long, 2 Tumor Suppressor gene; https://bioinfo.uth.edu/TSGene/, 3 Cancer Gene Census; http://www.nature.com/nrc/journal/v4/n3/abs/nrc1299.html, 4 CancerGenes; http://nar.oxfordjournals.org/content/35/suppl_1/D721.long, 5 Network of Cancer Gene; http://ncg.kcl.ac.uk/index.php, 1Therapeutic Vulnerabilities in Cancer; http://cbio.mskcc.org/cancergenomics/statius/ |
| REACTOME_METABOLISM_OF_PROTEINS | |
| OMIM | |
| Orphanet | |
| Disease | KEGG Disease: HSPD1 |
| MedGen: HSPD1 (Human Medical Genetics with Condition) | |
| ClinVar: HSPD1 | |
| Phenotype | MGI: HSPD1 (International Mouse Phenotyping Consortium) |
| PhenomicDB: HSPD1 | |
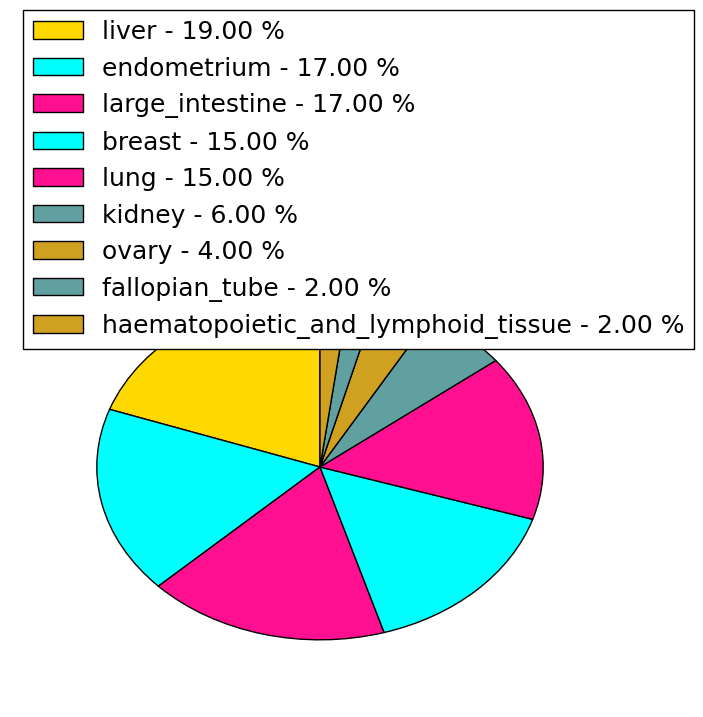
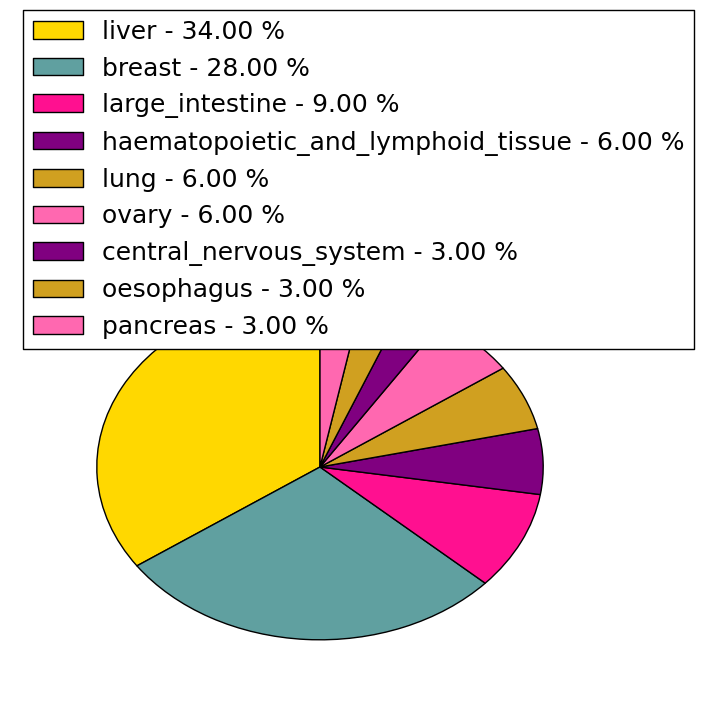
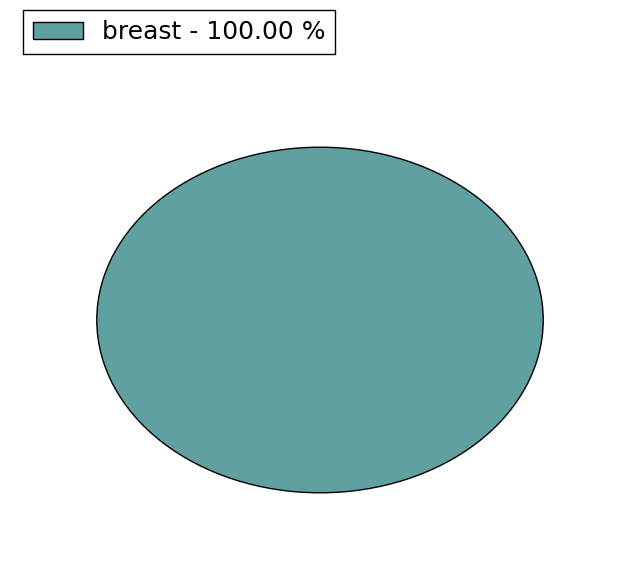
| Mutations for HSPD1 |
| * Under tables are showing count per each tissue to give us broad intuition about tissue specific mutation patterns.You can go to the detailed page for each mutation database's web site. |
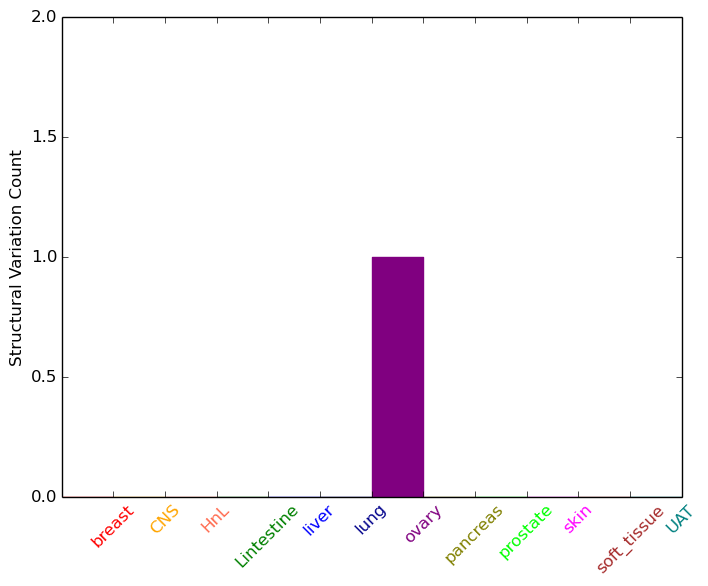
| - Statistics for Tissue and Mutation type | Top |
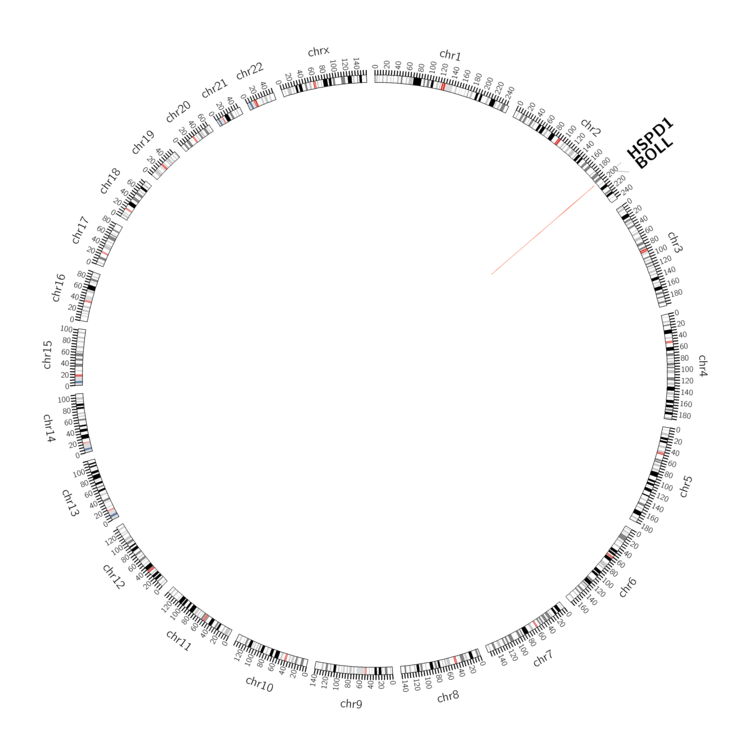 |
| - For Inter-chromosomal Variations |
| There's no inter-chromosomal structural variation. |
| - For Intra-chromosomal Variations |
| * Intra-chromosomal variantions includes 'intrachromosomal amplicon to amplicon', 'intrachromosomal amplicon to non-amplified dna', 'intrachromosomal deletion', 'intrachromosomal fold-back inversion', 'intrachromosomal inversion', 'intrachromosomal tandem duplication', 'Intrachromosomal unknown type', 'intrachromosomal with inverted orientation', 'intrachromosomal with non-inverted orientation'. |
 |
| Sample | Symbol_a | Chr_a | Start_a | End_a | Symbol_b | Chr_b | Start_b | End_b |
| ovary | HSPD1 | chr2 | 198363597 | 198363617 | BOLL | chr2 | 198640485 | 198640505 |
| cf) Tissue number; Tissue name (1;Breast, 2;Central_nervous_system, 3;Haematopoietic_and_lymphoid_tissue, 4;Large_intestine, 5;Liver, 6;Lung, 7;Ovary, 8;Pancreas, 9;Prostate, 10;Skin, 11;Soft_tissue, 12;Upper_aerodigestive_tract) |
| * From mRNA Sanger sequences, Chitars2.0 arranged chimeric transcripts. This table shows HSPD1 related fusion information. |
| ID | Head Gene | Tail Gene | Accession | Gene_a | qStart_a | qEnd_a | Chromosome_a | tStart_a | tEnd_a | Gene_a | qStart_a | qEnd_a | Chromosome_a | tStart_a | tEnd_a |
| EG328792 | LOC728190 | 9 | 493 | 10 | 88992357 | 88993327 | HSPD1 | 493 | 622 | 2 | 198352587 | 198352716 | |
| DB195849 | HSPA8 | 1 | 88 | 11 | 122930042 | 122930127 | HSPD1 | 89 | 555 | 2 | 198361911 | 198364590 | |
| BC047350 | CDH12 | 22 | 264 | 5 | 21883542 | 21883784 | HSPD1 | 262 | 2391 | 2 | 198351308 | 198363518 | |
| Top |
| Mutation type/ Tissue ID | brca | cns | cerv | endome | haematopo | kidn | Lintest | liver | lung | ns | ovary | pancre | prost | skin | stoma | thyro | urina | |||
| Total # sample | 1 | 1 | ||||||||||||||||||
| GAIN (# sample) | 1 | |||||||||||||||||||
| LOSS (# sample) | 1 |
| cf) Tissue ID; Tissue type (1; Breast, 2; Central_nervous_system, 3; Cervix, 4; Endometrium, 5; Haematopoietic_and_lymphoid_tissue, 6; Kidney, 7; Large_intestine, 8; Liver, 9; Lung, 10; NS, 11; Ovary, 12; Pancreas, 13; Prostate, 14; Skin, 15; Stomach, 16; Thyroid, 17; Urinary_tract) |
| Top |
|
 |
| Top |
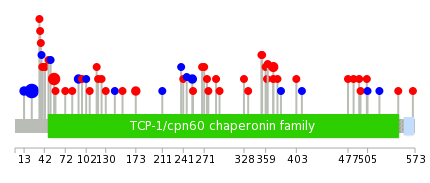
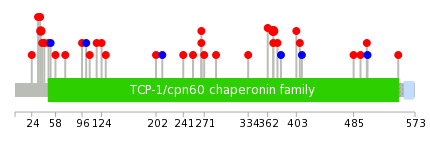
| Stat. for Non-Synonymous SNVs (# total SNVs=46) | (# total SNVs=32) |
 |  |
(# total SNVs=1) | (# total SNVs=1) |
 |  |
| Top |
| * When you move the cursor on each content, you can see more deailed mutation information on the Tooltip. Those are primary_site,primary_histology,mutation(aa),pubmedID. |
| GRCh37 position | Mutation(aa) | Unique sampleID count |
| chr2:198363501-198363501 | p.R24R | 25 |
| chr2:198363406-198363406 | p.G56E | 9 |
| chr2:198353833-198353833 | p.R370C | 4 |
| chr2:198358155-198358155 | p.I254I | 2 |
| chr2:198353095-198353095 | p.R446* | 2 |
| chr2:198363534-198363534 | p.P13P | 2 |
| chr2:198362018-198362018 | p.K91K | 2 |
| chr2:198359469-198359469 | p.T173M | 2 |
| chr2:198352674-198352674 | p.K493E | 1 |
| chr2:198360068-198360068 | p.E154K | 1 |
| Top |
|
 |
| Point Mutation/ Tissue ID | 1 | 2 | 3 | 4 | 5 | 6 | 7 | 8 | 9 | 10 | 11 | 12 | 13 | 14 | 15 | 16 | 17 | 18 | 19 | 20 |
| # sample | 3 | 3 | 3 | 1 | 1 | 1 | 1 | 5 | 3 | 1 | 1 | 4 | 4 | 5 | ||||||
| # mutation | 3 | 3 | 5 | 1 | 1 | 1 | 1 | 6 | 3 | 1 | 1 | 4 | 5 | 3 | ||||||
| nonsynonymous SNV | 3 | 3 | 4 | 1 | 1 | 1 | 1 | 5 | 2 | 1 | 4 | 4 | 3 | |||||||
| synonymous SNV | 1 | 1 | 1 | 1 | 1 |
| cf) Tissue ID; Tissue type (1; BLCA[Bladder Urothelial Carcinoma], 2; BRCA[Breast invasive carcinoma], 3; CESC[Cervical squamous cell carcinoma and endocervical adenocarcinoma], 4; COAD[Colon adenocarcinoma], 5; GBM[Glioblastoma multiforme], 6; Glioma Low Grade, 7; HNSC[Head and Neck squamous cell carcinoma], 8; KICH[Kidney Chromophobe], 9; KIRC[Kidney renal clear cell carcinoma], 10; KIRP[Kidney renal papillary cell carcinoma], 11; LAML[Acute Myeloid Leukemia], 12; LUAD[Lung adenocarcinoma], 13; LUSC[Lung squamous cell carcinoma], 14; OV[Ovarian serous cystadenocarcinoma ], 15; PAAD[Pancreatic adenocarcinoma], 16; PRAD[Prostate adenocarcinoma], 17; SKCM[Skin Cutaneous Melanoma], 18:STAD[Stomach adenocarcinoma], 19:THCA[Thyroid carcinoma], 20:UCEC[Uterine Corpus Endometrial Carcinoma]) |
| Top |
| * We represented just top 10 SNVs. When you move the cursor on each content, you can see more deailed mutation information on the Tooltip. Those are primary_site, primary_histology, mutation(aa), pubmedID. |
| Genomic Position | Mutation(aa) | Unique sampleID count |
| chr2:198353833 | p.R370C,HSPD1 | 4 |
| chr2:198363463 | p.R37Q,HSPD1 | 2 |
| chr2:198353733 | p.L288F,HSPD1 | 1 |
| chr2:198358196 | p.V51V,HSPD1 | 1 |
| chr2:198363420 | p.L271F,HSPD1 | 1 |
| chr2:198353798 | p.A48D,HSPD1 | 1 |
| chr2:198358950 | p.H267L,HSPD1 | 1 |
| chr2:198363430 | p.Q42K,HSPD1 | 1 |
| chr2:198353814 | p.I549S,HSPD1 | 1 |
| chr2:198359381 | p.H267N,HSPD1 | 1 |
| * Copy number data were extracted from TCGA using R package TCGA-Assembler. The URLs of all public data files on TCGA DCC data server were gathered on Jan-05-2015. Function ProcessCNAData in TCGA-Assembler package was used to obtain gene-level copy number value which is calculated as the average copy number of the genomic region of a gene. |
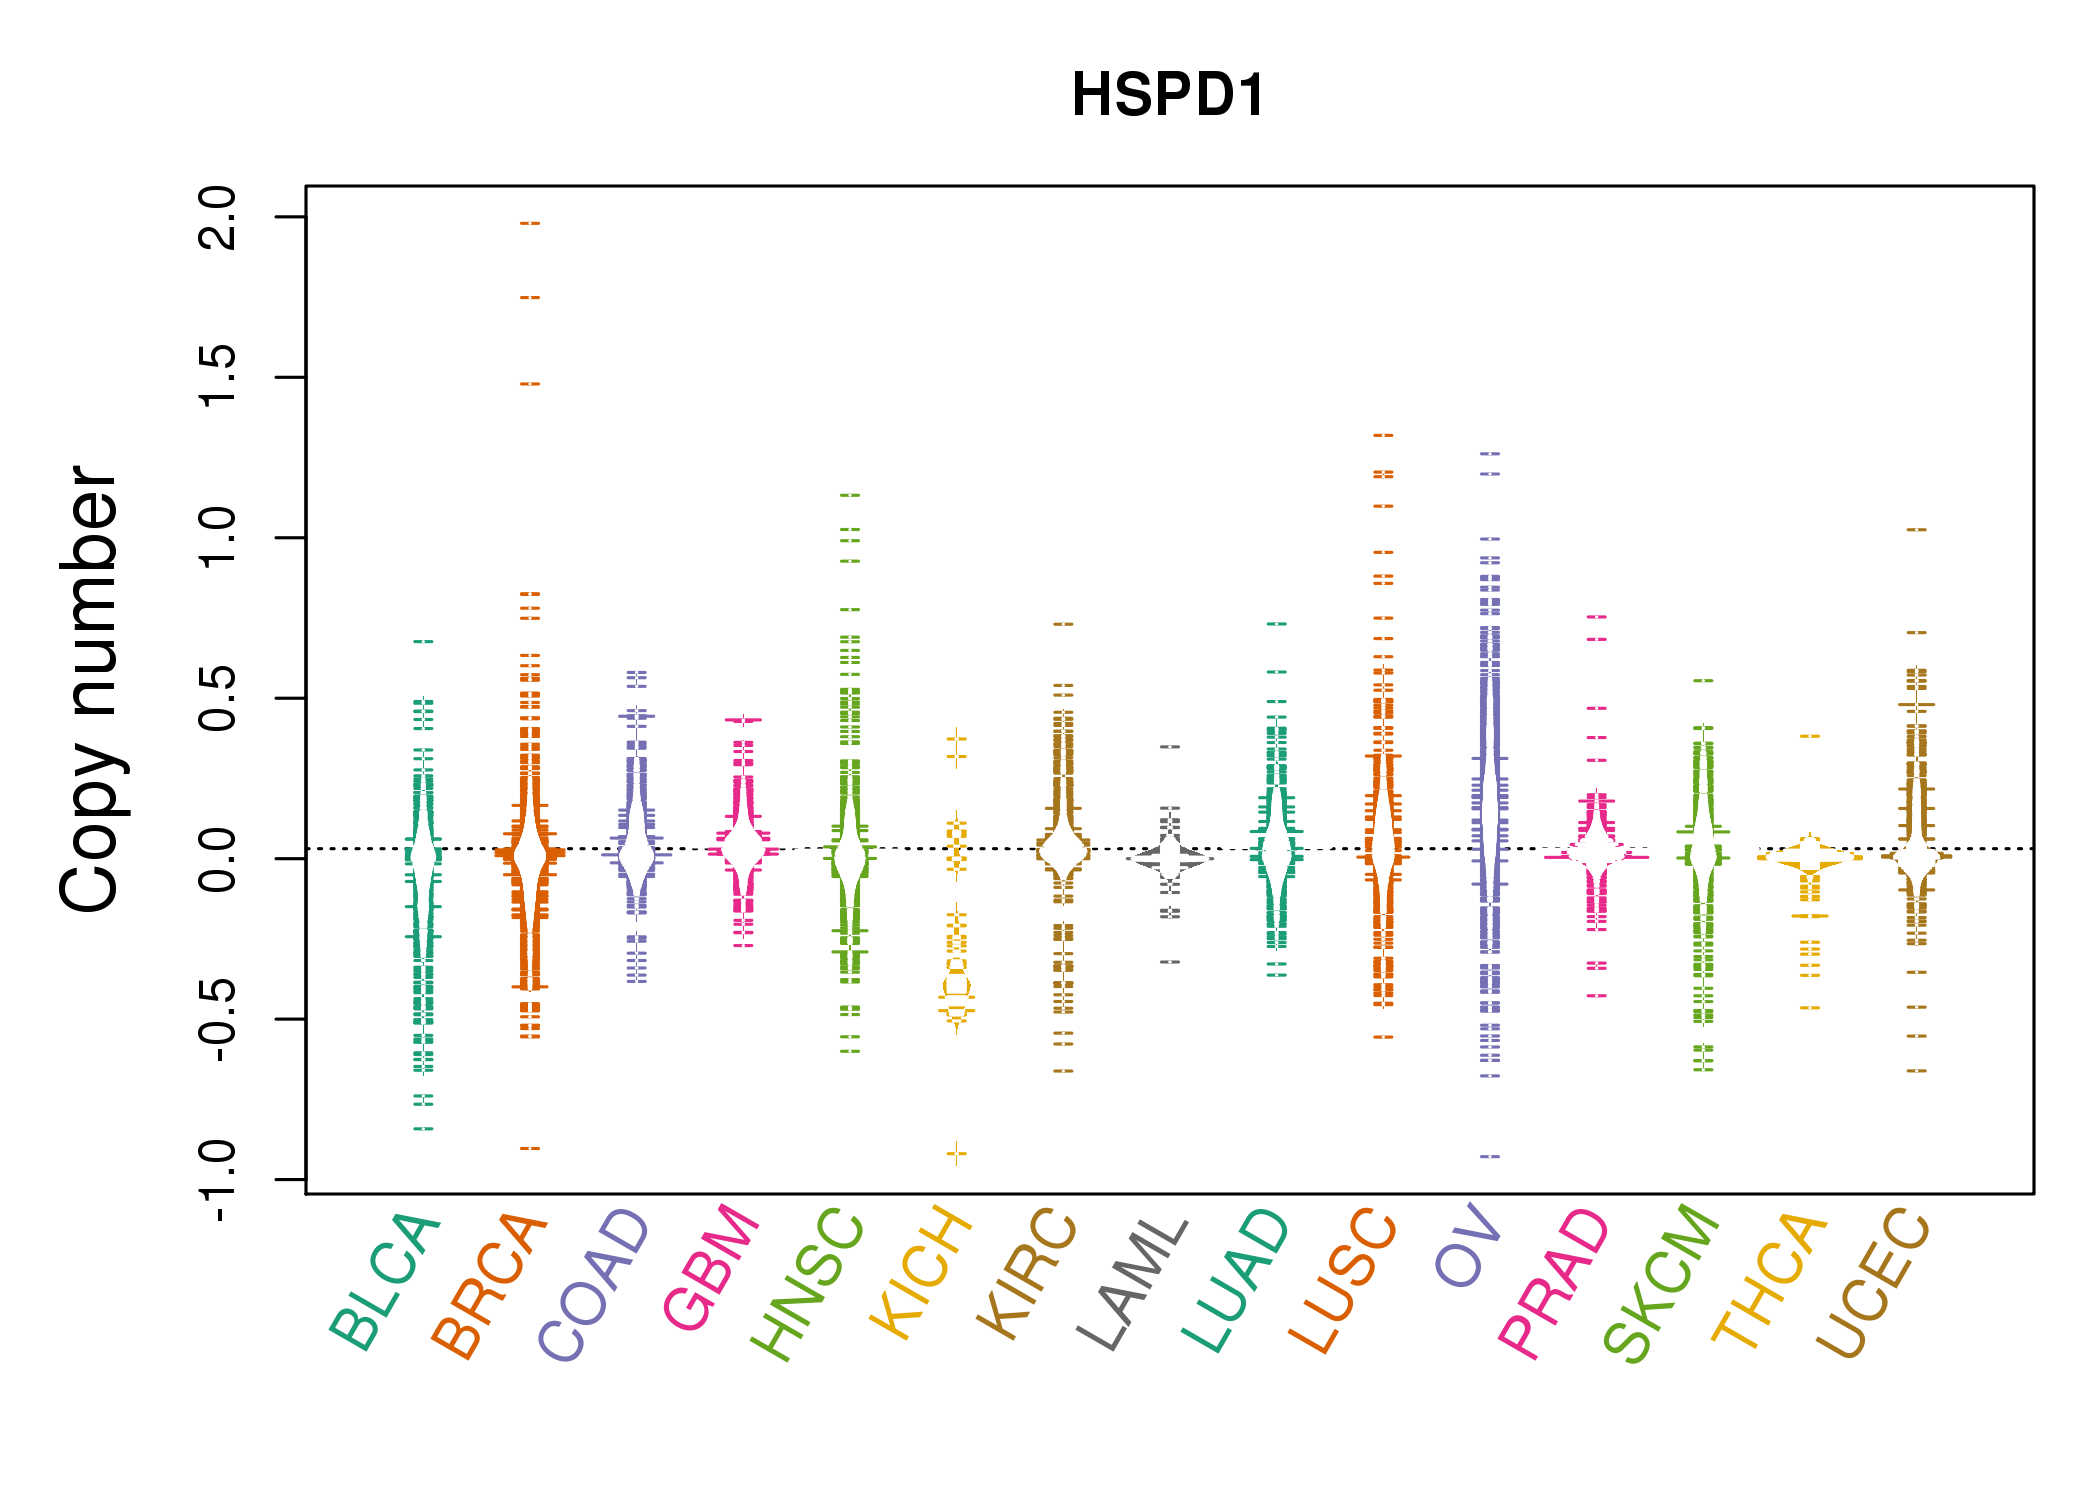 |
| cf) Tissue ID[Tissue type]: BLCA[Bladder Urothelial Carcinoma], BRCA[Breast invasive carcinoma], CESC[Cervical squamous cell carcinoma and endocervical adenocarcinoma], COAD[Colon adenocarcinoma], GBM[Glioblastoma multiforme], Glioma Low Grade, HNSC[Head and Neck squamous cell carcinoma], KICH[Kidney Chromophobe], KIRC[Kidney renal clear cell carcinoma], KIRP[Kidney renal papillary cell carcinoma], LAML[Acute Myeloid Leukemia], LUAD[Lung adenocarcinoma], LUSC[Lung squamous cell carcinoma], OV[Ovarian serous cystadenocarcinoma ], PAAD[Pancreatic adenocarcinoma], PRAD[Prostate adenocarcinoma], SKCM[Skin Cutaneous Melanoma], STAD[Stomach adenocarcinoma], THCA[Thyroid carcinoma], UCEC[Uterine Corpus Endometrial Carcinoma] |
| Top |
| Gene Expression for HSPD1 |
| * CCLE gene expression data were extracted from CCLE_Expression_Entrez_2012-10-18.res: Gene-centric RMA-normalized mRNA expression data. |
 |
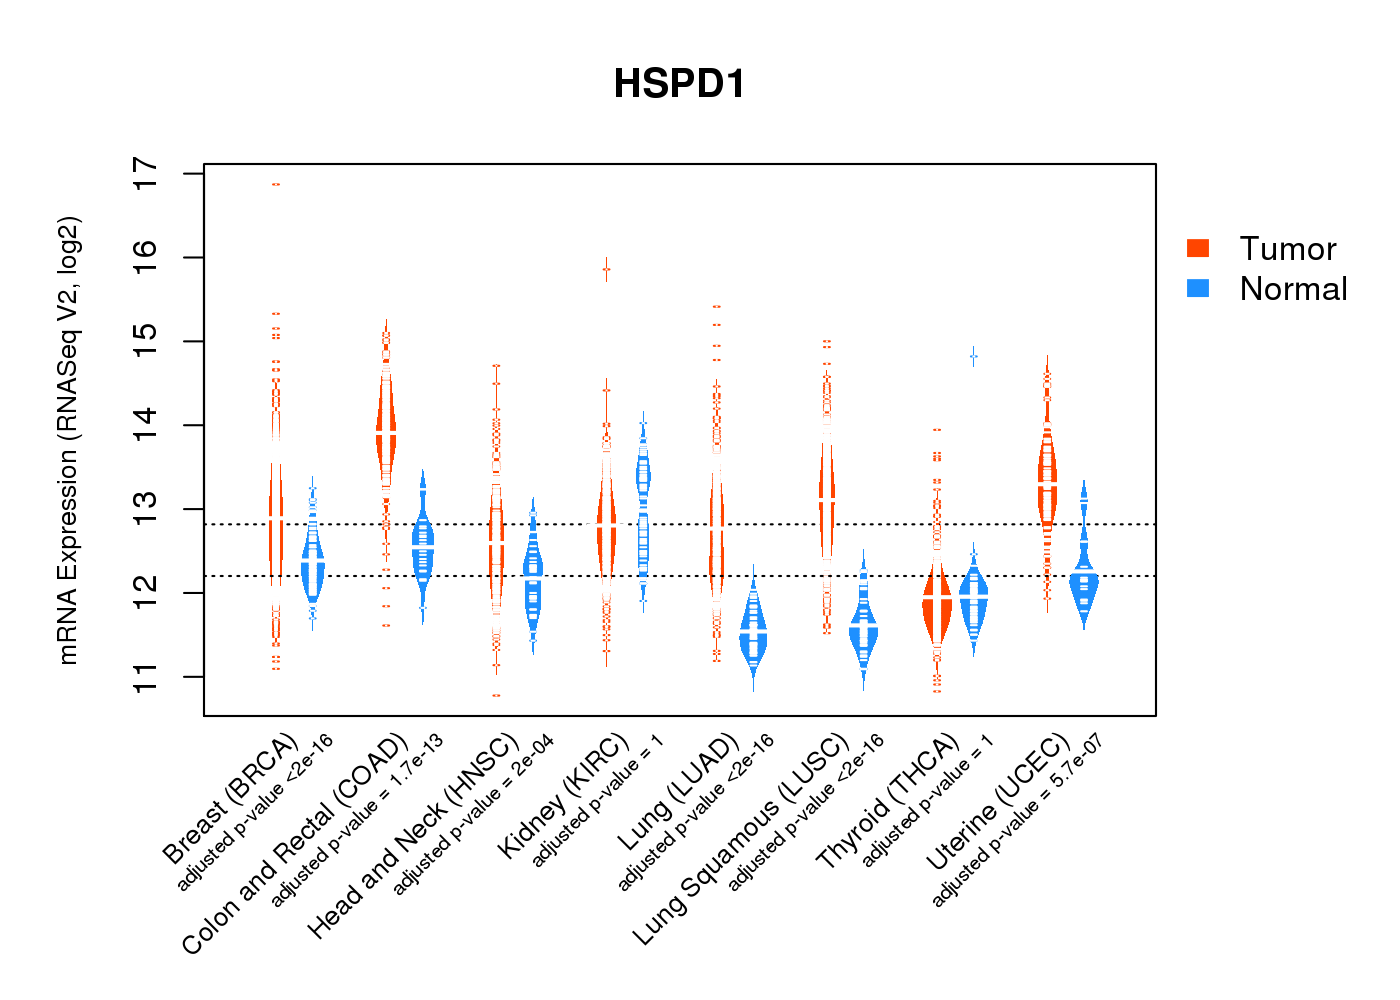
| * Normalized gene expression data of RNASeqV2 was extracted from TCGA using R package TCGA-Assembler. The URLs of all public data files on TCGA DCC data server were gathered at Jan-05-2015. Only eight cancer types have enough normal control samples for differential expression analysis. (t test, adjusted p<0.05 (using Benjamini-Hochberg FDR)) |
 |
| Top |
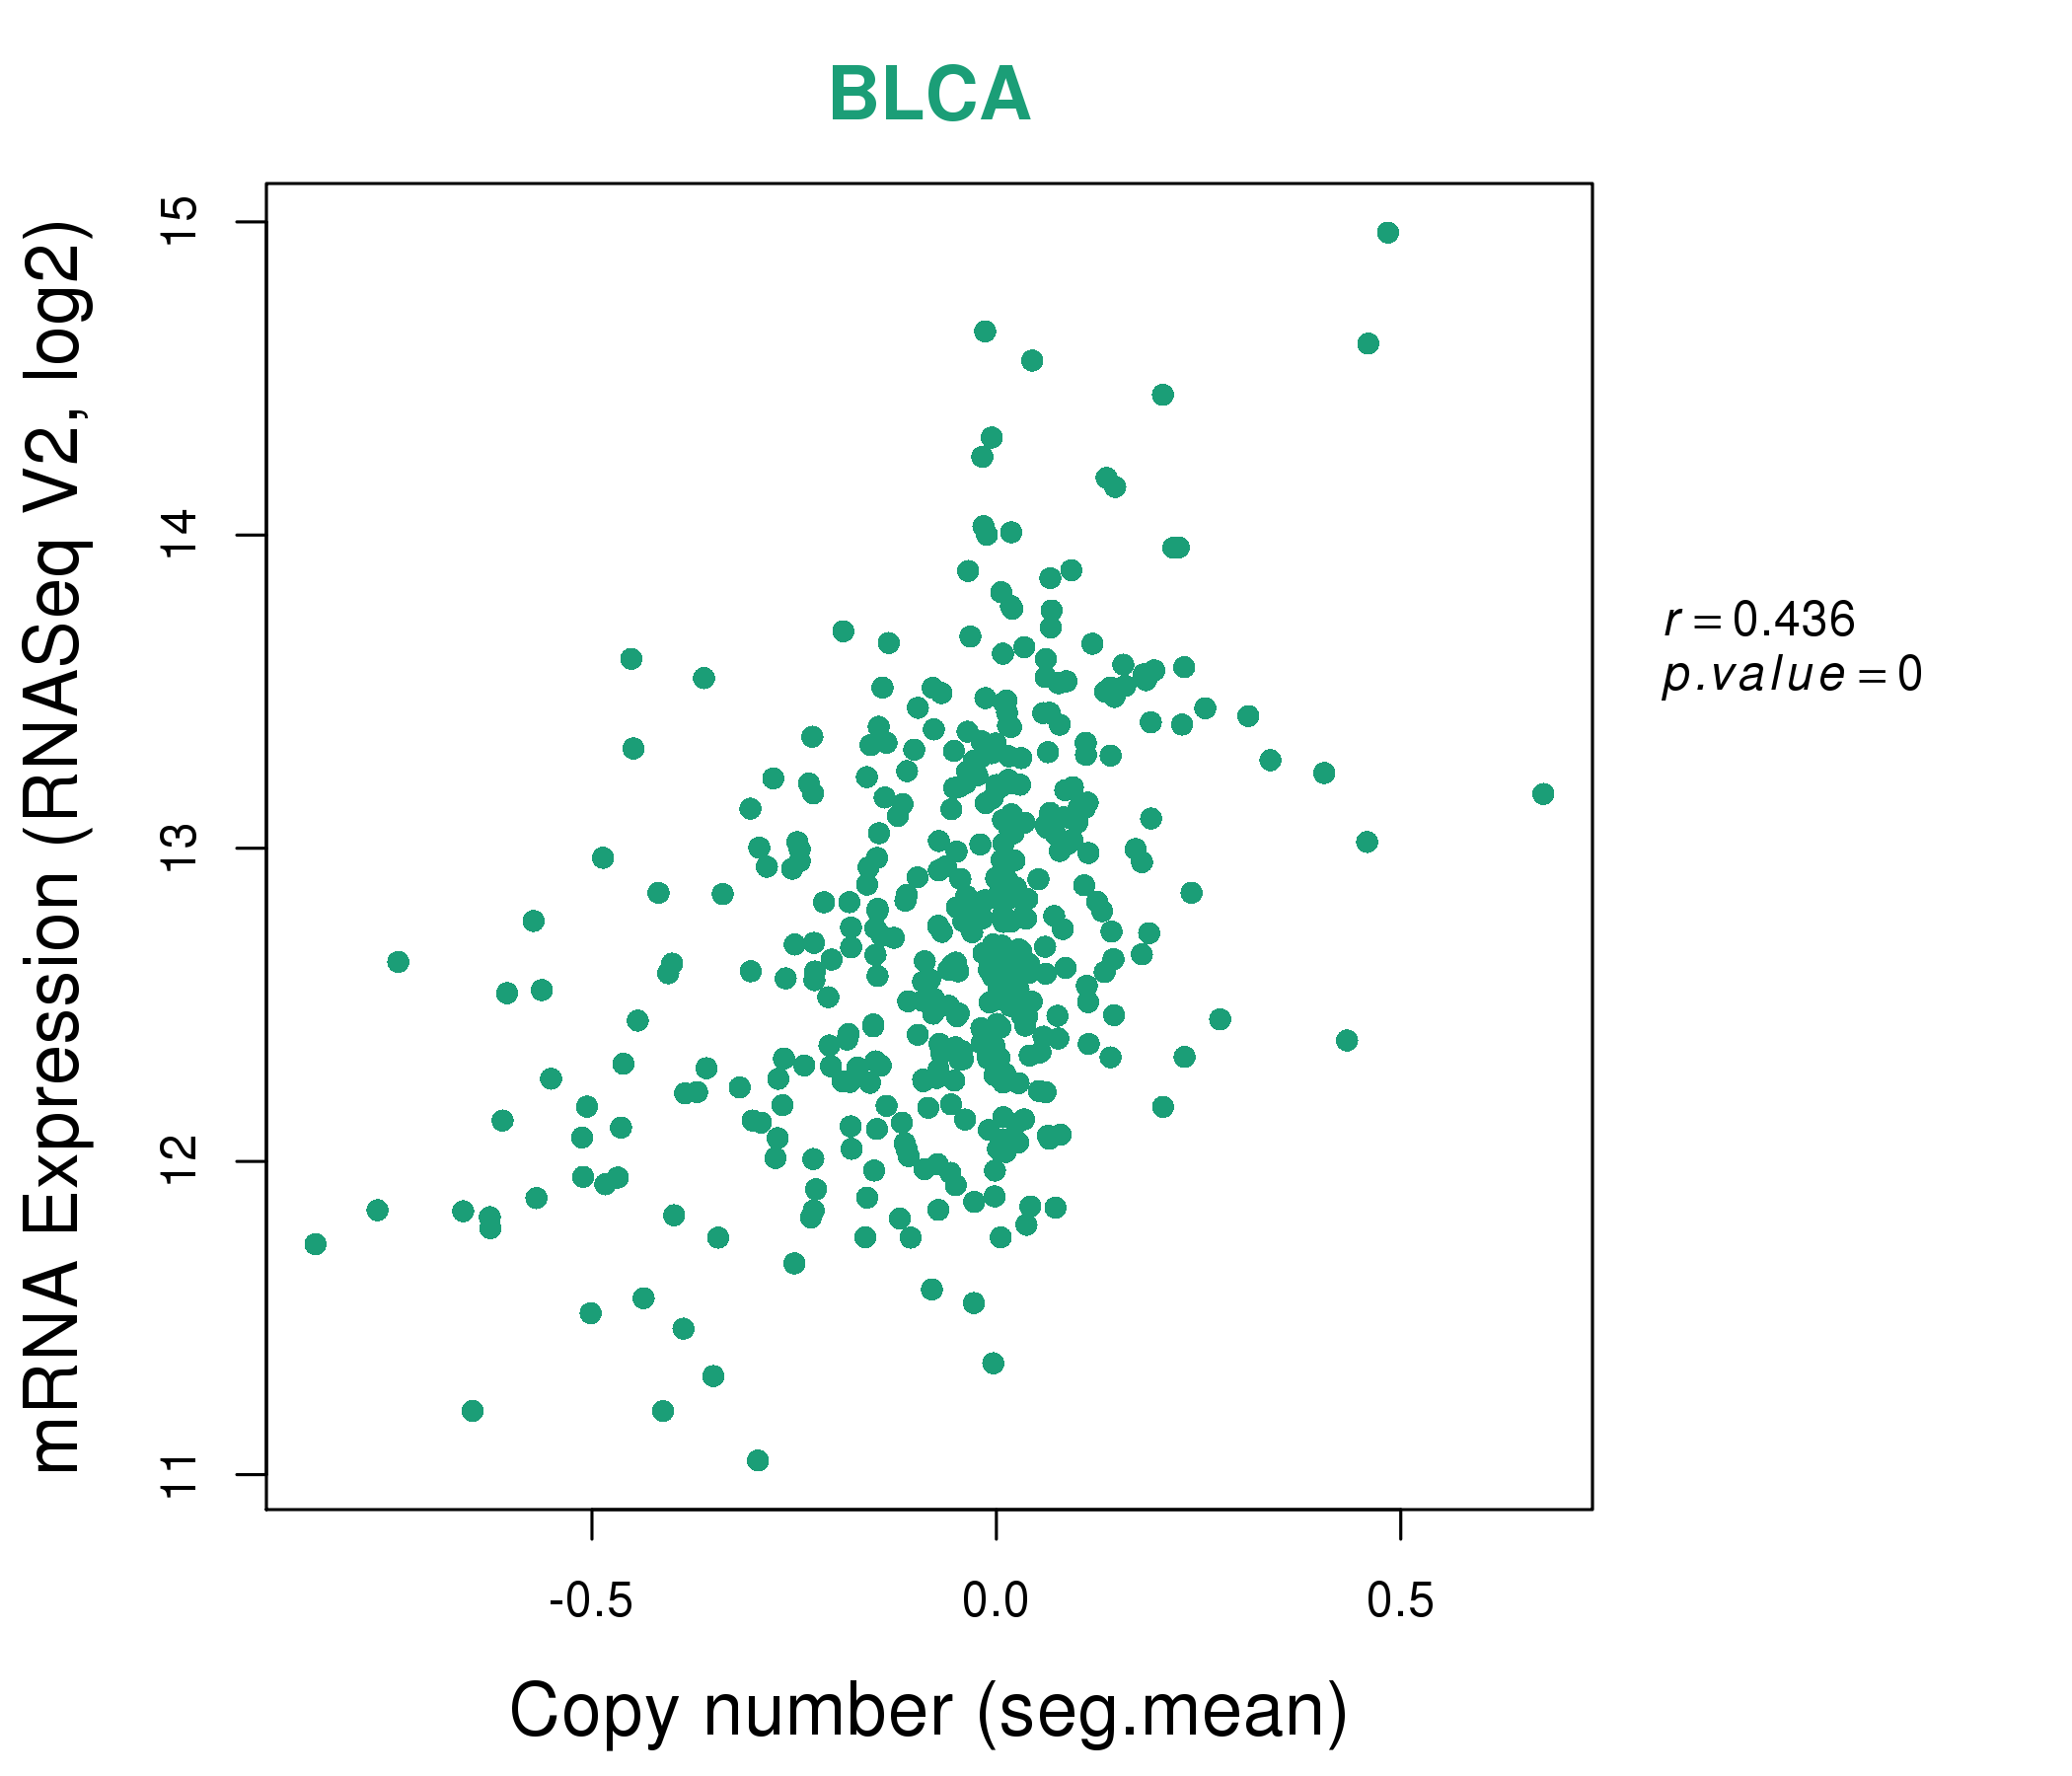
| * This plots show the correlation between CNV and gene expression. |
: Open all plots for all cancer types
 |
|
 |
|


| Top |
| Gene-Gene Network Information |
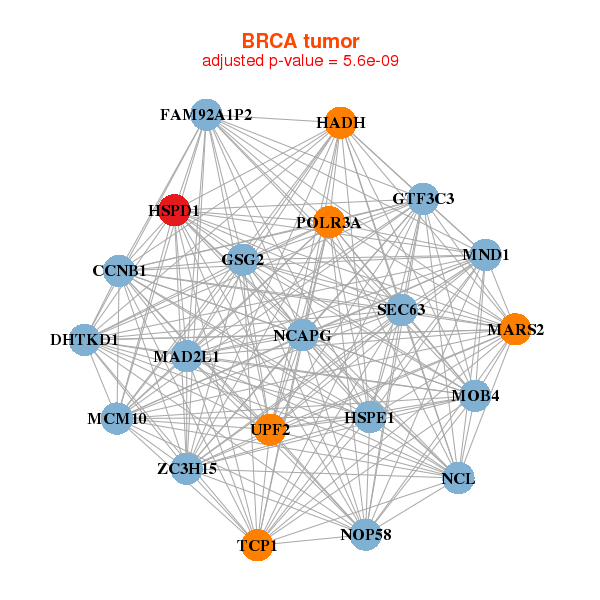
| * Co-Expression network figures were drawn using R package igraph. Only the top 20 genes with the highest correlations were shown. Red circle: input gene, orange circle: cell metabolism gene, sky circle: other gene |
: Open all plots for all cancer types
 |
|
| CCNB1,DHTKD1,FAM92A1P2,GSG2,GTF3C3,HADH,HSPD1, HSPE1,MAD2L1,MARS2,MCM10,MND1,MOB4,NCAPG, NCL,NOP58,POLR3A,SEC63,TCP1,UPF2,ZC3H15 | ACY1,BDH1,CCT4,CCT6A,CCT8,DAP3,GGCT, HSPD1,HSPE1,KPNB1,MRPL45,LRRC75A-AS1,NOL10,PMPCB, PPP1R1B,QARS,RPL4,RPL7,RSL1D1,SLC25A5,TCP1 |
 |
|
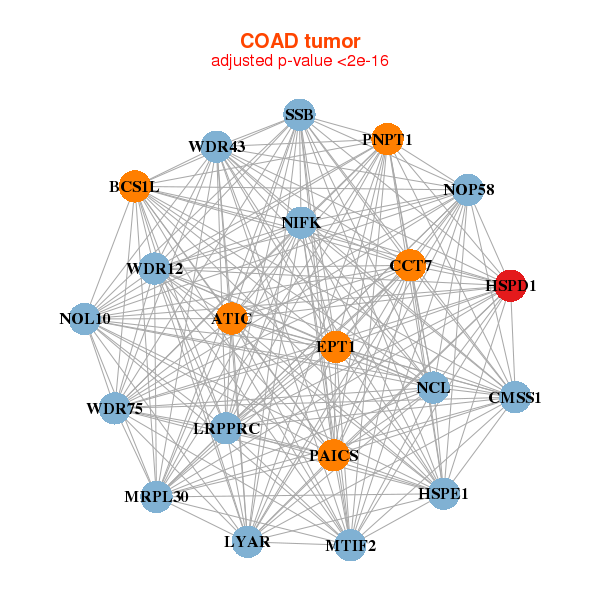
| ATIC,BCS1L,CMSS1,CCT7,EPT1,HSPD1,HSPE1, LRPPRC,LYAR,NIFK,MRPL30,MTIF2,NCL,NOL10, NOP58,PAICS,PNPT1,SSB,WDR12,WDR43,WDR75 | CCT5,CCT6A,CCT8,CDC25A,CHAF1B,CHEK1,DTL, ECT2,EXO1,GGCT,GINS4,HELLS,HSPA9,HSPD1, KPNA2,MCM6,MELK,PAICS,RCC1,SRSF1,UMPS |
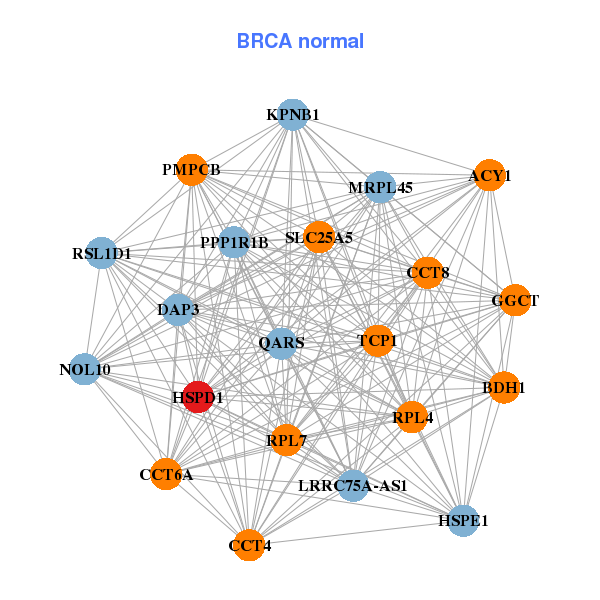

| * Co-Expression network figures were drawn using R package igraph. Only the top 20 genes with the highest correlations were shown. Red circle: input gene, orange circle: cell metabolism gene, sky circle: other gene |
: Open all plots for all cancer types
| Top |
: Open all interacting genes' information including KEGG pathway for all interacting genes from DAVID
| Top |
| Pharmacological Information for HSPD1 |
| There's no related Drug. |
| Top |
| Cross referenced IDs for HSPD1 |
| * We obtained these cross-references from Uniprot database. It covers 150 different DBs, 18 categories. http://www.uniprot.org/help/cross_references_section |
: Open all cross reference information
|
Copyright © 2016-Present - The Univsersity of Texas Health Science Center at Houston @ |