|
|||||||||||||||||||||||||||||||||||||||||||||||||||||||||||||||||||||||||||||||||||||||||||||||||||||||||||||||||||||||||||||||||||||||||||||||||||||||||||||||||||||||||||||||||||||||||||||||||||||||||||||||||||||||||||||||||||||||||||||||||||||||||||||||||||||||||||||||||||||||||||||||||||||||||||||||||||||||||||||||||||||||||||||
| |
| Phenotypic Information (metabolism pathway, cancer, disease, phenome) |
| |
| |
| Gene-Gene Network Information: Co-Expression Network, Interacting Genes & KEGG |
| |
|


| Gene Summary for NDST1 |
| Basic gene info. | Gene symbol | NDST1 |
| Gene name | N-deacetylase/N-sulfotransferase (heparan glucosaminyl) 1 | |
| Synonyms | HSST|MRT46|NST1 | |
| Cytomap | UCSC genome browser: 5q33.1 | |
| Genomic location | chr5 :149887673-149937773 | |
| Type of gene | protein-coding | |
| RefGenes | NM_001301063.1, NM_001543.4, | |
| Ensembl id | ENSG00000070614 | |
| Description | HSNST 1N-HSST 1N-heparan sulfate sulfotransferase 1NDST-1[Heparan sulfate]-glucosamine N-sulfotransferase 1bifunctional heparan sulfate N-deacetylase/N-sulfotransferase 1glucosaminyl N-deacetylase/N-sulfotransferase 1heparan sulfate-N-deacetylase/N | |
| Modification date | 20141222 | |
| dbXrefs | MIM : 600853 | |
| HGNC : HGNC | ||
| Ensembl : ENSG00000070614 | ||
| HPRD : 02912 | ||
| Vega : OTTHUMG00000163572 | ||
| Protein | UniProt: go to UniProt's Cross Reference DB Table | |
| Expression | CleanEX: HS_NDST1 | |
| BioGPS: 3340 | ||
| Gene Expression Atlas: ENSG00000070614 | ||
| The Human Protein Atlas: ENSG00000070614 | ||
| Pathway | NCI Pathway Interaction Database: NDST1 | |
| KEGG: NDST1 | ||
| REACTOME: NDST1 | ||
| ConsensusPathDB | ||
| Pathway Commons: NDST1 | ||
| Metabolism | MetaCyc: NDST1 | |
| HUMANCyc: NDST1 | ||
| Regulation | Ensembl's Regulation: ENSG00000070614 | |
| miRBase: chr5 :149,887,673-149,937,773 | ||
| TargetScan: NM_001301063 | ||
| cisRED: ENSG00000070614 | ||
| Context | iHOP: NDST1 | |
| cancer metabolism search in PubMed: NDST1 | ||
| UCL Cancer Institute: NDST1 | ||
| Assigned class in ccmGDB | C | |
| Top |
| Phenotypic Information for NDST1(metabolism pathway, cancer, disease, phenome) |
| Cancer | CGAP: NDST1 |
| Familial Cancer Database: NDST1 | |
| * This gene is included in those cancer gene databases. |
|
|
|
|
|
|
| |||||||||||||||||||||||||||||||||||||||||||||||||||||||||||||||||||||||||||||||||||||||||||||||||||||||||||||||||||||||||||||||||||||||||||||||||||||||||||||||||||||||||||||||||||||||||||||||||||||||||||||||||||||||||||||||||||||||||||||||||||||||||||||||||||||||||||||||||||||||||||||||||||||||||||||||||||||||||||||||||||||||
Oncogene 1 | Significant driver gene in | ||||||||||||||||||||||||||||||||||||||||||||||||||||||||||||||||||||||||||||||||||||||||||||||||||||||||||||||||||||||||||||||||||||||||||||||||||||||||||||||||||||||||||||||||||||||||||||||||||||||||||||||||||||||||||||||||||||||||||||||||||||||||||||||||||||||||||||||||||||||||||||||||||||||||||||||||||||||||||||||||||||||||||||
| cf) number; DB name 1 Oncogene; http://nar.oxfordjournals.org/content/35/suppl_1/D721.long, 2 Tumor Suppressor gene; https://bioinfo.uth.edu/TSGene/, 3 Cancer Gene Census; http://www.nature.com/nrc/journal/v4/n3/abs/nrc1299.html, 4 CancerGenes; http://nar.oxfordjournals.org/content/35/suppl_1/D721.long, 5 Network of Cancer Gene; http://ncg.kcl.ac.uk/index.php, 1Therapeutic Vulnerabilities in Cancer; http://cbio.mskcc.org/cancergenomics/statius/ |
| REACTOME_METABOLISM_OF_CARBOHYDRATES | |
| OMIM | |
| Orphanet | |
| Disease | KEGG Disease: NDST1 |
| MedGen: NDST1 (Human Medical Genetics with Condition) | |
| ClinVar: NDST1 | |
| Phenotype | MGI: NDST1 (International Mouse Phenotyping Consortium) |
| PhenomicDB: NDST1 | |
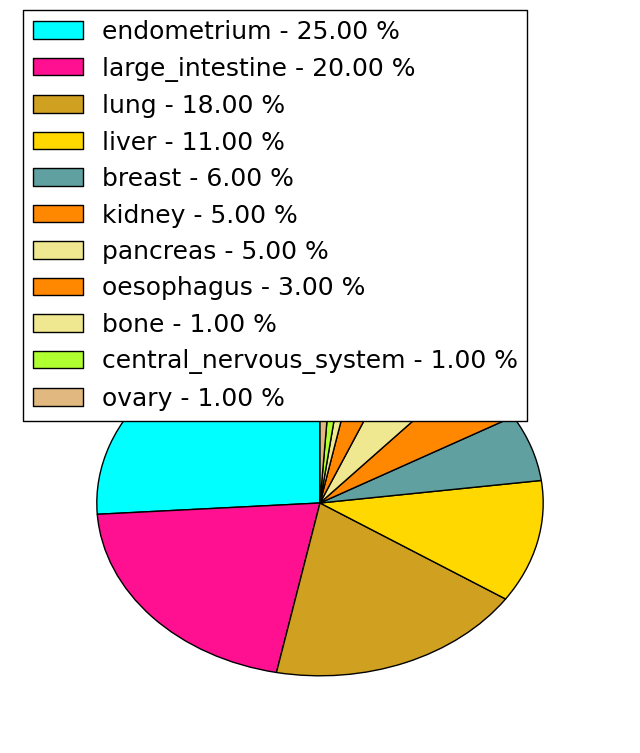
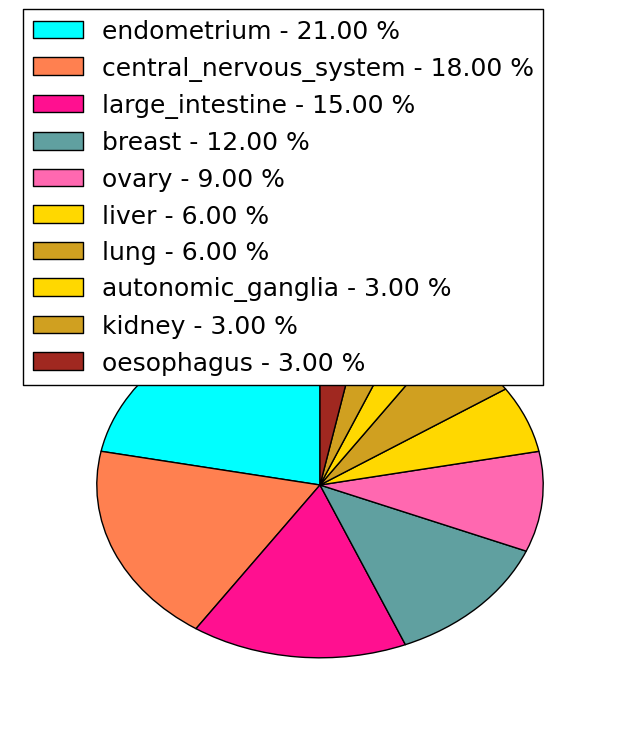
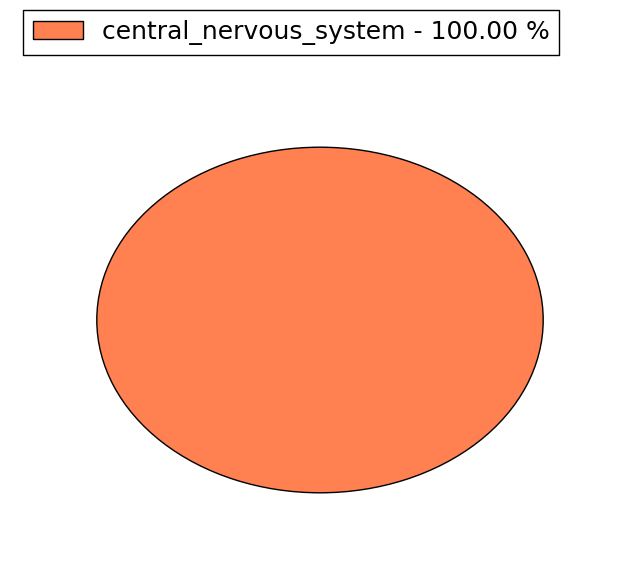
| Mutations for NDST1 |
| * Under tables are showing count per each tissue to give us broad intuition about tissue specific mutation patterns.You can go to the detailed page for each mutation database's web site. |
| There's no structural variation information in COSMIC data for this gene. |
| * From mRNA Sanger sequences, Chitars2.0 arranged chimeric transcripts. This table shows NDST1 related fusion information. |
| ID | Head Gene | Tail Gene | Accession | Gene_a | qStart_a | qEnd_a | Chromosome_a | tStart_a | tEnd_a | Gene_a | qStart_a | qEnd_a | Chromosome_a | tStart_a | tEnd_a |
| BU631743 | FAM168B | 24 | 533 | 2 | 131809603 | 131810549 | NDST1 | 531 | 708 | 5 | 149937242 | 149937419 | |
| Top |
| Mutation type/ Tissue ID | brca | cns | cerv | endome | haematopo | kidn | Lintest | liver | lung | ns | ovary | pancre | prost | skin | stoma | thyro | urina | |||
| Total # sample | 1 | |||||||||||||||||||
| GAIN (# sample) | 1 | |||||||||||||||||||
| LOSS (# sample) |
| cf) Tissue ID; Tissue type (1; Breast, 2; Central_nervous_system, 3; Cervix, 4; Endometrium, 5; Haematopoietic_and_lymphoid_tissue, 6; Kidney, 7; Large_intestine, 8; Liver, 9; Lung, 10; NS, 11; Ovary, 12; Pancreas, 13; Prostate, 14; Skin, 15; Stomach, 16; Thyroid, 17; Urinary_tract) |
| Top |
|
 |
| Top |
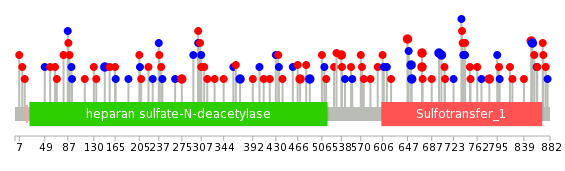
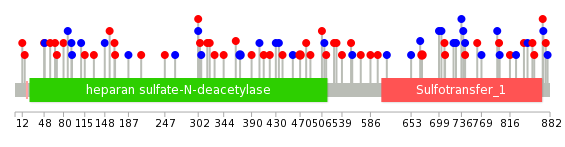
| Stat. for Non-Synonymous SNVs (# total SNVs=60) | (# total SNVs=32) |
 |  |
(# total SNVs=1) | (# total SNVs=0) |
 |
| Top |
| * When you move the cursor on each content, you can see more deailed mutation information on the Tooltip. Those are primary_site,primary_histology,mutation(aa),pubmedID. |
| GRCh37 position | Mutation(aa) | Unique sampleID count |
| chr5:149901260-149901260 | p.D148D | 2 |
| chr5:149929267-149929267 | p.R782C | 2 |
| chr5:149922522-149922522 | p.K653K | 2 |
| chr5:149922525-149922525 | p.G654G | 2 |
| chr5:149924914-149924914 | p.D671N | 2 |
| chr5:149924915-149924915 | p.D671G | 2 |
| chr5:149907676-149907676 | p.G275D | 2 |
| chr5:149925000-149925000 | p.V699V | 2 |
| chr5:149914445-149914445 | p.D371D | 2 |
| chr5:149915419-149915419 | p.R470H | 2 |
| Top |
|
 |
| Point Mutation/ Tissue ID | 1 | 2 | 3 | 4 | 5 | 6 | 7 | 8 | 9 | 10 | 11 | 12 | 13 | 14 | 15 | 16 | 17 | 18 | 19 | 20 |
| # sample | 1 | 3 | 10 | 2 | 2 | 2 | 8 | 4 | 3 | 10 | 13 | 16 | ||||||||
| # mutation | 1 | 3 | 10 | 2 | 2 | 2 | 9 | 4 | 3 | 10 | 16 | 19 | ||||||||
| nonsynonymous SNV | 7 | 1 | 2 | 6 | 4 | 1 | 4 | 11 | 12 | |||||||||||
| synonymous SNV | 1 | 3 | 3 | 2 | 1 | 3 | 2 | 6 | 5 | 7 |
| cf) Tissue ID; Tissue type (1; BLCA[Bladder Urothelial Carcinoma], 2; BRCA[Breast invasive carcinoma], 3; CESC[Cervical squamous cell carcinoma and endocervical adenocarcinoma], 4; COAD[Colon adenocarcinoma], 5; GBM[Glioblastoma multiforme], 6; Glioma Low Grade, 7; HNSC[Head and Neck squamous cell carcinoma], 8; KICH[Kidney Chromophobe], 9; KIRC[Kidney renal clear cell carcinoma], 10; KIRP[Kidney renal papillary cell carcinoma], 11; LAML[Acute Myeloid Leukemia], 12; LUAD[Lung adenocarcinoma], 13; LUSC[Lung squamous cell carcinoma], 14; OV[Ovarian serous cystadenocarcinoma ], 15; PAAD[Pancreatic adenocarcinoma], 16; PRAD[Prostate adenocarcinoma], 17; SKCM[Skin Cutaneous Melanoma], 18:STAD[Stomach adenocarcinoma], 19:THCA[Thyroid carcinoma], 20:UCEC[Uterine Corpus Endometrial Carcinoma]) |
| Top |
| * We represented just top 10 SNVs. When you move the cursor on each content, you can see more deailed mutation information on the Tooltip. Those are primary_site, primary_histology, mutation(aa), pubmedID. |
| Genomic Position | Mutation(aa) | Unique sampleID count |
| chr5:149915419 | p.D371D | 2 |
| chr5:149914445 | p.R470H | 2 |
| chr5:149924914 | p.D671N | 2 |
| chr5:149901309 | p.T826T | 1 |
| chr5:149919738 | p.S94S | 1 |
| chr5:149932869 | p.D317Y | 1 |
| chr5:149907838 | p.G487S | 1 |
| chr5:149925026 | p.V699V | 1 |
| chr5:149901054 | p.E839K | 1 |
| chr5:149915384 | p.F109F | 1 |
| * Copy number data were extracted from TCGA using R package TCGA-Assembler. The URLs of all public data files on TCGA DCC data server were gathered on Jan-05-2015. Function ProcessCNAData in TCGA-Assembler package was used to obtain gene-level copy number value which is calculated as the average copy number of the genomic region of a gene. |
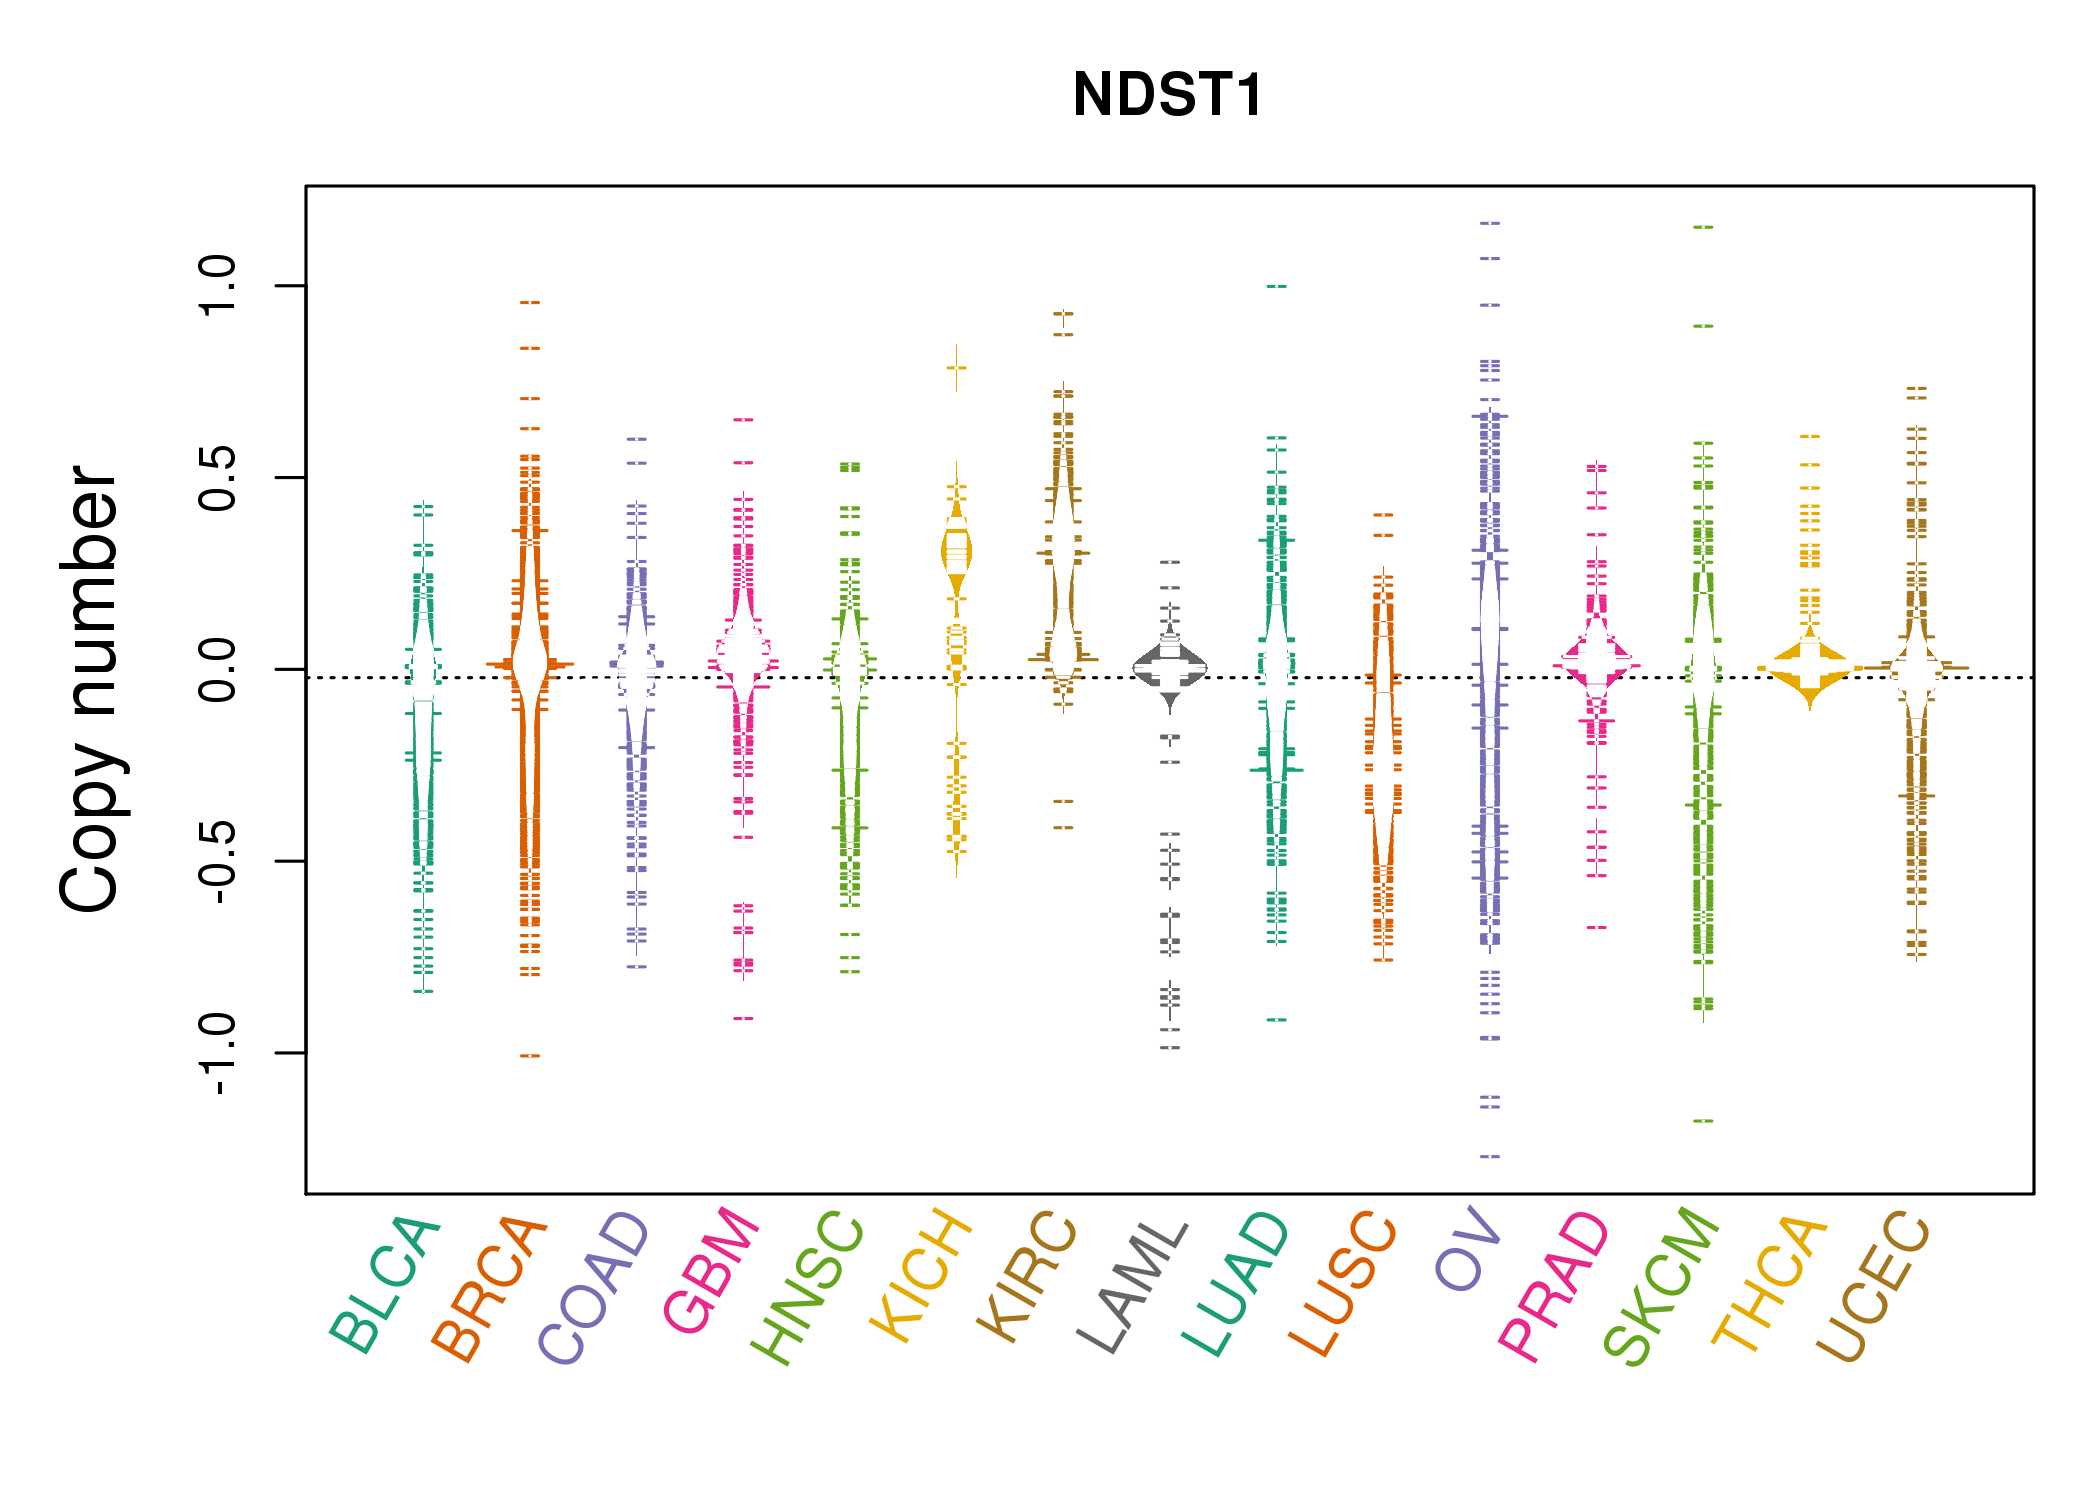 |
| cf) Tissue ID[Tissue type]: BLCA[Bladder Urothelial Carcinoma], BRCA[Breast invasive carcinoma], CESC[Cervical squamous cell carcinoma and endocervical adenocarcinoma], COAD[Colon adenocarcinoma], GBM[Glioblastoma multiforme], Glioma Low Grade, HNSC[Head and Neck squamous cell carcinoma], KICH[Kidney Chromophobe], KIRC[Kidney renal clear cell carcinoma], KIRP[Kidney renal papillary cell carcinoma], LAML[Acute Myeloid Leukemia], LUAD[Lung adenocarcinoma], LUSC[Lung squamous cell carcinoma], OV[Ovarian serous cystadenocarcinoma ], PAAD[Pancreatic adenocarcinoma], PRAD[Prostate adenocarcinoma], SKCM[Skin Cutaneous Melanoma], STAD[Stomach adenocarcinoma], THCA[Thyroid carcinoma], UCEC[Uterine Corpus Endometrial Carcinoma] |
| Top |
| Gene Expression for NDST1 |
| * CCLE gene expression data were extracted from CCLE_Expression_Entrez_2012-10-18.res: Gene-centric RMA-normalized mRNA expression data. |
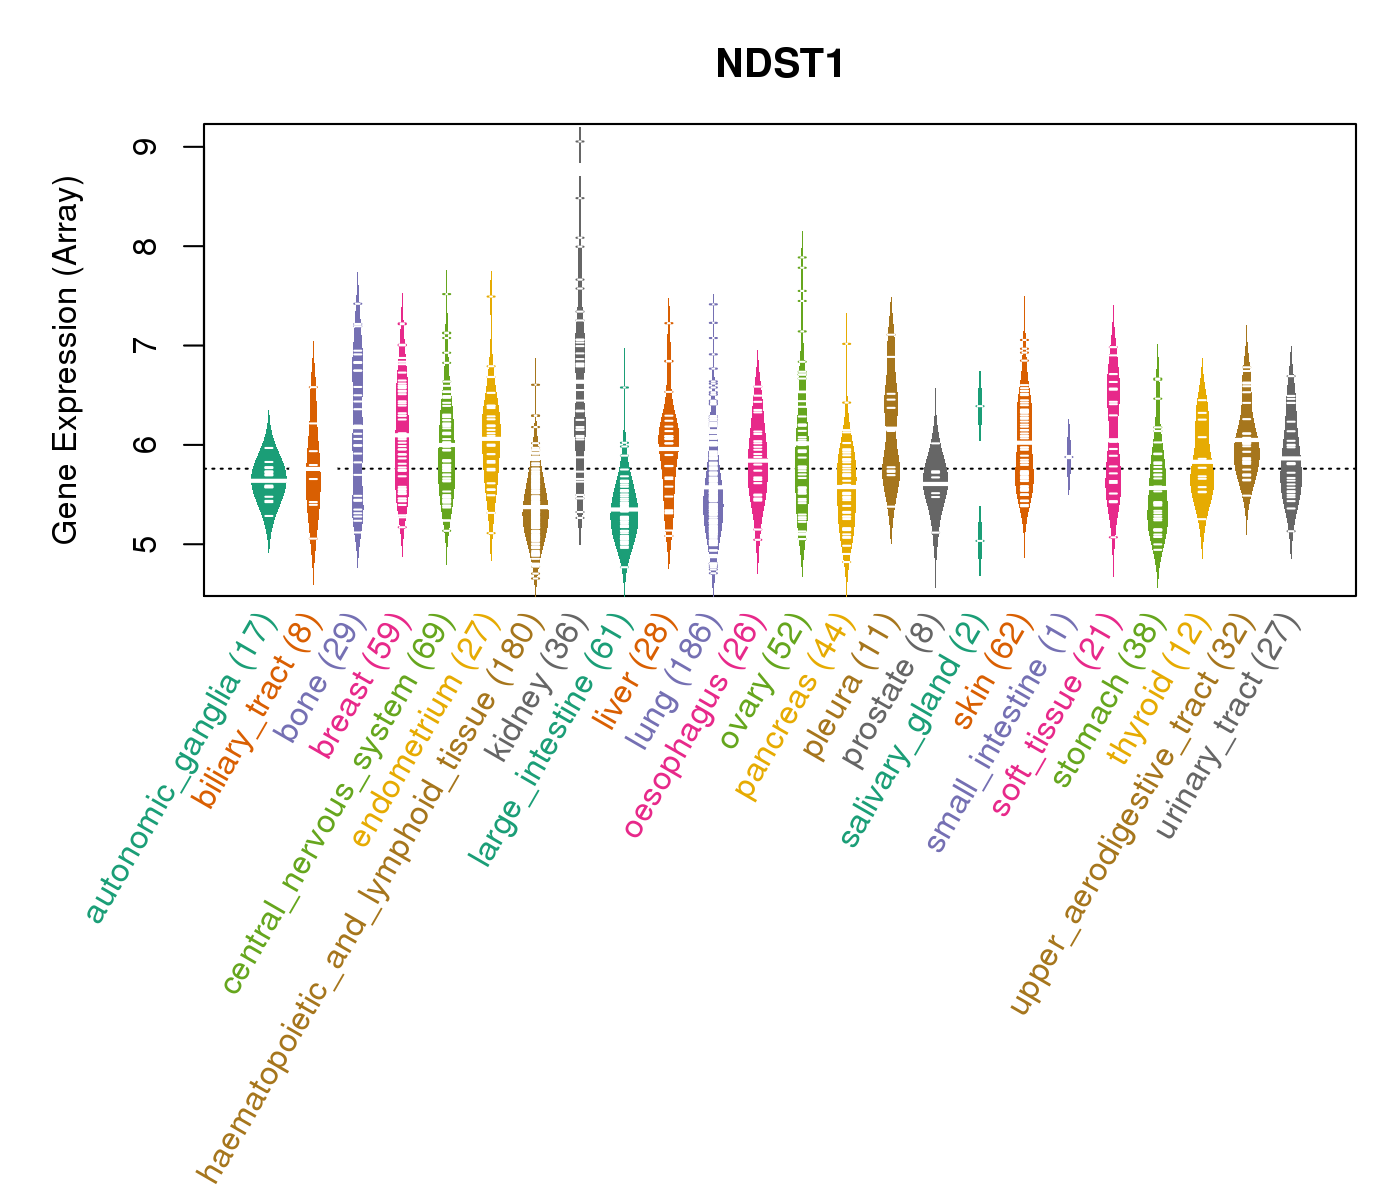 |
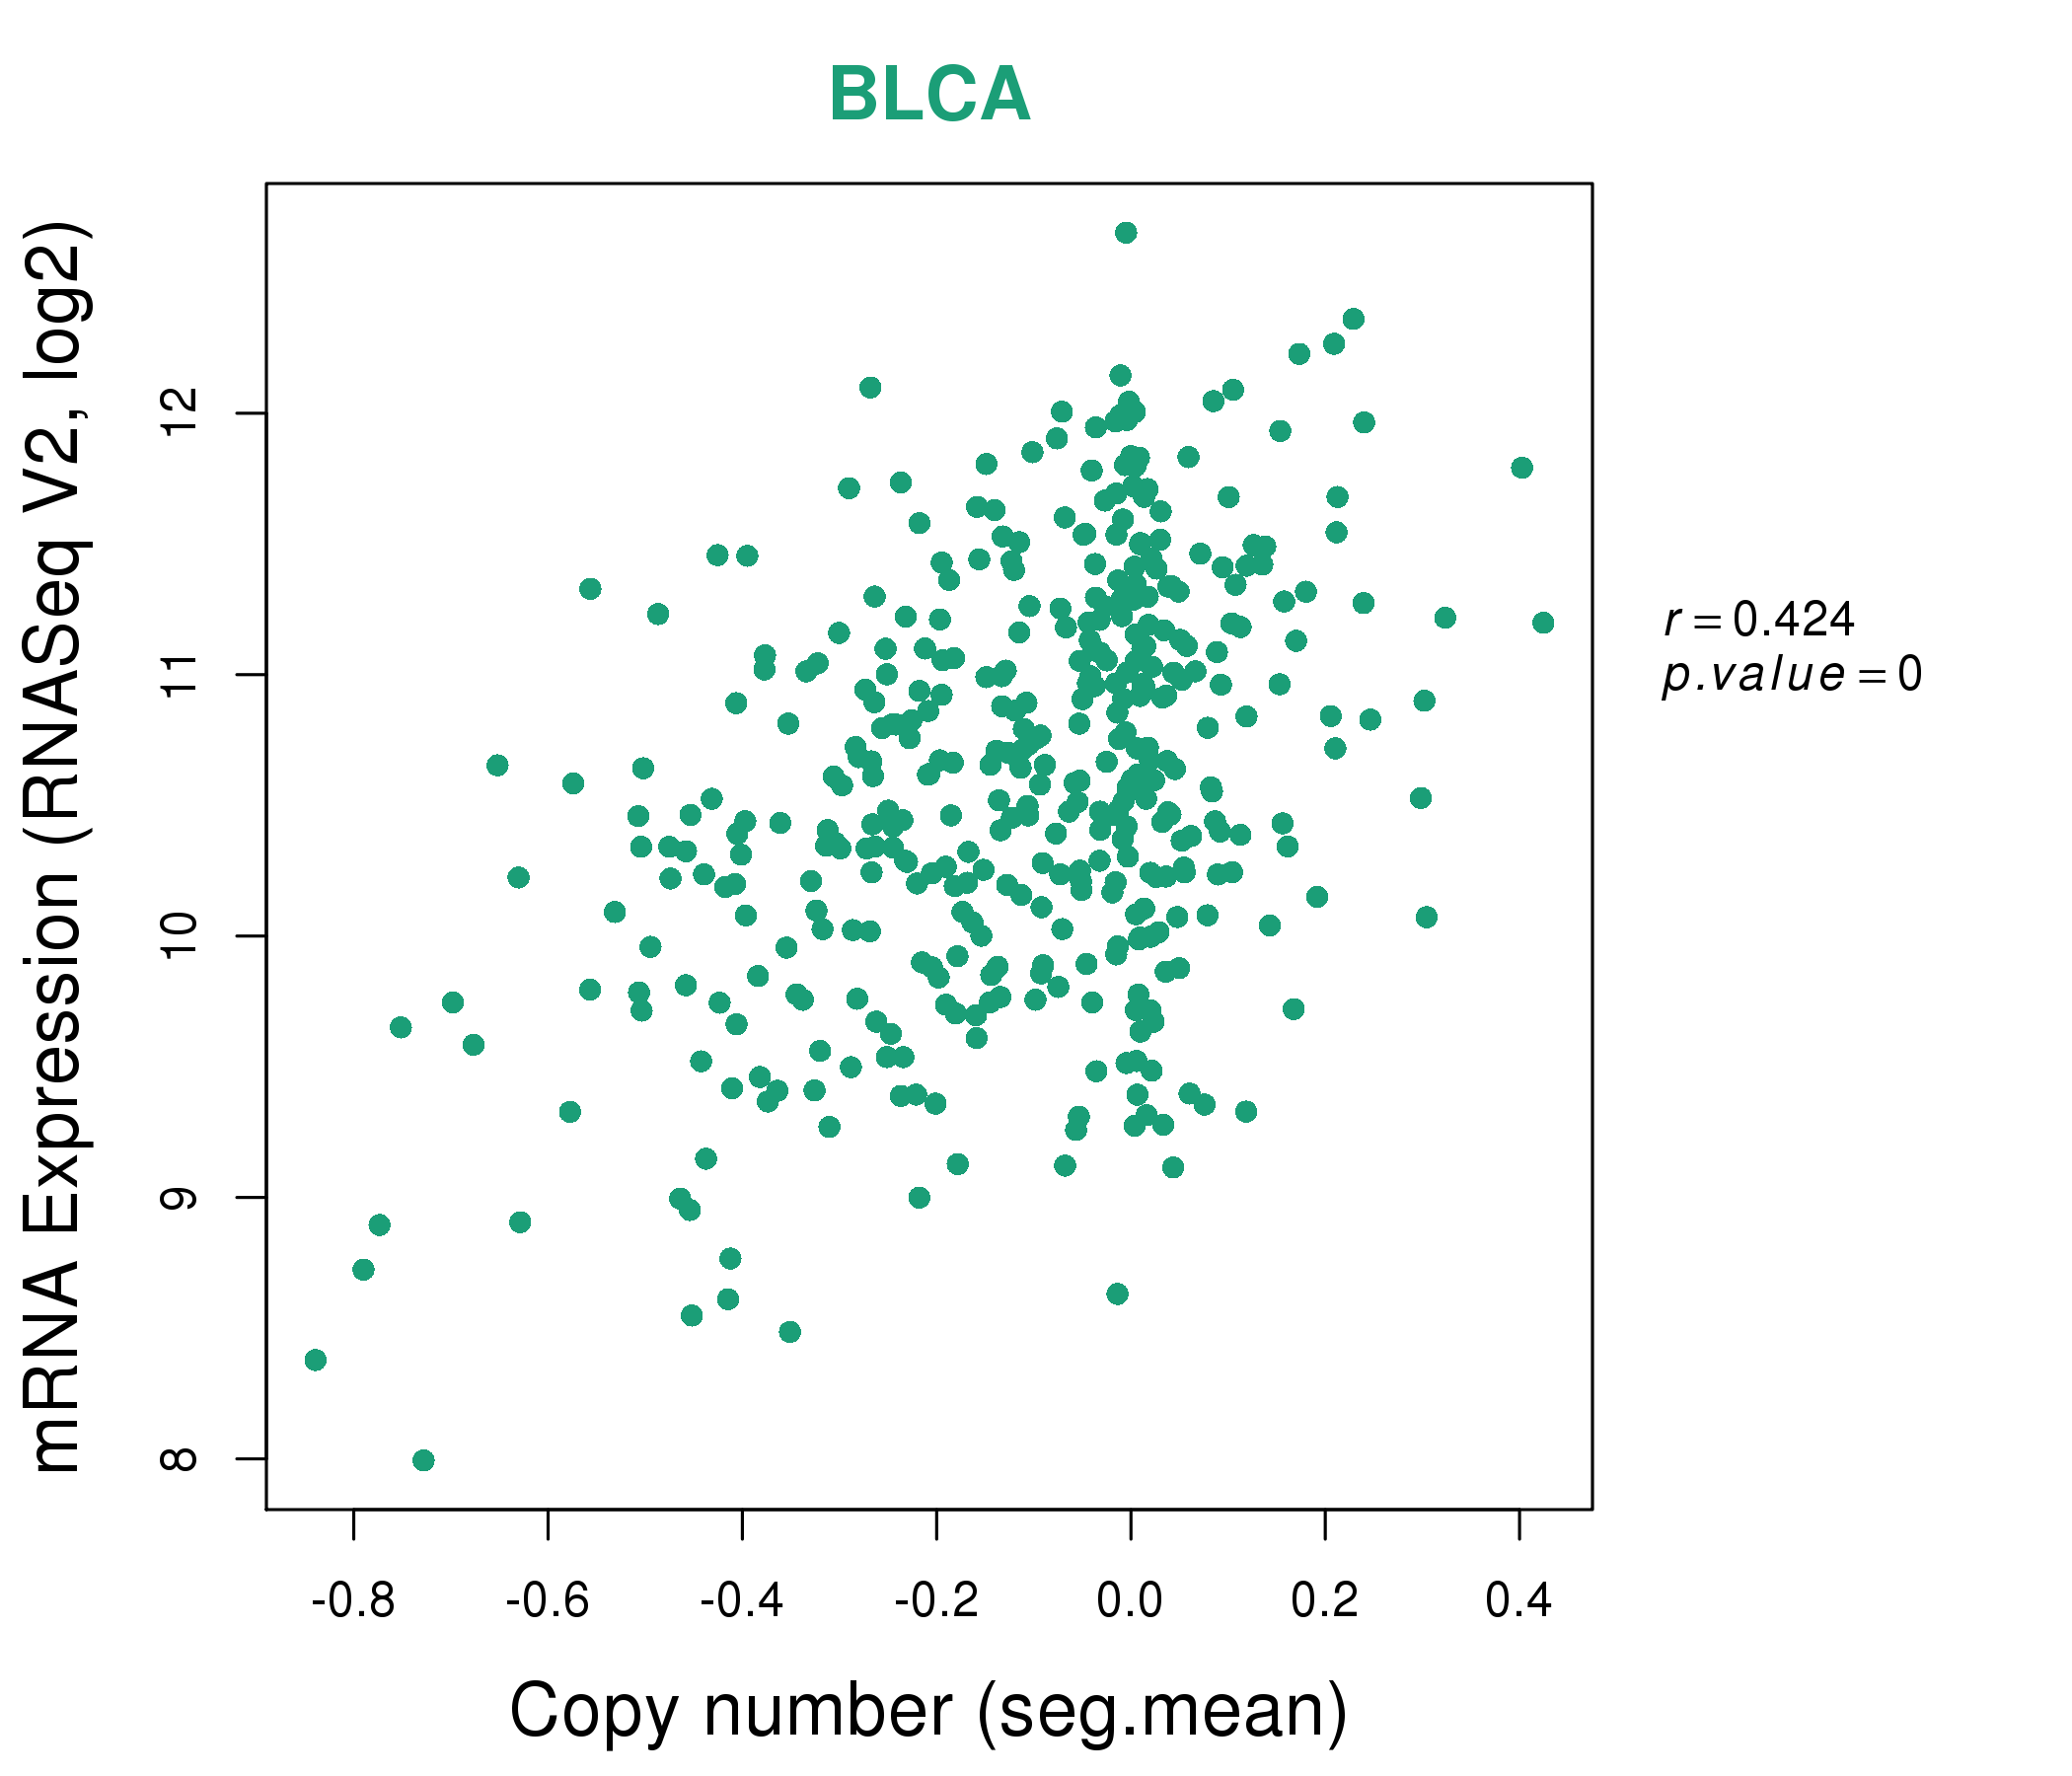
| * Normalized gene expression data of RNASeqV2 was extracted from TCGA using R package TCGA-Assembler. The URLs of all public data files on TCGA DCC data server were gathered at Jan-05-2015. Only eight cancer types have enough normal control samples for differential expression analysis. (t test, adjusted p<0.05 (using Benjamini-Hochberg FDR)) |
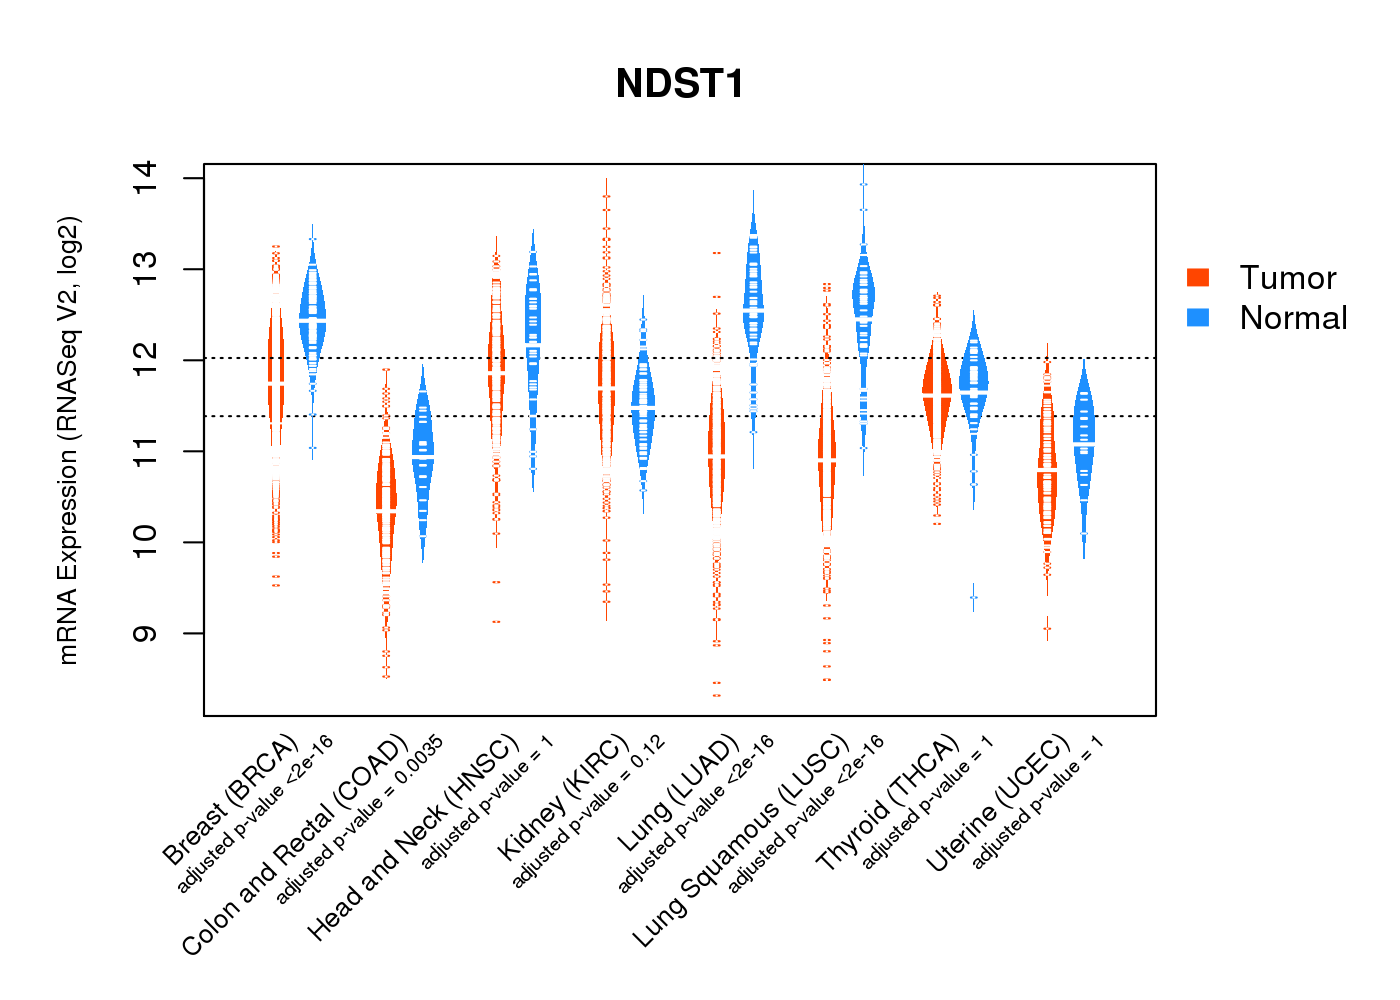 |
| Top |
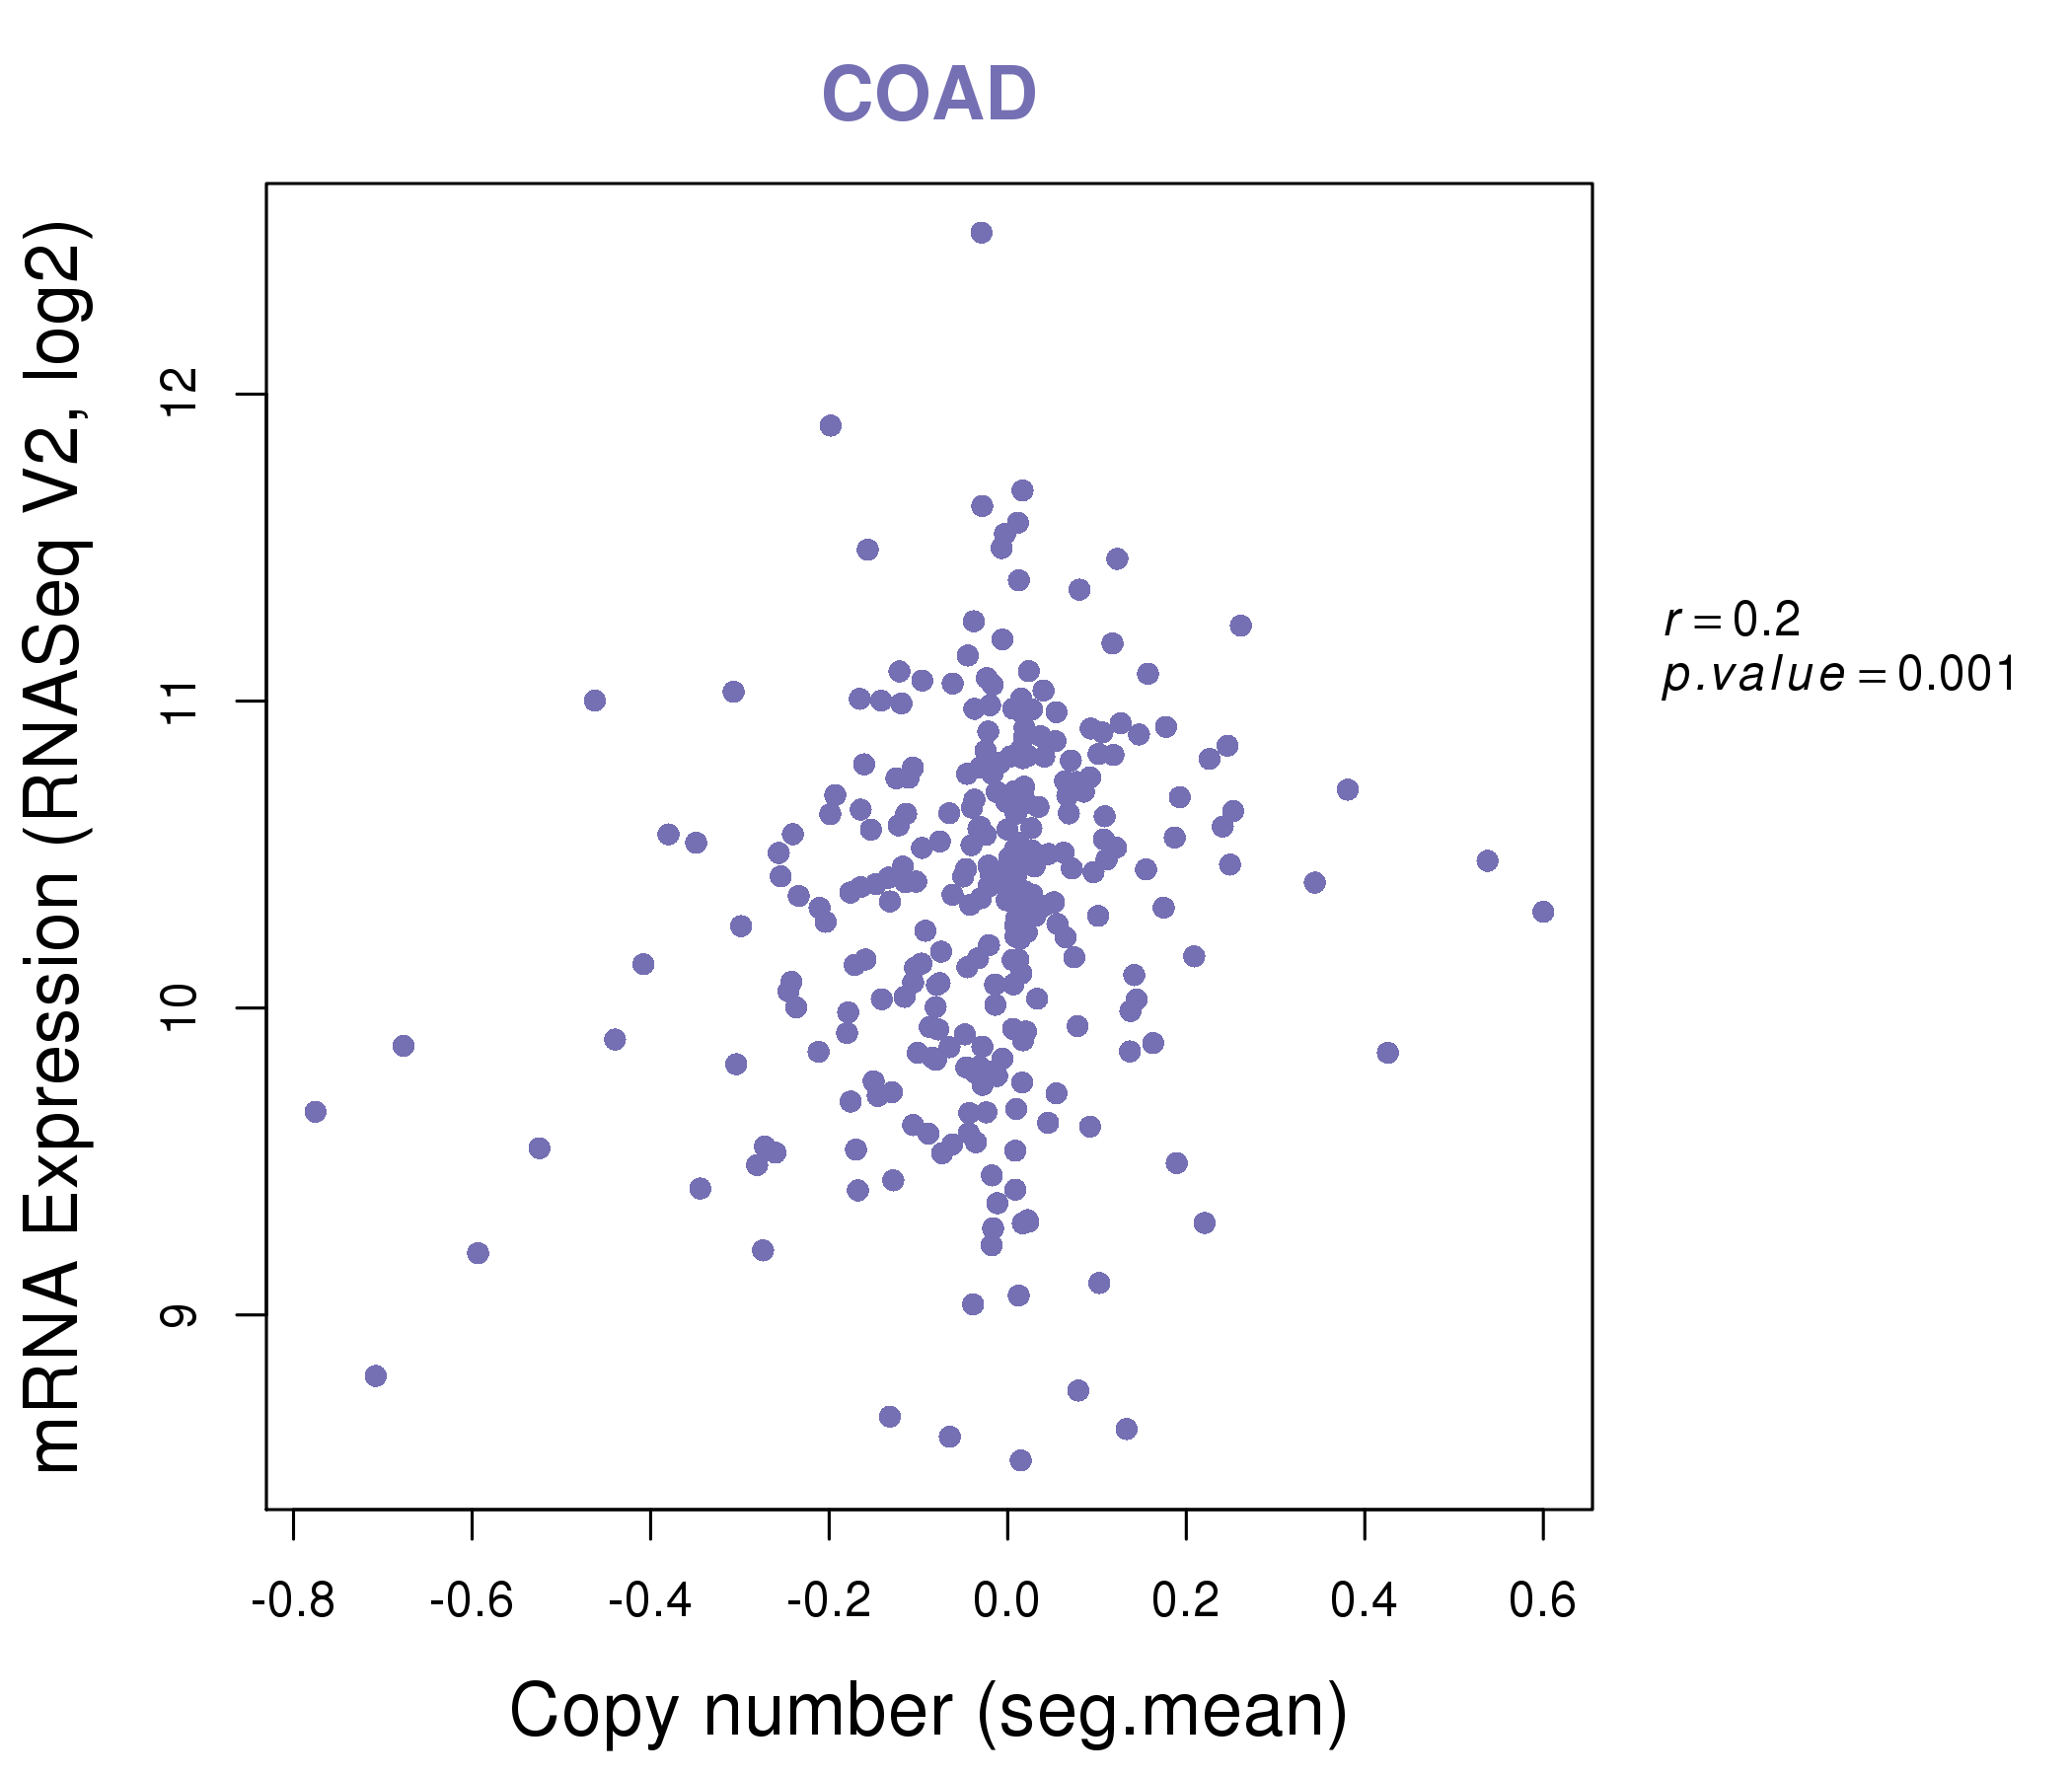
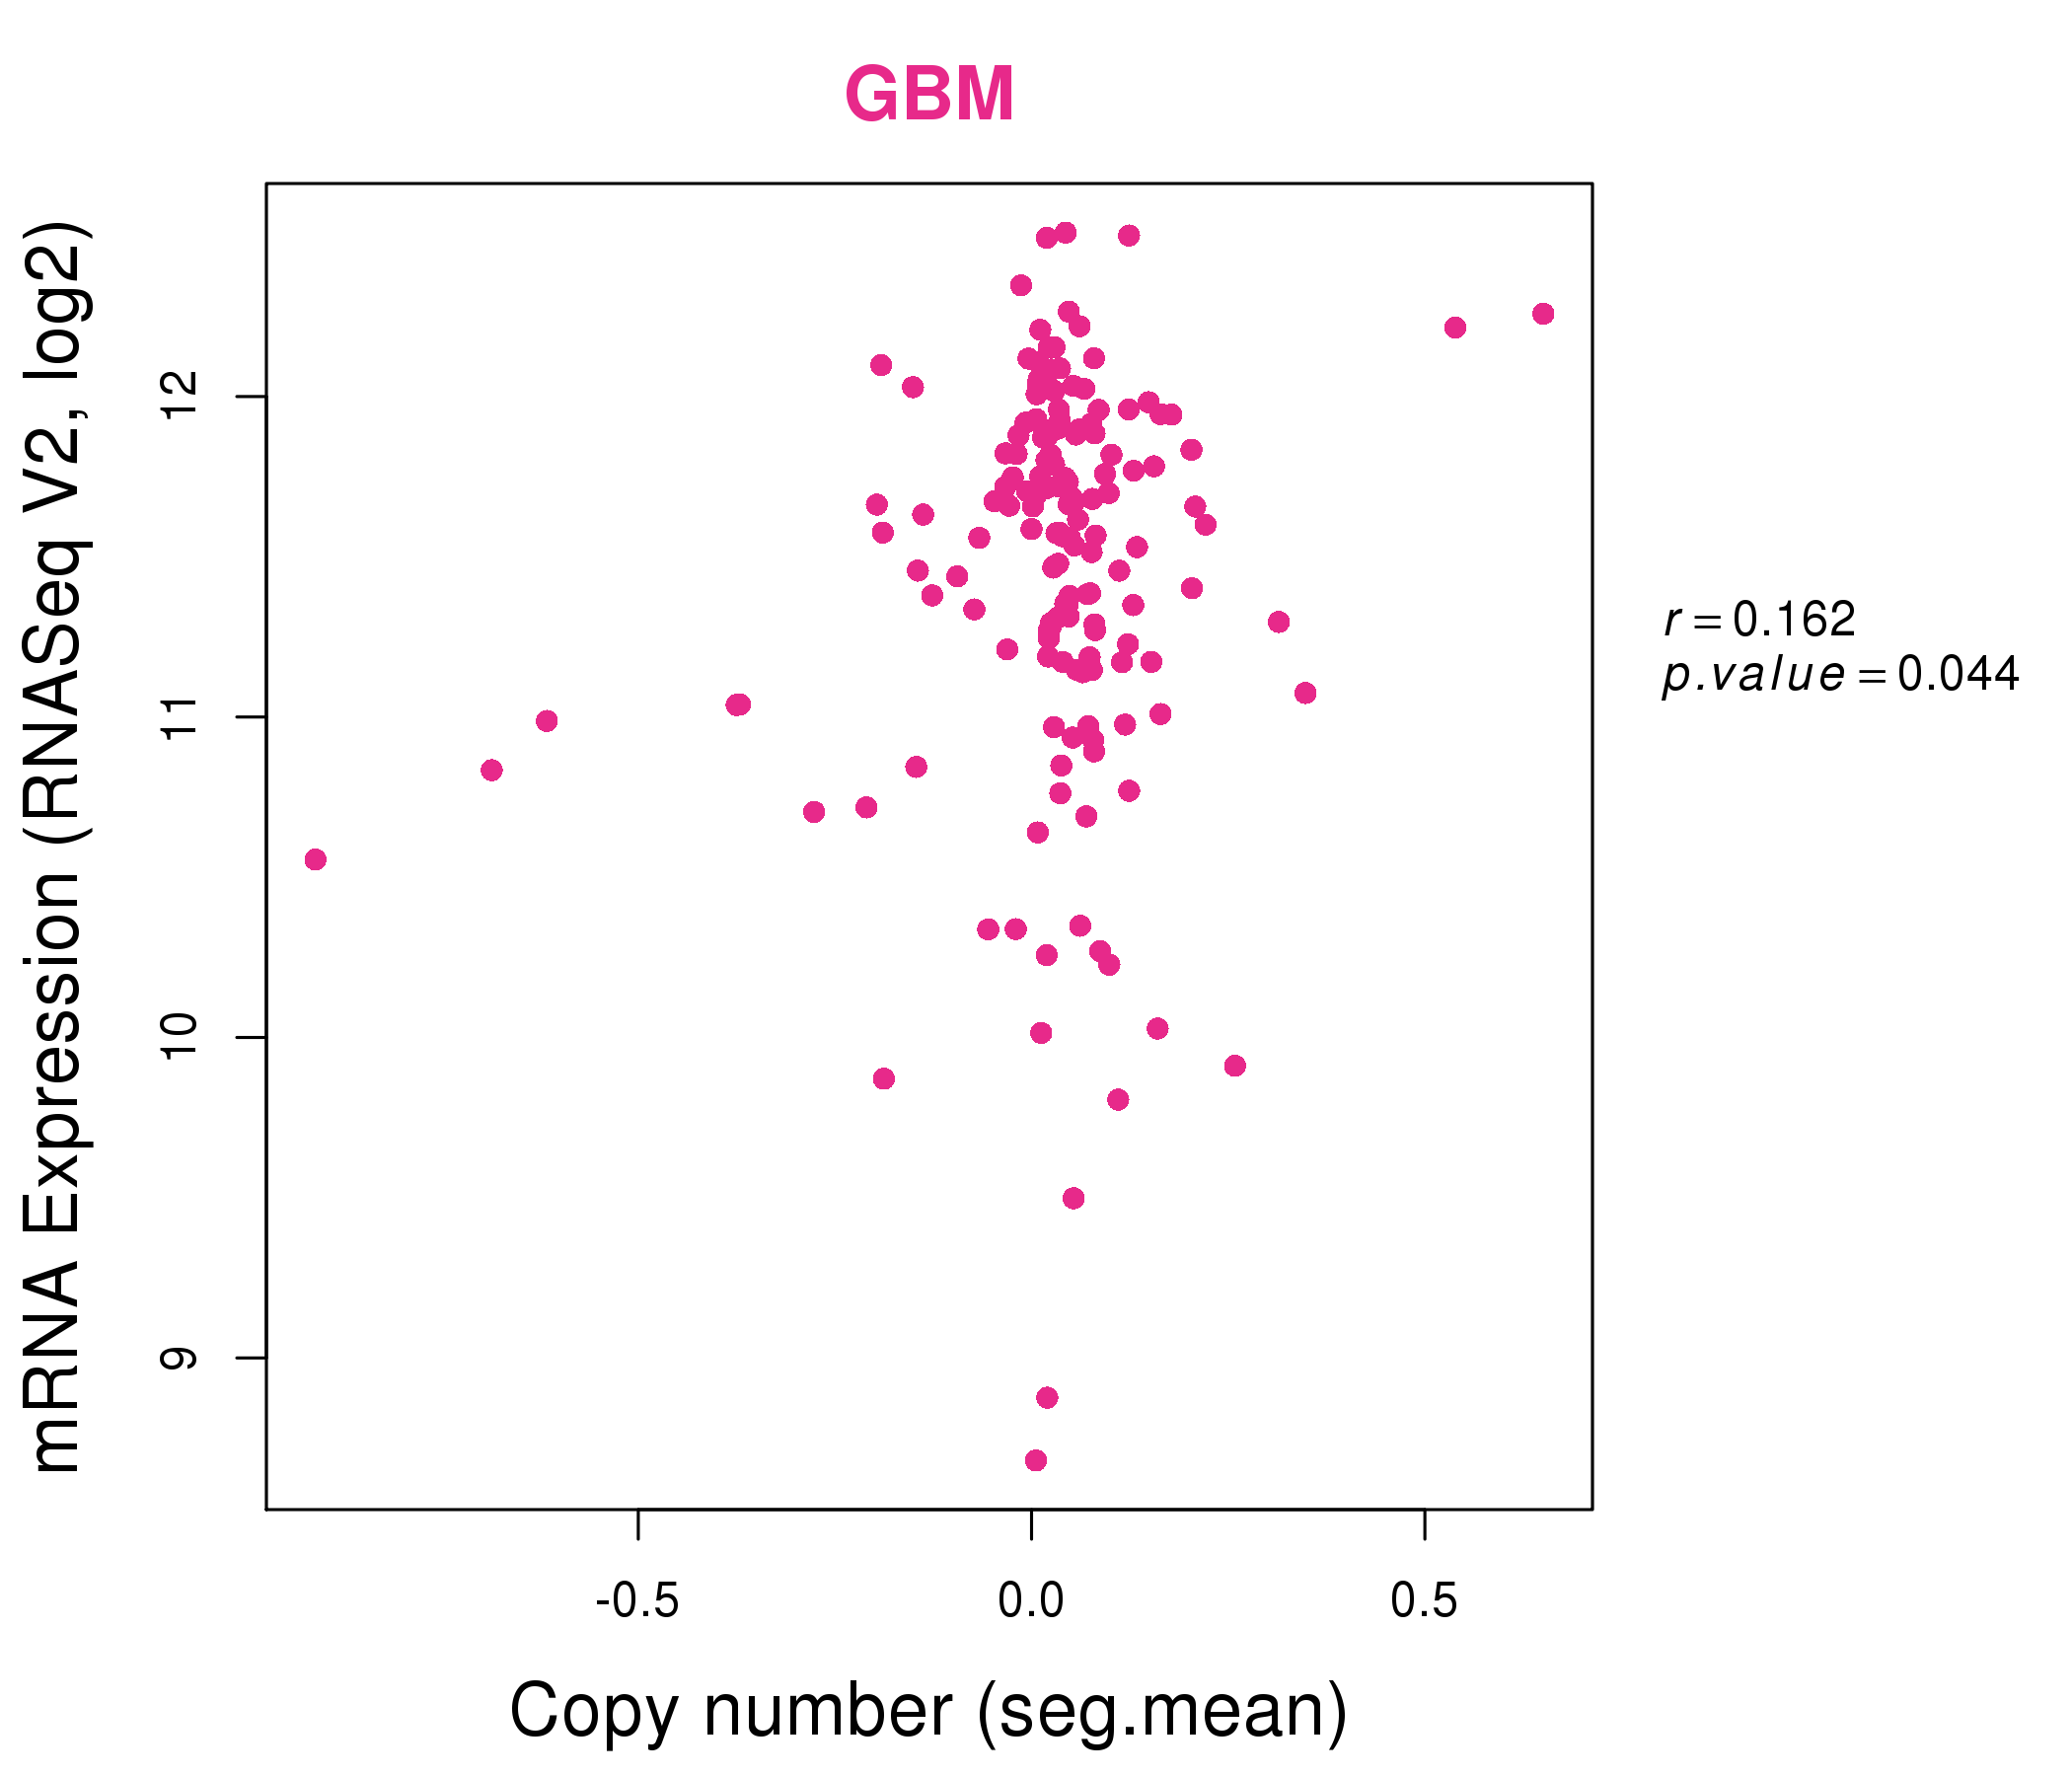
| * This plots show the correlation between CNV and gene expression. |
: Open all plots for all cancer types
 |
|
 |
|

| Top |
| Gene-Gene Network Information |
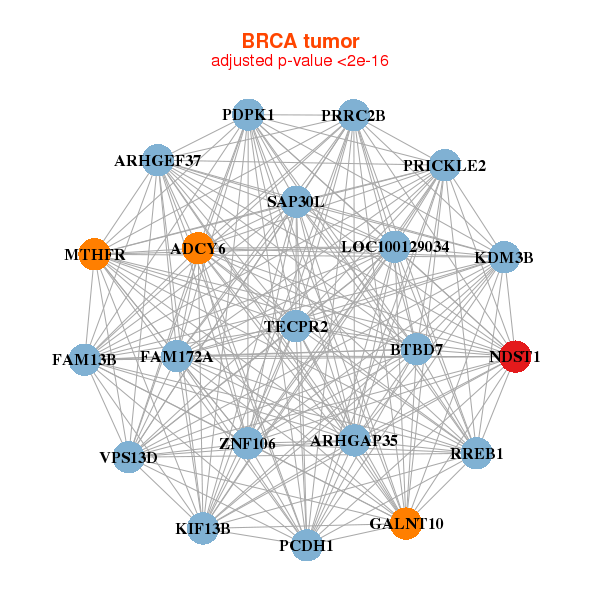
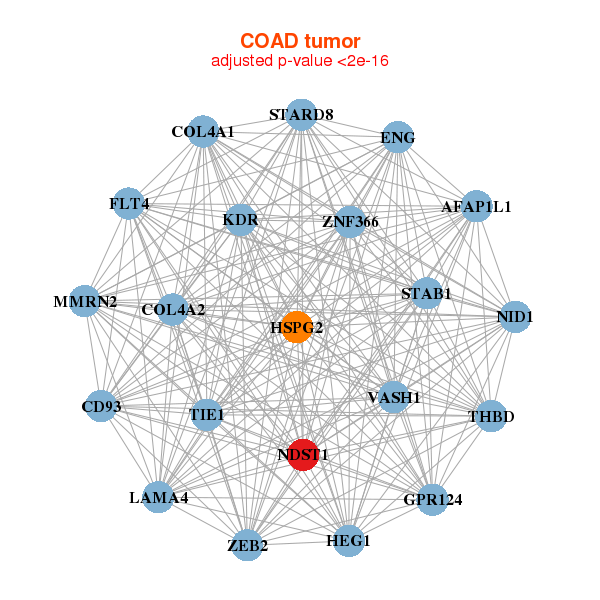
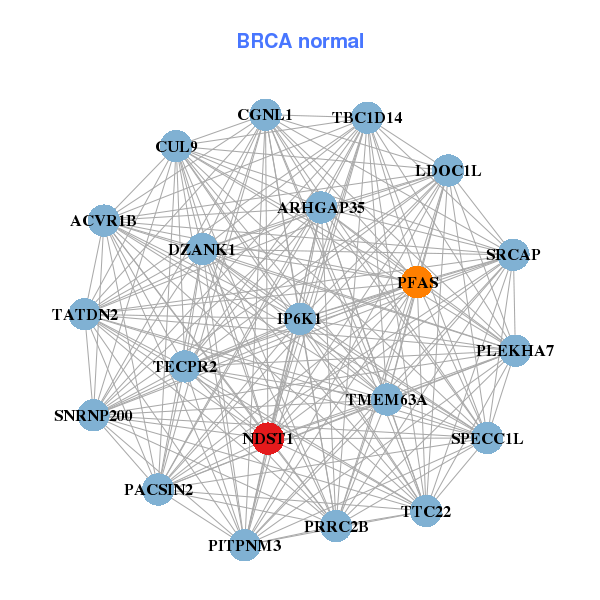
| * Co-Expression network figures were drawn using R package igraph. Only the top 20 genes with the highest correlations were shown. Red circle: input gene, orange circle: cell metabolism gene, sky circle: other gene |
: Open all plots for all cancer types
 |
| ||||
| ADCY6,ARHGEF37,PRRC2B,BTBD7,FAM13B,FAM172A,GALNT10, ARHGAP35,KDM3B,KIF13B,LOC100129034,MTHFR,NDST1,PCDH1, PDPK1,PRICKLE2,RREB1,SAP30L,TECPR2,VPS13D,ZNF106 | ACVR1B,PRRC2B,DZANK1,CGNL1,CUL9,SPECC1L,ARHGAP35, IP6K1,LDOC1L,NDST1,PACSIN2,PFAS,PITPNM3,PLEKHA7, SNRNP200,SRCAP,TATDN2,TBC1D14,TECPR2,TMEM63A,TTC22 | ||||
 |
| ||||
| AFAP1L1,CD93,COL4A1,COL4A2,ENG,FLT4,GPR124, HEG1,HSPG2,KDR,LAMA4,MMRN2,NDST1,NID1, STAB1,STARD8,THBD,TIE1,VASH1,ZEB2,ZNF366 | ELMSAN1,CCDC85C,DNAJC5,ARHGAP35,IGSF3,KSR1,LAMP1, MED15,NDST1,NFE2L1,NIPAL3,OTUD7B,PLXNB2,SORT1, STAU1,SYNPO,USP9X,VPS18,ZER1,ZFAND3,ZMIZ1 |
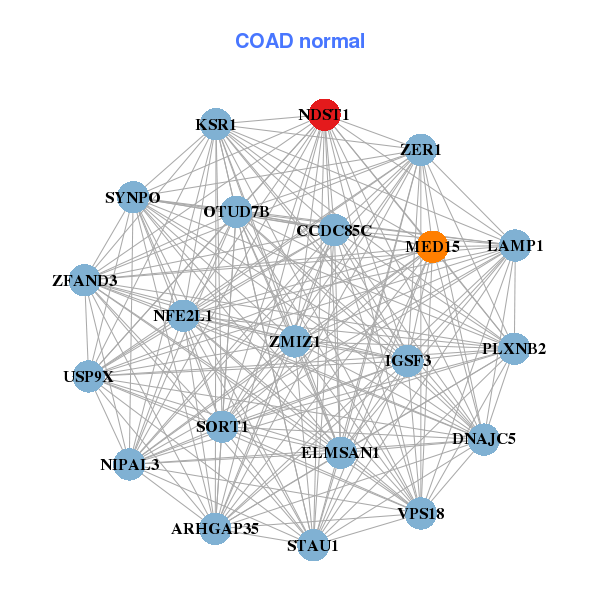
| * Co-Expression network figures were drawn using R package igraph. Only the top 20 genes with the highest correlations were shown. Red circle: input gene, orange circle: cell metabolism gene, sky circle: other gene |
: Open all plots for all cancer types
| Top |
: Open all interacting genes' information including KEGG pathway for all interacting genes from DAVID
| Top |
| Pharmacological Information for NDST1 |
| DB Category | DB Name | DB's ID and Url link |
| * Gene Centered Interaction Network. |
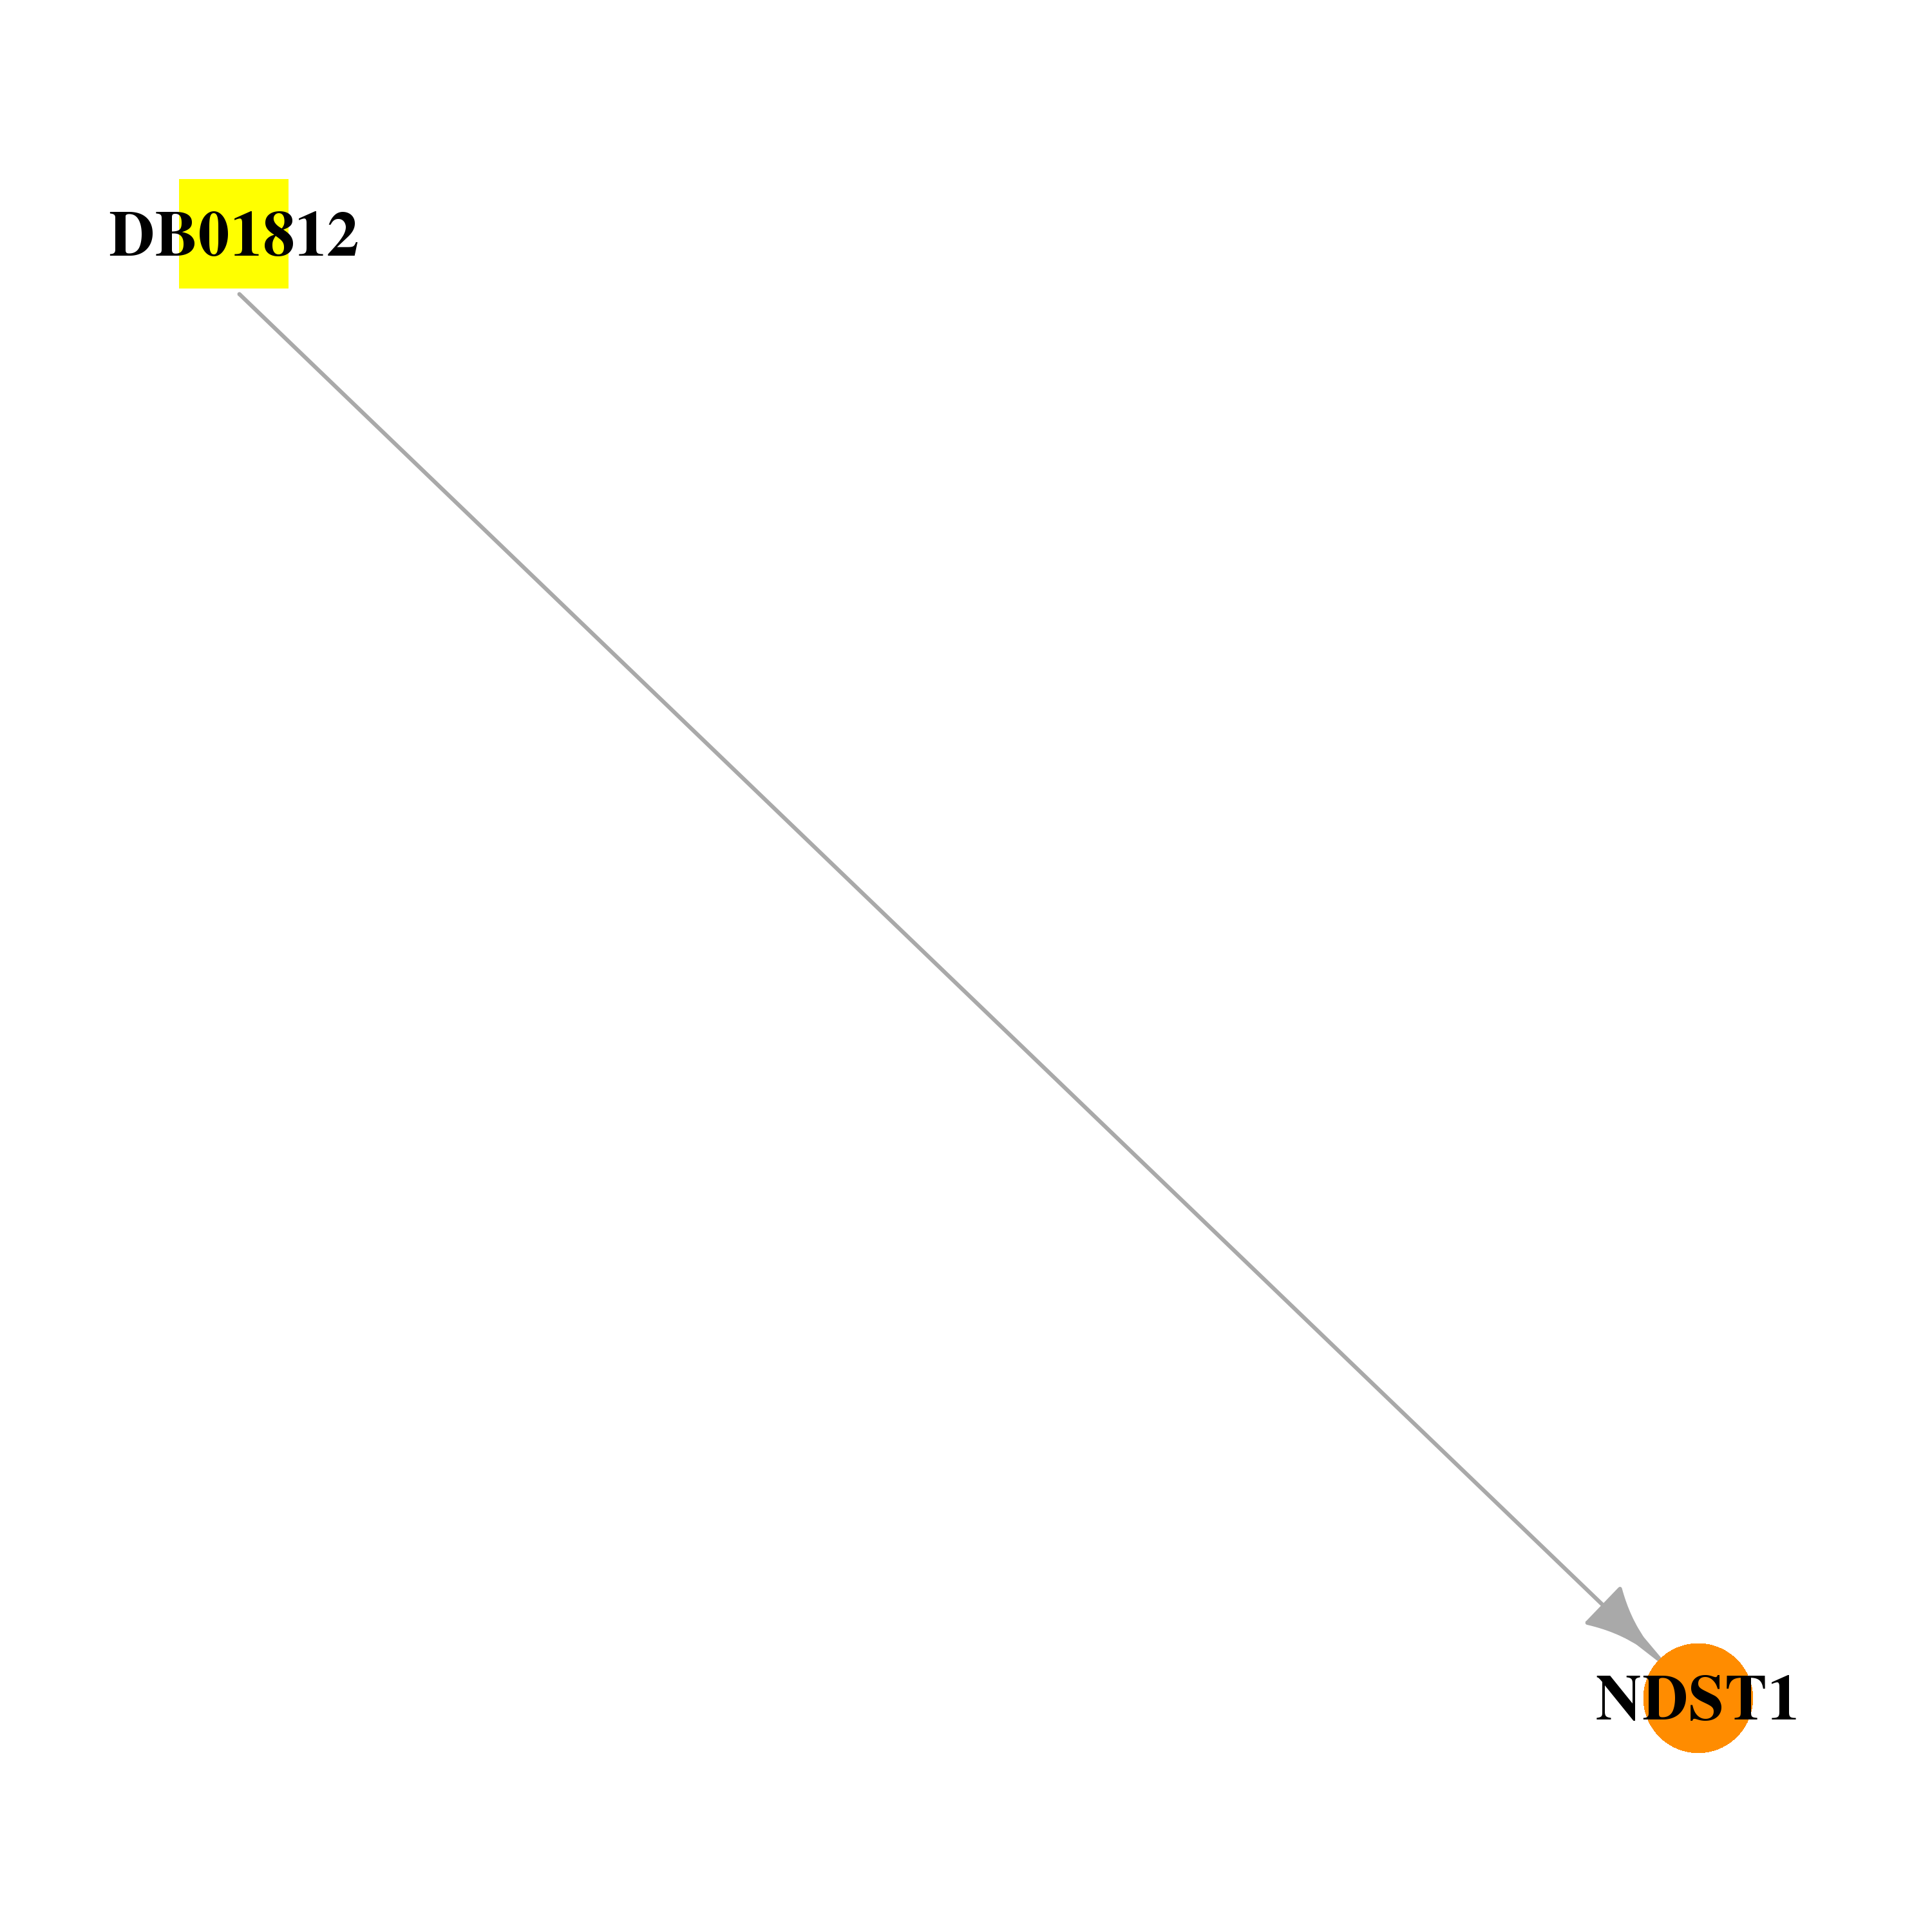 |
| * Drug Centered Interaction Network. |
| DrugBank ID | Target Name | Drug Groups | Generic Name | Drug Centered Network | Drug Structure |
| DB01812 | N-deacetylase/N-sulfotransferase (heparan glucosaminyl) 1 | experimental | Adenosine-3'-5'-Diphosphate | 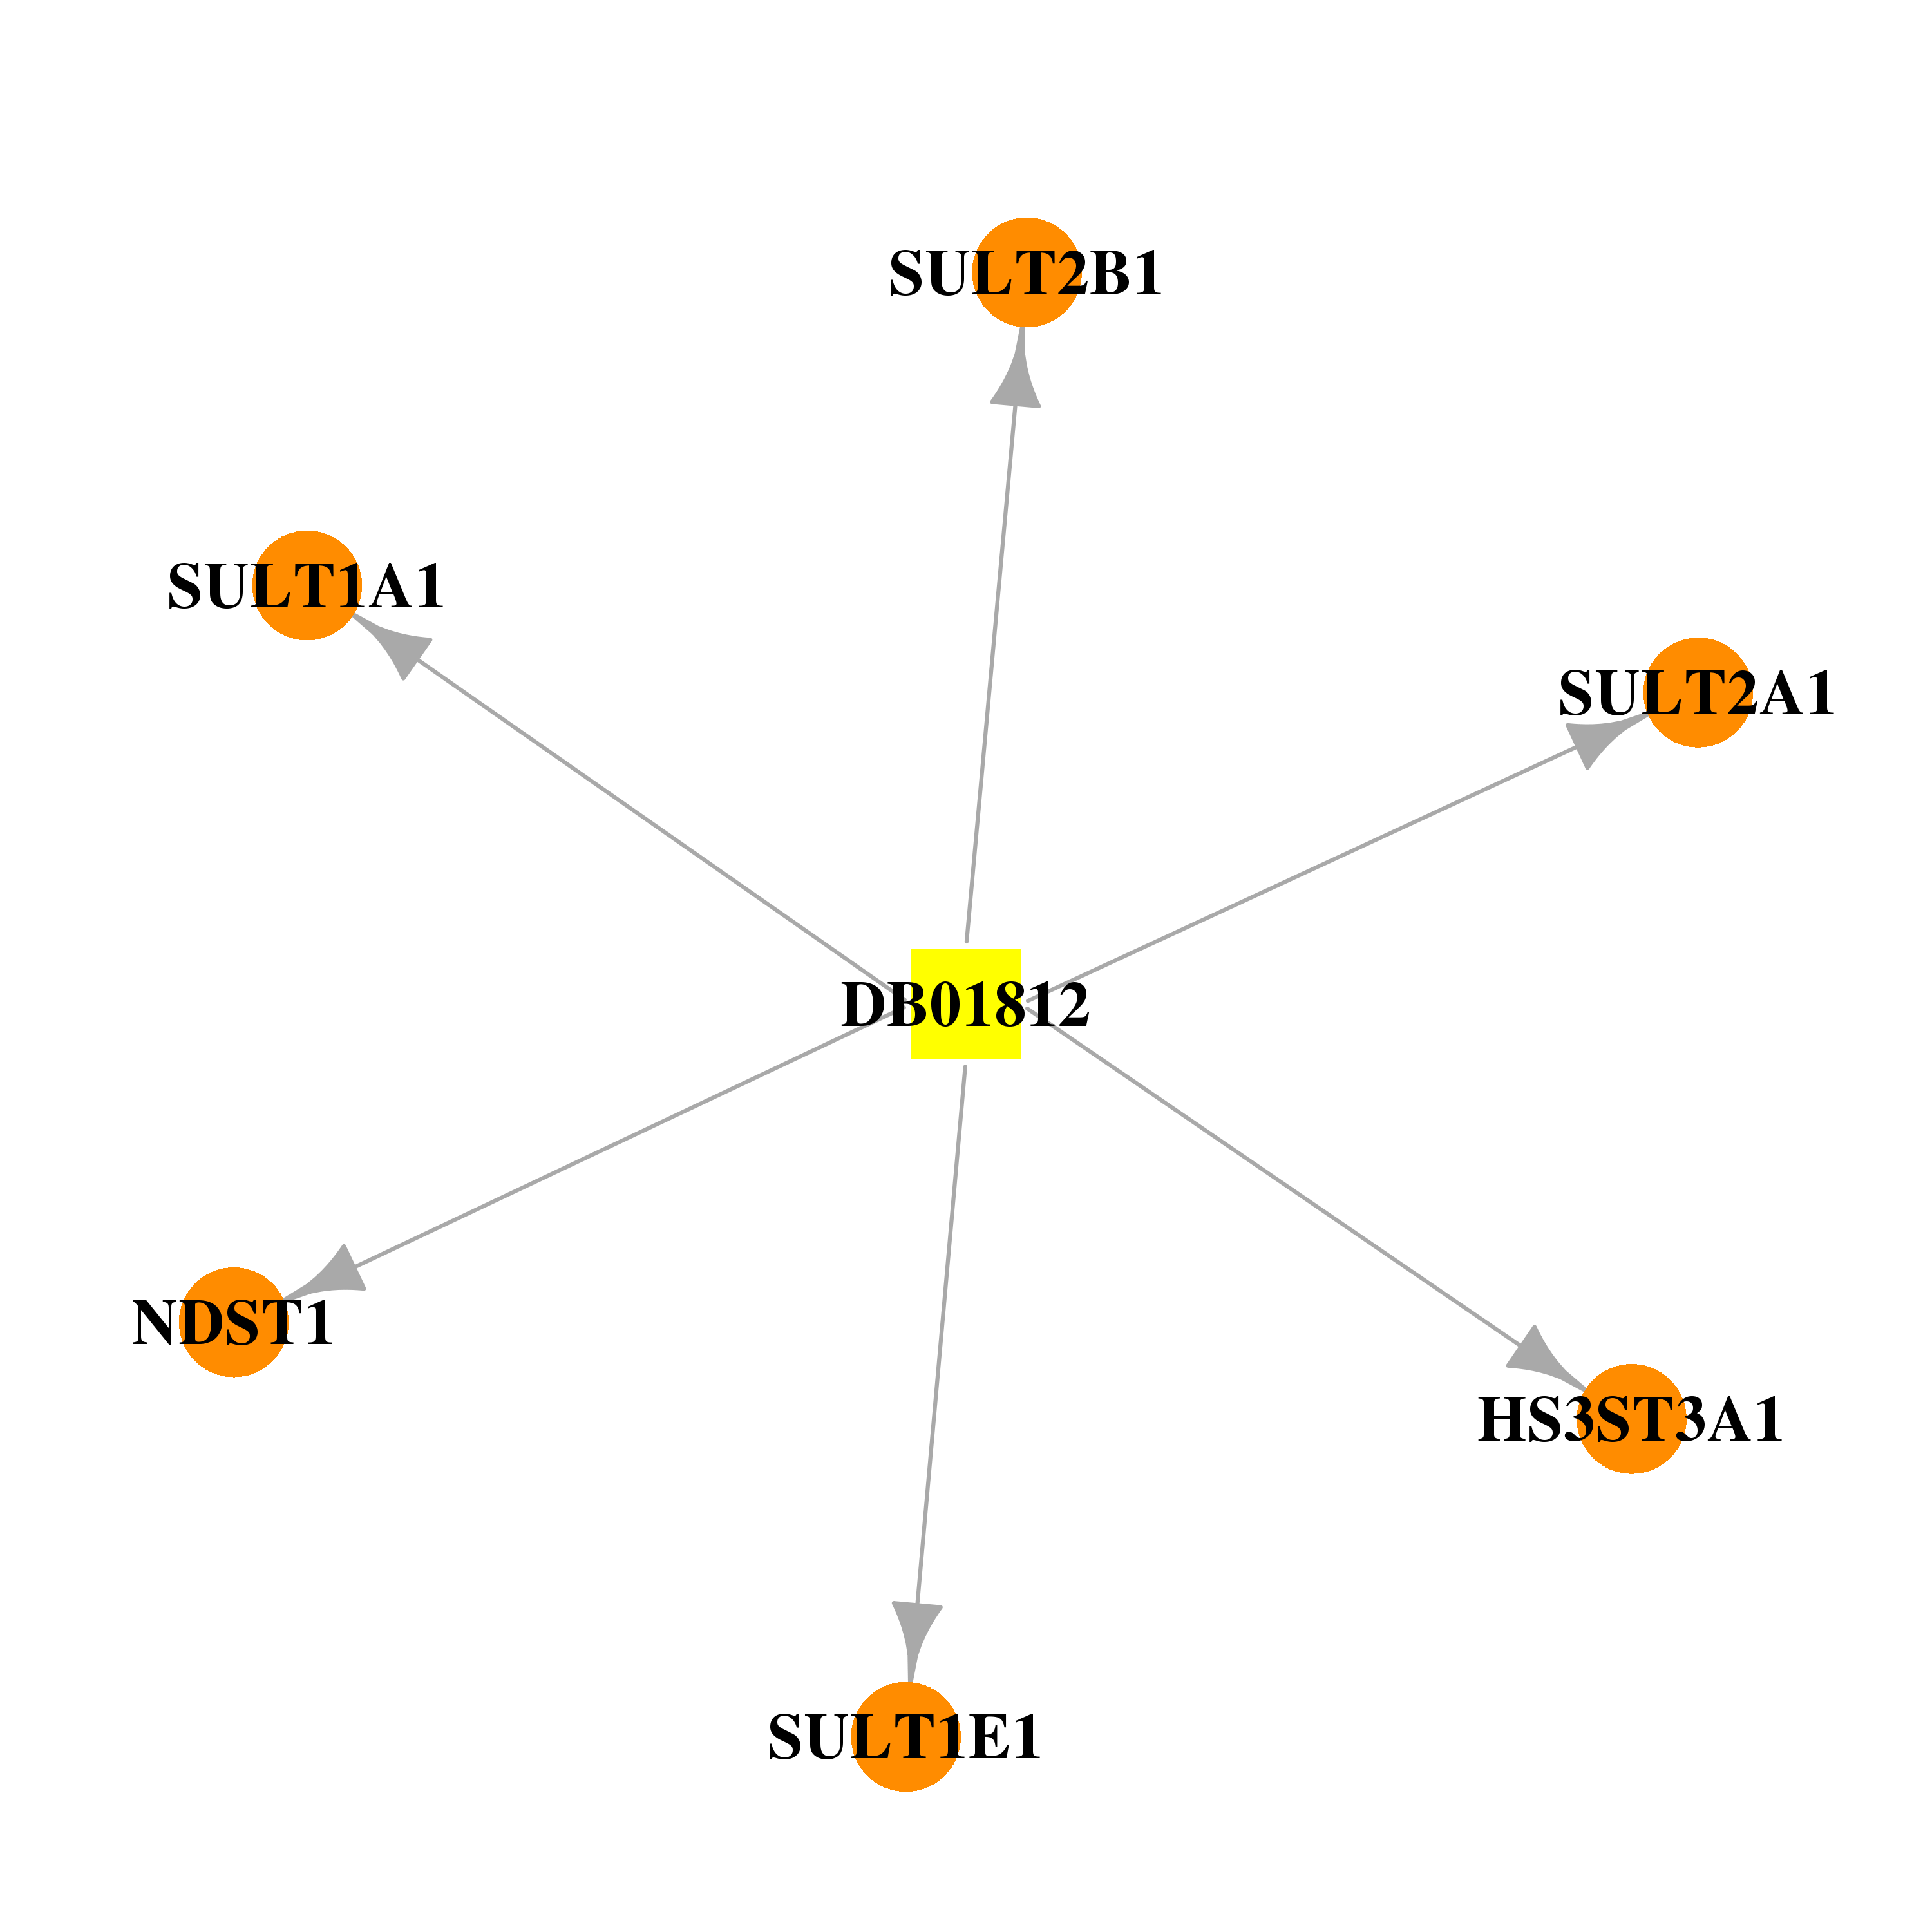 | 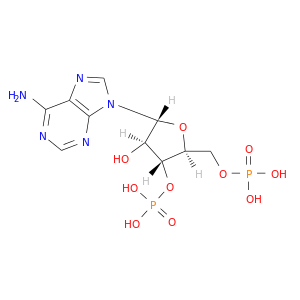 |
| Top |
| Cross referenced IDs for NDST1 |
| * We obtained these cross-references from Uniprot database. It covers 150 different DBs, 18 categories. http://www.uniprot.org/help/cross_references_section |
: Open all cross reference information
|
Copyright © 2016-Present - The Univsersity of Texas Health Science Center at Houston @ |