|
||||||||||||||||||||||||||||||||||||||||||||||||||||||||||||||||||||||||||||||||||||||||||||||||||||||||||||||||||||||||||||||||||||||||||||||||||||||||||||||||||||||||||||||||||||||||||||||||||||||||||||||||||||||||||||||||||||||||||||||||||||||||||||||||||||||||||||||||||||||||||||||||||||||||||||||||||||||||||
| |
| Phenotypic Information (metabolism pathway, cancer, disease, phenome) |
| |
| |
| Gene-Gene Network Information: Co-Expression Network, Interacting Genes & KEGG |
| |
|


| Gene Summary for KCNB1 |
| Basic gene info. | Gene symbol | KCNB1 |
| Gene name | potassium voltage-gated channel, Shab-related subfamily, member 1 | |
| Synonyms | DRK1|EIEE26|KV2.1|h-DRK1 | |
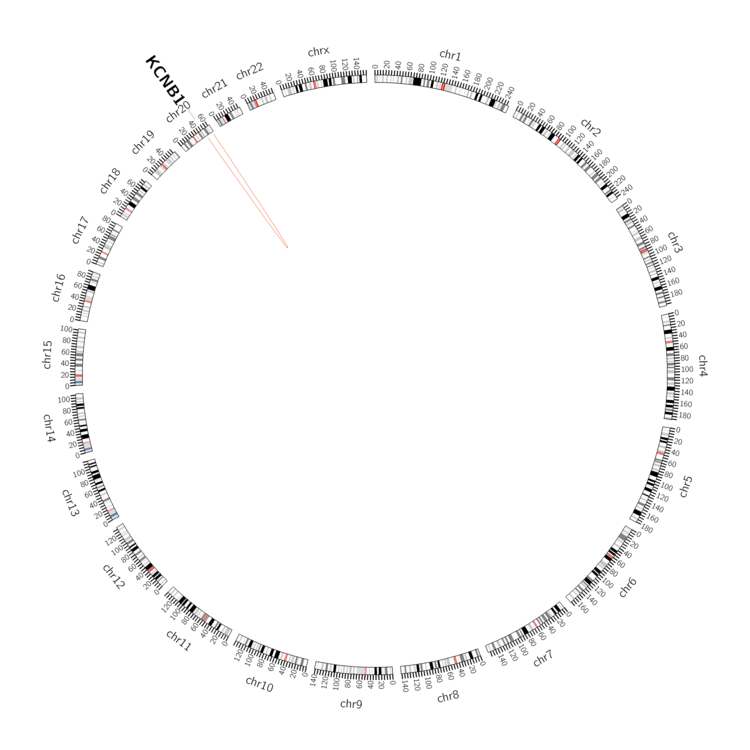
| Cytomap | UCSC genome browser: 20q13.2 | |
| Genomic location | chr20 :47988504-48099181 | |
| Type of gene | protein-coding | |
| RefGenes | NM_004975.2, | |
| Ensembl id | ENSG00000158445 | |
| Description | delayed rectifier potassium channel 1delayed rectifier potassium channel Kv2.1h-DRK1 K(+) channelpotassium channel protein DRK1potassium voltage-gated channel subfamily B member 1voltage-gated potassium channel subunit Kv2.1 | |
| Modification date | 20141222 | |
| dbXrefs | MIM : 600397 | |
| HGNC : HGNC | ||
| HPRD : 08983 | ||
| Protein | UniProt: go to UniProt's Cross Reference DB Table | |
| Expression | CleanEX: HS_KCNB1 | |
| BioGPS: 3745 | ||
| Gene Expression Atlas: ENSG00000158445 | ||
| The Human Protein Atlas: ENSG00000158445 | ||
| Pathway | NCI Pathway Interaction Database: KCNB1 | |
| KEGG: KCNB1 | ||
| REACTOME: KCNB1 | ||
| ConsensusPathDB | ||
| Pathway Commons: KCNB1 | ||
| Metabolism | MetaCyc: KCNB1 | |
| HUMANCyc: KCNB1 | ||
| Regulation | Ensembl's Regulation: ENSG00000158445 | |
| miRBase: chr20 :47,988,504-48,099,181 | ||
| TargetScan: NM_004975 | ||
| cisRED: ENSG00000158445 | ||
| Context | iHOP: KCNB1 | |
| cancer metabolism search in PubMed: KCNB1 | ||
| UCL Cancer Institute: KCNB1 | ||
| Assigned class in ccmGDB | C | |
| Top |
| Phenotypic Information for KCNB1(metabolism pathway, cancer, disease, phenome) |
| Cancer | CGAP: KCNB1 |
| Familial Cancer Database: KCNB1 | |
| * This gene is included in those cancer gene databases. |
|
|
|
|
|
| . | ||||||||||||||||||||||||||||||||||||||||||||||||||||||||||||||||||||||||||||||||||||||||||||||||||||||||||||||||||||||||||||||||||||||||||||||||||||||||||||||||||||||||||||||||||||||||||||||||||||||||||||||||||||||||||||||||||||||||||||||||||||||||||||||||||||||||||||||||||||||||||||||||||||||||||||||||||||
Oncogene 1 | Significant driver gene in | |||||||||||||||||||||||||||||||||||||||||||||||||||||||||||||||||||||||||||||||||||||||||||||||||||||||||||||||||||||||||||||||||||||||||||||||||||||||||||||||||||||||||||||||||||||||||||||||||||||||||||||||||||||||||||||||||||||||||||||||||||||||||||||||||||||||||||||||||||||||||||||||||||||||||||||||||||||||||
| cf) number; DB name 1 Oncogene; http://nar.oxfordjournals.org/content/35/suppl_1/D721.long, 2 Tumor Suppressor gene; https://bioinfo.uth.edu/TSGene/, 3 Cancer Gene Census; http://www.nature.com/nrc/journal/v4/n3/abs/nrc1299.html, 4 CancerGenes; http://nar.oxfordjournals.org/content/35/suppl_1/D721.long, 5 Network of Cancer Gene; http://ncg.kcl.ac.uk/index.php, 1Therapeutic Vulnerabilities in Cancer; http://cbio.mskcc.org/cancergenomics/statius/ |
| REACTOME_INTEGRATION_OF_ENERGY_METABOLISM | |
| OMIM | |
| Orphanet | |
| Disease | KEGG Disease: KCNB1 |
| MedGen: KCNB1 (Human Medical Genetics with Condition) | |
| ClinVar: KCNB1 | |
| Phenotype | MGI: KCNB1 (International Mouse Phenotyping Consortium) |
| PhenomicDB: KCNB1 | |
| Mutations for KCNB1 |
| * Under tables are showing count per each tissue to give us broad intuition about tissue specific mutation patterns.You can go to the detailed page for each mutation database's web site. |
| - Statistics for Tissue and Mutation type | Top |
 |
| - For Inter-chromosomal Variations |
| There's no inter-chromosomal structural variation. |
| - For Intra-chromosomal Variations |
| * Intra-chromosomal variantions includes 'intrachromosomal amplicon to amplicon', 'intrachromosomal amplicon to non-amplified dna', 'intrachromosomal deletion', 'intrachromosomal fold-back inversion', 'intrachromosomal inversion', 'intrachromosomal tandem duplication', 'Intrachromosomal unknown type', 'intrachromosomal with inverted orientation', 'intrachromosomal with non-inverted orientation'. |
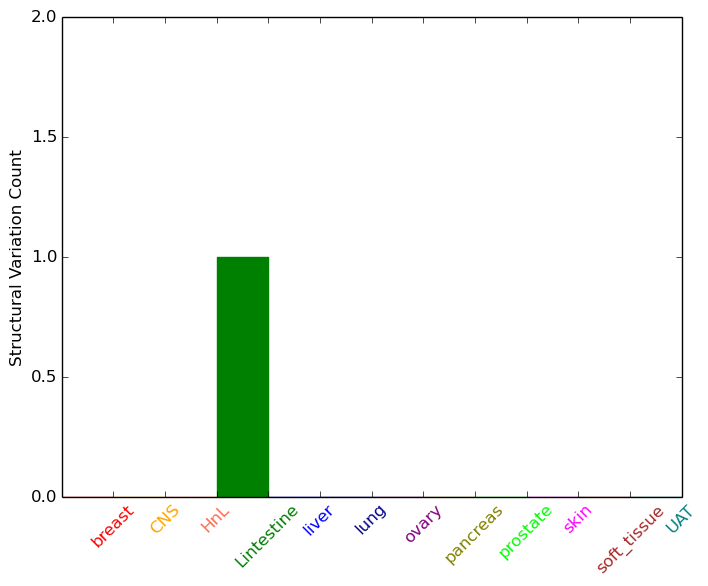 |
| Sample | Symbol_a | Chr_a | Start_a | End_a | Symbol_b | Chr_b | Start_b | End_b |
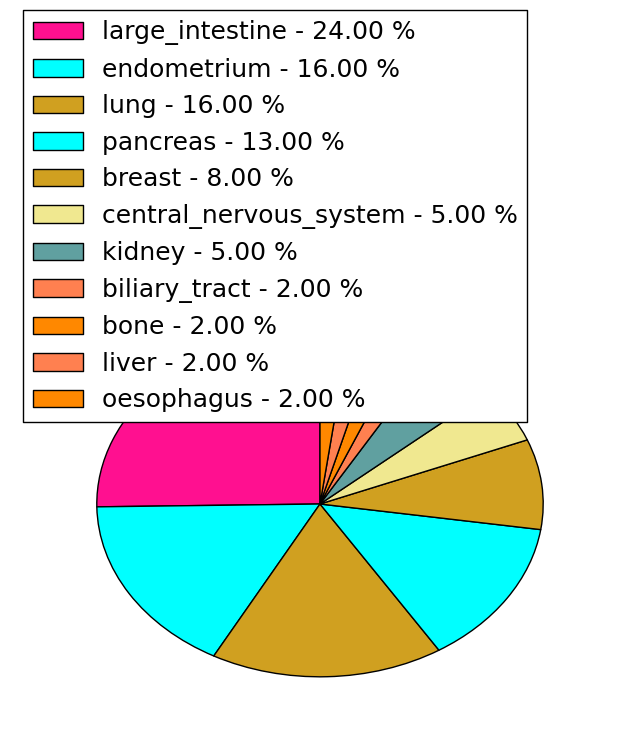
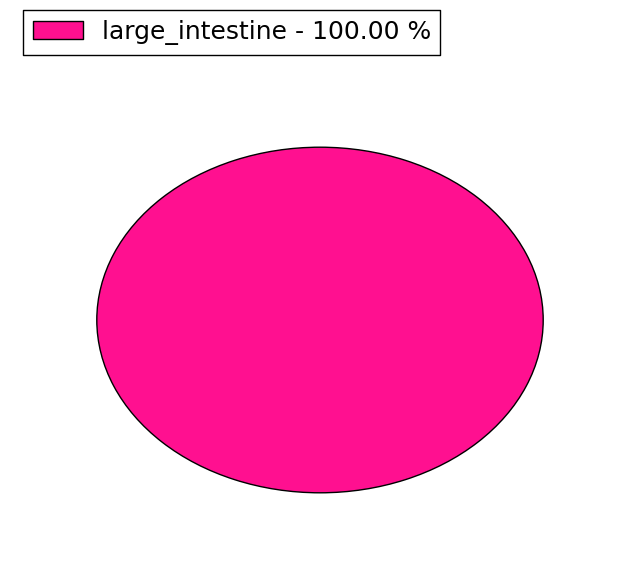
| large_intestine | KCNB1 | chr20 | 48073603 | 48073603 | chr20 | 60802837 | 60802837 |
| cf) Tissue number; Tissue name (1;Breast, 2;Central_nervous_system, 3;Haematopoietic_and_lymphoid_tissue, 4;Large_intestine, 5;Liver, 6;Lung, 7;Ovary, 8;Pancreas, 9;Prostate, 10;Skin, 11;Soft_tissue, 12;Upper_aerodigestive_tract) |
| * From mRNA Sanger sequences, Chitars2.0 arranged chimeric transcripts. This table shows KCNB1 related fusion information. |
| ID | Head Gene | Tail Gene | Accession | Gene_a | qStart_a | qEnd_a | Chromosome_a | tStart_a | tEnd_a | Gene_a | qStart_a | qEnd_a | Chromosome_a | tStart_a | tEnd_a |
| Top |
| Mutation type/ Tissue ID | brca | cns | cerv | endome | haematopo | kidn | Lintest | liver | lung | ns | ovary | pancre | prost | skin | stoma | thyro | urina | |||
| Total # sample | 4 | 2 | 1 | |||||||||||||||||
| GAIN (# sample) | 4 | 1 | 1 | |||||||||||||||||
| LOSS (# sample) | 1 |
| cf) Tissue ID; Tissue type (1; Breast, 2; Central_nervous_system, 3; Cervix, 4; Endometrium, 5; Haematopoietic_and_lymphoid_tissue, 6; Kidney, 7; Large_intestine, 8; Liver, 9; Lung, 10; NS, 11; Ovary, 12; Pancreas, 13; Prostate, 14; Skin, 15; Stomach, 16; Thyroid, 17; Urinary_tract) |
| Top |
|
 |
| Top |
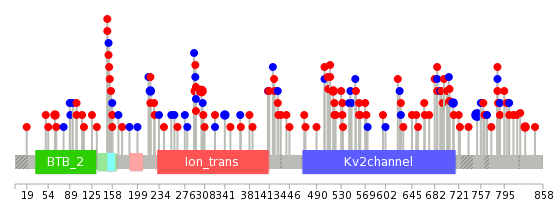
| Stat. for Non-Synonymous SNVs (# total SNVs=108) | (# total SNVs=37) |
 |  |
(# total SNVs=0) | (# total SNVs=3) |
 |
| Top |
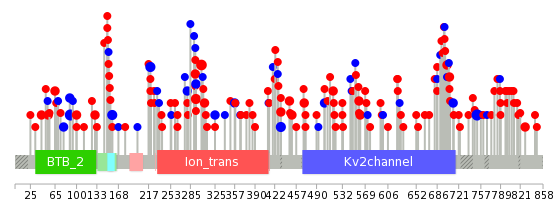
| * When you move the cursor on each content, you can see more deailed mutation information on the Tooltip. Those are primary_site,primary_histology,mutation(aa),pubmedID. |
| GRCh37 position | Mutation(aa) | Unique sampleID count |
| chr20:47989844-47989844 | p.G751G | 5 |
| chr20:47990803-47990803 | p.R432W | 5 |
| chr20:48098748-48098748 | p.G90G | 5 |
| chr20:47991437-47991437 | p.F220F | 4 |
| chr20:47991189-47991189 | p.R303Q | 4 |
| chr20:47991216-47991216 | p.R294H | 3 |
| chr20:47989612-47989612 | p.E829K | 3 |
| chr20:47989981-47989981 | p.A706T | 3 |
| chr20:47991332-47991332 | p.W255* | 3 |
| chr20:47991220-47991220 | p.R293C | 3 |
| Top |
|
 |
| Point Mutation/ Tissue ID | 1 | 2 | 3 | 4 | 5 | 6 | 7 | 8 | 9 | 10 | 11 | 12 | 13 | 14 | 15 | 16 | 17 | 18 | 19 | 20 |
| # sample | 5 | 5 | 1 | 24 | 4 | 5 | 2 | 1 | 24 | 1 | 1 | 4 | 37 | 12 | 10 | |||||
| # mutation | 5 | 5 | 1 | 26 | 4 | 5 | 2 | 1 | 30 | 1 | 1 | 4 | 45 | 14 | 15 | |||||
| nonsynonymous SNV | 3 | 4 | 1 | 19 | 2 | 3 | 1 | 21 | 1 | 1 | 3 | 30 | 9 | 10 | ||||||
| synonymous SNV | 2 | 1 | 7 | 2 | 2 | 1 | 1 | 9 | 1 | 15 | 5 | 5 |
| cf) Tissue ID; Tissue type (1; BLCA[Bladder Urothelial Carcinoma], 2; BRCA[Breast invasive carcinoma], 3; CESC[Cervical squamous cell carcinoma and endocervical adenocarcinoma], 4; COAD[Colon adenocarcinoma], 5; GBM[Glioblastoma multiforme], 6; Glioma Low Grade, 7; HNSC[Head and Neck squamous cell carcinoma], 8; KICH[Kidney Chromophobe], 9; KIRC[Kidney renal clear cell carcinoma], 10; KIRP[Kidney renal papillary cell carcinoma], 11; LAML[Acute Myeloid Leukemia], 12; LUAD[Lung adenocarcinoma], 13; LUSC[Lung squamous cell carcinoma], 14; OV[Ovarian serous cystadenocarcinoma ], 15; PAAD[Pancreatic adenocarcinoma], 16; PRAD[Prostate adenocarcinoma], 17; SKCM[Skin Cutaneous Melanoma], 18:STAD[Stomach adenocarcinoma], 19:THCA[Thyroid carcinoma], 20:UCEC[Uterine Corpus Endometrial Carcinoma]) |
| Top |
| * We represented just top 10 SNVs. When you move the cursor on each content, you can see more deailed mutation information on the Tooltip. Those are primary_site, primary_histology, mutation(aa), pubmedID. |
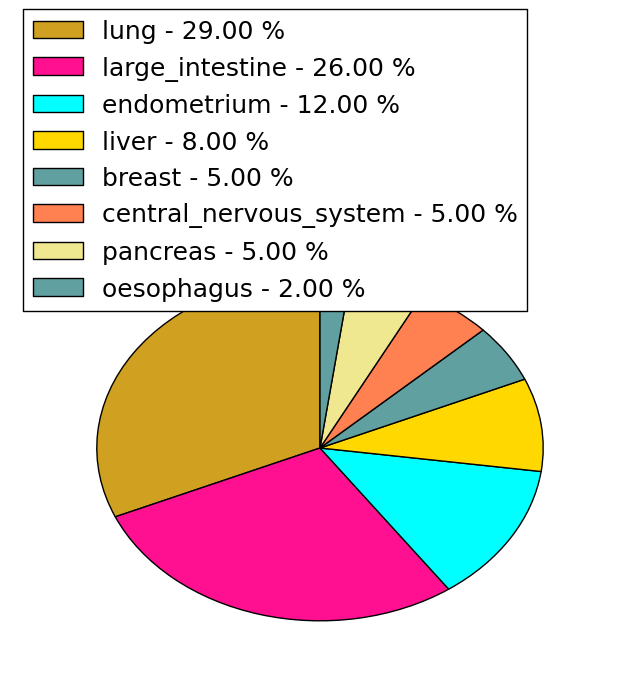
| Genomic Position | Mutation(aa) | Unique sampleID count |
| chr20:47989844 | p.G751G | 7 |
| chr20:47991189 | p.R303Q | 4 |
| chr20:47991437 | p.F220L | 3 |
| chr20:47989612 | p.S517L | 2 |
| chr20:47990547 | p.E829K | 2 |
| chr20:47990218 | p.E559Q | 2 |
| chr20:48098824 | p.R293C | 2 |
| chr20:47989961 | p.T712T | 2 |
| chr20:47989981 | p.A706T | 2 |
| chr20:48098546 | p.R158R | 2 |
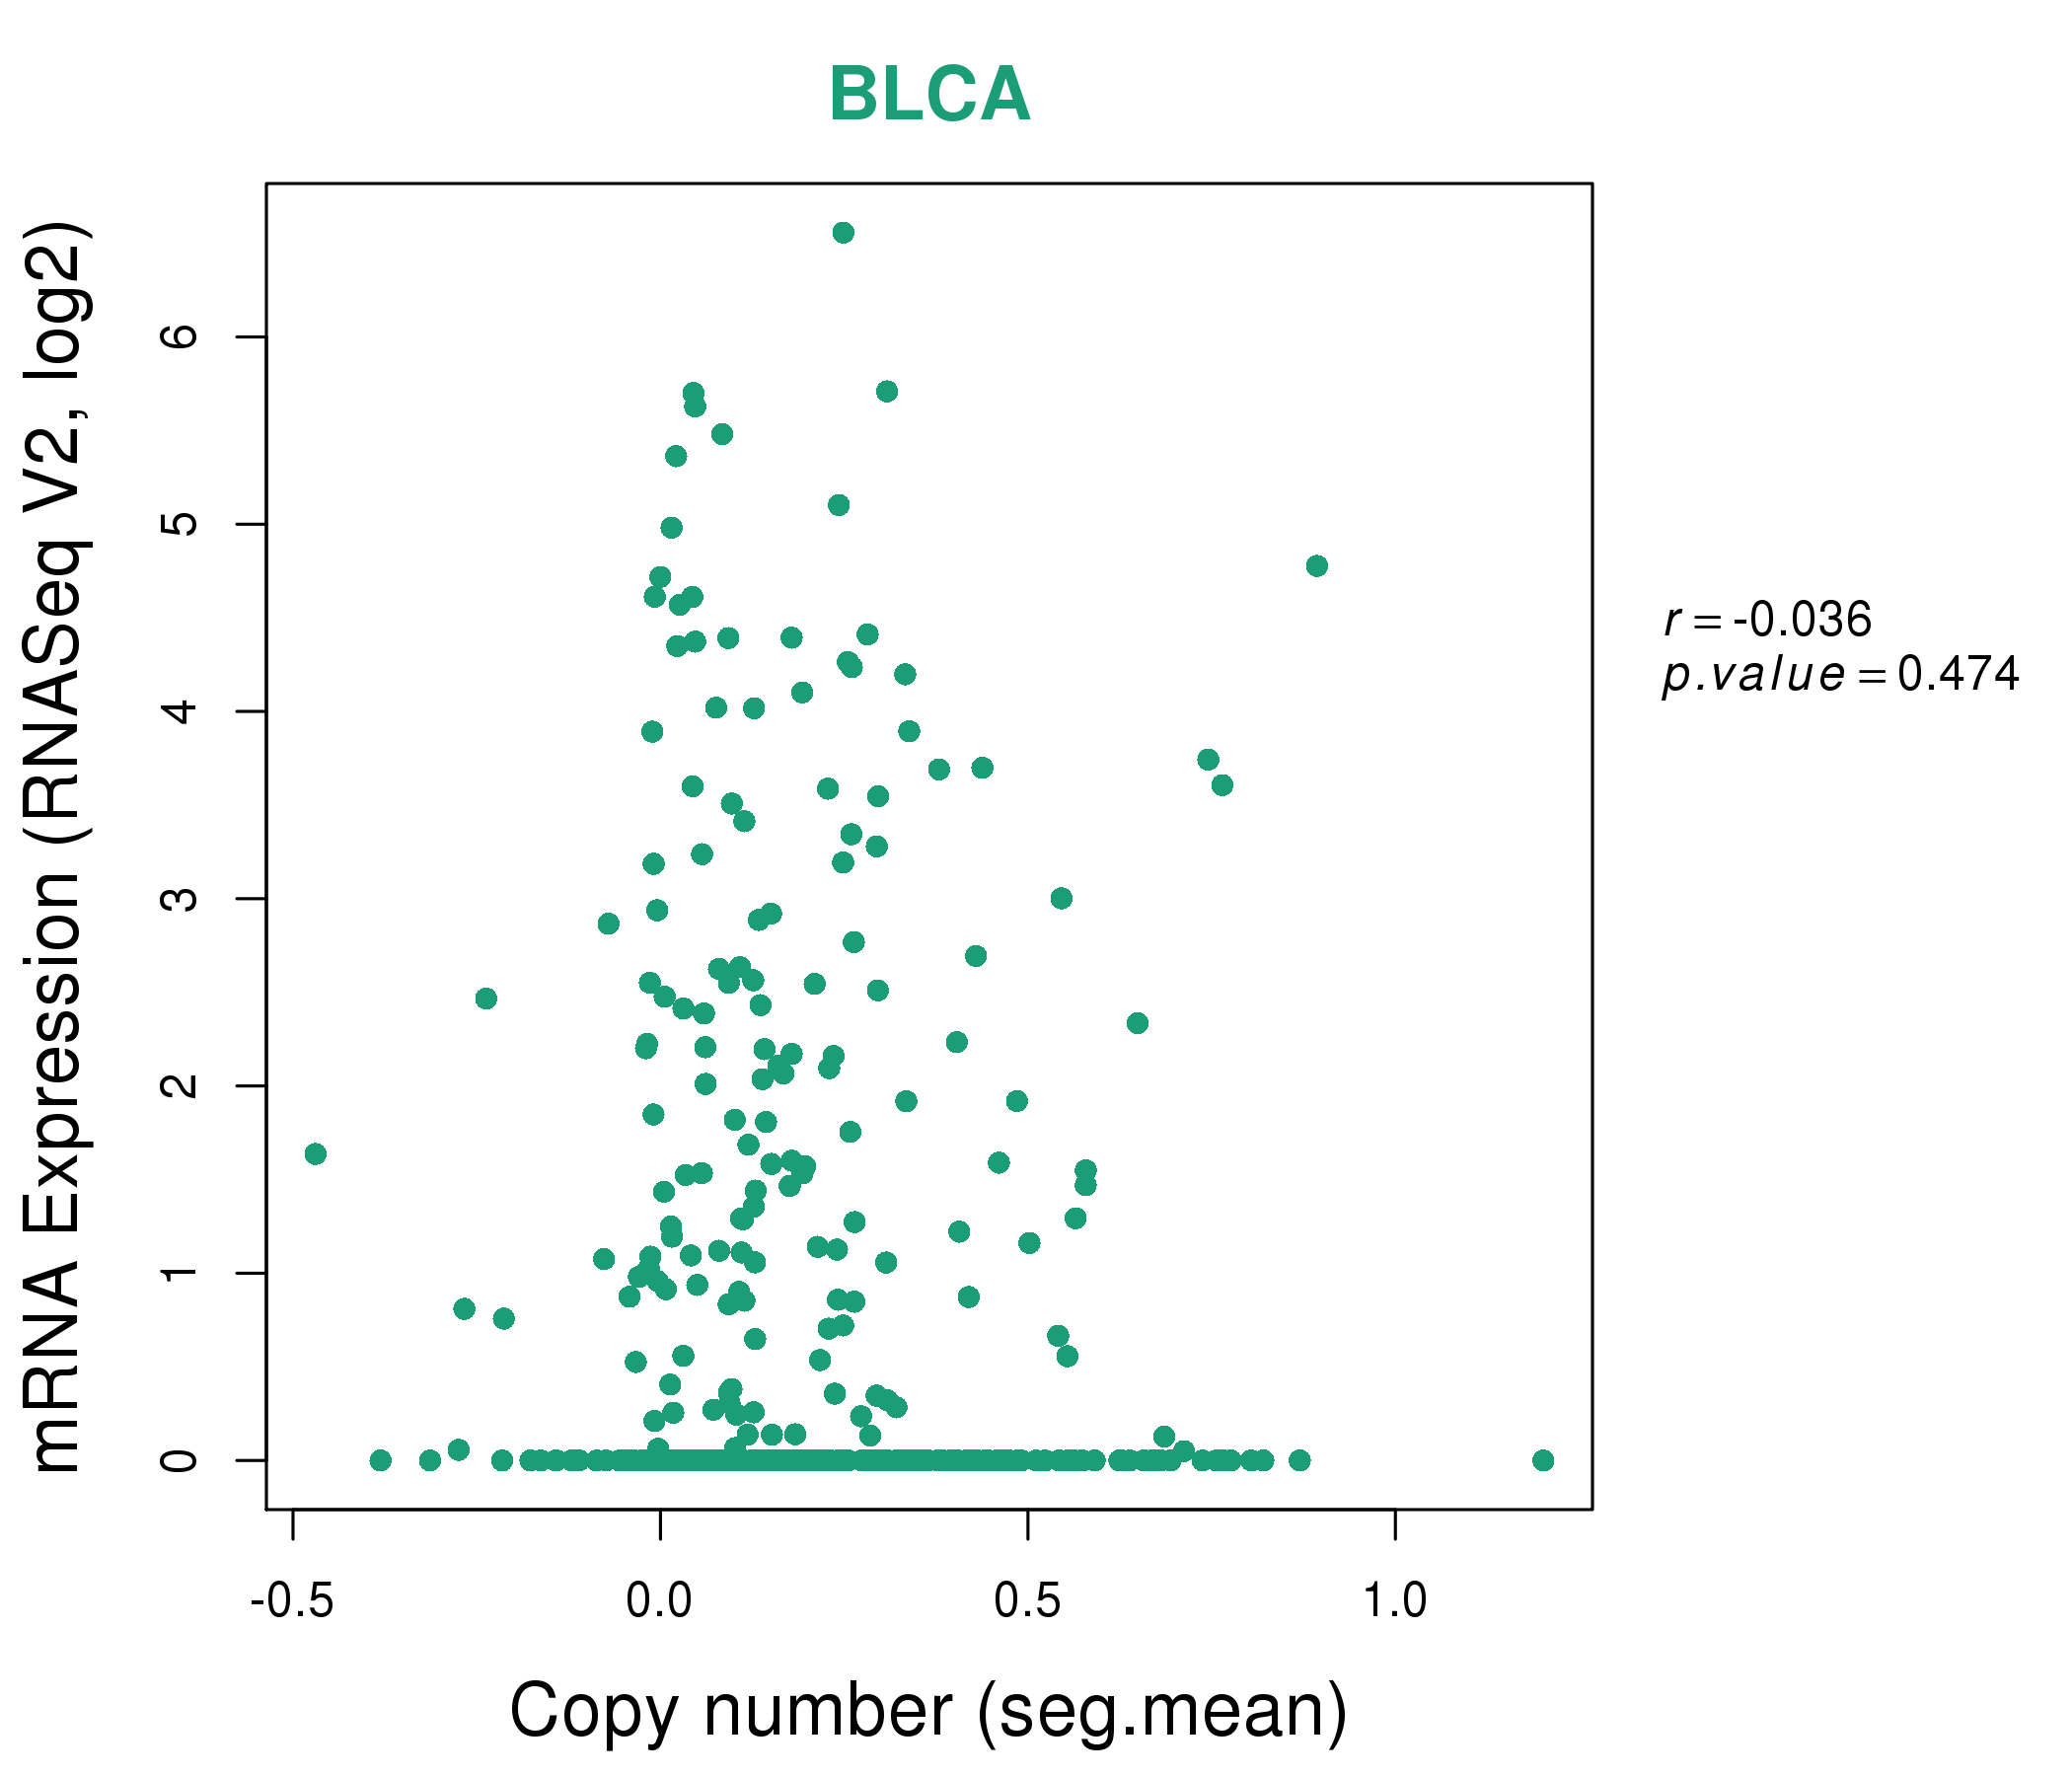
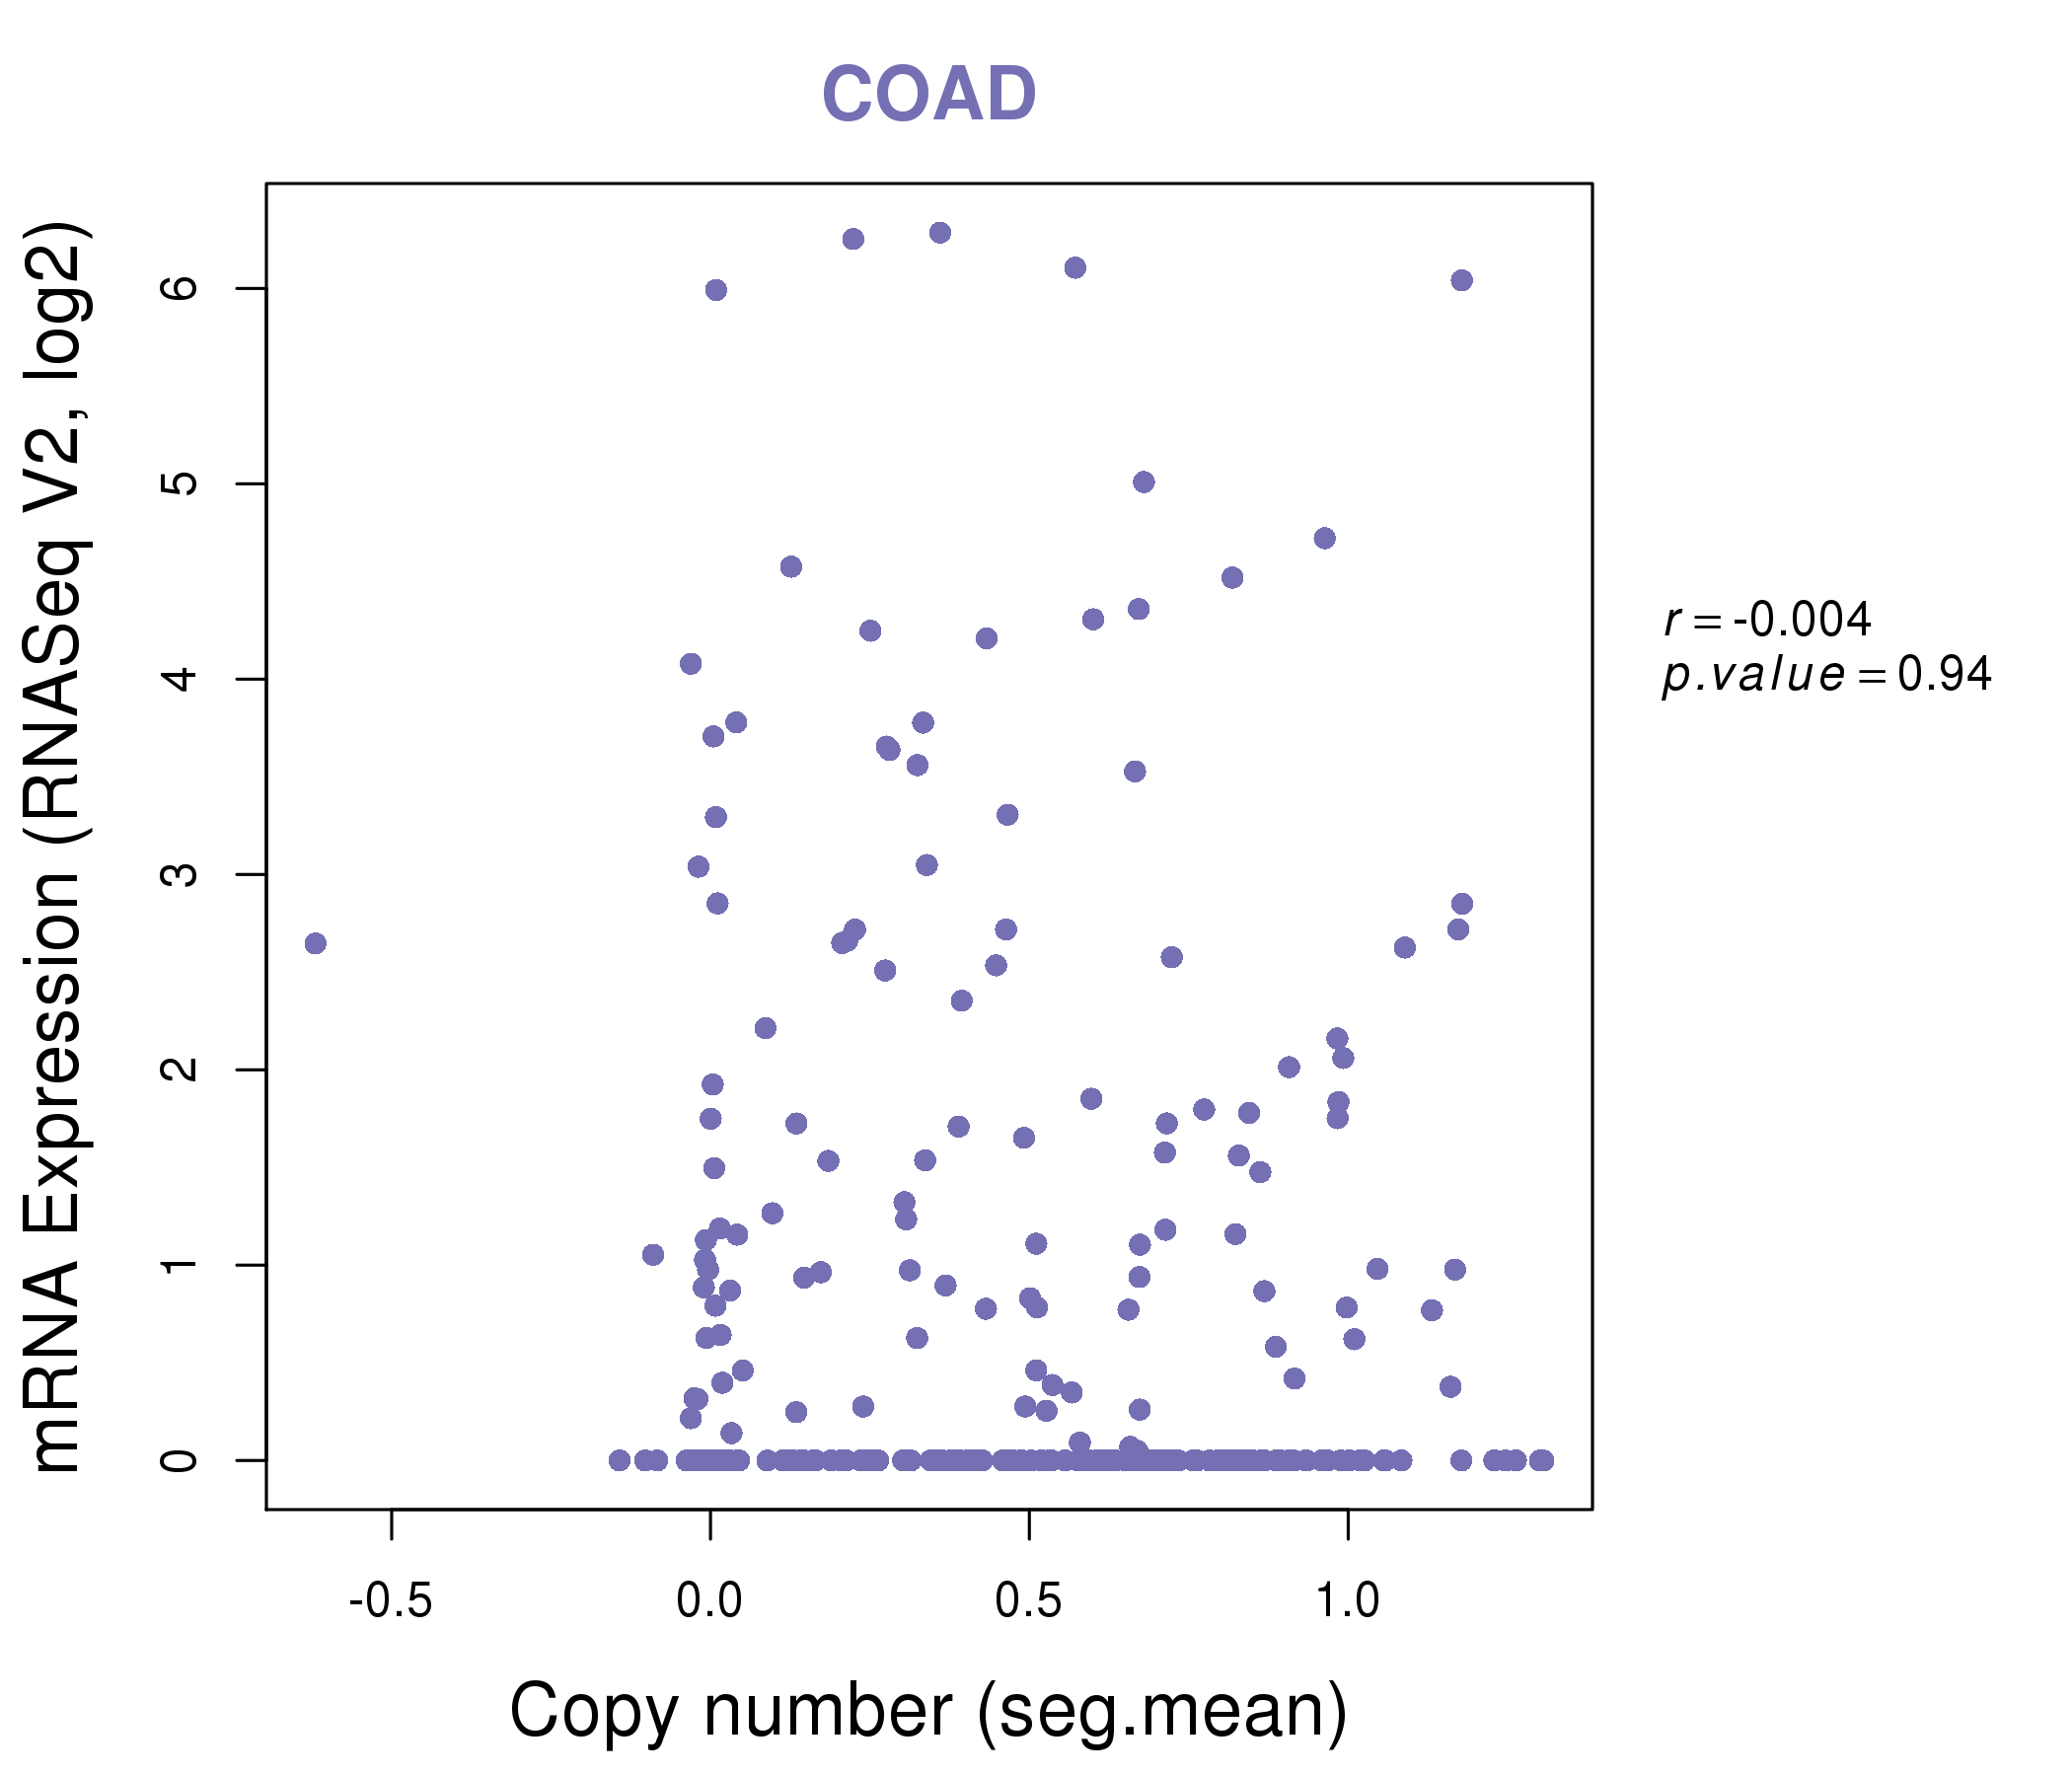
| * Copy number data were extracted from TCGA using R package TCGA-Assembler. The URLs of all public data files on TCGA DCC data server were gathered on Jan-05-2015. Function ProcessCNAData in TCGA-Assembler package was used to obtain gene-level copy number value which is calculated as the average copy number of the genomic region of a gene. |
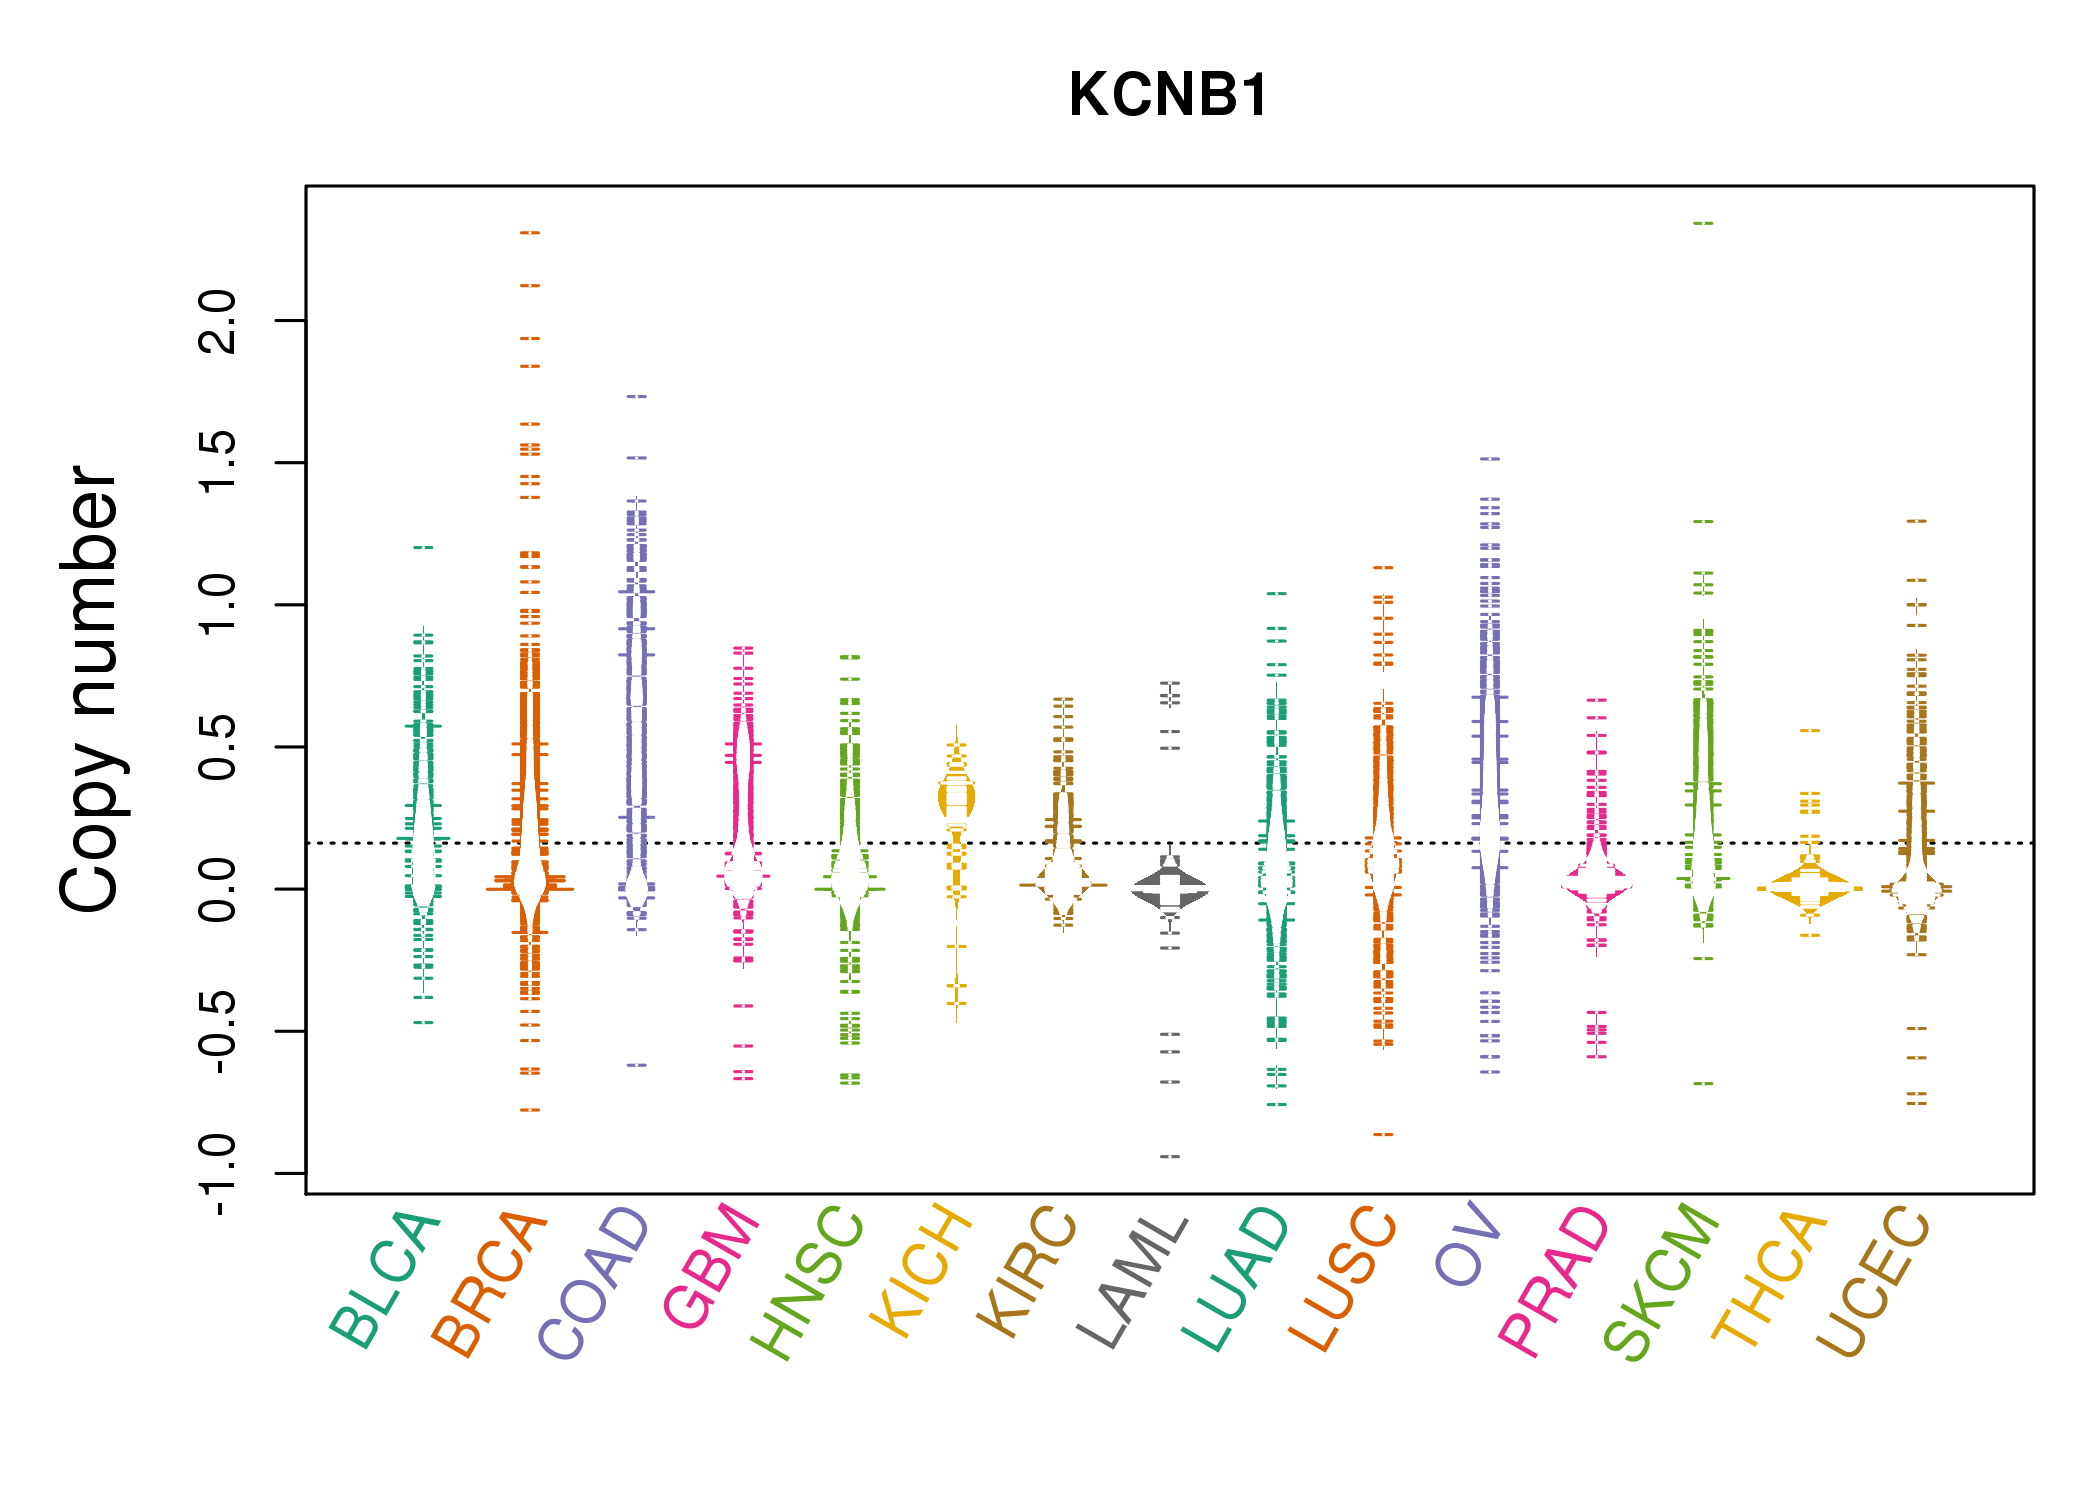 |
| cf) Tissue ID[Tissue type]: BLCA[Bladder Urothelial Carcinoma], BRCA[Breast invasive carcinoma], CESC[Cervical squamous cell carcinoma and endocervical adenocarcinoma], COAD[Colon adenocarcinoma], GBM[Glioblastoma multiforme], Glioma Low Grade, HNSC[Head and Neck squamous cell carcinoma], KICH[Kidney Chromophobe], KIRC[Kidney renal clear cell carcinoma], KIRP[Kidney renal papillary cell carcinoma], LAML[Acute Myeloid Leukemia], LUAD[Lung adenocarcinoma], LUSC[Lung squamous cell carcinoma], OV[Ovarian serous cystadenocarcinoma ], PAAD[Pancreatic adenocarcinoma], PRAD[Prostate adenocarcinoma], SKCM[Skin Cutaneous Melanoma], STAD[Stomach adenocarcinoma], THCA[Thyroid carcinoma], UCEC[Uterine Corpus Endometrial Carcinoma] |
| Top |
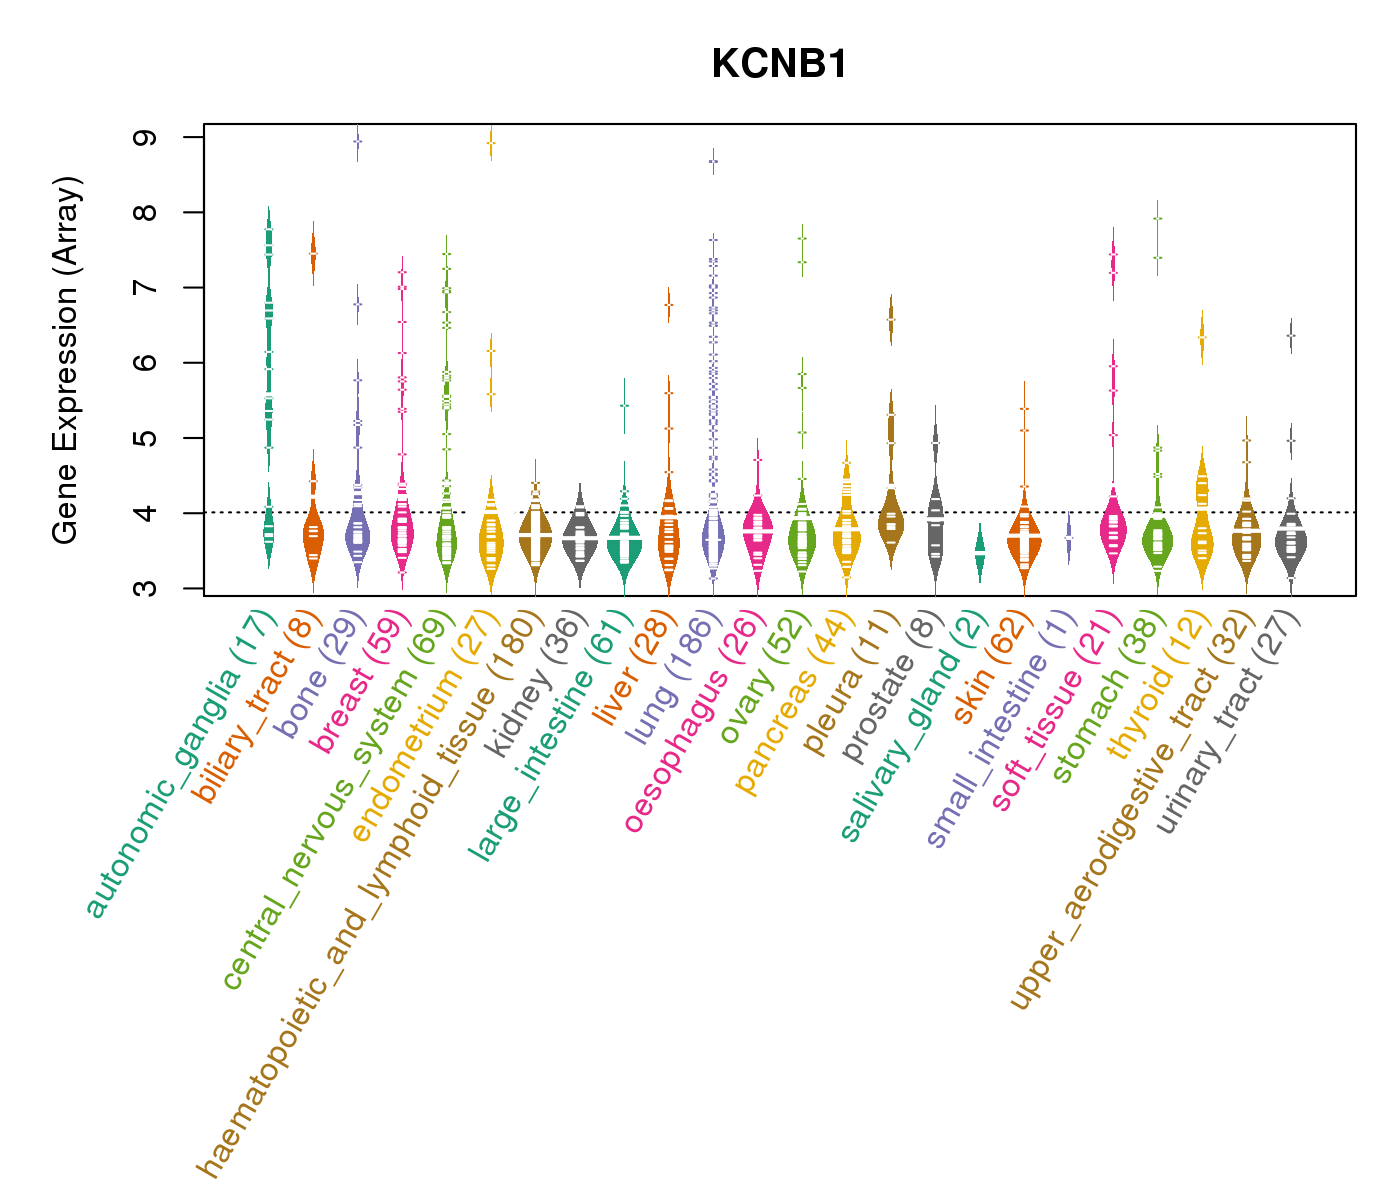
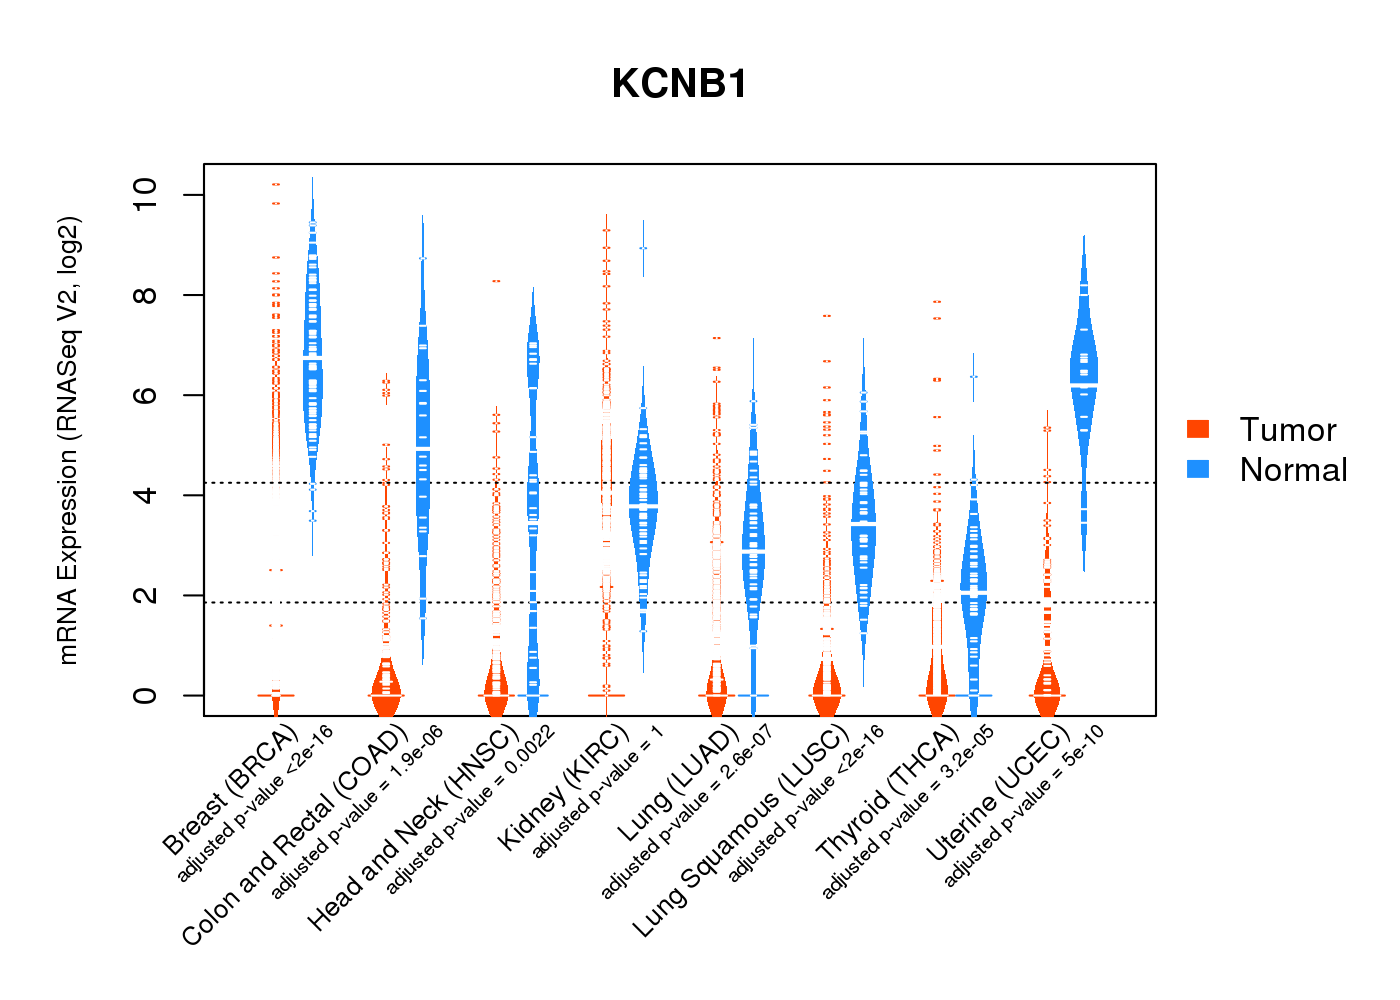
| Gene Expression for KCNB1 |
| * CCLE gene expression data were extracted from CCLE_Expression_Entrez_2012-10-18.res: Gene-centric RMA-normalized mRNA expression data. |
 |
| * Normalized gene expression data of RNASeqV2 was extracted from TCGA using R package TCGA-Assembler. The URLs of all public data files on TCGA DCC data server were gathered at Jan-05-2015. Only eight cancer types have enough normal control samples for differential expression analysis. (t test, adjusted p<0.05 (using Benjamini-Hochberg FDR)) |
 |
| Top |
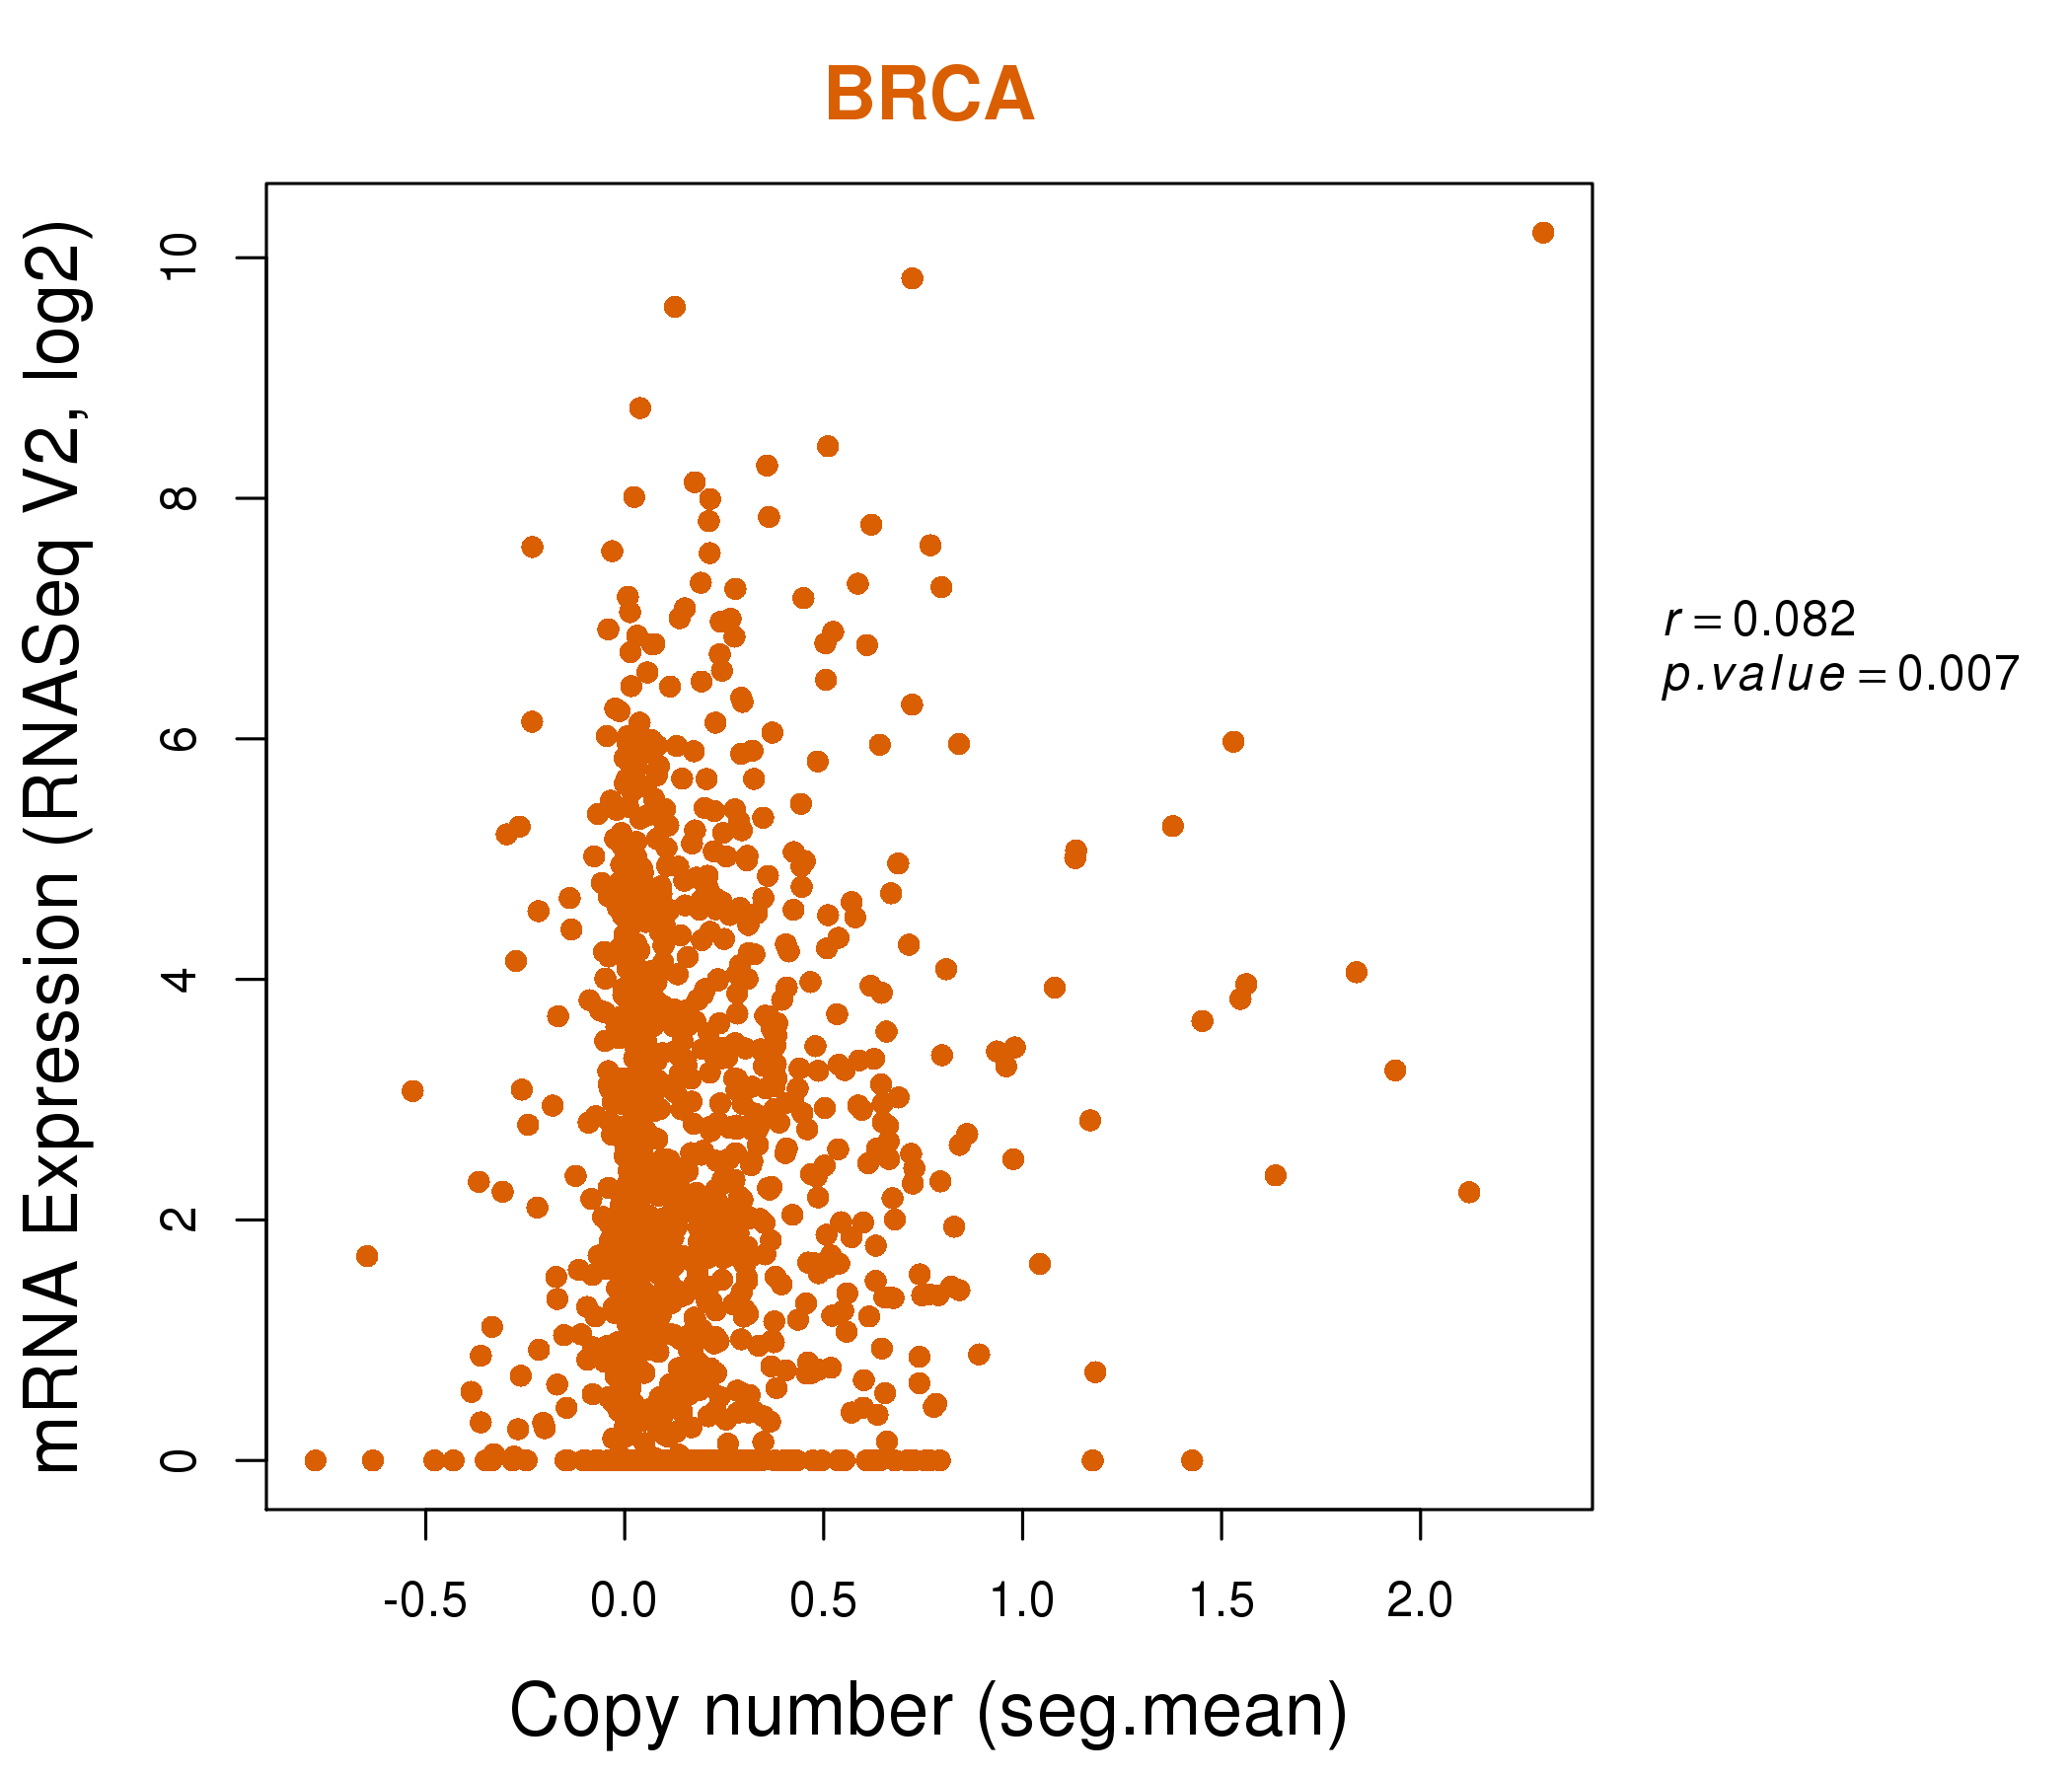
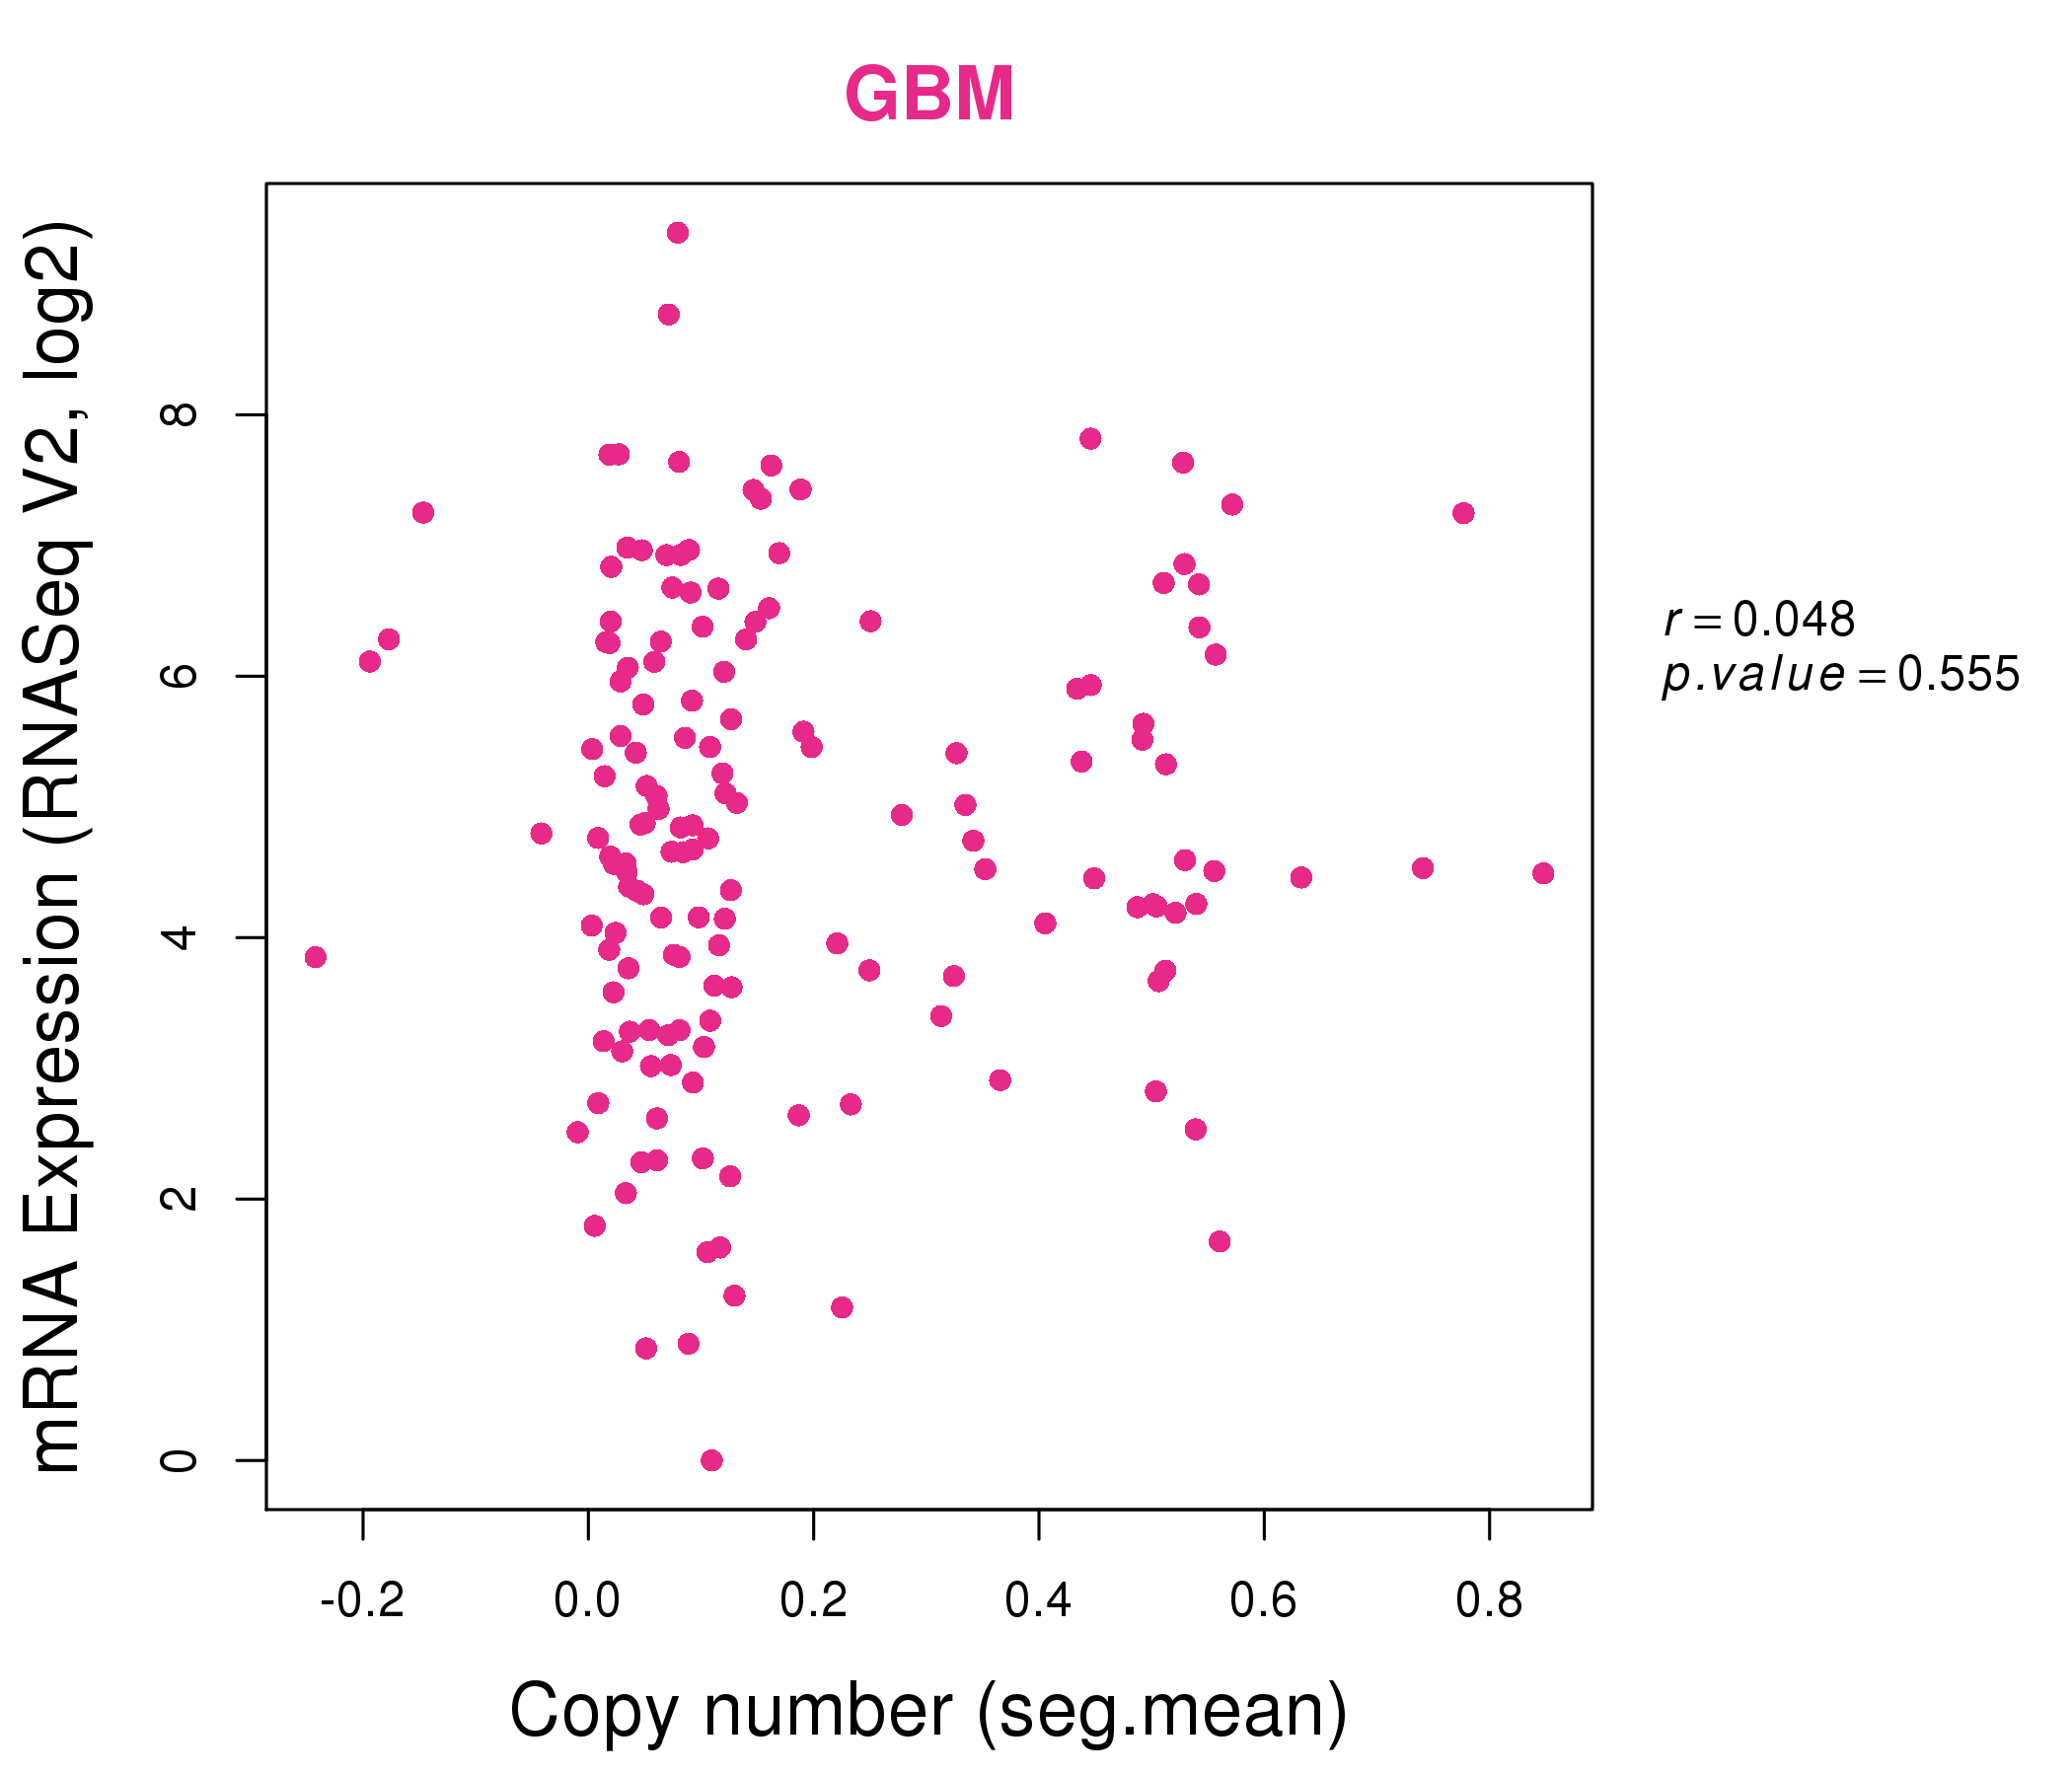
| * This plots show the correlation between CNV and gene expression. |
: Open all plots for all cancer types
 |
|
 |
|
| Top |
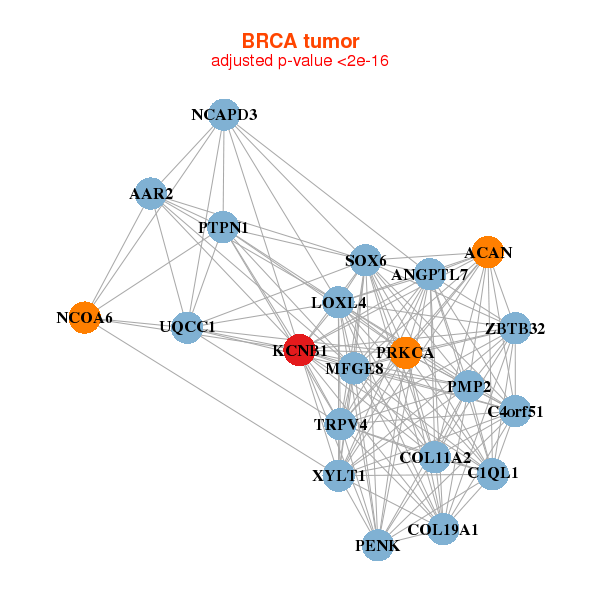
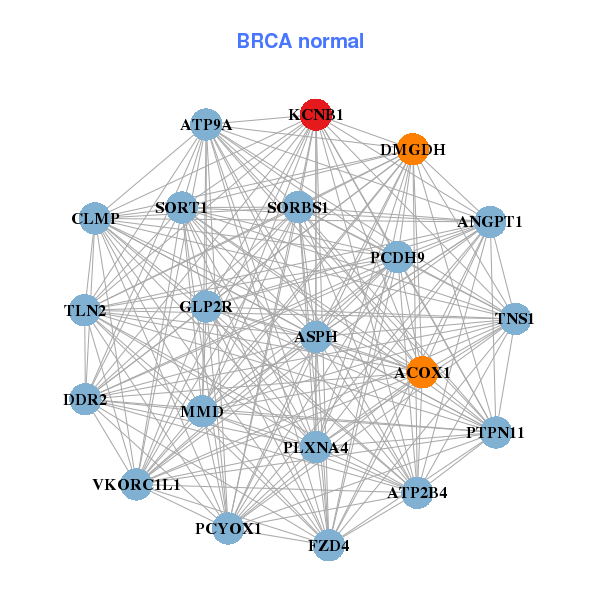
| Gene-Gene Network Information |
| * Co-Expression network figures were drawn using R package igraph. Only the top 20 genes with the highest correlations were shown. Red circle: input gene, orange circle: cell metabolism gene, sky circle: other gene |
: Open all plots for all cancer types
 |
|
| ACAN,ANGPTL7,C1QL1,AAR2,C4orf51,COL11A2,COL19A1, KCNB1,LOXL4,MFGE8,NCAPD3,NCOA6,PENK,PMP2, PRKCA,PTPN1,SOX6,TRPV4,UQCC1,XYLT1,ZBTB32 | ACOX1,ANGPT1,CLMP,ASPH,ATP2B4,ATP9A,DDR2, DMGDH,FZD4,GLP2R,KCNB1,MMD,PCDH9,PCYOX1, PLXNA4,PTPN11,SORBS1,SORT1,TLN2,TNS1,VKORC1L1 |
 |
|
| ANK2,AOC3,ATP1A2,CAND2,CCDC69,CLIP3,FHL1, GNAO1,GRIK5,ITGA7,KCNB1,KCNK3,KIAA0408,KIAA2022, MAP6,MAPK10,NPAS4,PDE2A,PDZRN4,PTH1R,REEP2 | AHNAK2,ATP2B4,CACNA1C,CACNA1H,CPXM2,DMD,FILIP1, FLNA,FRMPD4,GNAO1,KCNB1,KCNH2,MAP1A,MYH11, TENM3___TENM1,PRUNE2,RNF150,SPEG,SVIL,TACR2,TNS1 |

| * Co-Expression network figures were drawn using R package igraph. Only the top 20 genes with the highest correlations were shown. Red circle: input gene, orange circle: cell metabolism gene, sky circle: other gene |
: Open all plots for all cancer types
| Top |
: Open all interacting genes' information including KEGG pathway for all interacting genes from DAVID
| Top |
| Pharmacological Information for KCNB1 |
| There's no related Drug. |
| Top |
| Cross referenced IDs for KCNB1 |
| * We obtained these cross-references from Uniprot database. It covers 150 different DBs, 18 categories. http://www.uniprot.org/help/cross_references_section |
: Open all cross reference information
|
Copyright © 2016-Present - The Univsersity of Texas Health Science Center at Houston @ |